Greencastle, MO Map & Demographics
Greencastle Map
Greencastle Overview
$22,646
PER CAPITA INCOME
$46,875
AVG FAMILY INCOME
$45,714
AVG HOUSEHOLD INCOME
37.9%
WAGE / INCOME GAP [ % ]
62.1¢/ $1
WAGE / INCOME GAP [ $ ]
0.42
INEQUALITY / GINI INDEX
298
TOTAL POPULATION
146
MALE POPULATION
152
FEMALE POPULATION
96.05
MALES / 100 FEMALES
104.11
FEMALES / 100 MALES
51.6
MEDIAN AGE
4.5
AVG FAMILY SIZE
3.1
AVG HOUSEHOLD SIZE
131
LABOR FORCE [ PEOPLE ]
47.5%
PERCENT IN LABOR FORCE
0.8%
UNEMPLOYMENT RATE
Income in Greencastle
Income Overview in Greencastle
Per Capita Income in Greencastle is $22,646, while median incomes of families and households are $46,875 and $45,714 respectively.
| Characteristic | Number | Measure |
| Per Capita Income | 298 | $22,646 |
| Median Family Income | 53 | $46,875 |
| Mean Family Income | 53 | $69,317 |
| Median Household Income | 96 | $45,714 |
| Mean Household Income | 96 | $59,346 |
| Income Deficit | 53 | $0 |
| Wage / Income Gap (%) | 298 | 37.88% |
| Wage / Income Gap ($) | 298 | 62.12¢ per $1 |
| Gini / Inequality Index | 298 | 0.42 |
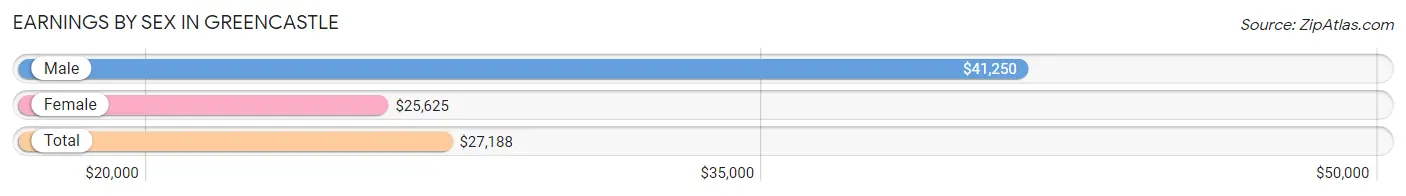
Earnings by Sex in Greencastle
Average Earnings in Greencastle are $27,188, $41,250 for men and $25,625 for women, a difference of 37.9%.
| Sex | Number | Average Earnings |
| Male | 53 (38.4%) | $41,250 |
| Female | 85 (61.6%) | $25,625 |
| Total | 138 (100.0%) | $27,188 |
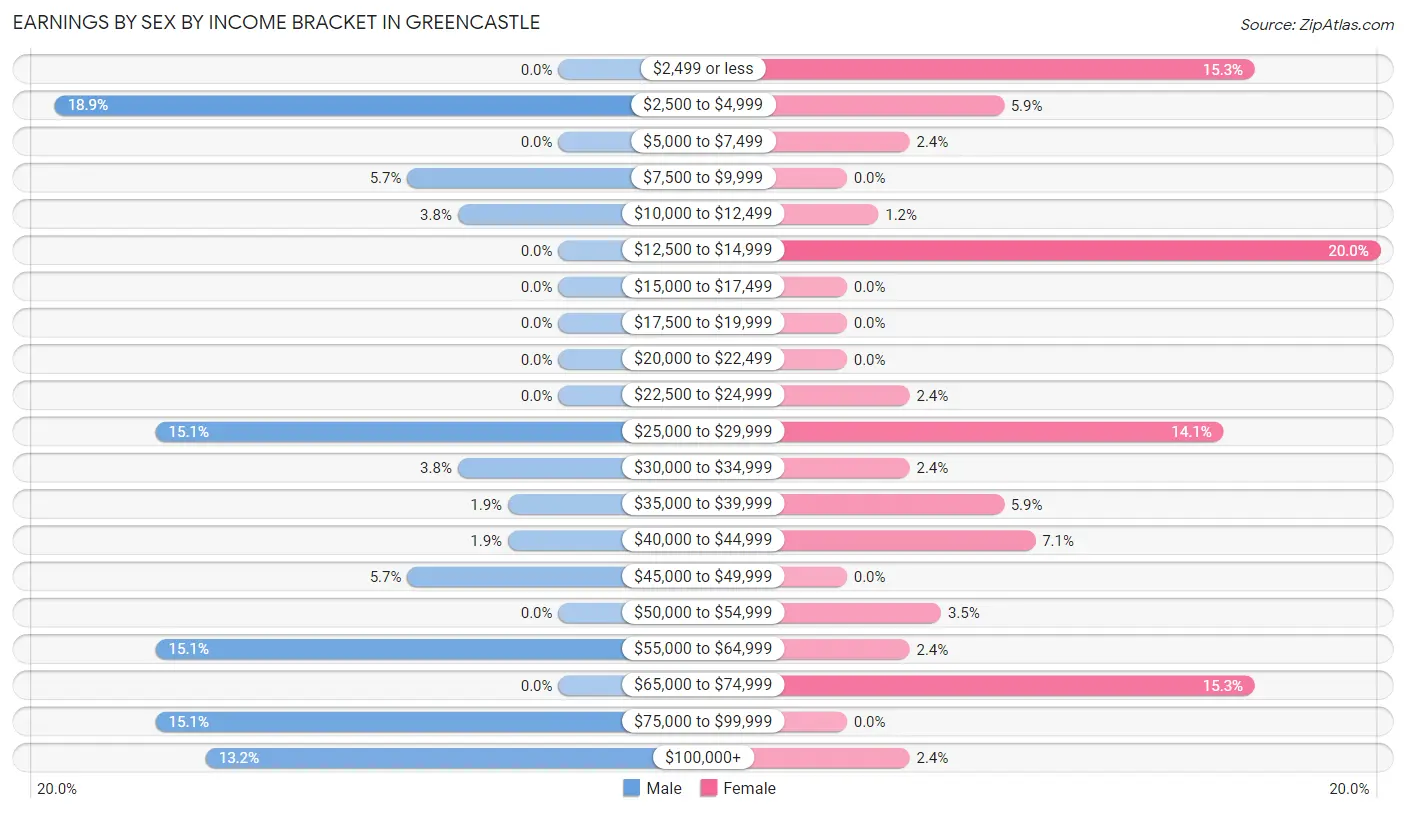
Earnings by Sex by Income Bracket in Greencastle
The most common earnings brackets in Greencastle are $2,500 to $4,999 for men (10 | 18.9%) and $12,500 to $14,999 for women (17 | 20.0%).
| Income | Male | Female |
| $2,499 or less | 0 (0.0%) | 13 (15.3%) |
| $2,500 to $4,999 | 10 (18.9%) | 5 (5.9%) |
| $5,000 to $7,499 | 0 (0.0%) | 2 (2.4%) |
| $7,500 to $9,999 | 3 (5.7%) | 0 (0.0%) |
| $10,000 to $12,499 | 2 (3.8%) | 1 (1.2%) |
| $12,500 to $14,999 | 0 (0.0%) | 17 (20.0%) |
| $15,000 to $17,499 | 0 (0.0%) | 0 (0.0%) |
| $17,500 to $19,999 | 0 (0.0%) | 0 (0.0%) |
| $20,000 to $22,499 | 0 (0.0%) | 0 (0.0%) |
| $22,500 to $24,999 | 0 (0.0%) | 2 (2.4%) |
| $25,000 to $29,999 | 8 (15.1%) | 12 (14.1%) |
| $30,000 to $34,999 | 2 (3.8%) | 2 (2.4%) |
| $35,000 to $39,999 | 1 (1.9%) | 5 (5.9%) |
| $40,000 to $44,999 | 1 (1.9%) | 6 (7.1%) |
| $45,000 to $49,999 | 3 (5.7%) | 0 (0.0%) |
| $50,000 to $54,999 | 0 (0.0%) | 3 (3.5%) |
| $55,000 to $64,999 | 8 (15.1%) | 2 (2.4%) |
| $65,000 to $74,999 | 0 (0.0%) | 13 (15.3%) |
| $75,000 to $99,999 | 8 (15.1%) | 0 (0.0%) |
| $100,000+ | 7 (13.2%) | 2 (2.4%) |
| Total | 53 (100.0%) | 85 (100.0%) |
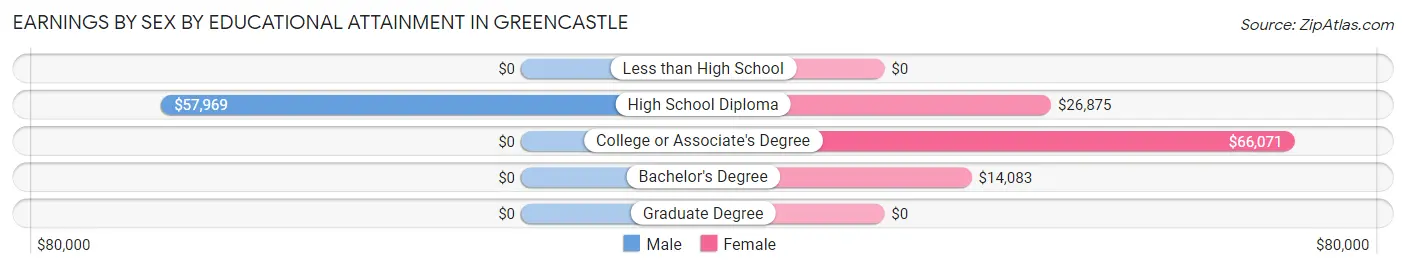
Earnings by Sex by Educational Attainment in Greencastle
Average earnings in Greencastle are $57,969 for men and $30,625 for women, a difference of 47.2%. Men with an educational attainment of high school diploma enjoy the highest average annual earnings of $57,969, while those with high school diploma education earn the least with $57,969. Women with an educational attainment of college or associate's degree earn the most with the average annual earnings of $66,071, while those with bachelor's degree education have the smallest earnings of $14,083.
| Educational Attainment | Male Income | Female Income |
| Less than High School | - | - |
| High School Diploma | $57,969 | $26,875 |
| College or Associate's Degree | - | - |
| Bachelor's Degree | - | - |
| Graduate Degree | - | - |
| Total | $57,969 | $30,625 |
Family Income in Greencastle
Family Income Brackets in Greencastle
According to the Greencastle family income data, there are 12 families falling into the $50,000 to $74,999 income range, which is the most common income bracket and makes up 22.6% of all families.
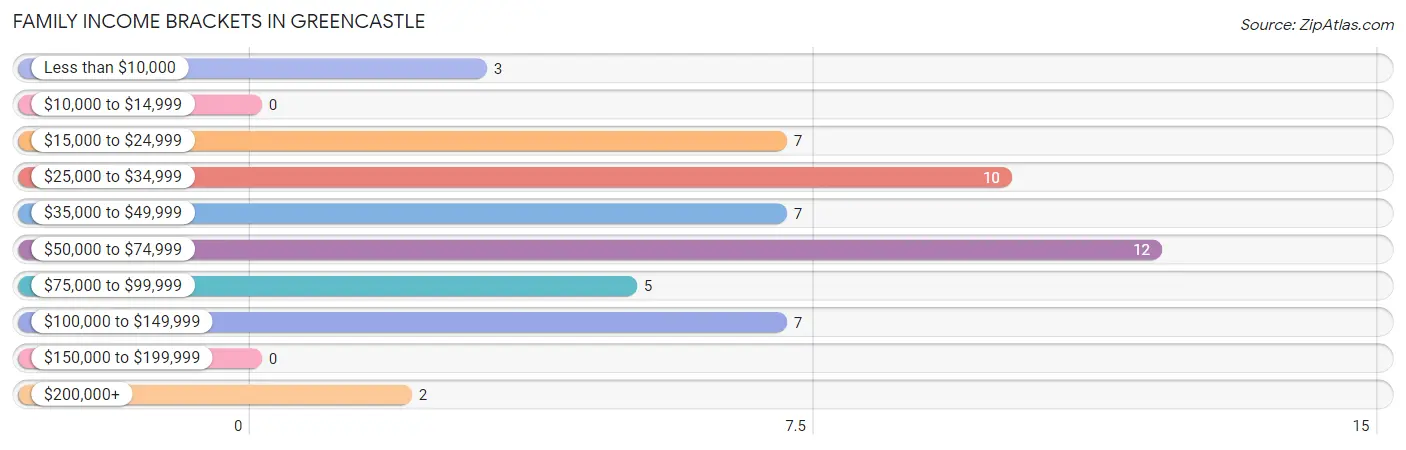
| Income Bracket | # Families | % Families |
| Less than $10,000 | 3 | 5.7% |
| $10,000 to $14,999 | 0 | 0.0% |
| $15,000 to $24,999 | 7 | 13.2% |
| $25,000 to $34,999 | 10 | 18.9% |
| $35,000 to $49,999 | 7 | 13.2% |
| $50,000 to $74,999 | 12 | 22.6% |
| $75,000 to $99,999 | 5 | 9.4% |
| $100,000 to $149,999 | 7 | 13.2% |
| $150,000 to $199,999 | 0 | 0.0% |
| $200,000+ | 2 | 3.8% |
Family Income by Famaliy Size in Greencastle
3-person families (9 | 17.0%) account for the highest median family income in Greencastle with $73,125 per family, while 3-person families (9 | 17.0%) have the highest median income of $24,375 per family member.
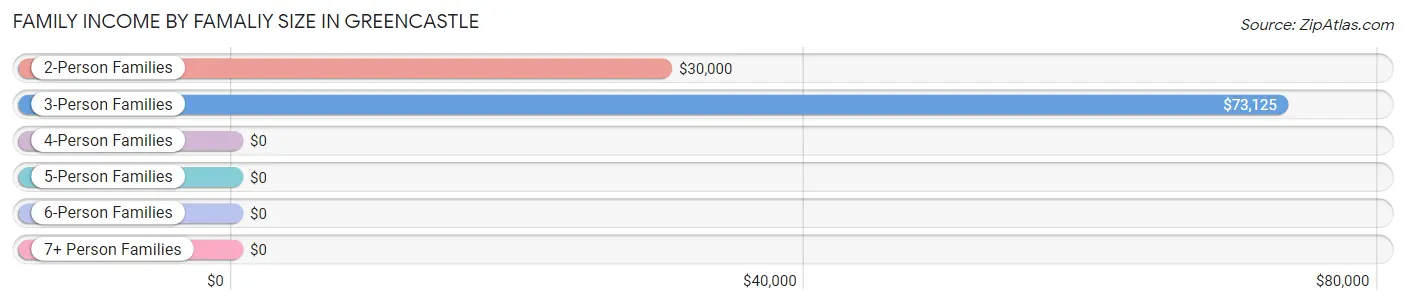
| Income Bracket | # Families | Median Income |
| 2-Person Families | 34 (64.1%) | $30,000 |
| 3-Person Families | 9 (17.0%) | $73,125 |
| 4-Person Families | 9 (17.0%) | $0 |
| 5-Person Families | 1 (1.9%) | $0 |
| 6-Person Families | 0 (0.0%) | $0 |
| 7+ Person Families | 0 (0.0%) | $0 |
| Total | 53 (100.0%) | $46,875 |
Family Income by Number of Earners in Greencastle
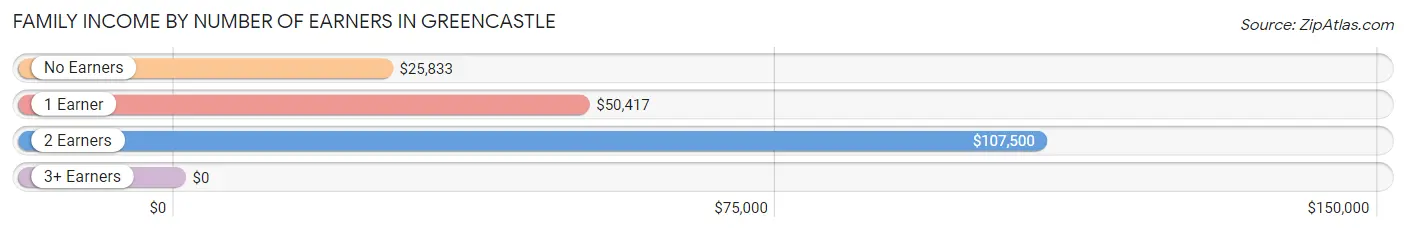
| Number of Earners | # Families | Median Income |
| No Earners | 18 (34.0%) | $25,833 |
| 1 Earner | 19 (35.8%) | $50,417 |
| 2 Earners | 14 (26.4%) | $107,500 |
| 3+ Earners | 2 (3.8%) | $0 |
| Total | 53 (100.0%) | $46,875 |
Household Income in Greencastle
Household Income Brackets in Greencastle
With 20 households falling in the category, the $50,000 to $74,999 income range is the most frequent in Greencastle, accounting for 20.8% of all households.
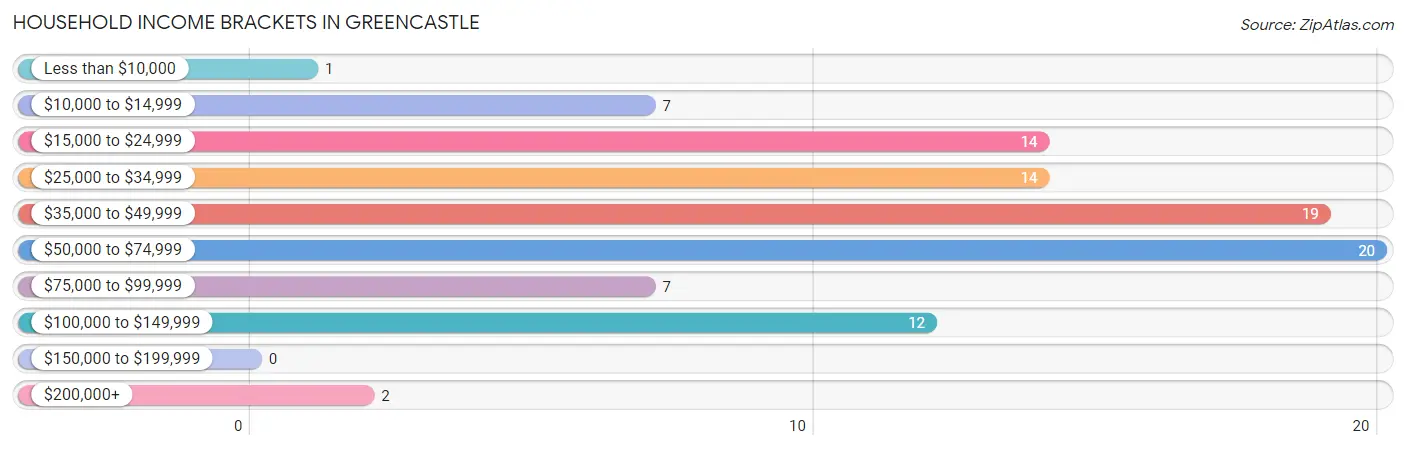
| Income Bracket | # Households | % Households |
| Less than $10,000 | 1 | 1.0% |
| $10,000 to $14,999 | 7 | 7.3% |
| $15,000 to $24,999 | 14 | 14.6% |
| $25,000 to $34,999 | 14 | 14.6% |
| $35,000 to $49,999 | 19 | 19.8% |
| $50,000 to $74,999 | 20 | 20.8% |
| $75,000 to $99,999 | 7 | 7.3% |
| $100,000 to $149,999 | 12 | 12.5% |
| $150,000 to $199,999 | 0 | 0.0% |
| $200,000+ | 2 | 2.1% |
Household Income by Householder Age in Greencastle
The median household income in Greencastle is $45,714, with the highest median household income of $59,750 found in the 45 to 64 years age bracket for the primary householder. A total of 45 households (46.9%) fall into this category. Meanwhile, the 65+ years age bracket for the primary householder has the lowest median household income of $30,000, with 34 households (35.4%) in this group.
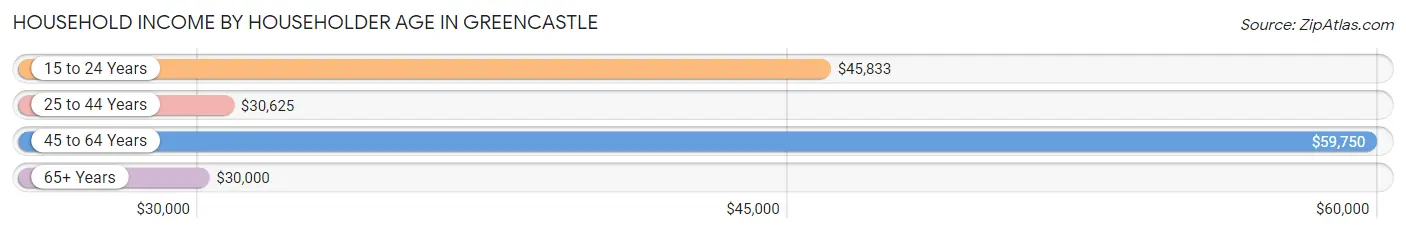
| Income Bracket | # Households | Median Income |
| 15 to 24 Years | 8 (8.3%) | $45,833 |
| 25 to 44 Years | 9 (9.4%) | $30,625 |
| 45 to 64 Years | 45 (46.9%) | $59,750 |
| 65+ Years | 34 (35.4%) | $30,000 |
| Total | 96 (100.0%) | $45,714 |
Poverty in Greencastle
Income Below Poverty by Sex and Age in Greencastle
With 5.5% poverty level for males and 17.8% for females among the residents of Greencastle, 6 to 11 year old males and under 5 year old females are the most vulnerable to poverty, with 2 males (50.0%) and 7 females (100.0%) in their respective age groups living below the poverty level.
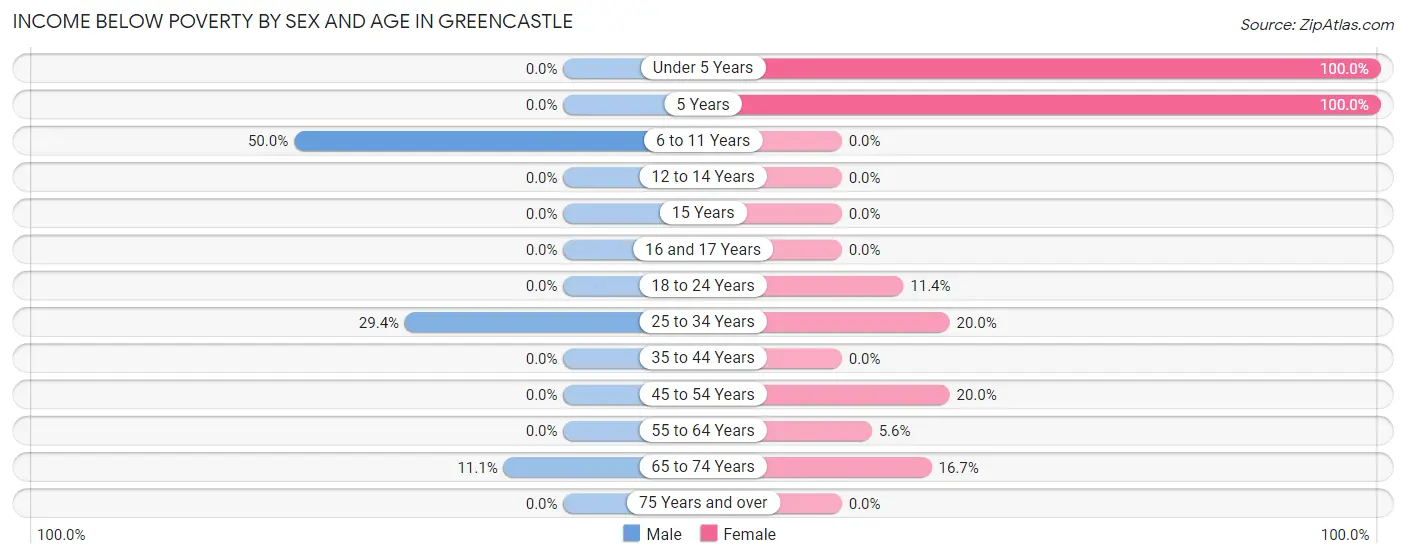
| Age Bracket | Male | Female |
| Under 5 Years | 0 (0.0%) | 7 (100.0%) |
| 5 Years | 0 (0.0%) | 2 (100.0%) |
| 6 to 11 Years | 2 (50.0%) | 0 (0.0%) |
| 12 to 14 Years | 0 (0.0%) | 0 (0.0%) |
| 15 Years | 0 (0.0%) | 0 (0.0%) |
| 16 and 17 Years | 0 (0.0%) | 0 (0.0%) |
| 18 to 24 Years | 0 (0.0%) | 4 (11.4%) |
| 25 to 34 Years | 5 (29.4%) | 1 (20.0%) |
| 35 to 44 Years | 0 (0.0%) | 0 (0.0%) |
| 45 to 54 Years | 0 (0.0%) | 10 (20.0%) |
| 55 to 64 Years | 0 (0.0%) | 1 (5.6%) |
| 65 to 74 Years | 1 (11.1%) | 2 (16.7%) |
| 75 Years and over | 0 (0.0%) | 0 (0.0%) |
| Total | 8 (5.5%) | 27 (17.8%) |
Income Above Poverty by Sex and Age in Greencastle
According to the poverty statistics in Greencastle, males aged under 5 years and females aged 6 to 11 years are the age groups that are most secure financially, with 100.0% of males and 100.0% of females in these age groups living above the poverty line.
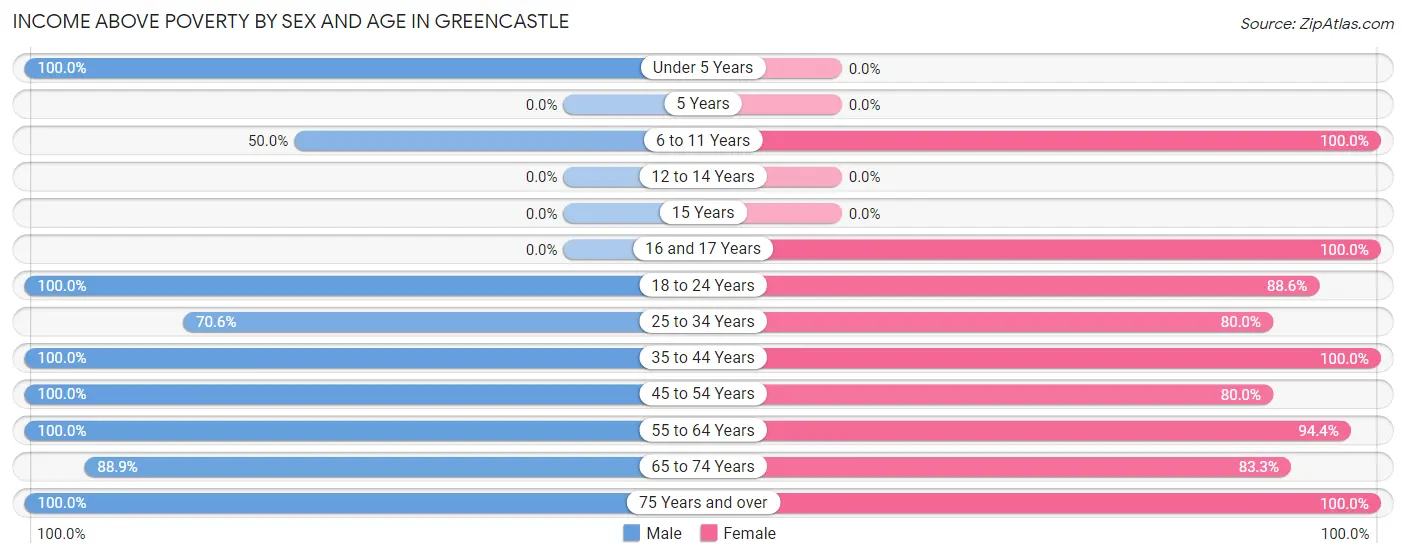
| Age Bracket | Male | Female |
| Under 5 Years | 6 (100.0%) | 0 (0.0%) |
| 5 Years | 0 (0.0%) | 0 (0.0%) |
| 6 to 11 Years | 2 (50.0%) | 3 (100.0%) |
| 12 to 14 Years | 0 (0.0%) | 0 (0.0%) |
| 15 Years | 0 (0.0%) | 0 (0.0%) |
| 16 and 17 Years | 0 (0.0%) | 2 (100.0%) |
| 18 to 24 Years | 10 (100.0%) | 31 (88.6%) |
| 25 to 34 Years | 12 (70.6%) | 4 (80.0%) |
| 35 to 44 Years | 16 (100.0%) | 1 (100.0%) |
| 45 to 54 Years | 12 (100.0%) | 40 (80.0%) |
| 55 to 64 Years | 59 (100.0%) | 17 (94.4%) |
| 65 to 74 Years | 8 (88.9%) | 10 (83.3%) |
| 75 Years and over | 13 (100.0%) | 17 (100.0%) |
| Total | 138 (94.5%) | 125 (82.2%) |
Income Below Poverty Among Married-Couple Families in Greencastle
The poverty statistics for married-couple families in Greencastle show that 2.7% or 1 of the total 37 families live below the poverty line. Families with no children have the highest poverty rate of 2.9%, comprising of 1 families. On the other hand, families with 1 or 2 children have the lowest poverty rate of 0.0%, which includes 0 families.
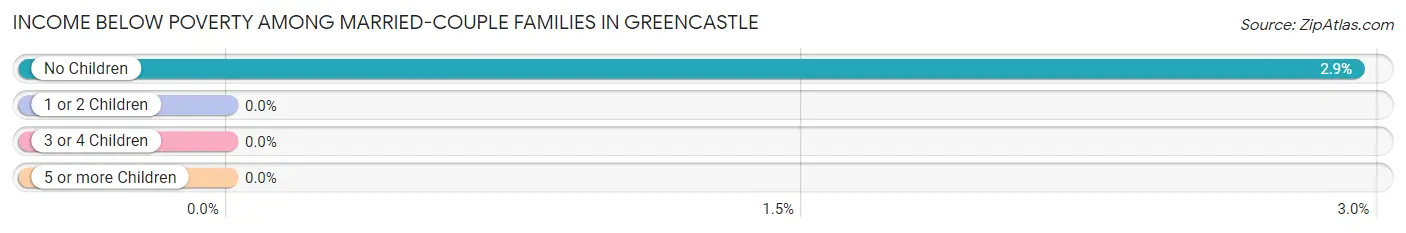
| Children | Above Poverty | Below Poverty |
| No Children | 33 (97.1%) | 1 (2.9%) |
| 1 or 2 Children | 3 (100.0%) | 0 (0.0%) |
| 3 or 4 Children | 0 (0.0%) | 0 (0.0%) |
| 5 or more Children | 0 (0.0%) | 0 (0.0%) |
| Total | 36 (97.3%) | 1 (2.7%) |
Income Below Poverty Among Single-Parent Households in Greencastle
According to the poverty data in Greencastle, 100.0% or 2 single-father households and 14.3% or 2 single-mother households are living below the poverty line. Among single-father households, those with 3 or 4 children have the highest poverty rate, with 2 households (100.0%) experiencing poverty. Likewise, among single-mother households, those with 1 or 2 children have the highest poverty rate, with 2 households (100.0%) falling below the poverty line.
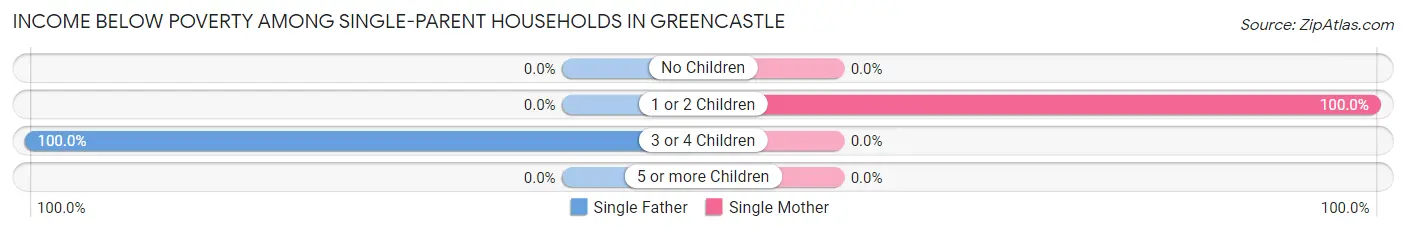
| Children | Single Father | Single Mother |
| No Children | 0 (0.0%) | 0 (0.0%) |
| 1 or 2 Children | 0 (0.0%) | 2 (100.0%) |
| 3 or 4 Children | 2 (100.0%) | 0 (0.0%) |
| 5 or more Children | 0 (0.0%) | 0 (0.0%) |
| Total | 2 (100.0%) | 2 (14.3%) |
Income Below Poverty Among Married-Couple vs Single-Parent Households in Greencastle
The poverty data for Greencastle shows that 1 of the married-couple family households (2.7%) and 4 of the single-parent households (25.0%) are living below the poverty level. Within the married-couple family households, those with no children have the highest poverty rate, with 1 households (2.9%) falling below the poverty line. Among the single-parent households, those with 1 or 2 children have the highest poverty rate, with 2 household (100.0%) living below poverty.
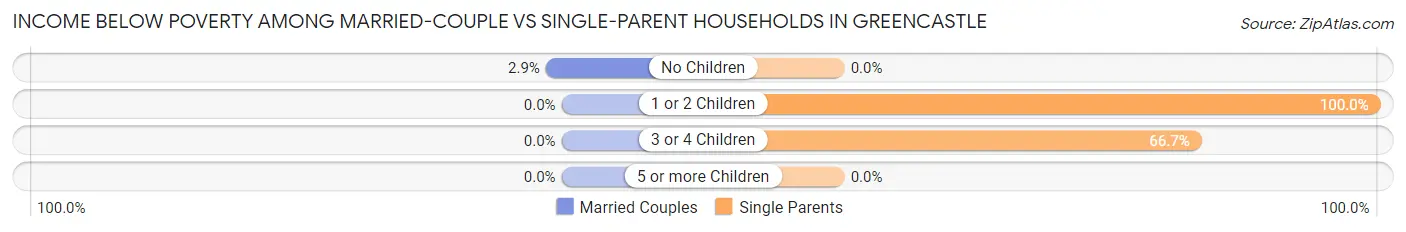
| Children | Married-Couple Families | Single-Parent Households |
| No Children | 1 (2.9%) | 0 (0.0%) |
| 1 or 2 Children | 0 (0.0%) | 2 (100.0%) |
| 3 or 4 Children | 0 (0.0%) | 2 (66.7%) |
| 5 or more Children | 0 (0.0%) | 0 (0.0%) |
| Total | 1 (2.7%) | 4 (25.0%) |
Race in Greencastle
The most populous races in Greencastle are White / Caucasian (287 | 96.3%), Native / Alaskan (11 | 3.7%), and Hispanic or Latino (8 | 2.7%).
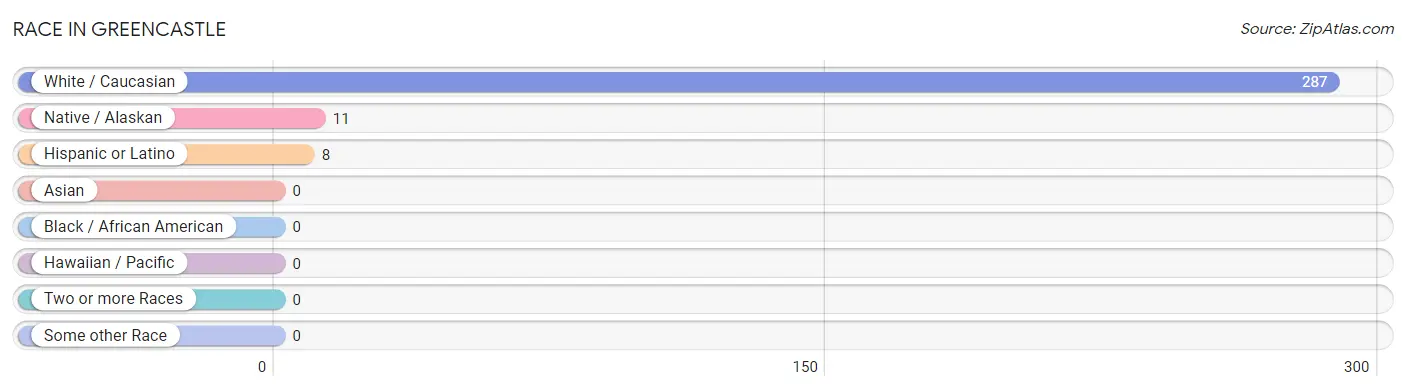
| Race | # Population | % Population |
| Asian | 0 | 0.0% |
| Black / African American | 0 | 0.0% |
| Hawaiian / Pacific | 0 | 0.0% |
| Hispanic or Latino | 8 | 2.7% |
| Native / Alaskan | 11 | 3.7% |
| White / Caucasian | 287 | 96.3% |
| Two or more Races | 0 | 0.0% |
| Some other Race | 0 | 0.0% |
| Total | 298 | 100.0% |
Ancestry in Greencastle
The most populous ancestries reported in Greencastle are American (71 | 23.8%), German (49 | 16.4%), Dutch (14 | 4.7%), Swiss (14 | 4.7%), and Irish (11 | 3.7%), together accounting for 53.4% of all Greencastle residents.
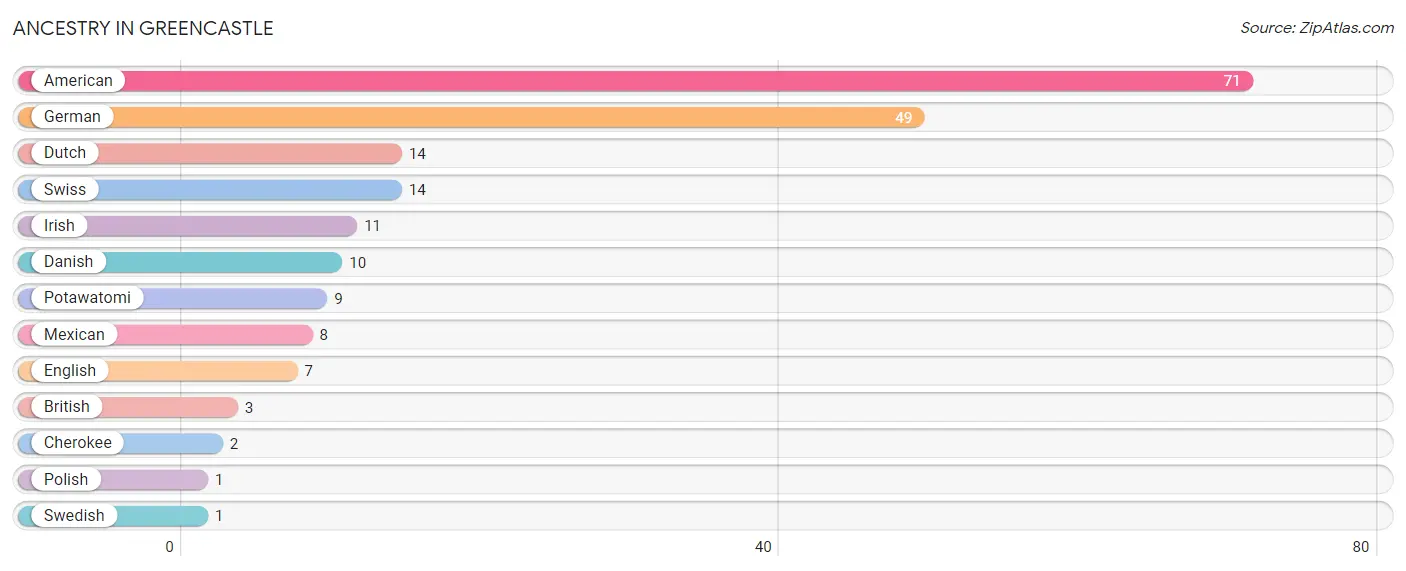
| Ancestry | # Population | % Population |
| American | 71 | 23.8% |
| British | 3 | 1.0% |
| Cherokee | 2 | 0.7% |
| Danish | 10 | 3.4% |
| Dutch | 14 | 4.7% |
| English | 7 | 2.4% |
| German | 49 | 16.4% |
| Irish | 11 | 3.7% |
| Mexican | 8 | 2.7% |
| Polish | 1 | 0.3% |
| Potawatomi | 9 | 3.0% |
| Swedish | 1 | 0.3% |
| Swiss | 14 | 4.7% | View All 13 Rows |
Immigrants in Greencastle
The most numerous immigrant groups reported in Greencastle came from Central America (7 | 2.4%), El Salvador (7 | 2.4%), and Latin America (7 | 2.4%), together accounting for 7.1% of all Greencastle residents.
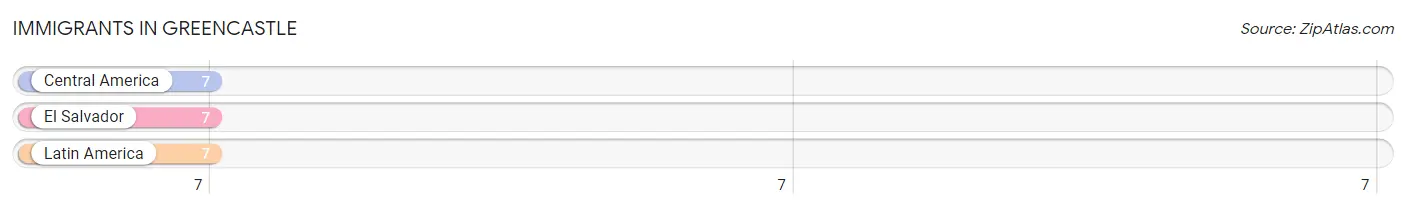
| Immigration Origin | # Population | % Population |
| Central America | 7 | 2.4% |
| El Salvador | 7 | 2.4% |
| Latin America | 7 | 2.4% | View All 3 Rows |
Sex and Age in Greencastle
Sex and Age in Greencastle
The most populous age groups in Greencastle are 55 to 59 Years (46 | 31.5%) for men and 50 to 54 Years (31 | 20.4%) for women.
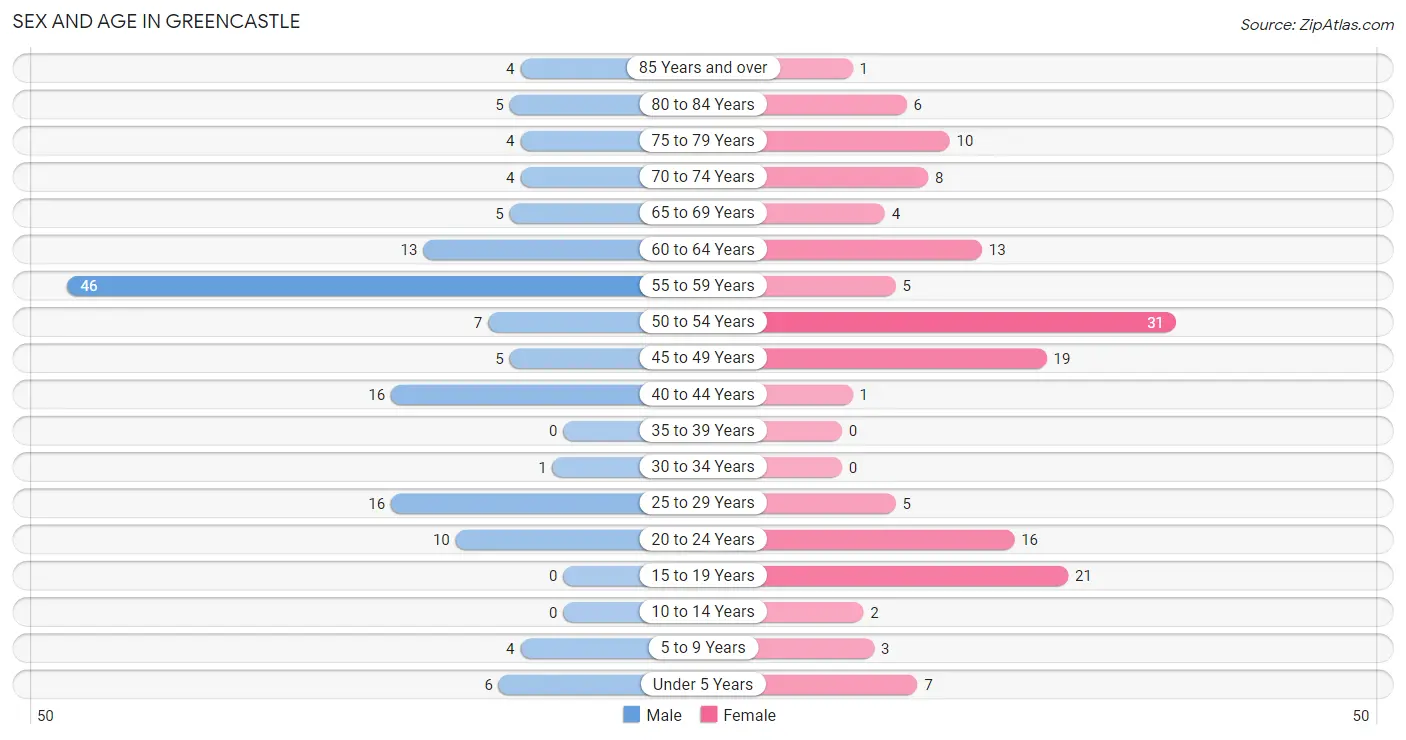
| Age Bracket | Male | Female |
| Under 5 Years | 6 (4.1%) | 7 (4.6%) |
| 5 to 9 Years | 4 (2.7%) | 3 (2.0%) |
| 10 to 14 Years | 0 (0.0%) | 2 (1.3%) |
| 15 to 19 Years | 0 (0.0%) | 21 (13.8%) |
| 20 to 24 Years | 10 (6.9%) | 16 (10.5%) |
| 25 to 29 Years | 16 (11.0%) | 5 (3.3%) |
| 30 to 34 Years | 1 (0.7%) | 0 (0.0%) |
| 35 to 39 Years | 0 (0.0%) | 0 (0.0%) |
| 40 to 44 Years | 16 (11.0%) | 1 (0.7%) |
| 45 to 49 Years | 5 (3.4%) | 19 (12.5%) |
| 50 to 54 Years | 7 (4.8%) | 31 (20.4%) |
| 55 to 59 Years | 46 (31.5%) | 5 (3.3%) |
| 60 to 64 Years | 13 (8.9%) | 13 (8.6%) |
| 65 to 69 Years | 5 (3.4%) | 4 (2.6%) |
| 70 to 74 Years | 4 (2.7%) | 8 (5.3%) |
| 75 to 79 Years | 4 (2.7%) | 10 (6.6%) |
| 80 to 84 Years | 5 (3.4%) | 6 (4.0%) |
| 85 Years and over | 4 (2.7%) | 1 (0.7%) |
| Total | 146 (100.0%) | 152 (100.0%) |
Families and Households in Greencastle
Median Family Size in Greencastle
The median family size in Greencastle is 4.49 persons per family, with single female/mother families (14 | 26.4%) accounting for the largest median family size of 6.07 persons per family. On the other hand, married-couple families (37 | 69.8%) represent the smallest median family size with 3.92 persons per family.
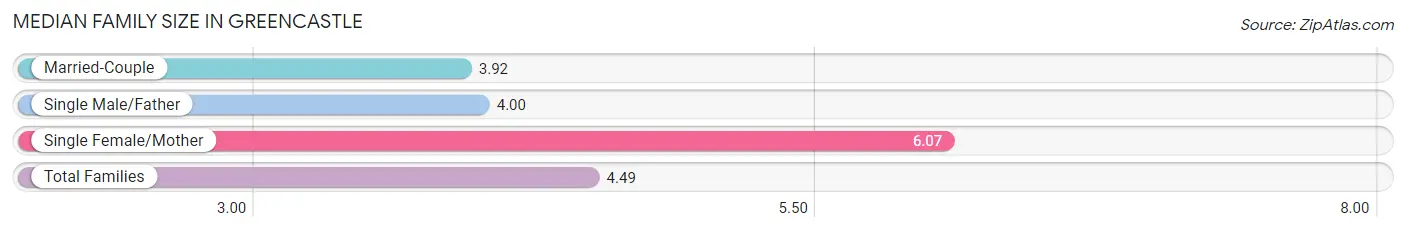
| Family Type | # Families | Family Size |
| Married-Couple | 37 (69.8%) | 3.92 |
| Single Male/Father | 2 (3.8%) | 4.00 |
| Single Female/Mother | 14 (26.4%) | 6.07 |
| Total Families | 53 (100.0%) | 4.49 |
Median Household Size in Greencastle
The median household size in Greencastle is 3.10 persons per household, with single female/mother households (14 | 14.6%) accounting for the largest median household size of 6.29 persons per household. non-family households (43 | 44.8%) represent the smallest median household size with 1.30 persons per household.
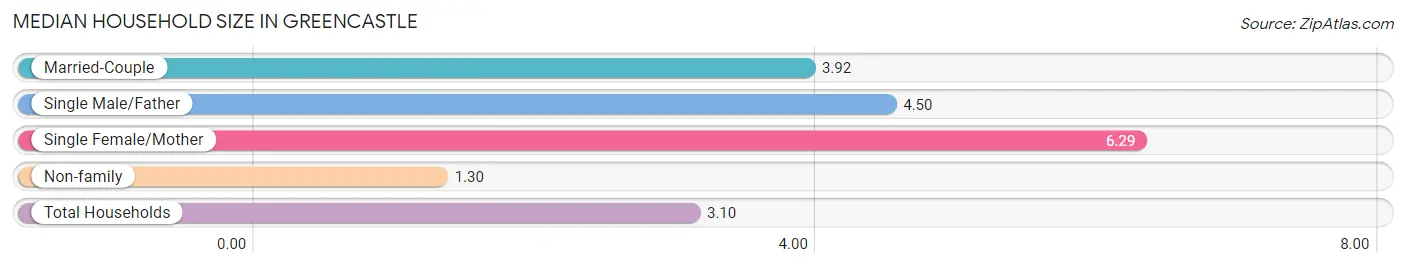
| Household Type | # Households | Household Size |
| Married-Couple | 37 (38.5%) | 3.92 |
| Single Male/Father | 2 (2.1%) | 4.50 |
| Single Female/Mother | 14 (14.6%) | 6.29 |
| Non-family | 43 (44.8%) | 1.30 |
| Total Households | 96 (100.0%) | 3.10 |
Household Size by Marriage Status in Greencastle
Out of a total of 96 households in Greencastle, 53 (55.2%) are family households, while 43 (44.8%) are nonfamily households. The most numerous type of family households are 2-person households, comprising 32, and the most common type of nonfamily households are 1-person households, comprising 33.
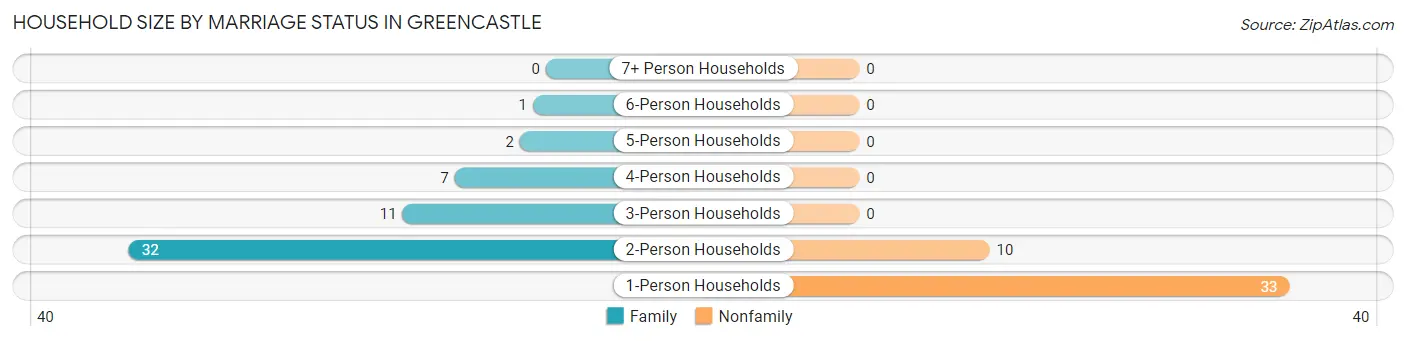
| Household Size | Family Households | Nonfamily Households |
| 1-Person Households | - | 33 (34.4%) |
| 2-Person Households | 32 (33.3%) | 10 (10.4%) |
| 3-Person Households | 11 (11.5%) | 0 (0.0%) |
| 4-Person Households | 7 (7.3%) | 0 (0.0%) |
| 5-Person Households | 2 (2.1%) | 0 (0.0%) |
| 6-Person Households | 1 (1.0%) | 0 (0.0%) |
| 7+ Person Households | 0 (0.0%) | 0 (0.0%) |
| Total | 53 (55.2%) | 43 (44.8%) |
Female Fertility in Greencastle
Fertility by Age in Greencastle
Average fertility rate in Greencastle is 42.0 births per 1,000 women. Women in the age bracket of 20 to 34 years have the highest fertility rate with 143.0 births per 1,000 women. Women in the age bracket of 20 to 34 years acount for 100.0% of all women with births.
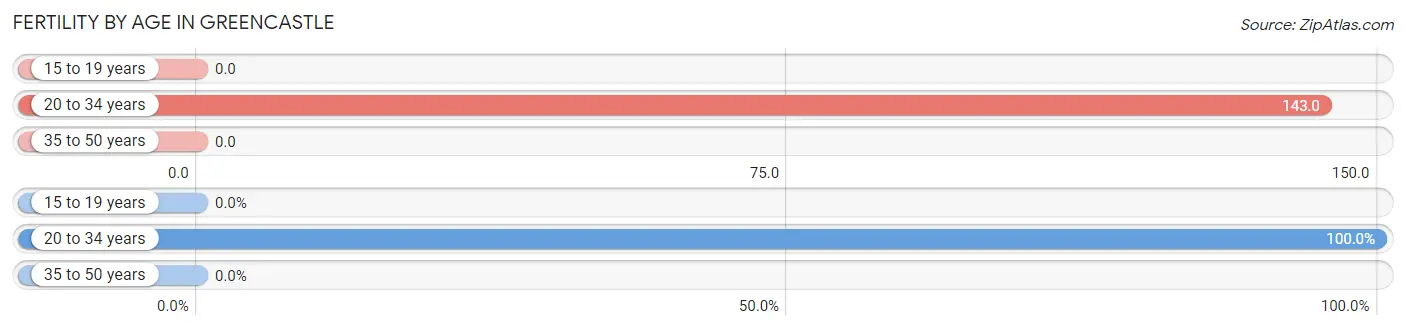
| Age Bracket | Women with Births | Births / 1,000 Women |
| 15 to 19 years | 0 (0.0%) | 0.0 |
| 20 to 34 years | 3 (100.0%) | 143.0 |
| 35 to 50 years | 0 (0.0%) | 0.0 |
| Total | 3 (100.0%) | 42.0 |
Fertility by Age by Marriage Status in Greencastle
33.3% of women with births (3) in Greencastle are married. The highest percentage of unmarried women with births falls into 20 to 34 years age bracket with 66.7% of them unmarried at the time of birth, while the lowest percentage of unmarried women with births belong to 20 to 34 years age bracket with 66.7% of them unmarried.
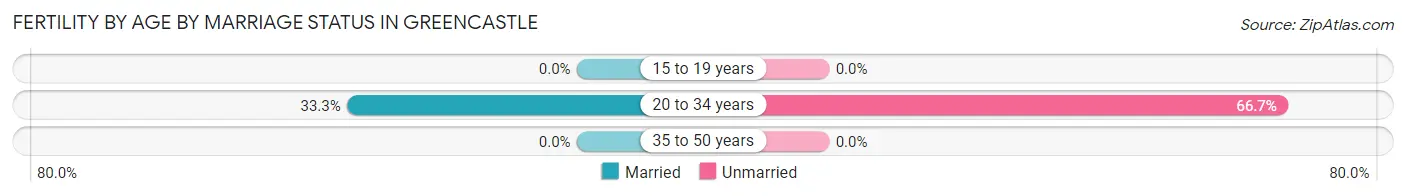
| Age Bracket | Married | Unmarried |
| 15 to 19 years | 0 (0.0%) | 0 (0.0%) |
| 20 to 34 years | 1 (33.3%) | 2 (66.7%) |
| 35 to 50 years | 0 (0.0%) | 0 (0.0%) |
| Total | 1 (33.3%) | 2 (66.7%) |
Fertility by Education in Greencastle
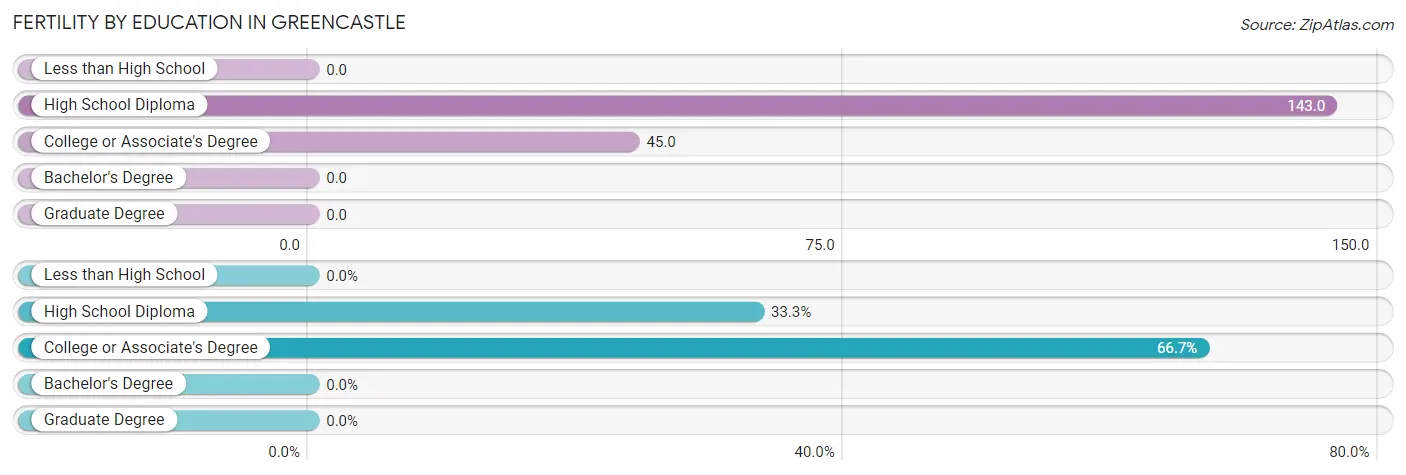
| Educational Attainment | Women with Births | Births / 1,000 Women |
| Less than High School | 0 (0.0%) | 0.0 |
| High School Diploma | 1 (33.3%) | 143.0 |
| College or Associate's Degree | 2 (66.7%) | 45.0 |
| Bachelor's Degree | 0 (0.0%) | 0.0 |
| Graduate Degree | 0 (0.0%) | 0.0 |
| Total | 3 (100.0%) | 42.0 |
Fertility by Education by Marriage Status in Greencastle
66.7% of women with births in Greencastle are unmarried. Women with the educational attainment of high school diploma are most likely to be married with 100.0% of them married at childbirth, while women with the educational attainment of college or associate's degree are least likely to be married with 100.0% of them unmarried at childbirth.
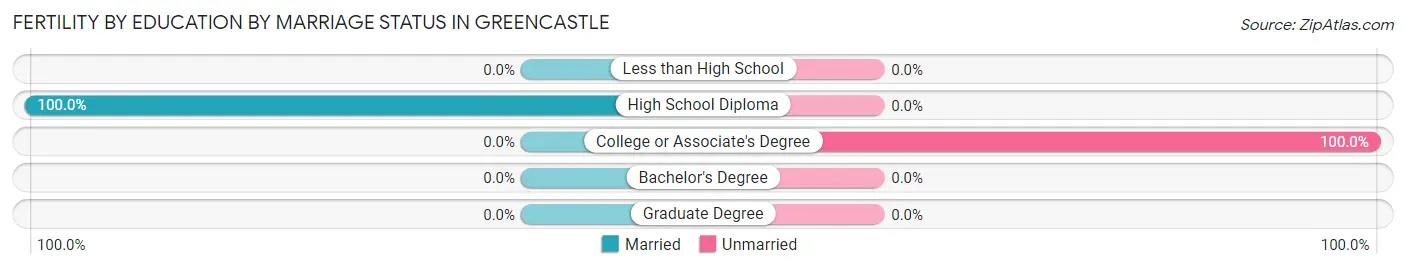
| Educational Attainment | Married | Unmarried |
| Less than High School | 0 (0.0%) | 0 (0.0%) |
| High School Diploma | 1 (100.0%) | 0 (0.0%) |
| College or Associate's Degree | 0 (0.0%) | 2 (100.0%) |
| Bachelor's Degree | 0 (0.0%) | 0 (0.0%) |
| Graduate Degree | 0 (0.0%) | 0 (0.0%) |
| Total | 1 (33.3%) | 2 (66.7%) |
Employment Characteristics in Greencastle
Employment by Class of Employer in Greencastle
Among the 129 employed individuals in Greencastle, private company employees (99 | 76.7%), self-employed (not incorporated) (10 | 7.7%), and local government employees (8 | 6.2%) make up the most common classes of employment.
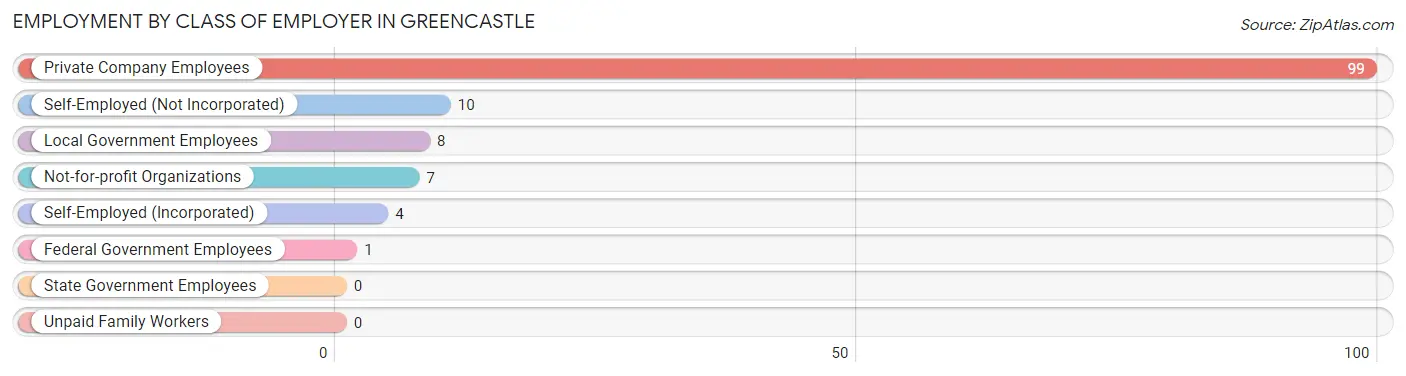
| Employer Class | # Employees | % Employees |
| Private Company Employees | 99 | 76.7% |
| Self-Employed (Incorporated) | 4 | 3.1% |
| Self-Employed (Not Incorporated) | 10 | 7.7% |
| Not-for-profit Organizations | 7 | 5.4% |
| Local Government Employees | 8 | 6.2% |
| State Government Employees | 0 | 0.0% |
| Federal Government Employees | 1 | 0.8% |
| Unpaid Family Workers | 0 | 0.0% |
| Total | 129 | 100.0% |
Employment Status by Age in Greencastle
According to the labor force statistics for Greencastle, out of the total population over 16 years of age (276), 47.5% or 131 individuals are in the labor force, with 0.8% or 1 of them unemployed. The age group with the highest labor force participation rate is 30 to 34 years, with 100.0% or 1 individuals in the labor force. Within the labor force, the 25 to 29 years age range has the highest percentage of unemployed individuals, with 11.1% or 1 of them being unemployed.
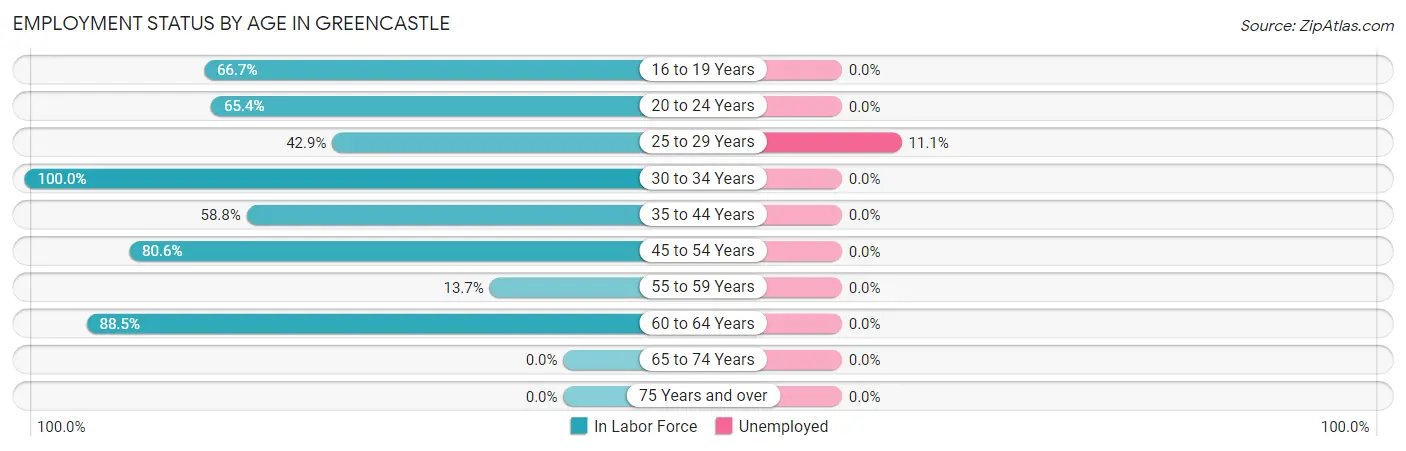
| Age Bracket | In Labor Force | Unemployed |
| 16 to 19 Years | 14 (66.7%) | 0 (0.0%) |
| 20 to 24 Years | 17 (65.4%) | 0 (0.0%) |
| 25 to 29 Years | 9 (42.9%) | 1 (11.1%) |
| 30 to 34 Years | 1 (100.0%) | 0 (0.0%) |
| 35 to 44 Years | 10 (58.8%) | 0 (0.0%) |
| 45 to 54 Years | 50 (80.6%) | 0 (0.0%) |
| 55 to 59 Years | 7 (13.7%) | 0 (0.0%) |
| 60 to 64 Years | 23 (88.5%) | 0 (0.0%) |
| 65 to 74 Years | 0 (0.0%) | 0 (0.0%) |
| 75 Years and over | 0 (0.0%) | 0 (0.0%) |
| Total | 131 (47.5%) | 1 (0.8%) |
Employment Status by Educational Attainment in Greencastle
According to labor force statistics for Greencastle, 56.2% of individuals (100) out of the total population between 25 and 64 years of age (178) are in the labor force, with 1.0% or 1 of them being unemployed. The group with the highest labor force participation rate are those with the educational attainment of bachelor's degree or higher, with 96.8% or 30 individuals in the labor force. Within the labor force, individuals with less than high school education have the highest percentage of unemployment, with 10.0% or 1 of them being unemployed.
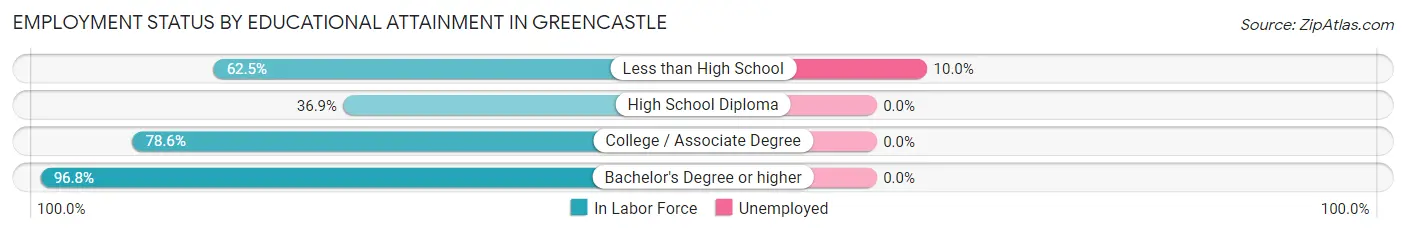
| Educational Attainment | In Labor Force | Unemployed |
| Less than High School | 10 (62.5%) | 2 (10.0%) |
| High School Diploma | 38 (36.9%) | 0 (0.0%) |
| College / Associate Degree | 22 (78.6%) | 0 (0.0%) |
| Bachelor's Degree or higher | 30 (96.8%) | 0 (0.0%) |
| Total | 100 (56.2%) | 2 (1.0%) |
Employment Occupations by Sex in Greencastle
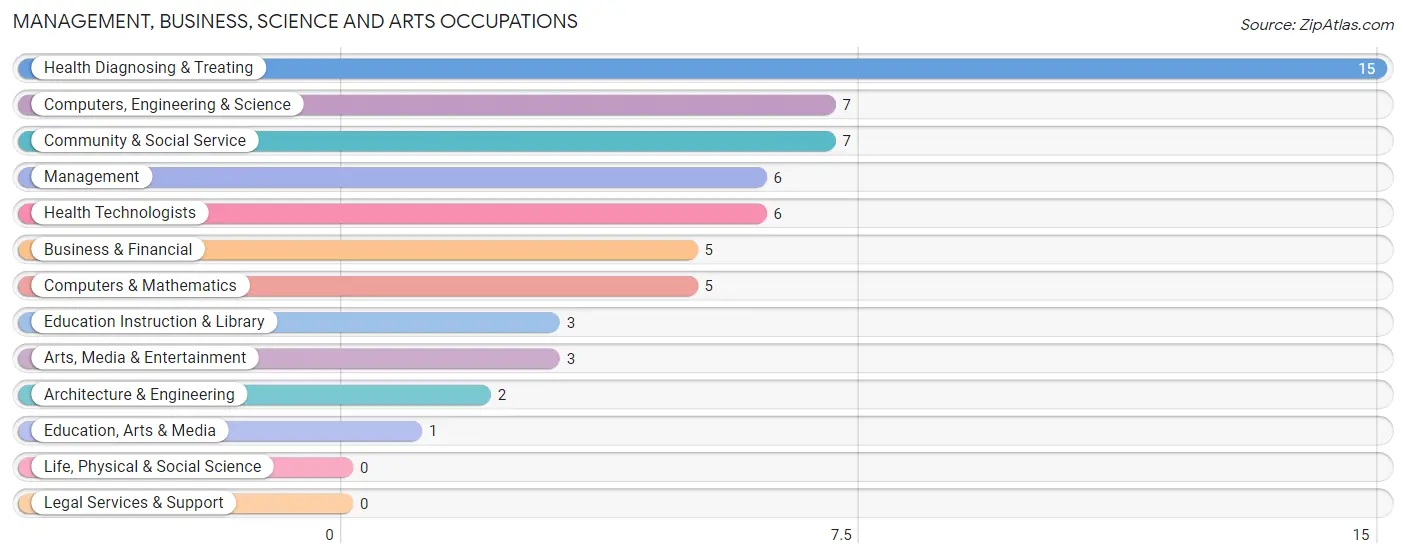
Management, Business, Science and Arts Occupations
The most common Management, Business, Science and Arts occupations in Greencastle are Health Diagnosing & Treating (15 | 11.5%), Computers, Engineering & Science (7 | 5.4%), Community & Social Service (7 | 5.4%), Management (6 | 4.6%), and Health Technologists (6 | 4.6%).
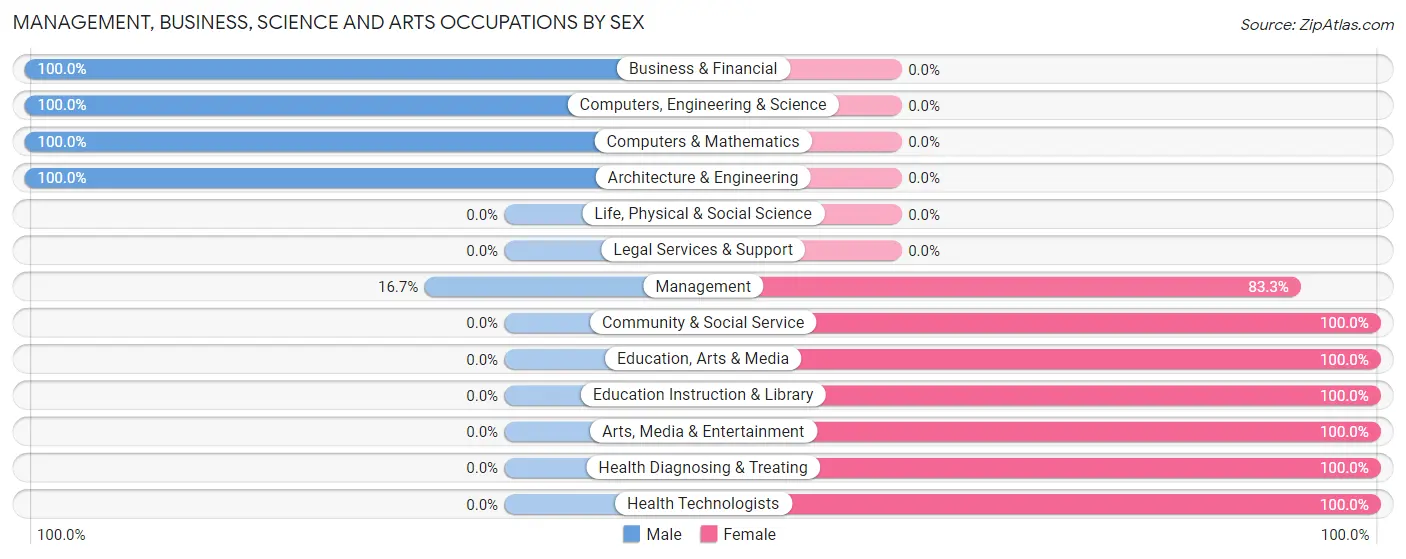
Management, Business, Science and Arts Occupations by Sex
Within the Management, Business, Science and Arts occupations in Greencastle, the most male-oriented occupations are Business & Financial (100.0%), Computers, Engineering & Science (100.0%), and Computers & Mathematics (100.0%), while the most female-oriented occupations are Community & Social Service (100.0%), Education, Arts & Media (100.0%), and Education Instruction & Library (100.0%).
| Occupation | Male | Female |
| Management | 1 (16.7%) | 5 (83.3%) |
| Business & Financial | 5 (100.0%) | 0 (0.0%) |
| Computers, Engineering & Science | 7 (100.0%) | 0 (0.0%) |
| Computers & Mathematics | 5 (100.0%) | 0 (0.0%) |
| Architecture & Engineering | 2 (100.0%) | 0 (0.0%) |
| Life, Physical & Social Science | 0 (0.0%) | 0 (0.0%) |
| Community & Social Service | 0 (0.0%) | 7 (100.0%) |
| Education, Arts & Media | 0 (0.0%) | 1 (100.0%) |
| Legal Services & Support | 0 (0.0%) | 0 (0.0%) |
| Education Instruction & Library | 0 (0.0%) | 3 (100.0%) |
| Arts, Media & Entertainment | 0 (0.0%) | 3 (100.0%) |
| Health Diagnosing & Treating | 0 (0.0%) | 15 (100.0%) |
| Health Technologists | 0 (0.0%) | 6 (100.0%) |
| Total (Category) | 13 (32.5%) | 27 (67.5%) |
| Total (Overall) | 51 (39.2%) | 79 (60.8%) |
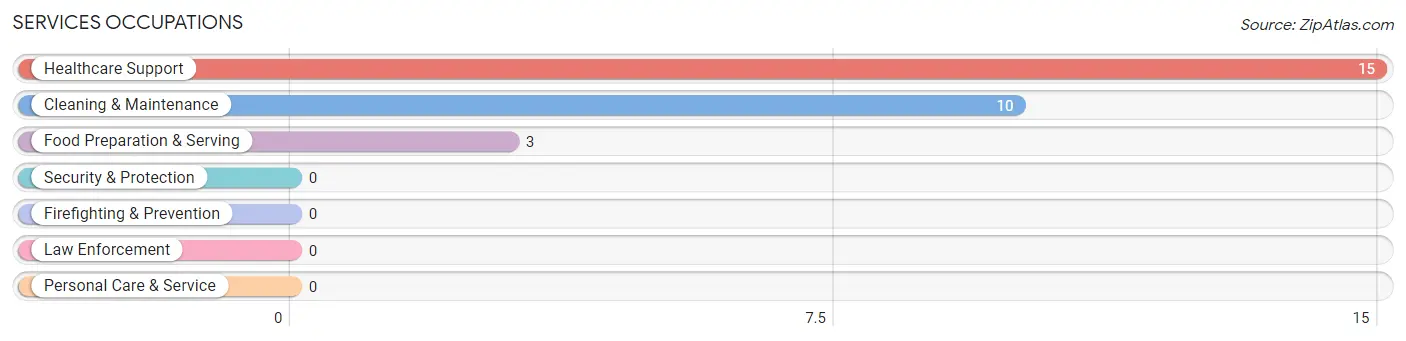
Services Occupations
The most common Services occupations in Greencastle are Healthcare Support (15 | 11.5%), Cleaning & Maintenance (10 | 7.7%), and Food Preparation & Serving (3 | 2.3%).
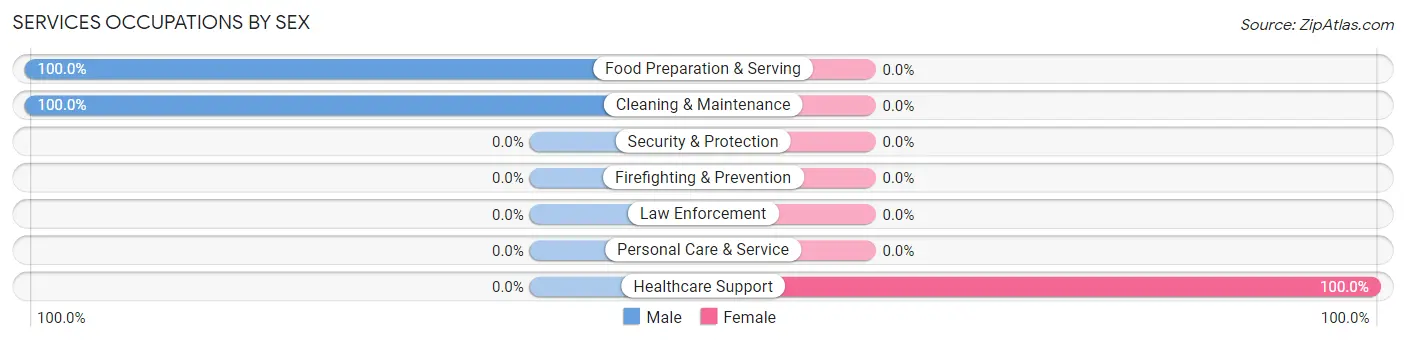
Services Occupations by Sex
| Occupation | Male | Female |
| Healthcare Support | 0 (0.0%) | 15 (100.0%) |
| Security & Protection | 0 (0.0%) | 0 (0.0%) |
| Firefighting & Prevention | 0 (0.0%) | 0 (0.0%) |
| Law Enforcement | 0 (0.0%) | 0 (0.0%) |
| Food Preparation & Serving | 3 (100.0%) | 0 (0.0%) |
| Cleaning & Maintenance | 10 (100.0%) | 0 (0.0%) |
| Personal Care & Service | 0 (0.0%) | 0 (0.0%) |
| Total (Category) | 13 (46.4%) | 15 (53.6%) |
| Total (Overall) | 51 (39.2%) | 79 (60.8%) |
Sales and Office Occupations
The most common Sales and Office occupations in Greencastle are Sales & Related (15 | 11.5%), and Office & Administration (5 | 3.8%).
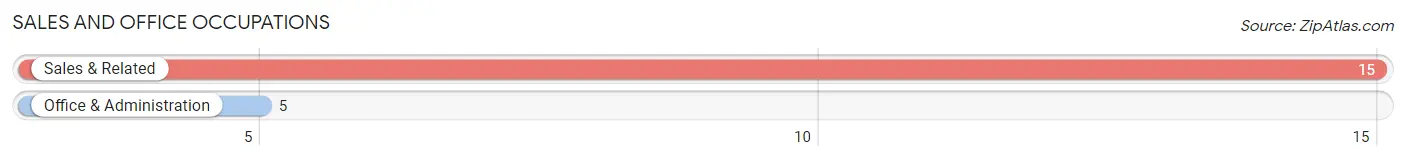
Sales and Office Occupations by Sex
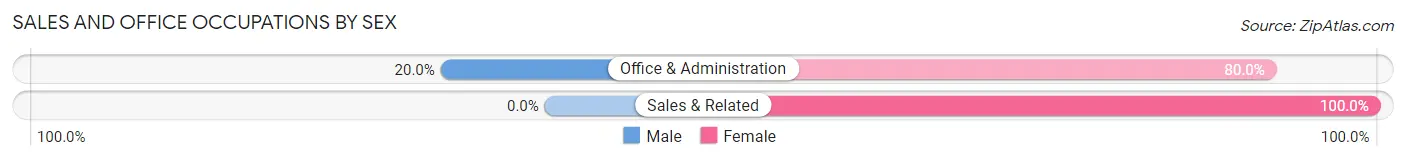
| Occupation | Male | Female |
| Sales & Related | 0 (0.0%) | 15 (100.0%) |
| Office & Administration | 1 (20.0%) | 4 (80.0%) |
| Total (Category) | 1 (5.0%) | 19 (95.0%) |
| Total (Overall) | 51 (39.2%) | 79 (60.8%) |
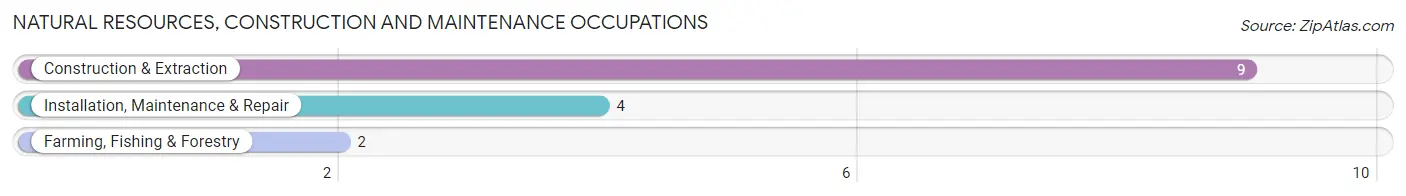
Natural Resources, Construction and Maintenance Occupations
The most common Natural Resources, Construction and Maintenance occupations in Greencastle are Construction & Extraction (9 | 6.9%), Installation, Maintenance & Repair (4 | 3.1%), and Farming, Fishing & Forestry (2 | 1.5%).
Natural Resources, Construction and Maintenance Occupations by Sex
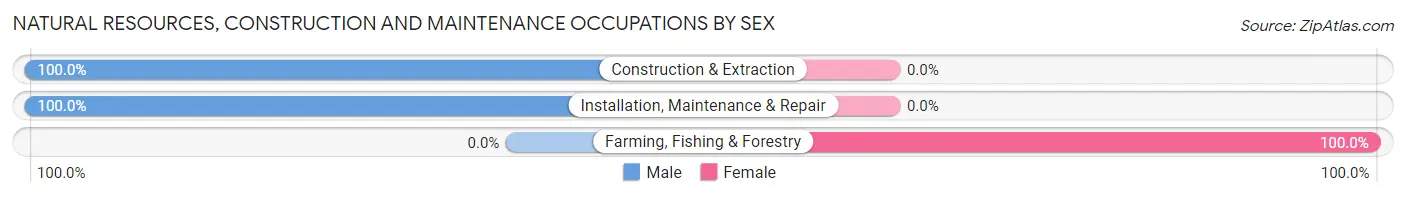
| Occupation | Male | Female |
| Farming, Fishing & Forestry | 0 (0.0%) | 2 (100.0%) |
| Construction & Extraction | 9 (100.0%) | 0 (0.0%) |
| Installation, Maintenance & Repair | 4 (100.0%) | 0 (0.0%) |
| Total (Category) | 13 (86.7%) | 2 (13.3%) |
| Total (Overall) | 51 (39.2%) | 79 (60.8%) |
Production, Transportation and Moving Occupations
The most common Production, Transportation and Moving occupations in Greencastle are Material Moving (17 | 13.1%), and Production (10 | 7.7%).
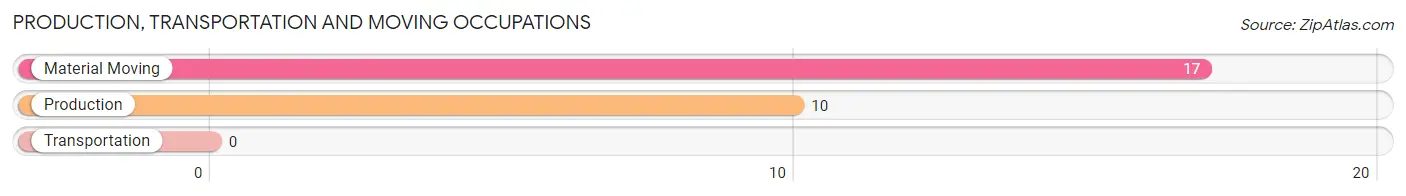
Production, Transportation and Moving Occupations by Sex
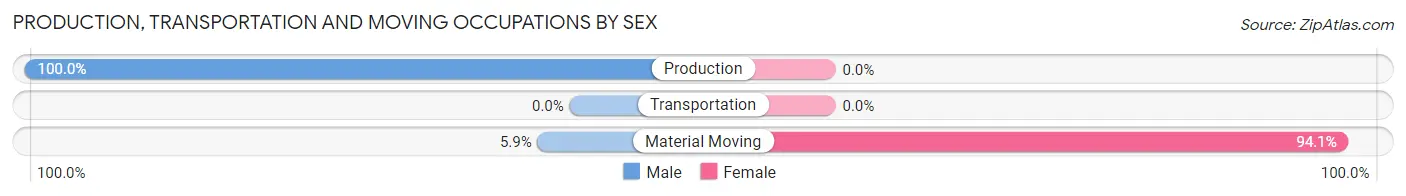
| Occupation | Male | Female |
| Production | 10 (100.0%) | 0 (0.0%) |
| Transportation | 0 (0.0%) | 0 (0.0%) |
| Material Moving | 1 (5.9%) | 16 (94.1%) |
| Total (Category) | 11 (40.7%) | 16 (59.3%) |
| Total (Overall) | 51 (39.2%) | 79 (60.8%) |
Employment Industries by Sex in Greencastle
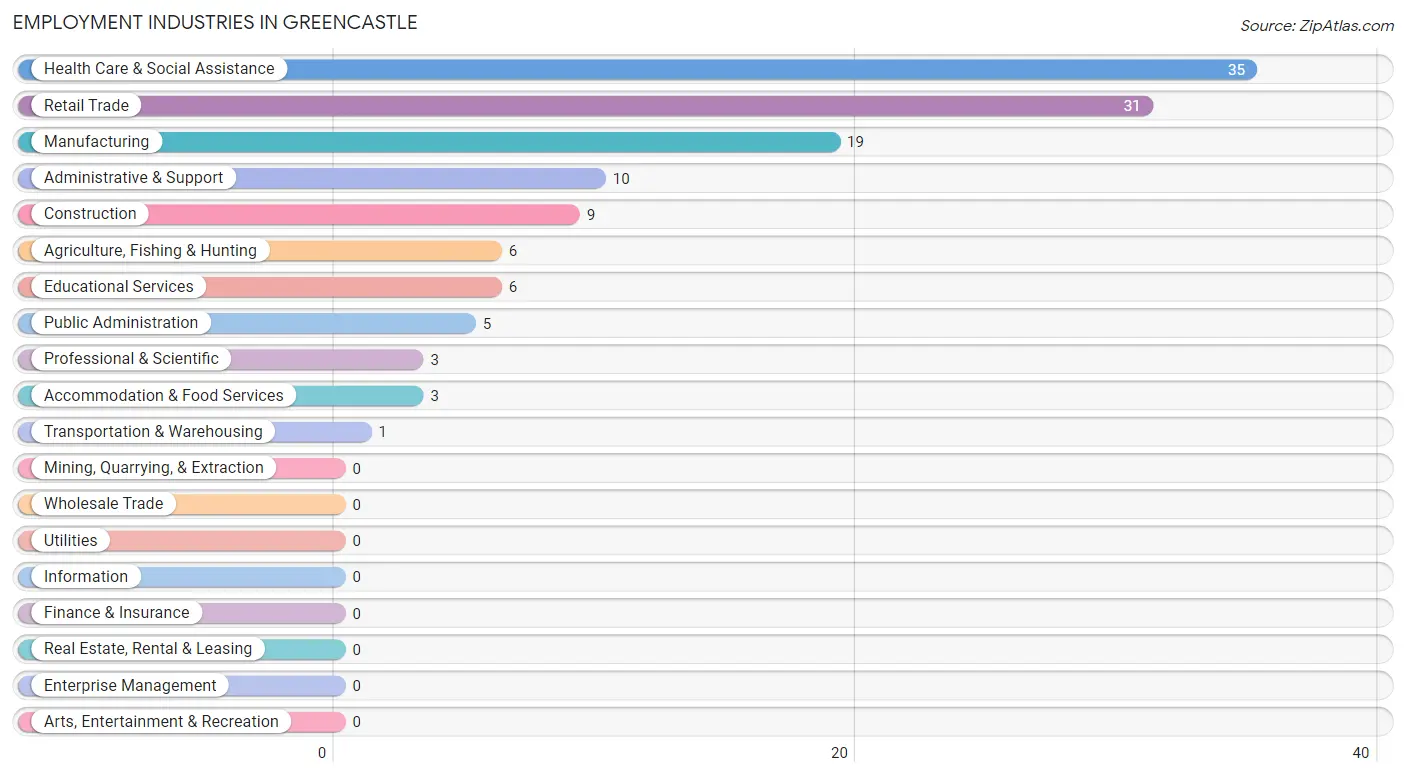
Employment Industries in Greencastle
The major employment industries in Greencastle include Health Care & Social Assistance (35 | 26.9%), Retail Trade (31 | 23.8%), Manufacturing (19 | 14.6%), Administrative & Support (10 | 7.7%), and Construction (9 | 6.9%).
Employment Industries by Sex in Greencastle
The Greencastle industries that see more men than women are Construction (100.0%), Transportation & Warehousing (100.0%), and Administrative & Support (100.0%), whereas the industries that tend to have a higher number of women are Retail Trade (100.0%), Professional & Scientific (100.0%), and Health Care & Social Assistance (100.0%).
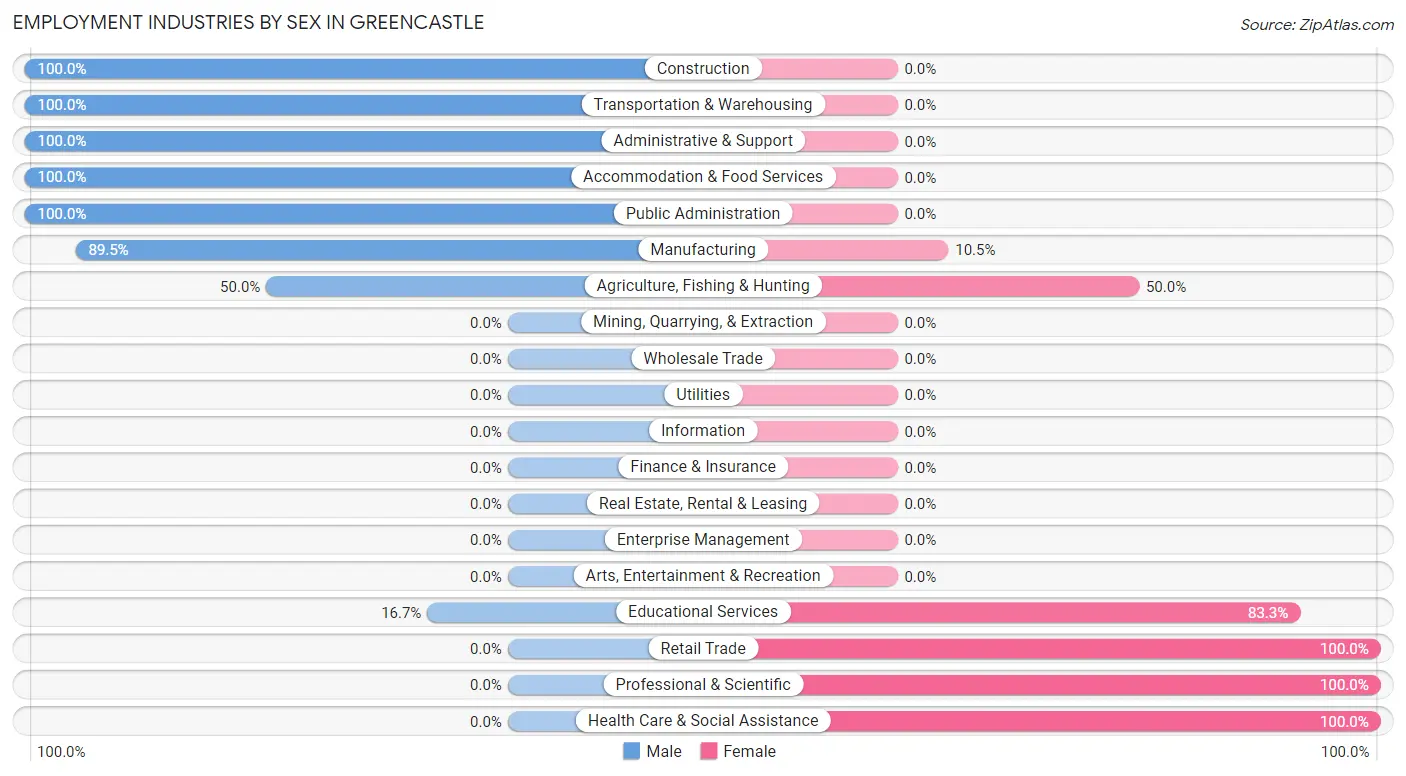
| Industry | Male | Female |
| Agriculture, Fishing & Hunting | 3 (50.0%) | 3 (50.0%) |
| Mining, Quarrying, & Extraction | 0 (0.0%) | 0 (0.0%) |
| Construction | 9 (100.0%) | 0 (0.0%) |
| Manufacturing | 17 (89.5%) | 2 (10.5%) |
| Wholesale Trade | 0 (0.0%) | 0 (0.0%) |
| Retail Trade | 0 (0.0%) | 31 (100.0%) |
| Transportation & Warehousing | 1 (100.0%) | 0 (0.0%) |
| Utilities | 0 (0.0%) | 0 (0.0%) |
| Information | 0 (0.0%) | 0 (0.0%) |
| Finance & Insurance | 0 (0.0%) | 0 (0.0%) |
| Real Estate, Rental & Leasing | 0 (0.0%) | 0 (0.0%) |
| Professional & Scientific | 0 (0.0%) | 3 (100.0%) |
| Enterprise Management | 0 (0.0%) | 0 (0.0%) |
| Administrative & Support | 10 (100.0%) | 0 (0.0%) |
| Educational Services | 1 (16.7%) | 5 (83.3%) |
| Health Care & Social Assistance | 0 (0.0%) | 35 (100.0%) |
| Arts, Entertainment & Recreation | 0 (0.0%) | 0 (0.0%) |
| Accommodation & Food Services | 3 (100.0%) | 0 (0.0%) |
| Public Administration | 5 (100.0%) | 0 (0.0%) |
| Total | 51 (39.2%) | 79 (60.8%) |
Education in Greencastle
School Enrollment in Greencastle
The most common levels of schooling among the 50 students in Greencastle are college / undergraduate (36 | 72.0%), elementary school (5 | 10.0%), and nursery / preschool (3 | 6.0%).
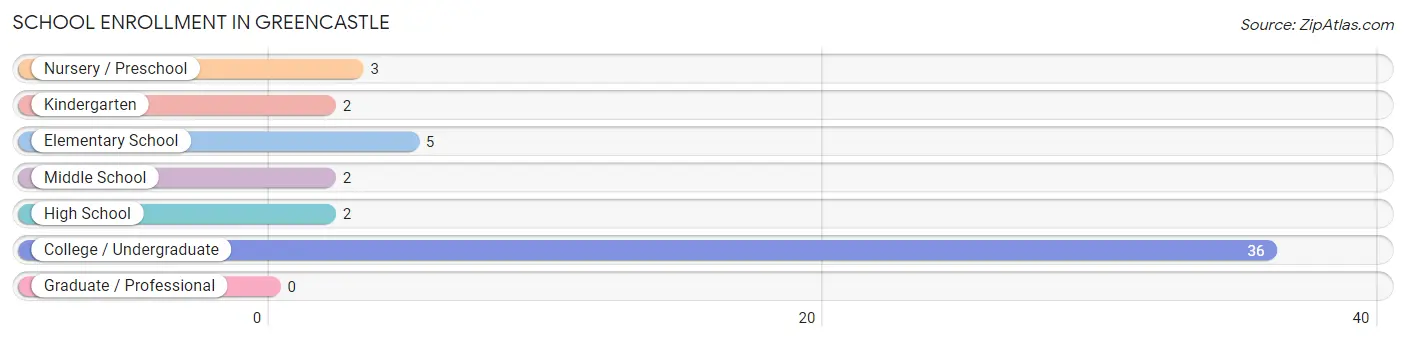
| School Level | # Students | % Students |
| Nursery / Preschool | 3 | 6.0% |
| Kindergarten | 2 | 4.0% |
| Elementary School | 5 | 10.0% |
| Middle School | 2 | 4.0% |
| High School | 2 | 4.0% |
| College / Undergraduate | 36 | 72.0% |
| Graduate / Professional | 0 | 0.0% |
| Total | 50 | 100.0% |
School Enrollment by Age by Funding Source in Greencastle
Out of a total of 50 students who are enrolled in schools in Greencastle, 1 (2.0%) attend a private institution, while the remaining 49 (98.0%) are enrolled in public schools. The age group of 25 to 34 year olds has the highest likelihood of being enrolled in private schools, with 1 (50.0% in the age bracket) enrolled. Conversely, the age group of 3 to 4 year olds has the lowest likelihood of being enrolled in a private school, with 3 (100.0% in the age bracket) attending a public institution.
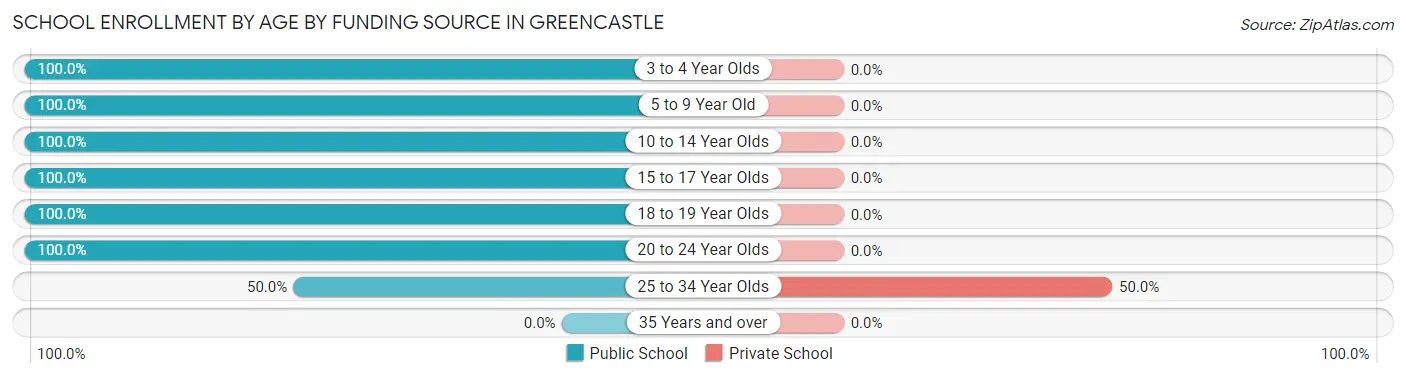
| Age Bracket | Public School | Private School |
| 3 to 4 Year Olds | 3 (100.0%) | 0 (0.0%) |
| 5 to 9 Year Old | 7 (100.0%) | 0 (0.0%) |
| 10 to 14 Year Olds | 2 (100.0%) | 0 (0.0%) |
| 15 to 17 Year Olds | 2 (100.0%) | 0 (0.0%) |
| 18 to 19 Year Olds | 19 (100.0%) | 0 (0.0%) |
| 20 to 24 Year Olds | 15 (100.0%) | 0 (0.0%) |
| 25 to 34 Year Olds | 1 (50.0%) | 1 (50.0%) |
| 35 Years and over | 0 (0.0%) | 0 (0.0%) |
| Total | 49 (98.0%) | 1 (2.0%) |
Educational Attainment by Field of Study in Greencastle
Business (24 | 54.5%), education (10 | 22.7%), arts & humanities (5 | 11.4%), bio, nature & agricultural (2 | 4.5%), and engineering (2 | 4.5%) are the most common fields of study among 44 individuals in Greencastle who have obtained a bachelor's degree or higher.
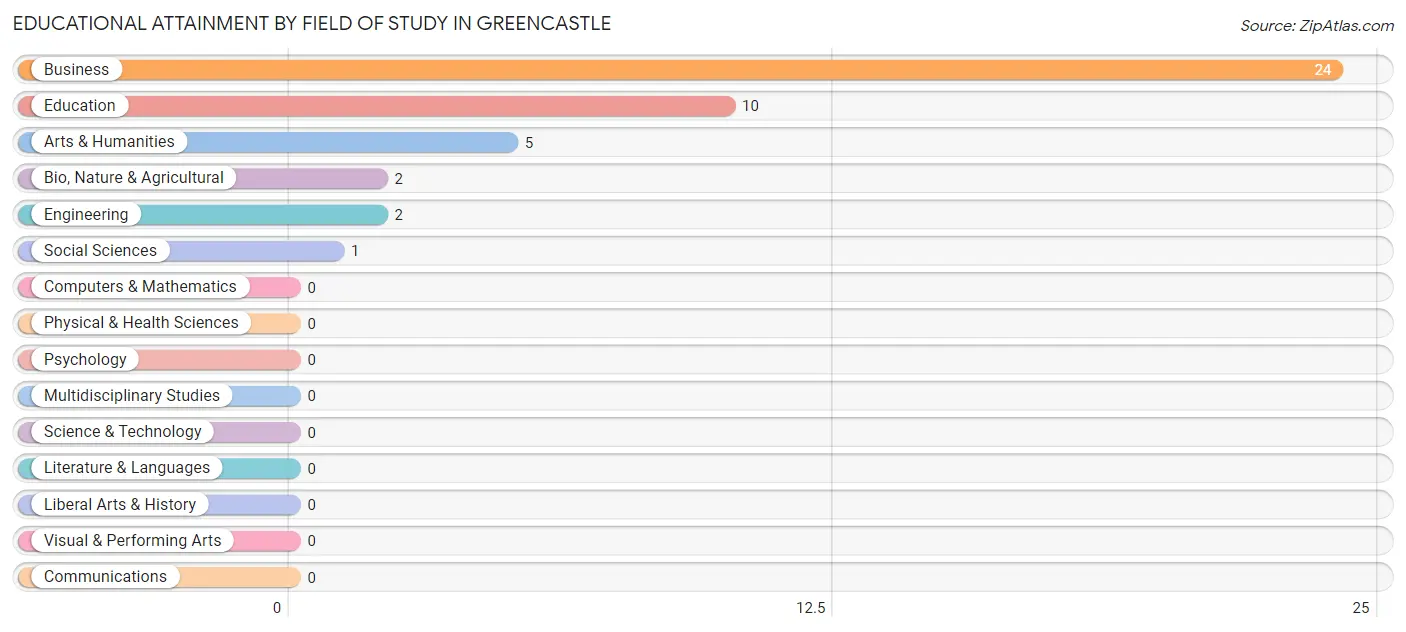
| Field of Study | # Graduates | % Graduates |
| Computers & Mathematics | 0 | 0.0% |
| Bio, Nature & Agricultural | 2 | 4.5% |
| Physical & Health Sciences | 0 | 0.0% |
| Psychology | 0 | 0.0% |
| Social Sciences | 1 | 2.3% |
| Engineering | 2 | 4.5% |
| Multidisciplinary Studies | 0 | 0.0% |
| Science & Technology | 0 | 0.0% |
| Business | 24 | 54.5% |
| Education | 10 | 22.7% |
| Literature & Languages | 0 | 0.0% |
| Liberal Arts & History | 0 | 0.0% |
| Visual & Performing Arts | 0 | 0.0% |
| Communications | 0 | 0.0% |
| Arts & Humanities | 5 | 11.4% |
| Total | 44 | 100.0% |
Transportation & Commute in Greencastle
Vehicle Availability by Sex in Greencastle
The most prevalent vehicle ownership categories in Greencastle are males with 2 vehicles (26, accounting for 51.0%) and females with 2 vehicles (29, making up 33.3%).
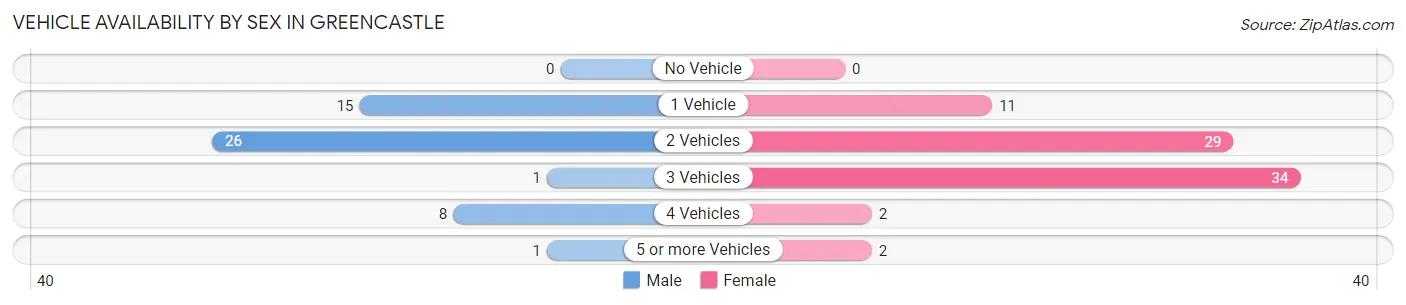
| Vehicles Available | Male | Female |
| No Vehicle | 0 (0.0%) | 0 (0.0%) |
| 1 Vehicle | 15 (29.4%) | 11 (14.1%) |
| 2 Vehicles | 26 (51.0%) | 29 (37.2%) |
| 3 Vehicles | 1 (2.0%) | 34 (43.6%) |
| 4 Vehicles | 8 (15.7%) | 2 (2.6%) |
| 5 or more Vehicles | 1 (2.0%) | 2 (2.6%) |
| Total | 51 (100.0%) | 78 (100.0%) |
Commute Time in Greencastle
The most frequently occuring commute durations in Greencastle are 25 to 29 minutes (37 commuters, 29.4%), 30 to 34 minutes (30 commuters, 23.8%), and 20 to 24 minutes (29 commuters, 23.0%).
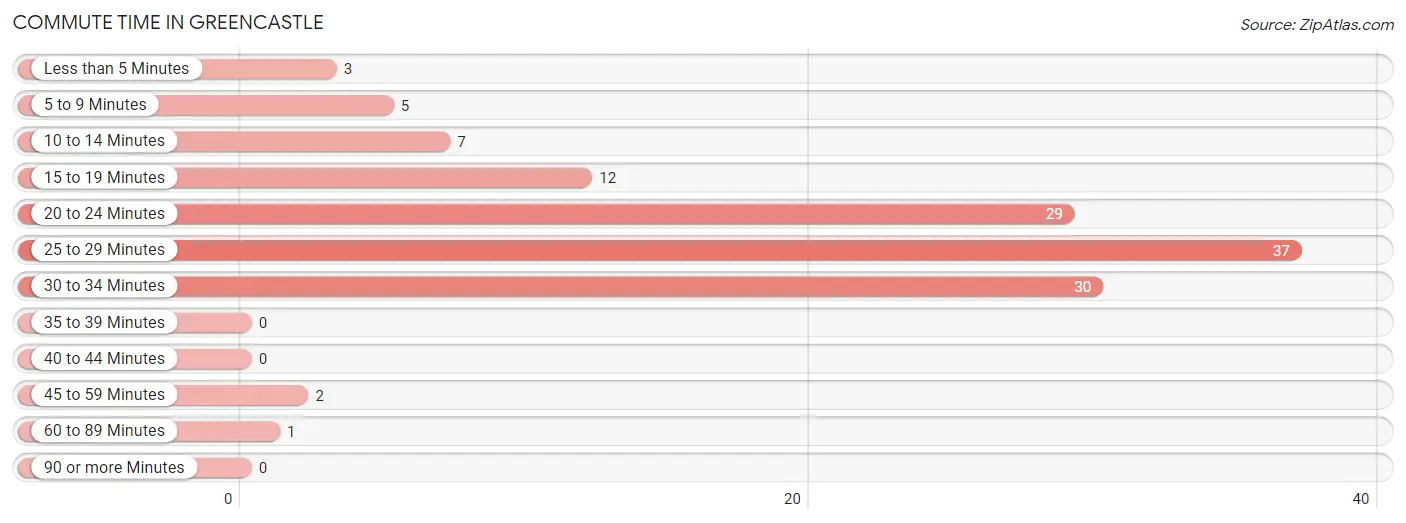
| Commute Time | # Commuters | % Commuters |
| Less than 5 Minutes | 3 | 2.4% |
| 5 to 9 Minutes | 5 | 4.0% |
| 10 to 14 Minutes | 7 | 5.6% |
| 15 to 19 Minutes | 12 | 9.5% |
| 20 to 24 Minutes | 29 | 23.0% |
| 25 to 29 Minutes | 37 | 29.4% |
| 30 to 34 Minutes | 30 | 23.8% |
| 35 to 39 Minutes | 0 | 0.0% |
| 40 to 44 Minutes | 0 | 0.0% |
| 45 to 59 Minutes | 2 | 1.6% |
| 60 to 89 Minutes | 1 | 0.8% |
| 90 or more Minutes | 0 | 0.0% |
Commute Time by Sex in Greencastle
The most common commute times in Greencastle are 20 to 24 minutes (23 commuters, 45.1%) for males and 25 to 29 minutes (32 commuters, 42.7%) for females.
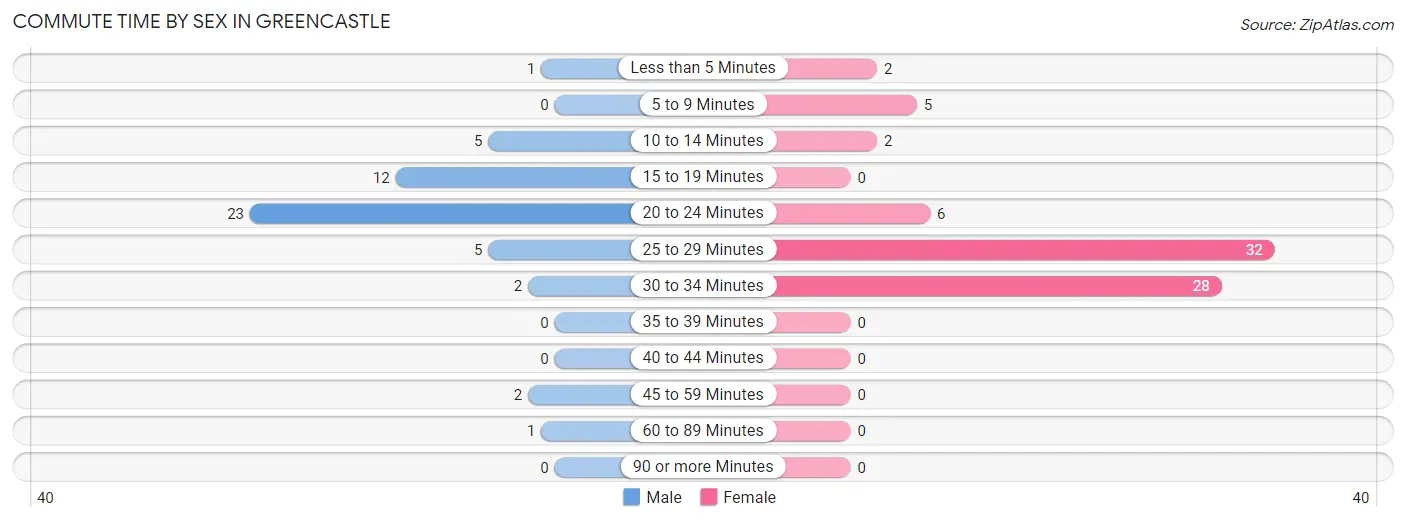
| Commute Time | Male | Female |
| Less than 5 Minutes | 1 (2.0%) | 2 (2.7%) |
| 5 to 9 Minutes | 0 (0.0%) | 5 (6.7%) |
| 10 to 14 Minutes | 5 (9.8%) | 2 (2.7%) |
| 15 to 19 Minutes | 12 (23.5%) | 0 (0.0%) |
| 20 to 24 Minutes | 23 (45.1%) | 6 (8.0%) |
| 25 to 29 Minutes | 5 (9.8%) | 32 (42.7%) |
| 30 to 34 Minutes | 2 (3.9%) | 28 (37.3%) |
| 35 to 39 Minutes | 0 (0.0%) | 0 (0.0%) |
| 40 to 44 Minutes | 0 (0.0%) | 0 (0.0%) |
| 45 to 59 Minutes | 2 (3.9%) | 0 (0.0%) |
| 60 to 89 Minutes | 1 (2.0%) | 0 (0.0%) |
| 90 or more Minutes | 0 (0.0%) | 0 (0.0%) |
Time of Departure to Work by Sex in Greencastle
The most frequent times of departure to work in Greencastle are 5:30 AM to 5:59 AM (13, 25.5%) for males and 8:30 AM to 8:59 AM (23, 30.7%) for females.
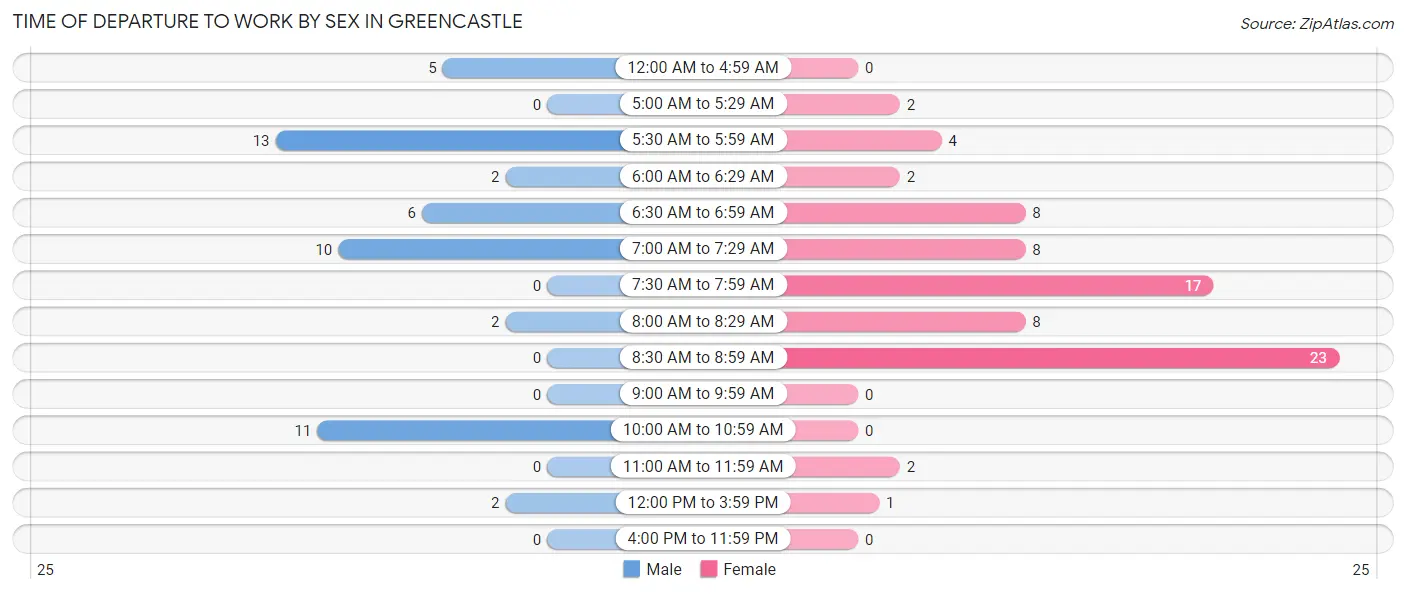
| Time of Departure | Male | Female |
| 12:00 AM to 4:59 AM | 5 (9.8%) | 0 (0.0%) |
| 5:00 AM to 5:29 AM | 0 (0.0%) | 2 (2.7%) |
| 5:30 AM to 5:59 AM | 13 (25.5%) | 4 (5.3%) |
| 6:00 AM to 6:29 AM | 2 (3.9%) | 2 (2.7%) |
| 6:30 AM to 6:59 AM | 6 (11.8%) | 8 (10.7%) |
| 7:00 AM to 7:29 AM | 10 (19.6%) | 8 (10.7%) |
| 7:30 AM to 7:59 AM | 0 (0.0%) | 17 (22.7%) |
| 8:00 AM to 8:29 AM | 2 (3.9%) | 8 (10.7%) |
| 8:30 AM to 8:59 AM | 0 (0.0%) | 23 (30.7%) |
| 9:00 AM to 9:59 AM | 0 (0.0%) | 0 (0.0%) |
| 10:00 AM to 10:59 AM | 11 (21.6%) | 0 (0.0%) |
| 11:00 AM to 11:59 AM | 0 (0.0%) | 2 (2.7%) |
| 12:00 PM to 3:59 PM | 2 (3.9%) | 1 (1.3%) |
| 4:00 PM to 11:59 PM | 0 (0.0%) | 0 (0.0%) |
| Total | 51 (100.0%) | 75 (100.0%) |
Housing Occupancy in Greencastle
Occupancy by Ownership in Greencastle
Of the total 96 dwellings in Greencastle, owner-occupied units account for 62 (64.6%), while renter-occupied units make up 34 (35.4%).
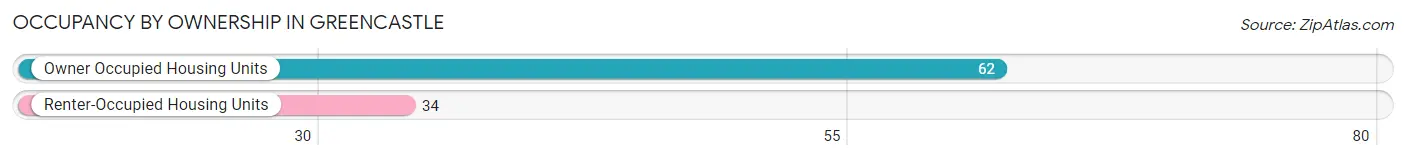
| Occupancy | # Housing Units | % Housing Units |
| Owner Occupied Housing Units | 62 | 64.6% |
| Renter-Occupied Housing Units | 34 | 35.4% |
| Total Occupied Housing Units | 96 | 100.0% |
Occupancy by Household Size in Greencastle
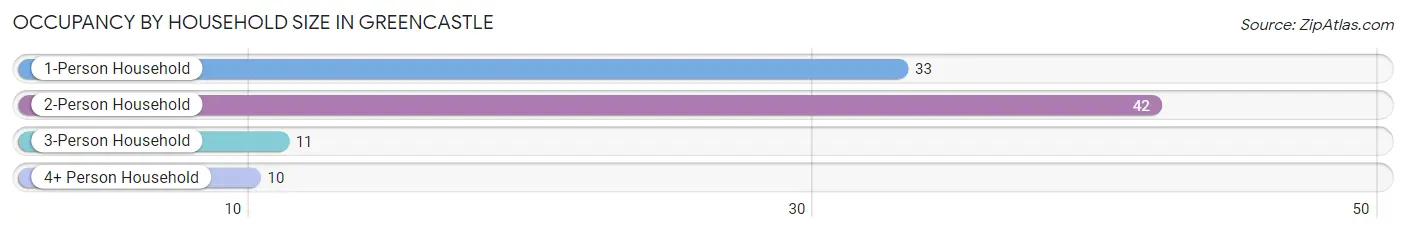
| Household Size | # Housing Units | % Housing Units |
| 1-Person Household | 33 | 34.4% |
| 2-Person Household | 42 | 43.8% |
| 3-Person Household | 11 | 11.5% |
| 4+ Person Household | 10 | 10.4% |
| Total Housing Units | 96 | 100.0% |
Occupancy by Ownership by Household Size in Greencastle
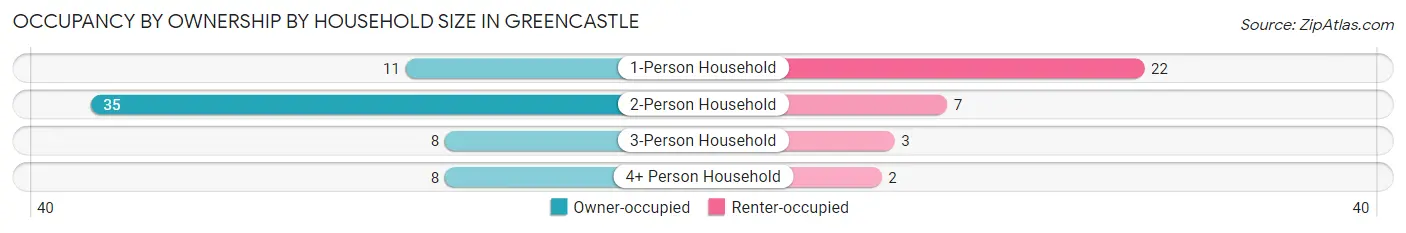
| Household Size | Owner-occupied | Renter-occupied |
| 1-Person Household | 11 (33.3%) | 22 (66.7%) |
| 2-Person Household | 35 (83.3%) | 7 (16.7%) |
| 3-Person Household | 8 (72.7%) | 3 (27.3%) |
| 4+ Person Household | 8 (80.0%) | 2 (20.0%) |
| Total Housing Units | 62 (64.6%) | 34 (35.4%) |
Occupancy by Educational Attainment in Greencastle
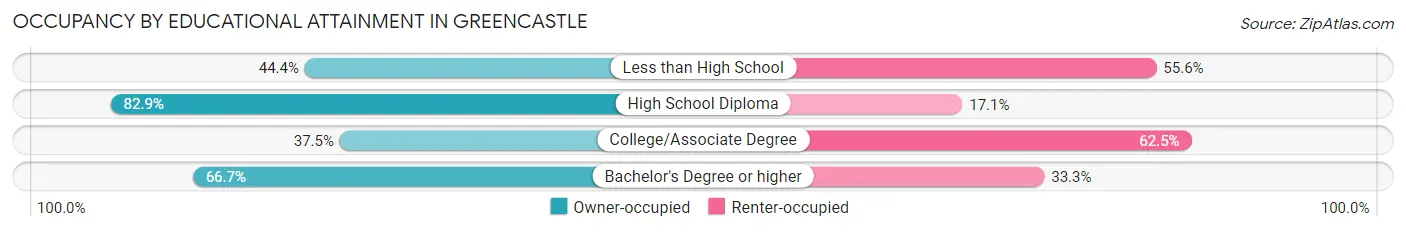
| Household Size | Owner-occupied | Renter-occupied |
| Less than High School | 8 (44.4%) | 10 (55.6%) |
| High School Diploma | 34 (82.9%) | 7 (17.1%) |
| College/Associate Degree | 6 (37.5%) | 10 (62.5%) |
| Bachelor's Degree or higher | 14 (66.7%) | 7 (33.3%) |
Occupancy by Age of Householder in Greencastle
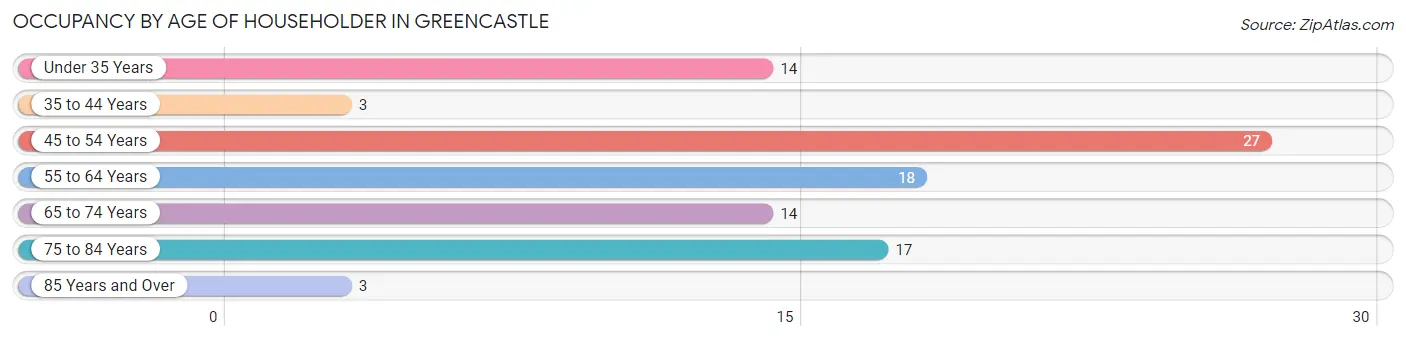
| Age Bracket | # Households | % Households |
| Under 35 Years | 14 | 14.6% |
| 35 to 44 Years | 3 | 3.1% |
| 45 to 54 Years | 27 | 28.1% |
| 55 to 64 Years | 18 | 18.8% |
| 65 to 74 Years | 14 | 14.6% |
| 75 to 84 Years | 17 | 17.7% |
| 85 Years and Over | 3 | 3.1% |
| Total | 96 | 100.0% |
Housing Finances in Greencastle
Median Income by Occupancy in Greencastle
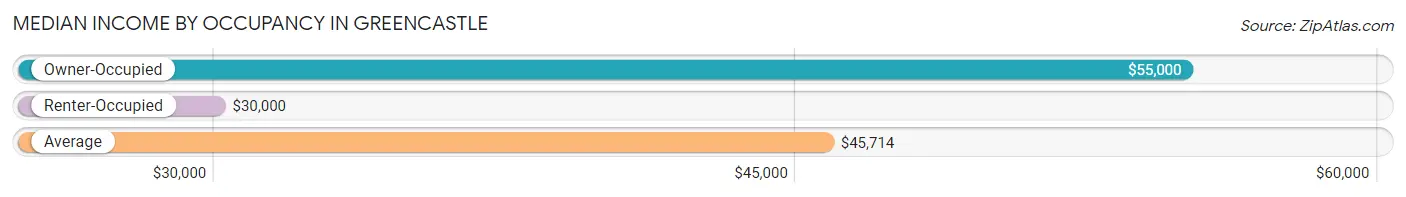
| Occupancy Type | # Households | Median Income |
| Owner-Occupied | 62 (64.6%) | $55,000 |
| Renter-Occupied | 34 (35.4%) | $30,000 |
| Average | 96 (100.0%) | $45,714 |
Occupancy by Householder Income Bracket in Greencastle
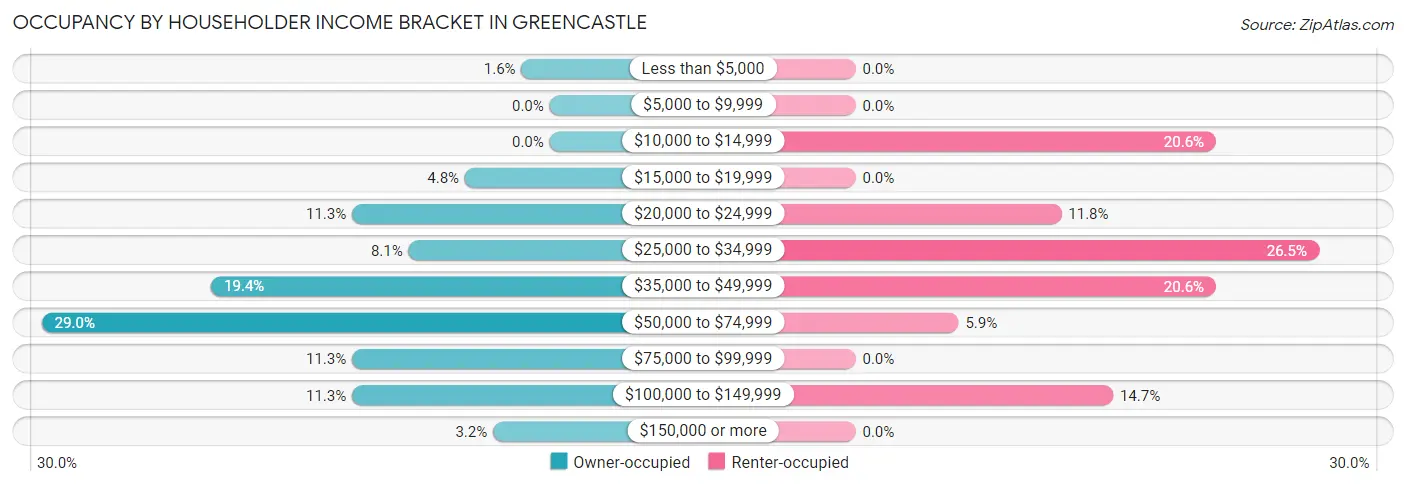
| Income Bracket | Owner-occupied | Renter-occupied |
| Less than $5,000 | 1 (1.6%) | 0 (0.0%) |
| $5,000 to $9,999 | 0 (0.0%) | 0 (0.0%) |
| $10,000 to $14,999 | 0 (0.0%) | 7 (20.6%) |
| $15,000 to $19,999 | 3 (4.8%) | 0 (0.0%) |
| $20,000 to $24,999 | 7 (11.3%) | 4 (11.8%) |
| $25,000 to $34,999 | 5 (8.1%) | 9 (26.5%) |
| $35,000 to $49,999 | 12 (19.4%) | 7 (20.6%) |
| $50,000 to $74,999 | 18 (29.0%) | 2 (5.9%) |
| $75,000 to $99,999 | 7 (11.3%) | 0 (0.0%) |
| $100,000 to $149,999 | 7 (11.3%) | 5 (14.7%) |
| $150,000 or more | 2 (3.2%) | 0 (0.0%) |
| Total | 62 (100.0%) | 34 (100.0%) |
Monthly Housing Cost Tiers in Greencastle
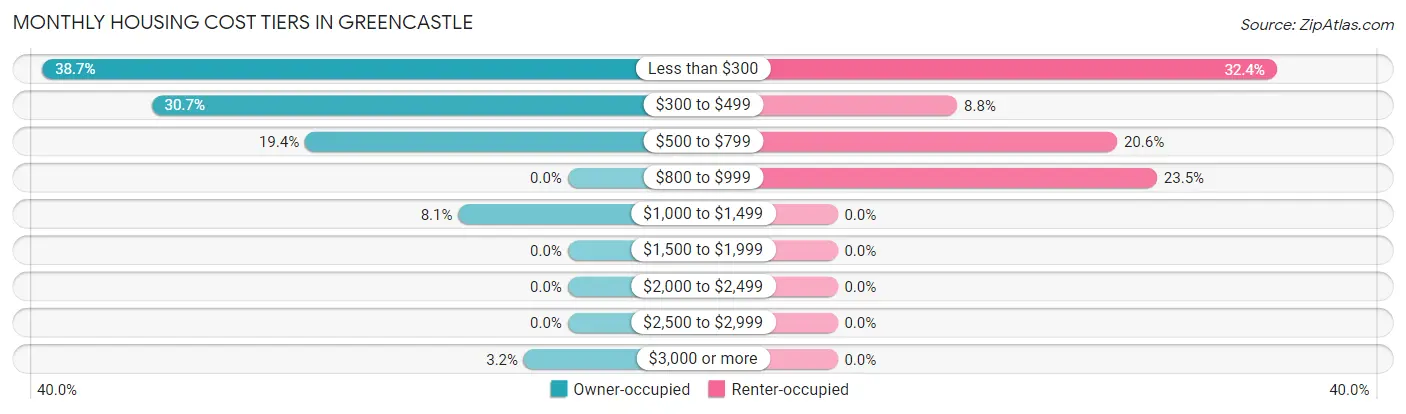
| Monthly Cost | Owner-occupied | Renter-occupied |
| Less than $300 | 24 (38.7%) | 11 (32.4%) |
| $300 to $499 | 19 (30.6%) | 3 (8.8%) |
| $500 to $799 | 12 (19.4%) | 7 (20.6%) |
| $800 to $999 | 0 (0.0%) | 8 (23.5%) |
| $1,000 to $1,499 | 5 (8.1%) | 0 (0.0%) |
| $1,500 to $1,999 | 0 (0.0%) | 0 (0.0%) |
| $2,000 to $2,499 | 0 (0.0%) | 0 (0.0%) |
| $2,500 to $2,999 | 0 (0.0%) | 0 (0.0%) |
| $3,000 or more | 2 (3.2%) | 0 (0.0%) |
| Total | 62 (100.0%) | 34 (100.0%) |
Physical Housing Characteristics in Greencastle
Housing Structures in Greencastle
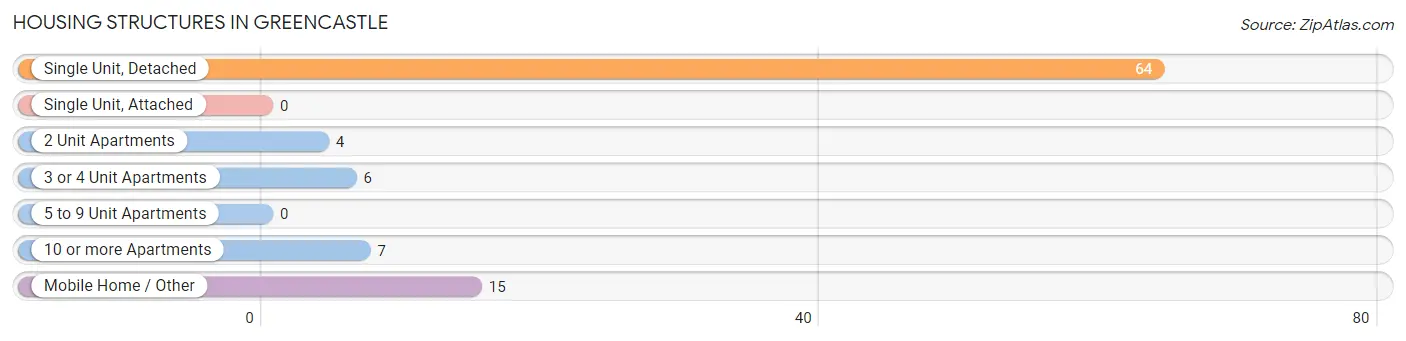
| Structure Type | # Housing Units | % Housing Units |
| Single Unit, Detached | 64 | 66.7% |
| Single Unit, Attached | 0 | 0.0% |
| 2 Unit Apartments | 4 | 4.2% |
| 3 or 4 Unit Apartments | 6 | 6.2% |
| 5 to 9 Unit Apartments | 0 | 0.0% |
| 10 or more Apartments | 7 | 7.3% |
| Mobile Home / Other | 15 | 15.6% |
| Total | 96 | 100.0% |
Housing Structures by Occupancy in Greencastle
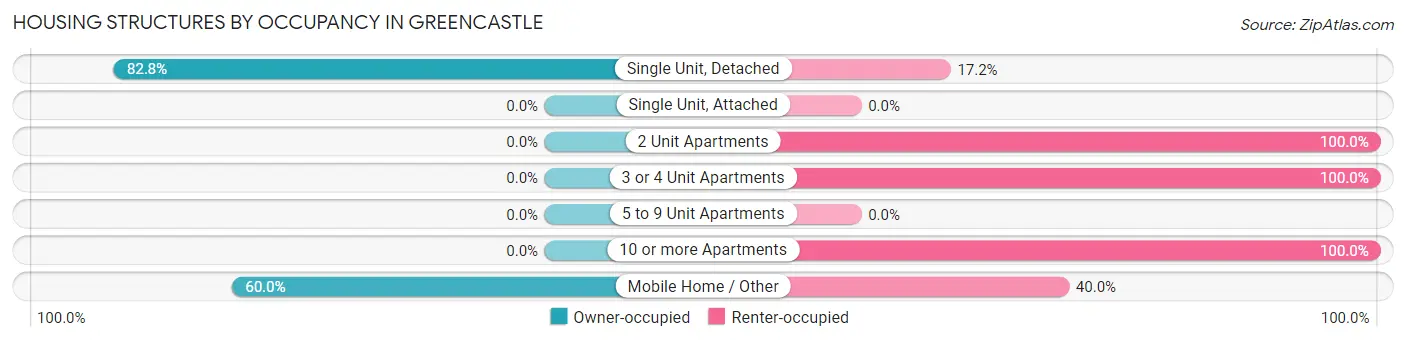
| Structure Type | Owner-occupied | Renter-occupied |
| Single Unit, Detached | 53 (82.8%) | 11 (17.2%) |
| Single Unit, Attached | 0 (0.0%) | 0 (0.0%) |
| 2 Unit Apartments | 0 (0.0%) | 4 (100.0%) |
| 3 or 4 Unit Apartments | 0 (0.0%) | 6 (100.0%) |
| 5 to 9 Unit Apartments | 0 (0.0%) | 0 (0.0%) |
| 10 or more Apartments | 0 (0.0%) | 7 (100.0%) |
| Mobile Home / Other | 9 (60.0%) | 6 (40.0%) |
| Total | 62 (64.6%) | 34 (35.4%) |
Housing Structures by Number of Rooms in Greencastle
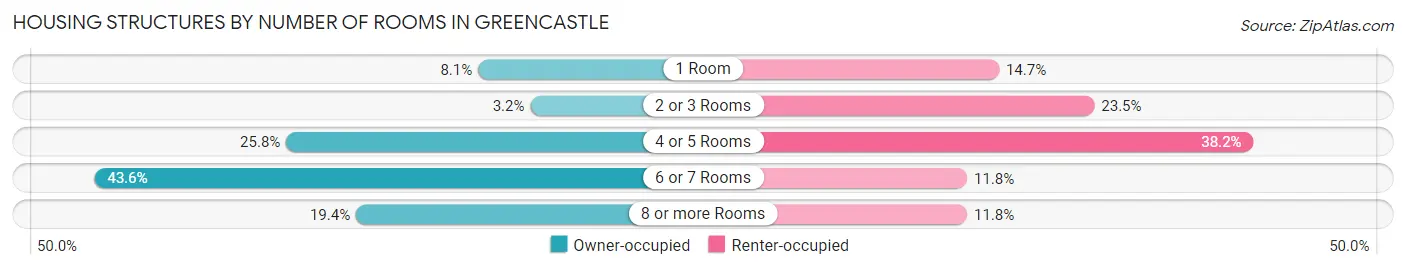
| Number of Rooms | Owner-occupied | Renter-occupied |
| 1 Room | 5 (8.1%) | 5 (14.7%) |
| 2 or 3 Rooms | 2 (3.2%) | 8 (23.5%) |
| 4 or 5 Rooms | 16 (25.8%) | 13 (38.2%) |
| 6 or 7 Rooms | 27 (43.5%) | 4 (11.8%) |
| 8 or more Rooms | 12 (19.4%) | 4 (11.8%) |
| Total | 62 (100.0%) | 34 (100.0%) |
Housing Structure by Heating Type in Greencastle
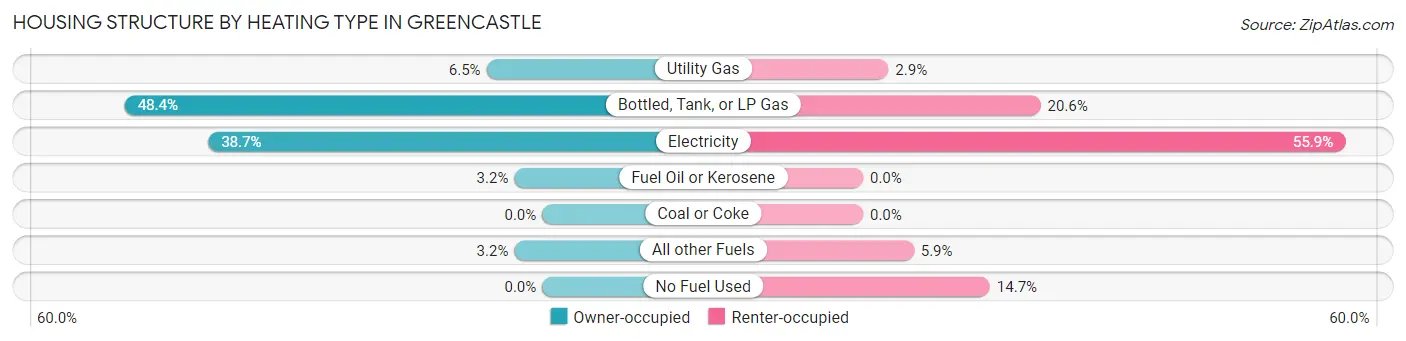
| Heating Type | Owner-occupied | Renter-occupied |
| Utility Gas | 4 (6.5%) | 1 (2.9%) |
| Bottled, Tank, or LP Gas | 30 (48.4%) | 7 (20.6%) |
| Electricity | 24 (38.7%) | 19 (55.9%) |
| Fuel Oil or Kerosene | 2 (3.2%) | 0 (0.0%) |
| Coal or Coke | 0 (0.0%) | 0 (0.0%) |
| All other Fuels | 2 (3.2%) | 2 (5.9%) |
| No Fuel Used | 0 (0.0%) | 5 (14.7%) |
| Total | 62 (100.0%) | 34 (100.0%) |
Household Vehicle Usage in Greencastle
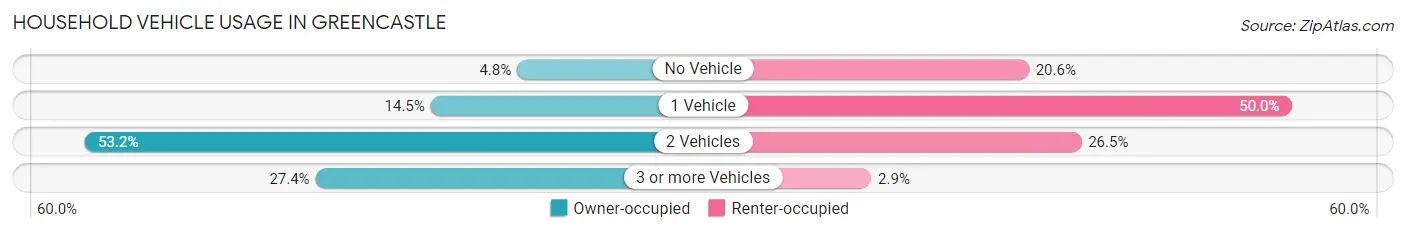
| Vehicles per Household | Owner-occupied | Renter-occupied |
| No Vehicle | 3 (4.8%) | 7 (20.6%) |
| 1 Vehicle | 9 (14.5%) | 17 (50.0%) |
| 2 Vehicles | 33 (53.2%) | 9 (26.5%) |
| 3 or more Vehicles | 17 (27.4%) | 1 (2.9%) |
| Total | 62 (100.0%) | 34 (100.0%) |
Real Estate & Mortgages in Greencastle
Real Estate and Mortgage Overview in Greencastle
| Characteristic | Without Mortgage | With Mortgage |
| Housing Units | 41 | 21 |
| Median Property Value | $31,800 | $0 |
| Median Household Income | $41,563 | $2 |
| Monthly Housing Costs | $291 | $2 |
| Real Estate Taxes | $438 | $0 |
Property Value by Mortgage Status in Greencastle
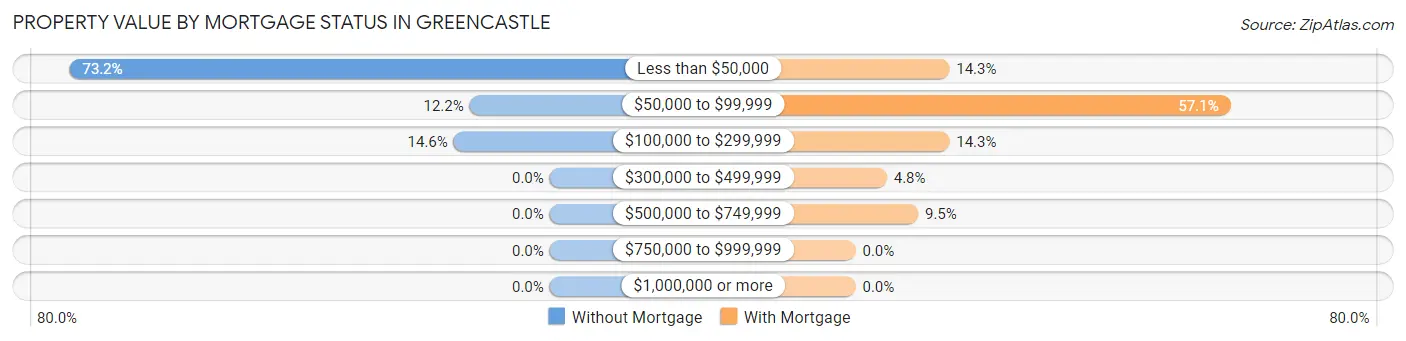
| Property Value | Without Mortgage | With Mortgage |
| Less than $50,000 | 30 (73.2%) | 3 (14.3%) |
| $50,000 to $99,999 | 5 (12.2%) | 12 (57.1%) |
| $100,000 to $299,999 | 6 (14.6%) | 3 (14.3%) |
| $300,000 to $499,999 | 0 (0.0%) | 1 (4.8%) |
| $500,000 to $749,999 | 0 (0.0%) | 2 (9.5%) |
| $750,000 to $999,999 | 0 (0.0%) | 0 (0.0%) |
| $1,000,000 or more | 0 (0.0%) | 0 (0.0%) |
| Total | 41 (100.0%) | 21 (100.0%) |
Household Income by Mortgage Status in Greencastle
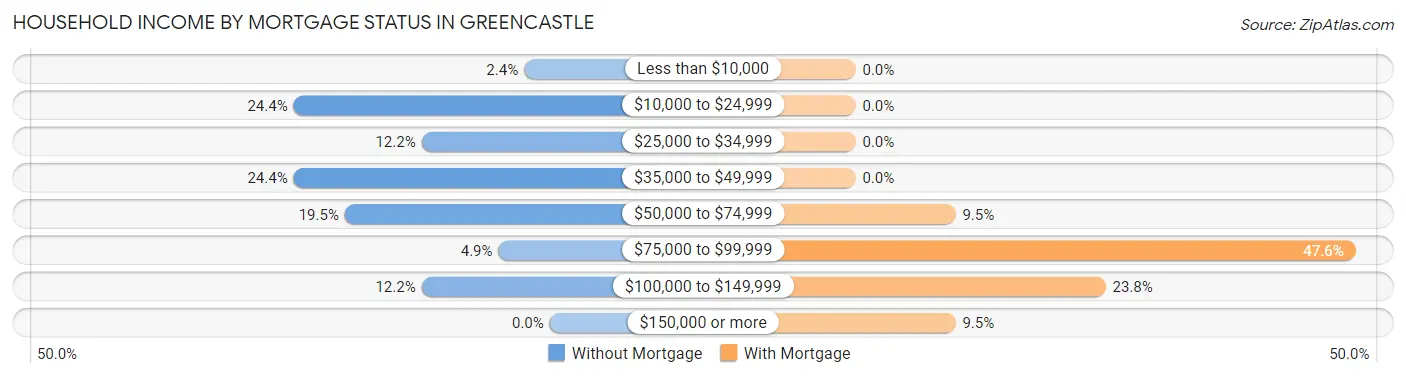
| Household Income | Without Mortgage | With Mortgage |
| Less than $10,000 | 1 (2.4%) | 0 (0.0%) |
| $10,000 to $24,999 | 10 (24.4%) | 0 (0.0%) |
| $25,000 to $34,999 | 5 (12.2%) | 0 (0.0%) |
| $35,000 to $49,999 | 10 (24.4%) | 0 (0.0%) |
| $50,000 to $74,999 | 8 (19.5%) | 2 (9.5%) |
| $75,000 to $99,999 | 2 (4.9%) | 10 (47.6%) |
| $100,000 to $149,999 | 5 (12.2%) | 5 (23.8%) |
| $150,000 or more | 0 (0.0%) | 2 (9.5%) |
| Total | 41 (100.0%) | 21 (100.0%) |
Property Value to Household Income Ratio in Greencastle
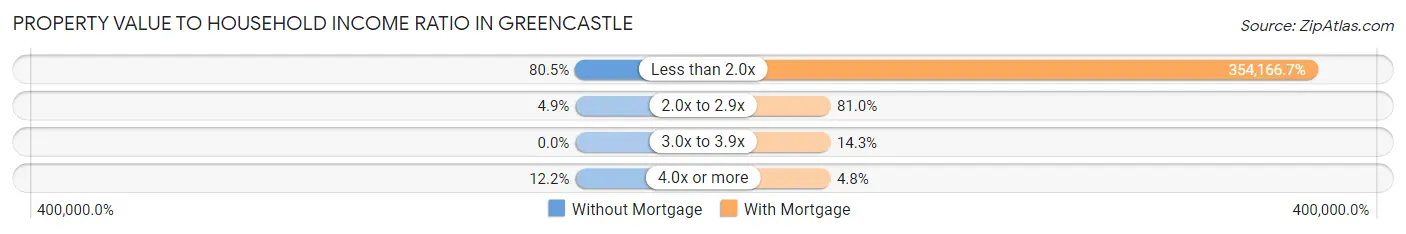
| Value-to-Income Ratio | Without Mortgage | With Mortgage |
| Less than 2.0x | 33 (80.5%) | 74,375 (354,166.7%) |
| 2.0x to 2.9x | 2 (4.9%) | 17 (80.9%) |
| 3.0x to 3.9x | 0 (0.0%) | 3 (14.3%) |
| 4.0x or more | 5 (12.2%) | 1 (4.8%) |
| Total | 41 (100.0%) | 21 (100.0%) |
Real Estate Taxes by Mortgage Status in Greencastle
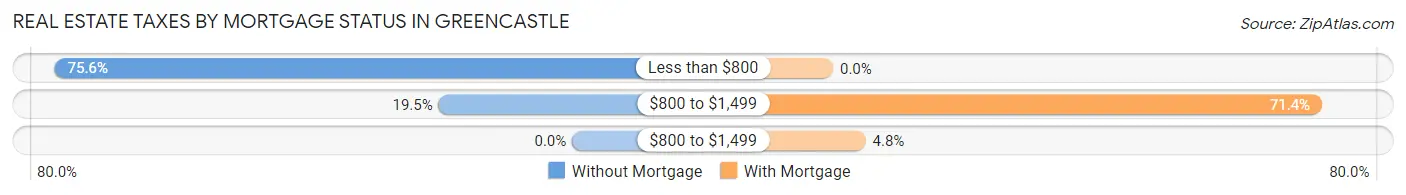
| Property Taxes | Without Mortgage | With Mortgage |
| Less than $800 | 31 (75.6%) | 0 (0.0%) |
| $800 to $1,499 | 8 (19.5%) | 15 (71.4%) |
| $800 to $1,499 | 0 (0.0%) | 1 (4.8%) |
| Total | 41 (100.0%) | 21 (100.0%) |
Health & Disability in Greencastle
Health Insurance Coverage by Age in Greencastle
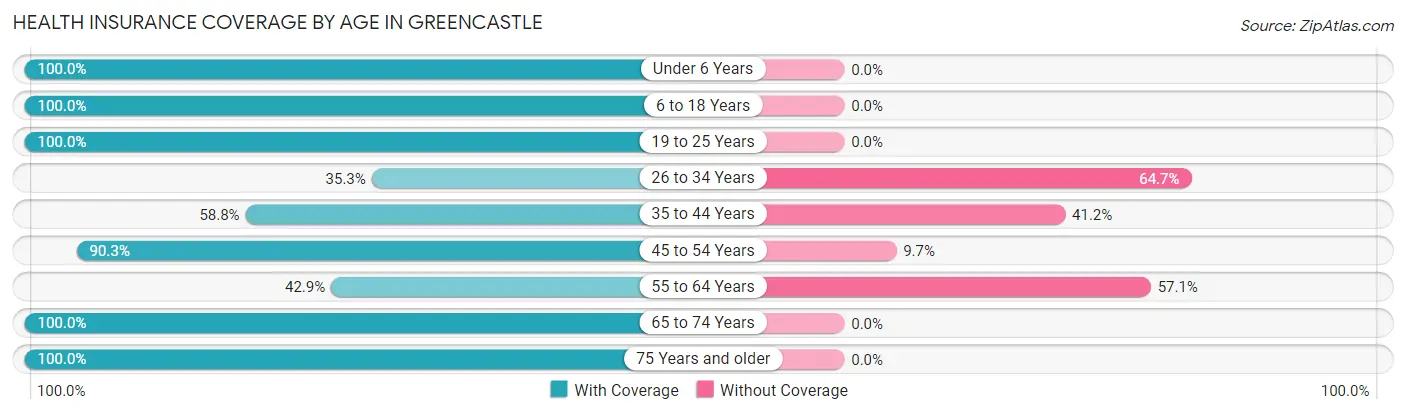
| Age Bracket | With Coverage | Without Coverage |
| Under 6 Years | 15 (100.0%) | 0 (0.0%) |
| 6 to 18 Years | 9 (100.0%) | 0 (0.0%) |
| 19 to 25 Years | 50 (100.0%) | 0 (0.0%) |
| 26 to 34 Years | 6 (35.3%) | 11 (64.7%) |
| 35 to 44 Years | 10 (58.8%) | 7 (41.2%) |
| 45 to 54 Years | 56 (90.3%) | 6 (9.7%) |
| 55 to 64 Years | 33 (42.9%) | 44 (57.1%) |
| 65 to 74 Years | 21 (100.0%) | 0 (0.0%) |
| 75 Years and older | 30 (100.0%) | 0 (0.0%) |
| Total | 230 (77.2%) | 68 (22.8%) |
Health Insurance Coverage by Citizenship Status in Greencastle
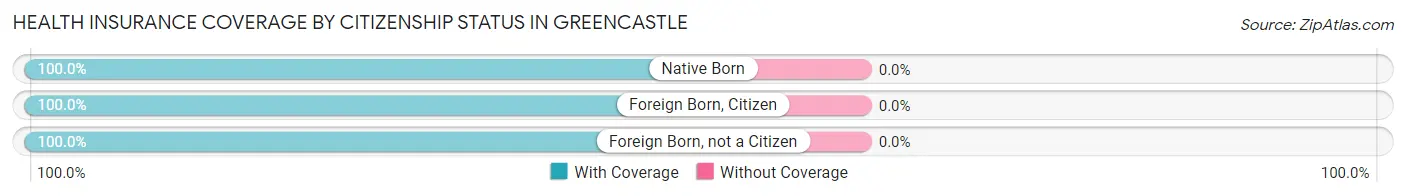
| Citizenship Status | With Coverage | Without Coverage |
| Native Born | 15 (100.0%) | 0 (0.0%) |
| Foreign Born, Citizen | 9 (100.0%) | 0 (0.0%) |
| Foreign Born, not a Citizen | 50 (100.0%) | 0 (0.0%) |
Health Insurance Coverage by Household Income in Greencastle
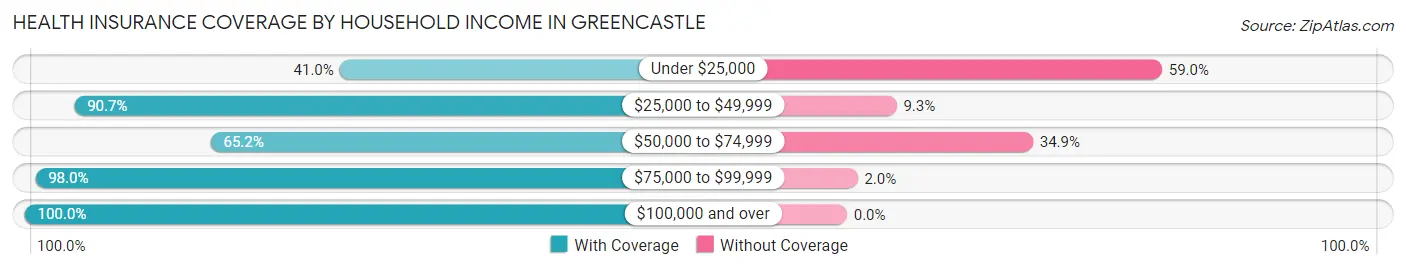
| Household Income | With Coverage | Without Coverage |
| Under $25,000 | 25 (41.0%) | 36 (59.0%) |
| $25,000 to $49,999 | 78 (90.7%) | 8 (9.3%) |
| $50,000 to $74,999 | 43 (65.1%) | 23 (34.8%) |
| $75,000 to $99,999 | 49 (98.0%) | 1 (2.0%) |
| $100,000 and over | 35 (100.0%) | 0 (0.0%) |
Public vs Private Health Insurance Coverage by Age in Greencastle
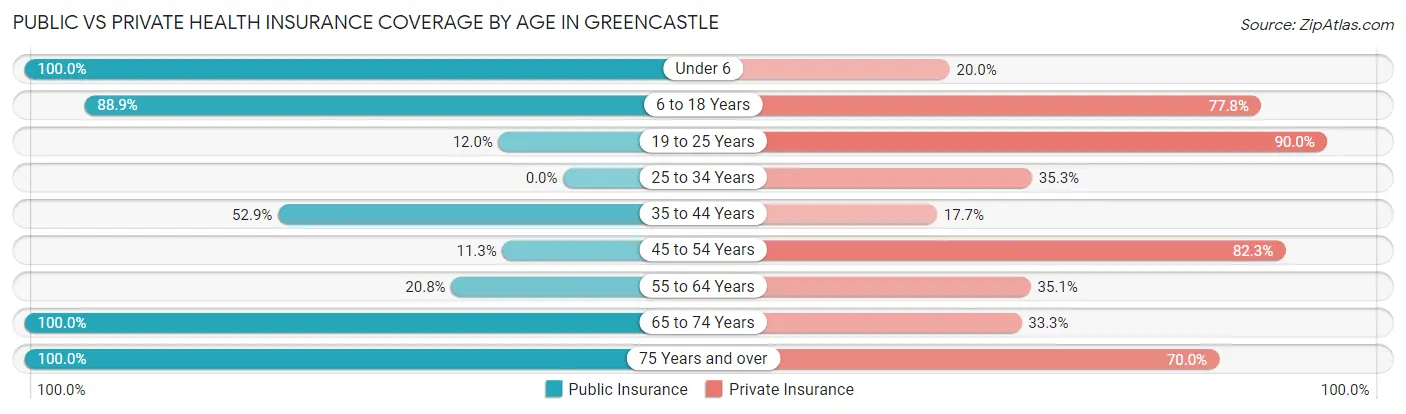
| Age Bracket | Public Insurance | Private Insurance |
| Under 6 | 15 (100.0%) | 3 (20.0%) |
| 6 to 18 Years | 8 (88.9%) | 7 (77.8%) |
| 19 to 25 Years | 6 (12.0%) | 45 (90.0%) |
| 25 to 34 Years | 0 (0.0%) | 6 (35.3%) |
| 35 to 44 Years | 9 (52.9%) | 3 (17.6%) |
| 45 to 54 Years | 7 (11.3%) | 51 (82.3%) |
| 55 to 64 Years | 16 (20.8%) | 27 (35.1%) |
| 65 to 74 Years | 21 (100.0%) | 7 (33.3%) |
| 75 Years and over | 30 (100.0%) | 21 (70.0%) |
| Total | 112 (37.6%) | 170 (57.1%) |
Disability Status by Sex by Age in Greencastle
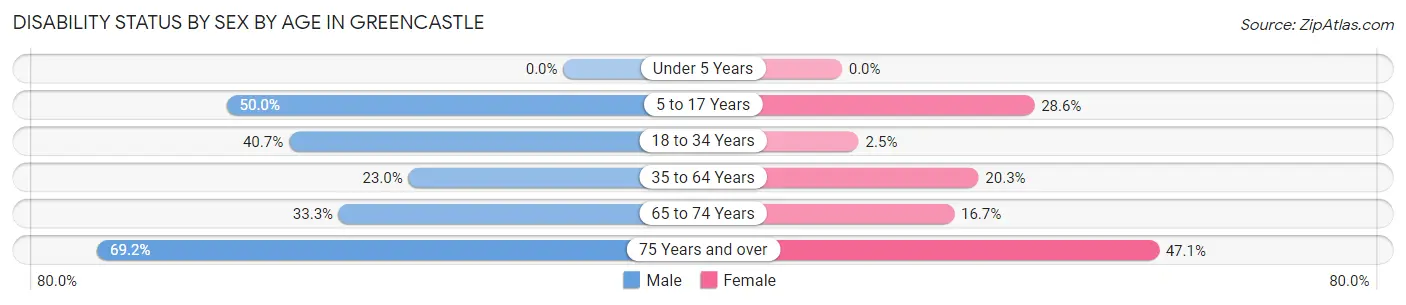
| Age Bracket | Male | Female |
| Under 5 Years | 0 (0.0%) | 0 (0.0%) |
| 5 to 17 Years | 2 (50.0%) | 2 (28.6%) |
| 18 to 34 Years | 11 (40.7%) | 1 (2.5%) |
| 35 to 64 Years | 20 (23.0%) | 14 (20.3%) |
| 65 to 74 Years | 3 (33.3%) | 2 (16.7%) |
| 75 Years and over | 9 (69.2%) | 8 (47.1%) |
Disability Class by Sex by Age in Greencastle
Disability Class: Hearing Difficulty
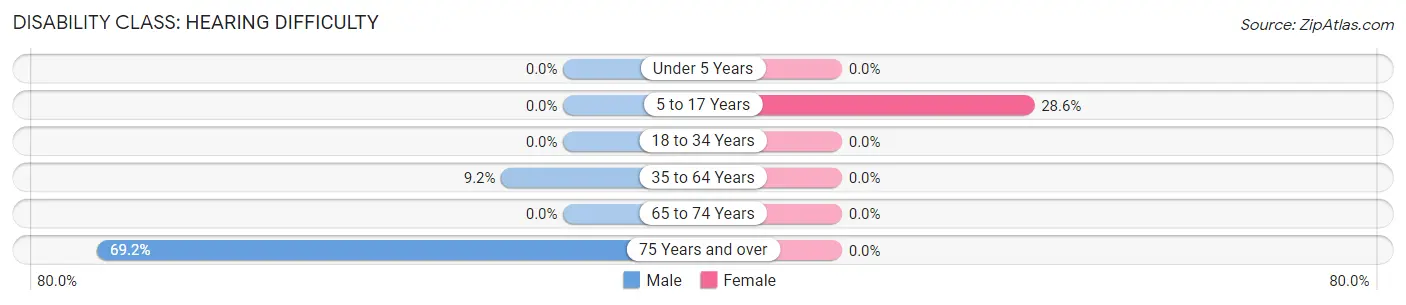
| Age Bracket | Male | Female |
| Under 5 Years | 0 (0.0%) | 0 (0.0%) |
| 5 to 17 Years | 0 (0.0%) | 2 (28.6%) |
| 18 to 34 Years | 0 (0.0%) | 0 (0.0%) |
| 35 to 64 Years | 8 (9.2%) | 0 (0.0%) |
| 65 to 74 Years | 0 (0.0%) | 0 (0.0%) |
| 75 Years and over | 9 (69.2%) | 0 (0.0%) |
Disability Class: Vision Difficulty
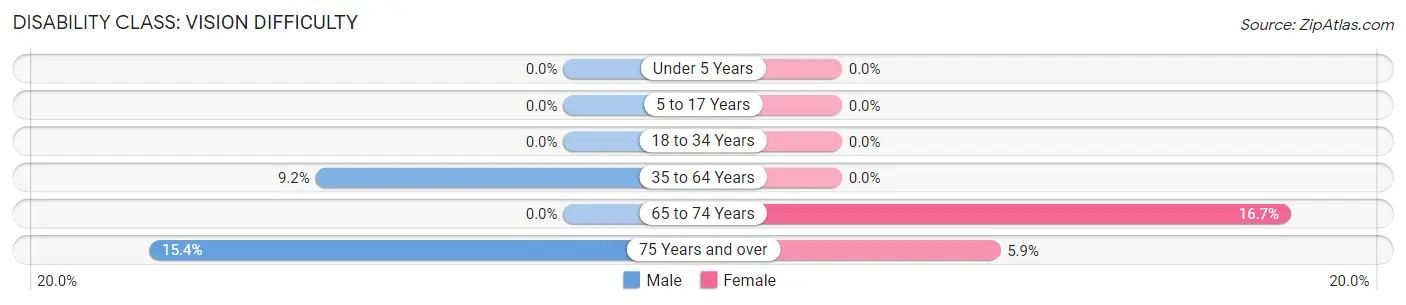
| Age Bracket | Male | Female |
| Under 5 Years | 0 (0.0%) | 0 (0.0%) |
| 5 to 17 Years | 0 (0.0%) | 0 (0.0%) |
| 18 to 34 Years | 0 (0.0%) | 0 (0.0%) |
| 35 to 64 Years | 8 (9.2%) | 0 (0.0%) |
| 65 to 74 Years | 0 (0.0%) | 2 (16.7%) |
| 75 Years and over | 2 (15.4%) | 1 (5.9%) |
Disability Class: Cognitive Difficulty
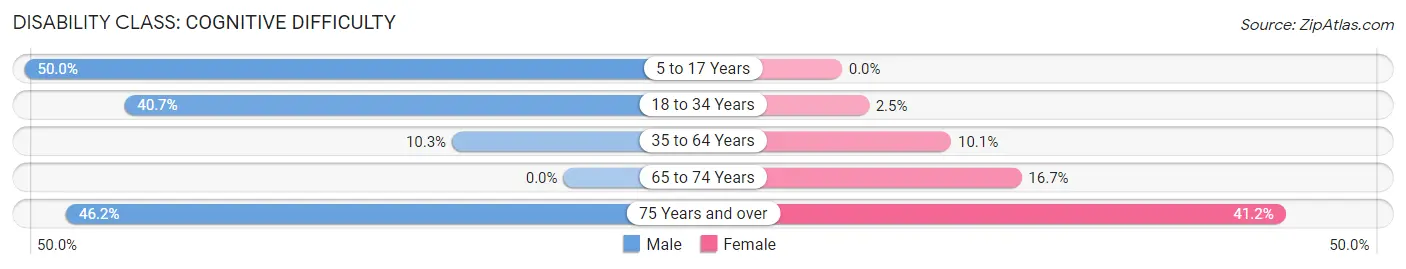
| Age Bracket | Male | Female |
| 5 to 17 Years | 2 (50.0%) | 0 (0.0%) |
| 18 to 34 Years | 11 (40.7%) | 1 (2.5%) |
| 35 to 64 Years | 9 (10.3%) | 7 (10.1%) |
| 65 to 74 Years | 0 (0.0%) | 2 (16.7%) |
| 75 Years and over | 6 (46.2%) | 7 (41.2%) |
Disability Class: Ambulatory Difficulty
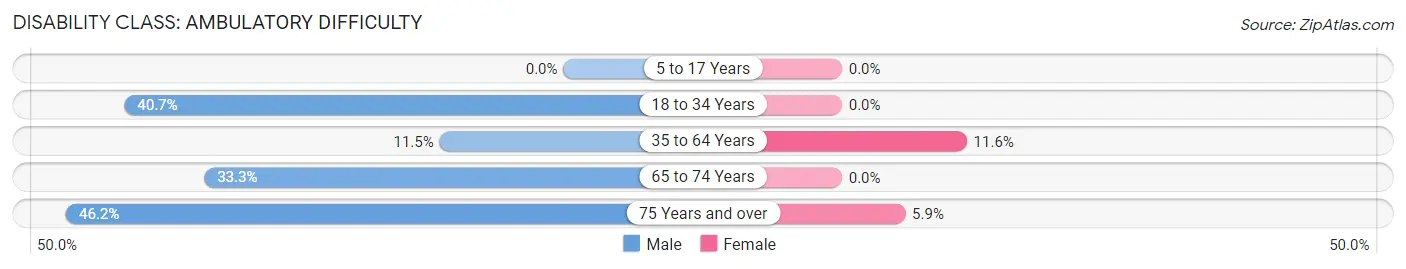
| Age Bracket | Male | Female |
| 5 to 17 Years | 0 (0.0%) | 0 (0.0%) |
| 18 to 34 Years | 11 (40.7%) | 0 (0.0%) |
| 35 to 64 Years | 10 (11.5%) | 8 (11.6%) |
| 65 to 74 Years | 3 (33.3%) | 0 (0.0%) |
| 75 Years and over | 6 (46.2%) | 1 (5.9%) |
Disability Class: Self-Care Difficulty
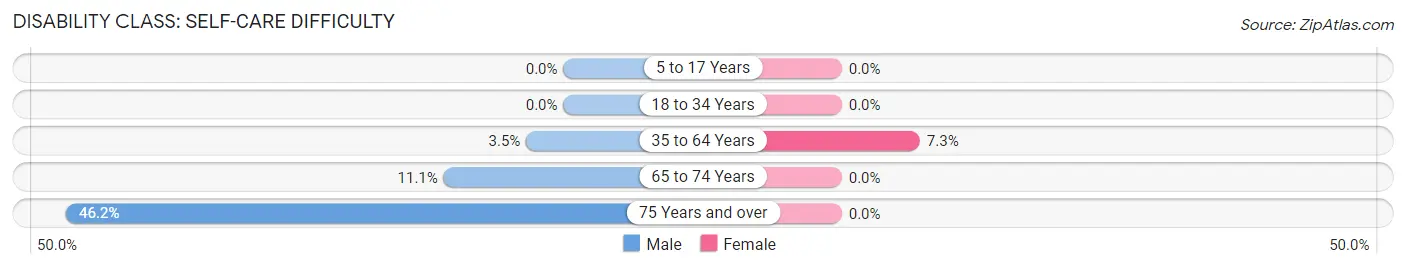
| Age Bracket | Male | Female |
| 5 to 17 Years | 0 (0.0%) | 0 (0.0%) |
| 18 to 34 Years | 0 (0.0%) | 0 (0.0%) |
| 35 to 64 Years | 3 (3.5%) | 5 (7.2%) |
| 65 to 74 Years | 1 (11.1%) | 0 (0.0%) |
| 75 Years and over | 6 (46.2%) | 0 (0.0%) |
Technology Access in Greencastle
Computing Device Access in Greencastle
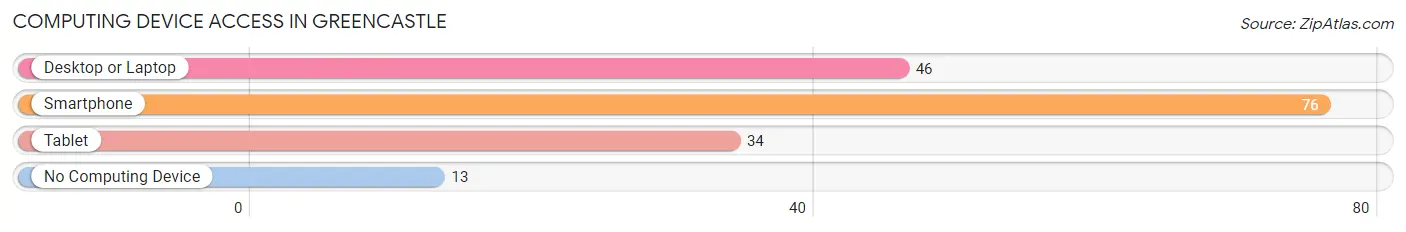
| Device Type | # Households | % Households |
| Desktop or Laptop | 46 | 47.9% |
| Smartphone | 76 | 79.2% |
| Tablet | 34 | 35.4% |
| No Computing Device | 13 | 13.5% |
| Total | 96 | 100.0% |
Internet Access in Greencastle
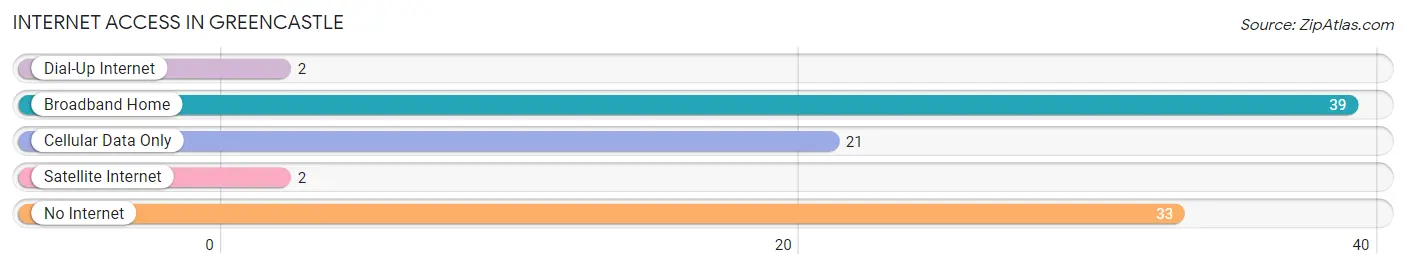
| Internet Type | # Households | % Households |
| Dial-Up Internet | 2 | 2.1% |
| Broadband Home | 39 | 40.6% |
| Cellular Data Only | 21 | 21.9% |
| Satellite Internet | 2 | 2.1% |
| No Internet | 33 | 34.4% |
| Total | 96 | 100.0% |
Greencastle Summary
Geography
Greencastle is a small town located in the Ozark Mountains of southwest Missouri. It is situated in the northern part of the state, about 25 miles south of Springfield. The town is located in the Ozark Plateau, which is characterized by rolling hills and valleys. The town is surrounded by forests and is home to a variety of wildlife, including deer, turkey, and other small game.
The town is located on the banks of the James River, which is a tributary of the White River. The James River is a popular destination for fishing, canoeing, and kayaking. The town is also home to several small lakes, including Lake of the Ozarks, which is a popular destination for swimming, boating, and fishing.
History
Greencastle was founded in 1837 by a group of settlers from Kentucky. The town was named after the Greencastle family, who were among the first settlers. The town was originally a farming community, but it soon became a center for timber production. The town was also home to several sawmills and gristmills.
In the late 19th century, the town began to grow as a result of the railroad. The railroad brought new businesses and industries to the area, and the town began to prosper. The town was also home to several schools, churches, and other institutions.
In the early 20th century, the town began to decline as the timber industry began to decline. The town was also affected by the Great Depression, and many of the businesses and industries in the town closed. The town continued to decline until the 1950s, when the town began to experience a resurgence.
Economy
Greencastle is a small town with a population of just over 1,000 people. The town is home to several small businesses, including a grocery store, a hardware store, and a few restaurants. The town is also home to several small manufacturing companies, including a furniture factory and a woodworking shop.
The town is also home to several tourist attractions, including a historic museum, a golf course, and a state park. The town is also home to several wineries and vineyards, which attract visitors from all over the country.
Demographics
As of the 2010 census, the population of Greencastle was 1,072. The town is predominantly white, with 95.3% of the population being white. The town is also home to a small Hispanic population, with 4.7% of the population being Hispanic. The median household income in the town is $37,500, and the median home value is $90,000.
Conclusion
Greencastle is a small town located in the Ozark Mountains of southwest Missouri. The town has a rich history, and it has experienced both growth and decline over the years. The town is home to several small businesses, tourist attractions, and manufacturing companies. The town is predominantly white, with a small Hispanic population. The median household income in the town is $37,500, and the median home value is $90,000.
Common Questions
What is Per Capita Income in Greencastle?
Per Capita income in Greencastle is $22,646.
What is the Median Family Income in Greencastle?
Median Family Income in Greencastle is $46,875.
What is the Median Household income in Greencastle?
Median Household Income in Greencastle is $45,714.
What is Income or Wage Gap in Greencastle?
Income or Wage Gap in Greencastle is 37.9%.
Women in Greencastle earn 62.1 cents for every dollar earned by a man.
What is Inequality or Gini Index in Greencastle?
Inequality or Gini Index in Greencastle is 0.42.
What is the Total Population of Greencastle?
Total Population of Greencastle is 298.
What is the Total Male Population of Greencastle?
Total Male Population of Greencastle is 146.
What is the Total Female Population of Greencastle?
Total Female Population of Greencastle is 152.
What is the Ratio of Males per 100 Females in Greencastle?
There are 96.05 Males per 100 Females in Greencastle.
What is the Ratio of Females per 100 Males in Greencastle?
There are 104.11 Females per 100 Males in Greencastle.
What is the Median Population Age in Greencastle?
Median Population Age in Greencastle is 51.6 Years.
What is the Average Family Size in Greencastle
Average Family Size in Greencastle is 4.5 People.
What is the Average Household Size in Greencastle
Average Household Size in Greencastle is 3.1 People.
How Large is the Labor Force in Greencastle?
There are 131 People in the Labor Forcein in Greencastle.
What is the Percentage of People in the Labor Force in Greencastle?
47.5% of People are in the Labor Force in Greencastle.
What is the Unemployment Rate in Greencastle?
Unemployment Rate in Greencastle is 0.8%.