Vandiver, MO Map & Demographics
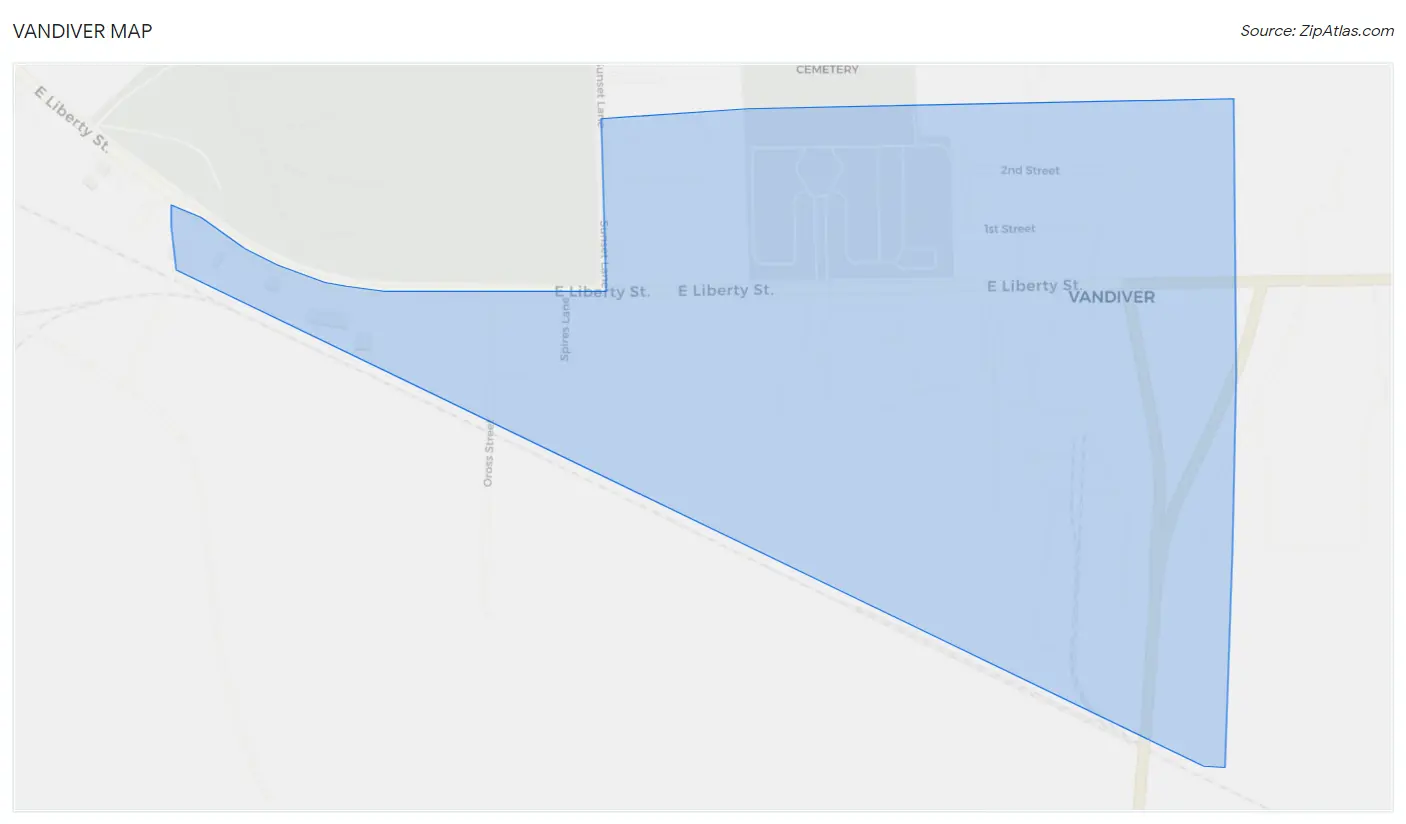
Vandiver Map
Vandiver Overview
$27,011
PER CAPITA INCOME
$63,750
AVG FAMILY INCOME
$50,938
AVG HOUSEHOLD INCOME
35.8%
WAGE / INCOME GAP [ % ]
64.2¢/ $1
WAGE / INCOME GAP [ $ ]
0.34
INEQUALITY / GINI INDEX
107
TOTAL POPULATION
62
MALE POPULATION
45
FEMALE POPULATION
137.78
MALES / 100 FEMALES
72.58
FEMALES / 100 MALES
61.1
MEDIAN AGE
3.3
AVG FAMILY SIZE
2.3
AVG HOUSEHOLD SIZE
48
LABOR FORCE [ PEOPLE ]
48.5%
PERCENT IN LABOR FORCE
Income in Vandiver
Income Overview in Vandiver
Per Capita Income in Vandiver is $27,011, while median incomes of families and households are $63,750 and $50,938 respectively.
| Characteristic | Number | Measure |
| Per Capita Income | 107 | $27,011 |
| Median Family Income | 26 | $63,750 |
| Mean Family Income | 26 | $80,488 |
| Median Household Income | 46 | $50,938 |
| Mean Household Income | 46 | $61,393 |
| Income Deficit | 26 | $0 |
| Wage / Income Gap (%) | 107 | 35.83% |
| Wage / Income Gap ($) | 107 | 64.17¢ per $1 |
| Gini / Inequality Index | 107 | 0.34 |
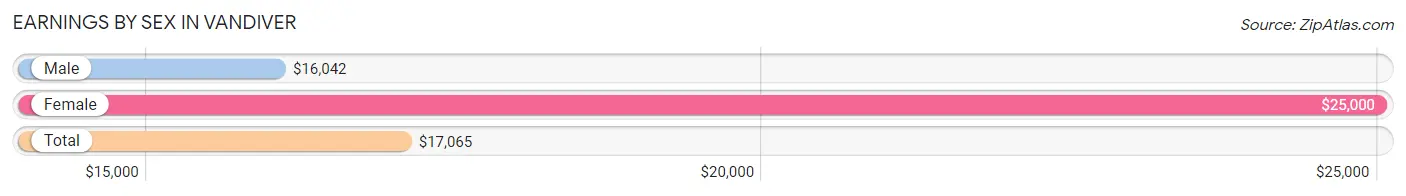
Earnings by Sex in Vandiver
Average Earnings in Vandiver are $17,065, $16,042 for men and $25,000 for women, a difference of 35.8%.
| Sex | Number | Average Earnings |
| Male | 30 (50.0%) | $16,042 |
| Female | 30 (50.0%) | $25,000 |
| Total | 60 (100.0%) | $17,065 |
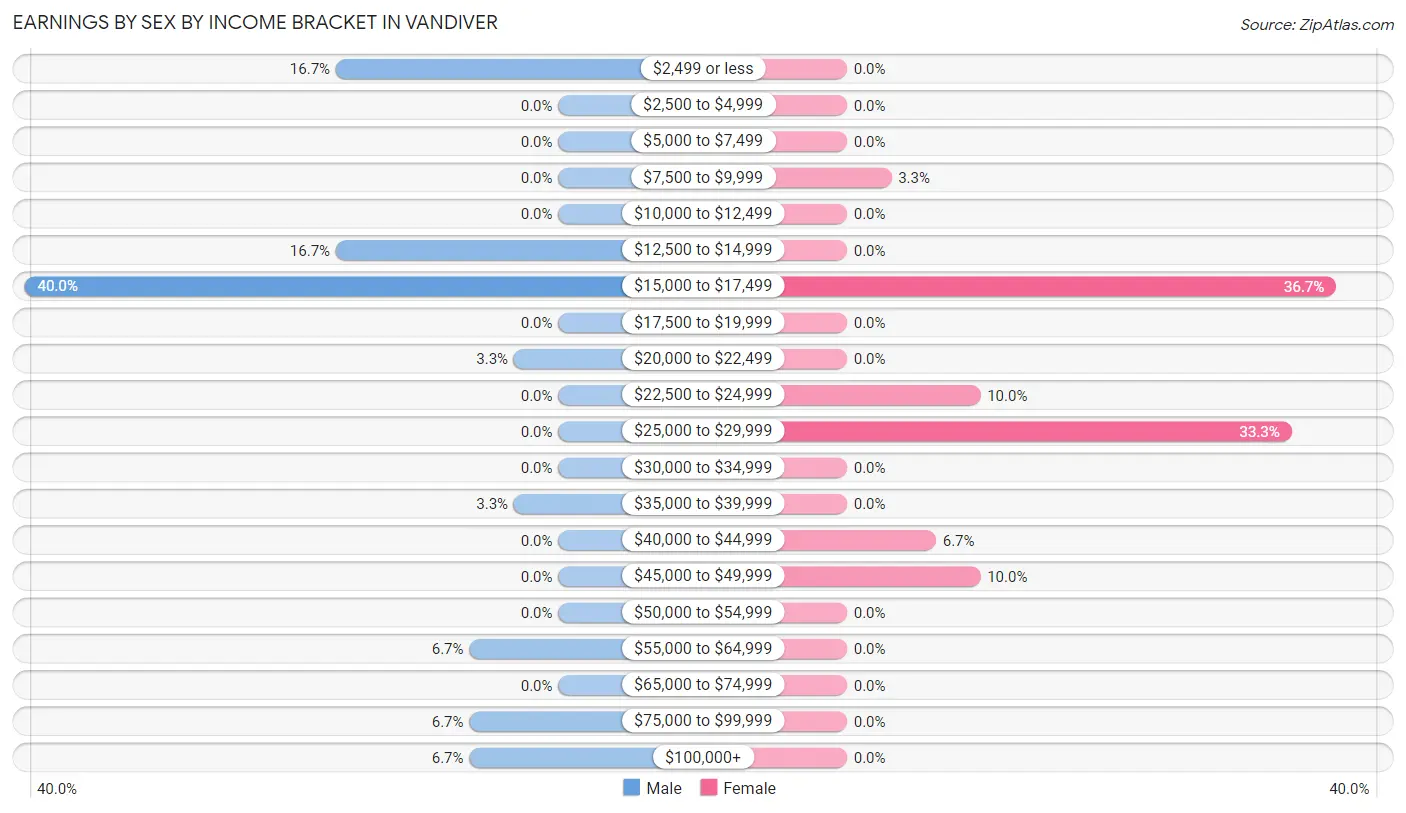
Earnings by Sex by Income Bracket in Vandiver
The most common earnings brackets in Vandiver are $15,000 to $17,499 for men (12 | 40.0%) and $15,000 to $17,499 for women (11 | 36.7%).
| Income | Male | Female |
| $2,499 or less | 5 (16.7%) | 0 (0.0%) |
| $2,500 to $4,999 | 0 (0.0%) | 0 (0.0%) |
| $5,000 to $7,499 | 0 (0.0%) | 0 (0.0%) |
| $7,500 to $9,999 | 0 (0.0%) | 1 (3.3%) |
| $10,000 to $12,499 | 0 (0.0%) | 0 (0.0%) |
| $12,500 to $14,999 | 5 (16.7%) | 0 (0.0%) |
| $15,000 to $17,499 | 12 (40.0%) | 11 (36.7%) |
| $17,500 to $19,999 | 0 (0.0%) | 0 (0.0%) |
| $20,000 to $22,499 | 1 (3.3%) | 0 (0.0%) |
| $22,500 to $24,999 | 0 (0.0%) | 3 (10.0%) |
| $25,000 to $29,999 | 0 (0.0%) | 10 (33.3%) |
| $30,000 to $34,999 | 0 (0.0%) | 0 (0.0%) |
| $35,000 to $39,999 | 1 (3.3%) | 0 (0.0%) |
| $40,000 to $44,999 | 0 (0.0%) | 2 (6.7%) |
| $45,000 to $49,999 | 0 (0.0%) | 3 (10.0%) |
| $50,000 to $54,999 | 0 (0.0%) | 0 (0.0%) |
| $55,000 to $64,999 | 2 (6.7%) | 0 (0.0%) |
| $65,000 to $74,999 | 0 (0.0%) | 0 (0.0%) |
| $75,000 to $99,999 | 2 (6.7%) | 0 (0.0%) |
| $100,000+ | 2 (6.7%) | 0 (0.0%) |
| Total | 30 (100.0%) | 30 (100.0%) |
Earnings by Sex by Educational Attainment in Vandiver
| Educational Attainment | Male Income | Female Income |
| Less than High School | - | - |
| High School Diploma | - | - |
| College or Associate's Degree | - | - |
| Bachelor's Degree | - | - |
| Graduate Degree | - | - |
| Total | - | - |
Family Income in Vandiver
Family Income Brackets in Vandiver
According to the Vandiver family income data, there are 17 families falling into the $50,000 to $74,999 income range, which is the most common income bracket and makes up 65.4% of all families.
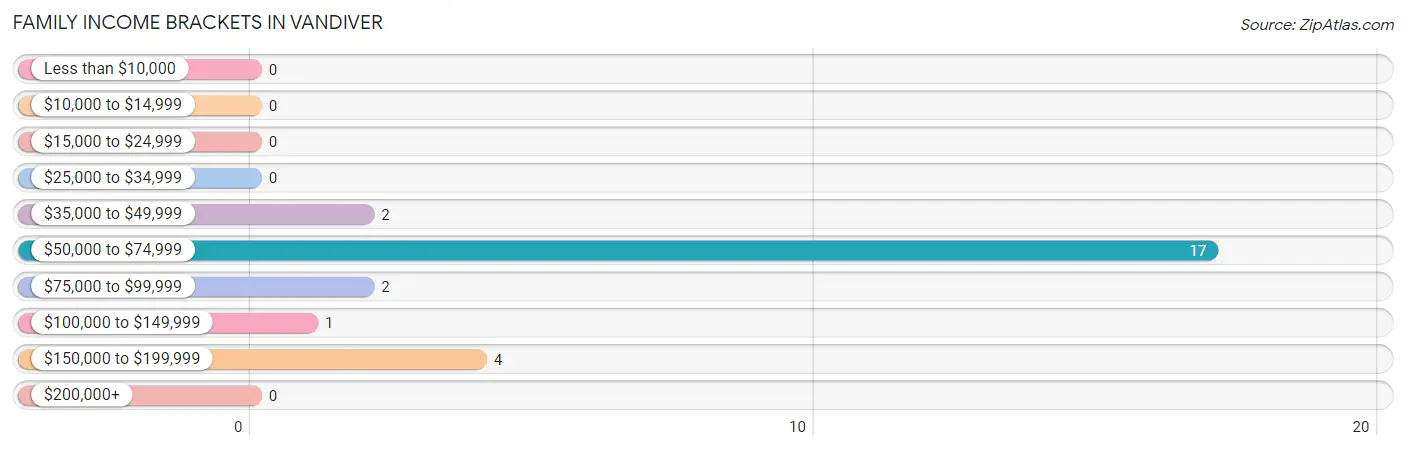
| Income Bracket | # Families | % Families |
| Less than $10,000 | 0 | 0.0% |
| $10,000 to $14,999 | 0 | 0.0% |
| $15,000 to $24,999 | 0 | 0.0% |
| $25,000 to $34,999 | 0 | 0.0% |
| $35,000 to $49,999 | 2 | 7.7% |
| $50,000 to $74,999 | 17 | 65.4% |
| $75,000 to $99,999 | 2 | 7.7% |
| $100,000 to $149,999 | 1 | 3.8% |
| $150,000 to $199,999 | 4 | 15.4% |
| $200,000+ | 0 | 0.0% |
Family Income by Famaliy Size in Vandiver
2-person families (14 | 53.8%) account for the highest median family income in Vandiver with $77,500 per family, while 2-person families (14 | 53.8%) have the highest median income of $38,750 per family member.
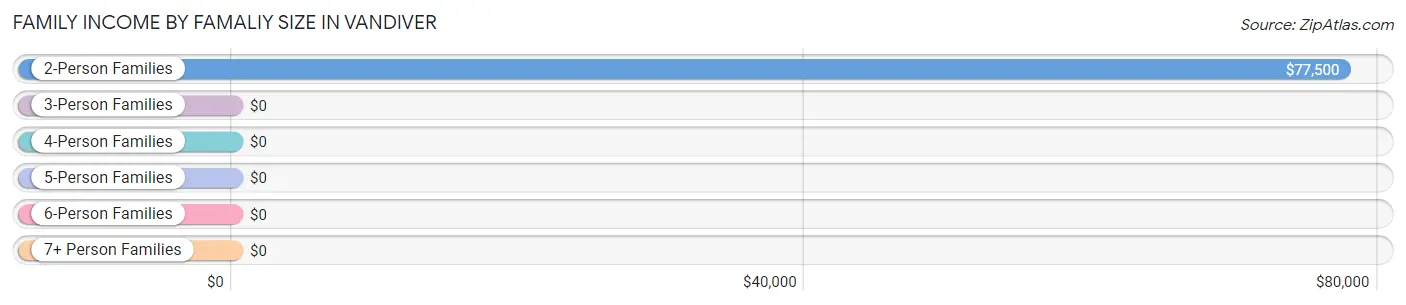
| Income Bracket | # Families | Median Income |
| 2-Person Families | 14 (53.8%) | $77,500 |
| 3-Person Families | 0 (0.0%) | $0 |
| 4-Person Families | 8 (30.8%) | $0 |
| 5-Person Families | 4 (15.4%) | $0 |
| 6-Person Families | 0 (0.0%) | $0 |
| 7+ Person Families | 0 (0.0%) | $0 |
| Total | 26 (100.0%) | $63,750 |
Family Income by Number of Earners in Vandiver
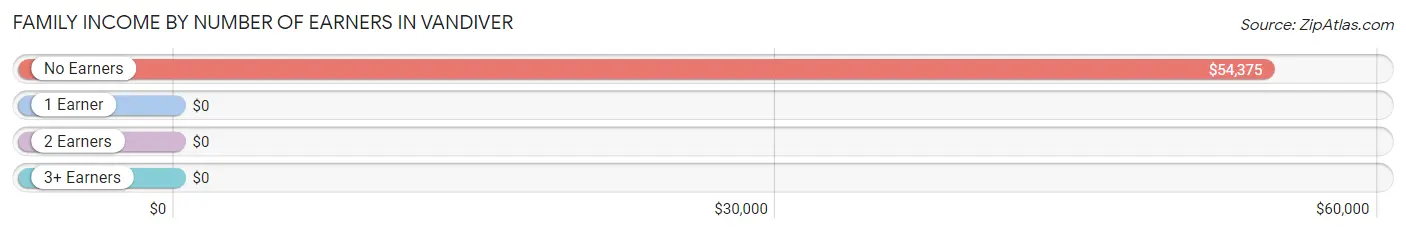
| Number of Earners | # Families | Median Income |
| No Earners | 7 (26.9%) | $54,375 |
| 1 Earner | 3 (11.5%) | $0 |
| 2 Earners | 8 (30.8%) | $0 |
| 3+ Earners | 8 (30.8%) | $0 |
| Total | 26 (100.0%) | $63,750 |
Household Income in Vandiver
Household Income Brackets in Vandiver
With 17 households falling in the category, the $50,000 to $74,999 income range is the most frequent in Vandiver, accounting for 37.0% of all households.
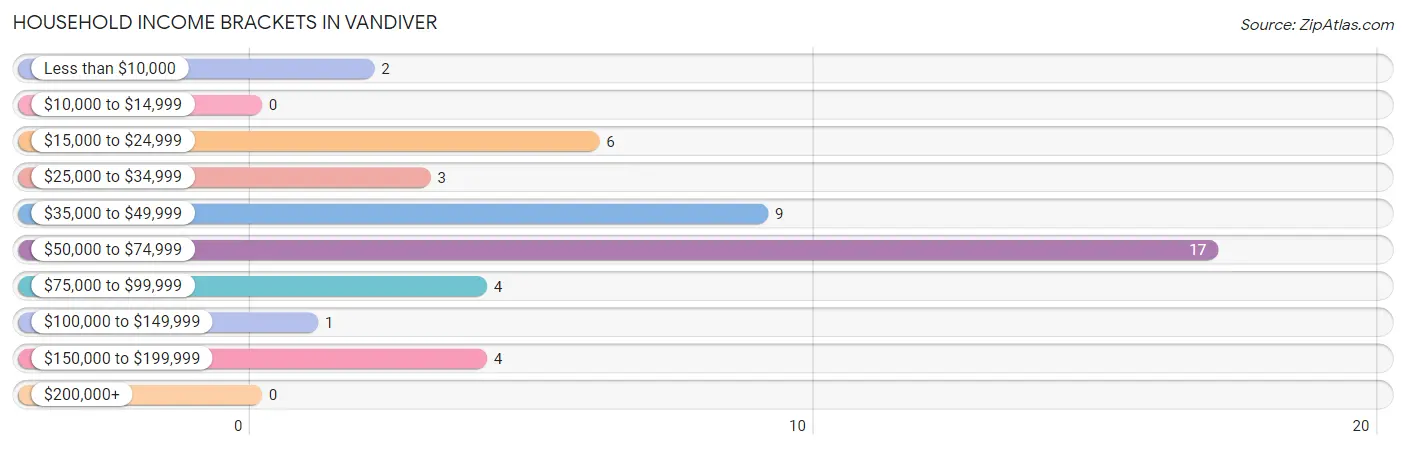
| Income Bracket | # Households | % Households |
| Less than $10,000 | 2 | 4.3% |
| $10,000 to $14,999 | 0 | 0.0% |
| $15,000 to $24,999 | 6 | 13.0% |
| $25,000 to $34,999 | 3 | 6.5% |
| $35,000 to $49,999 | 9 | 19.6% |
| $50,000 to $74,999 | 17 | 37.0% |
| $75,000 to $99,999 | 4 | 8.7% |
| $100,000 to $149,999 | 1 | 2.2% |
| $150,000 to $199,999 | 4 | 8.7% |
| $200,000+ | 0 | 0.0% |
Household Income by Householder Age in Vandiver
The median household income in Vandiver is $50,938, with the highest median household income of $51,719 found in the 45 to 64 years age bracket for the primary householder. A total of 13 households (28.3%) fall into this category. Meanwhile, the 15 to 24 years age bracket for the primary householder has the lowest median household income of $0, with 2 households (4.3%) in this group.
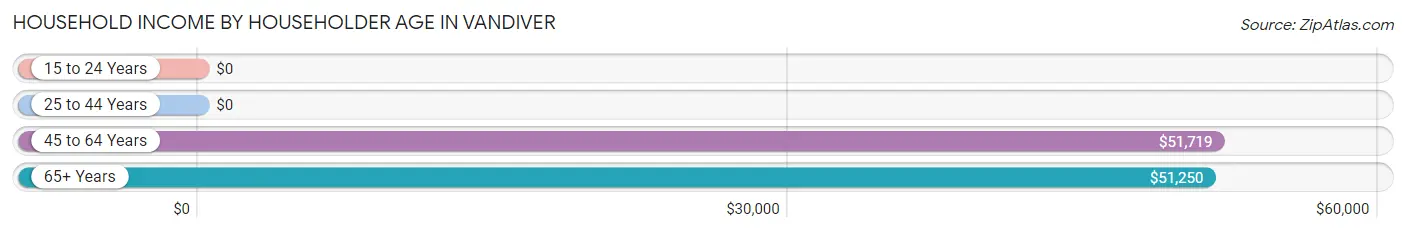
| Income Bracket | # Households | Median Income |
| 15 to 24 Years | 2 (4.3%) | $0 |
| 25 to 44 Years | 3 (6.5%) | $0 |
| 45 to 64 Years | 13 (28.3%) | $51,719 |
| 65+ Years | 28 (60.9%) | $51,250 |
| Total | 46 (100.0%) | $50,938 |
Poverty in Vandiver
Income Below Poverty by Sex and Age in Vandiver
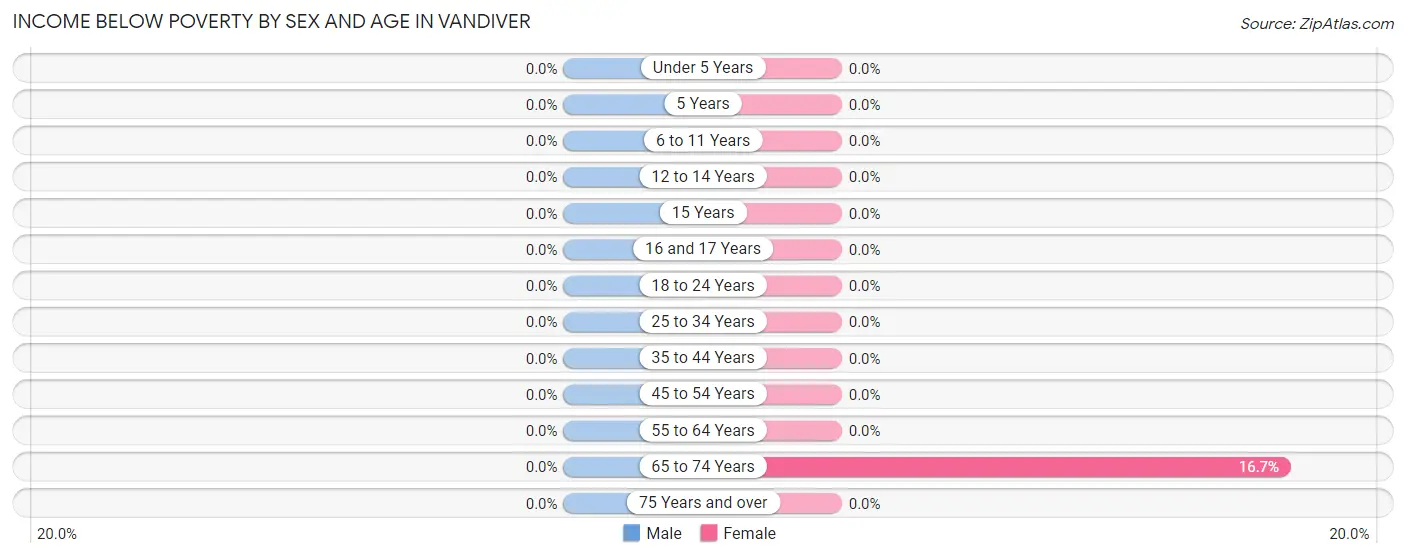
| Age Bracket | Male | Female |
| Under 5 Years | 0 (0.0%) | 0 (0.0%) |
| 5 Years | 0 (0.0%) | 0 (0.0%) |
| 6 to 11 Years | 0 (0.0%) | 0 (0.0%) |
| 12 to 14 Years | 0 (0.0%) | 0 (0.0%) |
| 15 Years | 0 (0.0%) | 0 (0.0%) |
| 16 and 17 Years | 0 (0.0%) | 0 (0.0%) |
| 18 to 24 Years | 0 (0.0%) | 0 (0.0%) |
| 25 to 34 Years | 0 (0.0%) | 0 (0.0%) |
| 35 to 44 Years | 0 (0.0%) | 0 (0.0%) |
| 45 to 54 Years | 0 (0.0%) | 0 (0.0%) |
| 55 to 64 Years | 0 (0.0%) | 0 (0.0%) |
| 65 to 74 Years | 0 (0.0%) | 2 (16.7%) |
| 75 Years and over | 0 (0.0%) | 0 (0.0%) |
| Total | 0 (0.0%) | 2 (4.4%) |
Income Above Poverty by Sex and Age in Vandiver
According to the poverty statistics in Vandiver, males aged 15 years and females aged 25 to 34 years are the age groups that are most secure financially, with 100.0% of males and 100.0% of females in these age groups living above the poverty line.
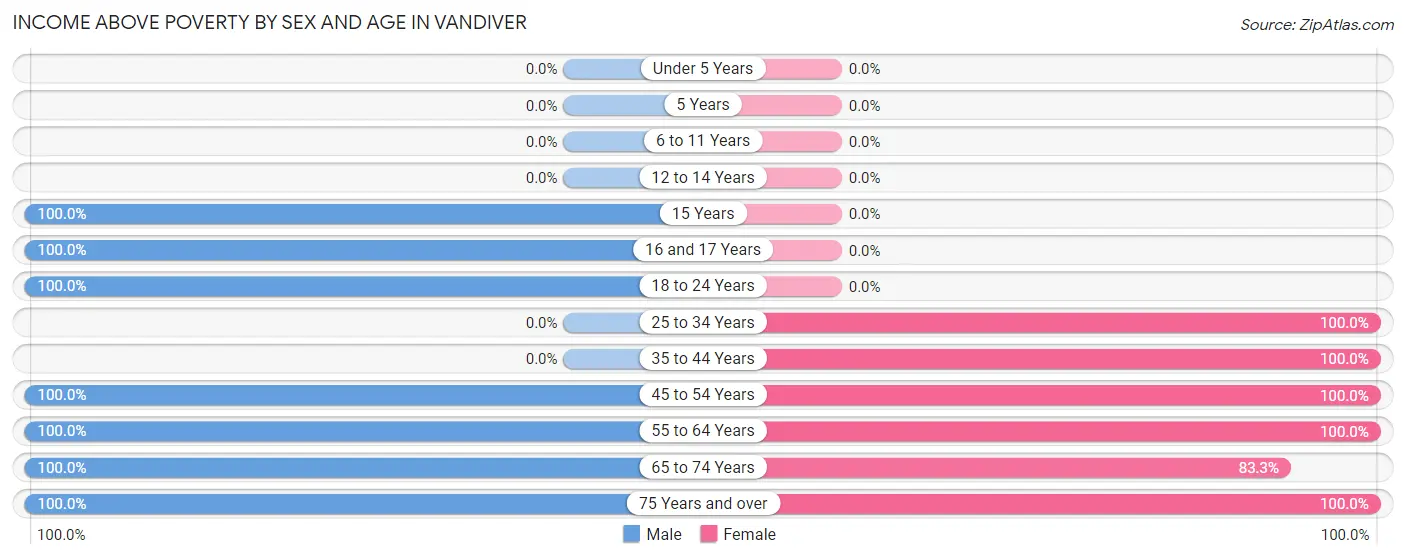
| Age Bracket | Male | Female |
| Under 5 Years | 0 (0.0%) | 0 (0.0%) |
| 5 Years | 0 (0.0%) | 0 (0.0%) |
| 6 to 11 Years | 0 (0.0%) | 0 (0.0%) |
| 12 to 14 Years | 0 (0.0%) | 0 (0.0%) |
| 15 Years | 8 (100.0%) | 0 (0.0%) |
| 16 and 17 Years | 7 (100.0%) | 0 (0.0%) |
| 18 to 24 Years | 7 (100.0%) | 0 (0.0%) |
| 25 to 34 Years | 0 (0.0%) | 3 (100.0%) |
| 35 to 44 Years | 0 (0.0%) | 10 (100.0%) |
| 45 to 54 Years | 5 (100.0%) | 8 (100.0%) |
| 55 to 64 Years | 17 (100.0%) | 3 (100.0%) |
| 65 to 74 Years | 8 (100.0%) | 10 (83.3%) |
| 75 Years and over | 10 (100.0%) | 9 (100.0%) |
| Total | 62 (100.0%) | 43 (95.6%) |
Income Below Poverty Among Married-Couple Families in Vandiver
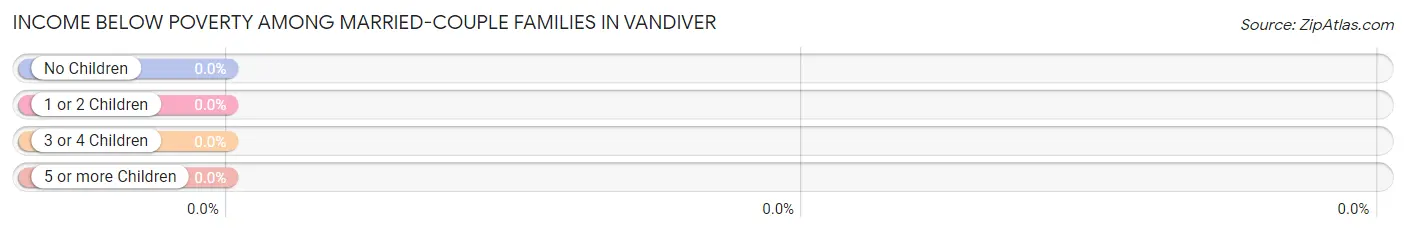
| Children | Above Poverty | Below Poverty |
| No Children | 14 (100.0%) | 0 (0.0%) |
| 1 or 2 Children | 12 (100.0%) | 0 (0.0%) |
| 3 or 4 Children | 0 (0.0%) | 0 (0.0%) |
| 5 or more Children | 0 (0.0%) | 0 (0.0%) |
| Total | 26 (100.0%) | 0 (0.0%) |
Income Below Poverty Among Single-Parent Households in Vandiver
| Children | Single Father | Single Mother |
| No Children | 0 (0.0%) | 0 (0.0%) |
| 1 or 2 Children | 0 (0.0%) | 0 (0.0%) |
| 3 or 4 Children | 0 (0.0%) | 0 (0.0%) |
| 5 or more Children | 0 (0.0%) | 0 (0.0%) |
| Total | 0 (0.0%) | 0 (0.0%) |
Income Below Poverty Among Married-Couple vs Single-Parent Households in Vandiver
| Children | Married-Couple Families | Single-Parent Households |
| No Children | 0 (0.0%) | 0 (0.0%) |
| 1 or 2 Children | 0 (0.0%) | 0 (0.0%) |
| 3 or 4 Children | 0 (0.0%) | 0 (0.0%) |
| 5 or more Children | 0 (0.0%) | 0 (0.0%) |
| Total | 0 (0.0%) | 0 (0.0%) |
Race in Vandiver
The most populous races in Vandiver are White / Caucasian (102 | 95.3%), Two or more Races (4 | 3.7%), and Native / Alaskan (1 | 0.9%).
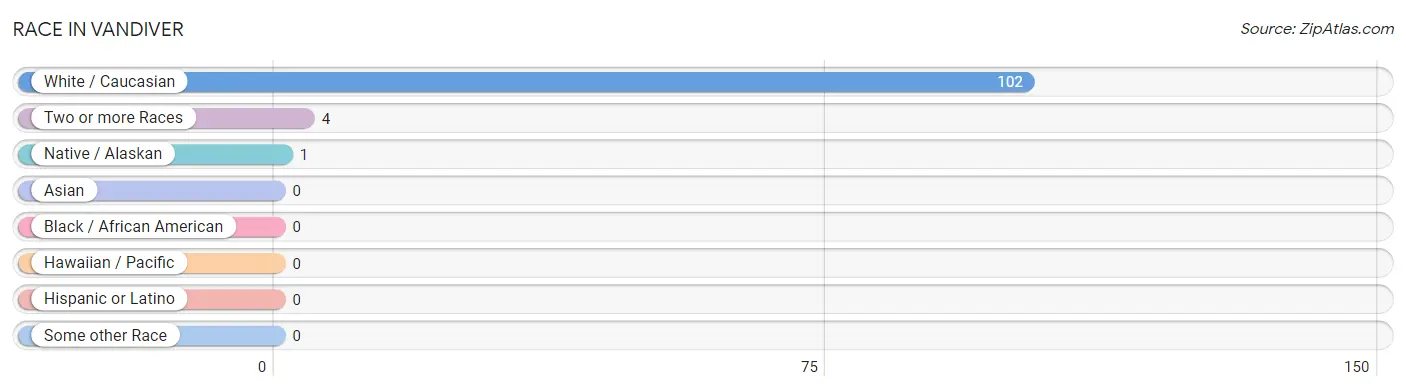
| Race | # Population | % Population |
| Asian | 0 | 0.0% |
| Black / African American | 0 | 0.0% |
| Hawaiian / Pacific | 0 | 0.0% |
| Hispanic or Latino | 0 | 0.0% |
| Native / Alaskan | 1 | 0.9% |
| White / Caucasian | 102 | 95.3% |
| Two or more Races | 4 | 3.7% |
| Some other Race | 0 | 0.0% |
| Total | 107 | 100.0% |
Ancestry in Vandiver
The most populous ancestries reported in Vandiver are English (48 | 44.9%), German (48 | 44.9%), Irish (5 | 4.7%), American (4 | 3.7%), and Dutch (3 | 2.8%), together accounting for 100.9% of all Vandiver residents.
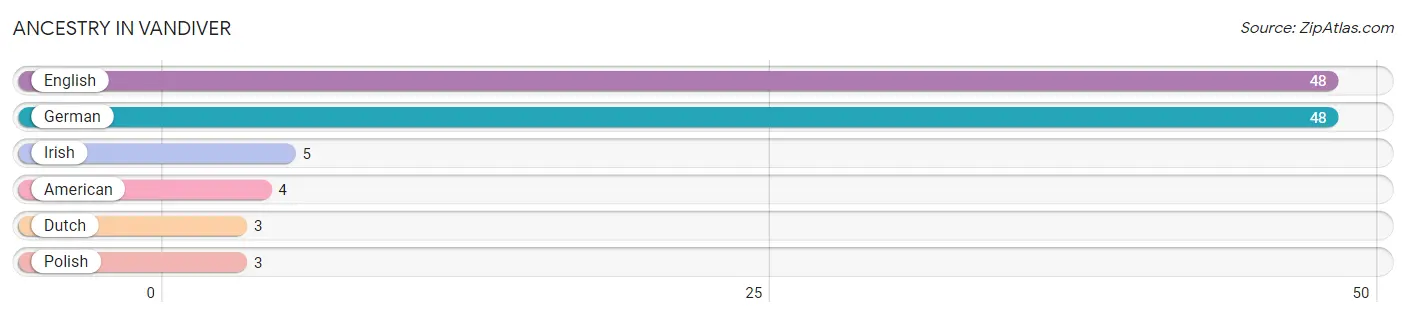
| Ancestry | # Population | % Population |
| American | 4 | 3.7% |
| Dutch | 3 | 2.8% |
| English | 48 | 44.9% |
| German | 48 | 44.9% |
| Irish | 5 | 4.7% |
| Polish | 3 | 2.8% | View All 6 Rows |
Immigrants in Vandiver

| Immigration Origin | # Population | % Population | View All 0 Rows |
Sex and Age in Vandiver
Sex and Age in Vandiver
The most populous age groups in Vandiver are 15 to 19 Years (20 | 32.3%) for men and 40 to 44 Years (10 | 22.2%) for women.
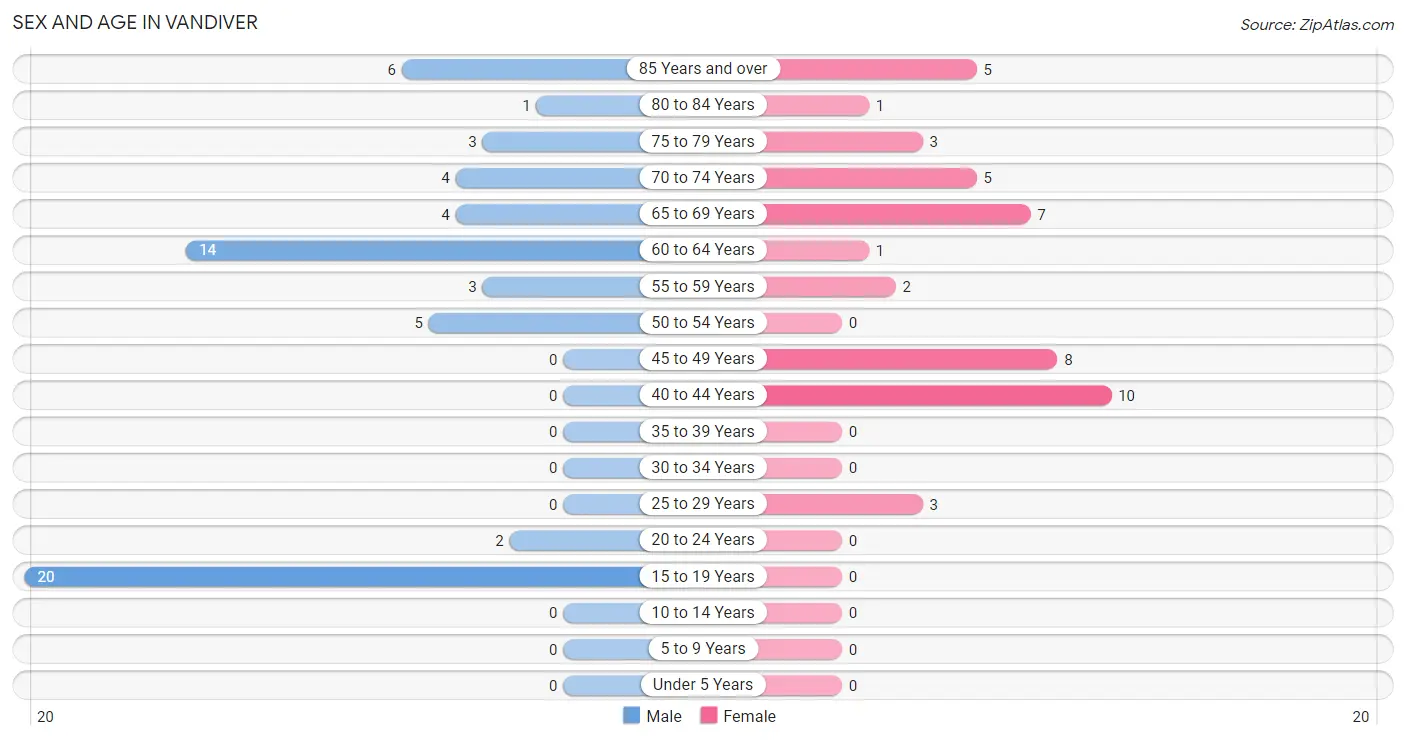
| Age Bracket | Male | Female |
| Under 5 Years | 0 (0.0%) | 0 (0.0%) |
| 5 to 9 Years | 0 (0.0%) | 0 (0.0%) |
| 10 to 14 Years | 0 (0.0%) | 0 (0.0%) |
| 15 to 19 Years | 20 (32.3%) | 0 (0.0%) |
| 20 to 24 Years | 2 (3.2%) | 0 (0.0%) |
| 25 to 29 Years | 0 (0.0%) | 3 (6.7%) |
| 30 to 34 Years | 0 (0.0%) | 0 (0.0%) |
| 35 to 39 Years | 0 (0.0%) | 0 (0.0%) |
| 40 to 44 Years | 0 (0.0%) | 10 (22.2%) |
| 45 to 49 Years | 0 (0.0%) | 8 (17.8%) |
| 50 to 54 Years | 5 (8.1%) | 0 (0.0%) |
| 55 to 59 Years | 3 (4.8%) | 2 (4.4%) |
| 60 to 64 Years | 14 (22.6%) | 1 (2.2%) |
| 65 to 69 Years | 4 (6.5%) | 7 (15.6%) |
| 70 to 74 Years | 4 (6.5%) | 5 (11.1%) |
| 75 to 79 Years | 3 (4.8%) | 3 (6.7%) |
| 80 to 84 Years | 1 (1.6%) | 1 (2.2%) |
| 85 Years and over | 6 (9.7%) | 5 (11.1%) |
| Total | 62 (100.0%) | 45 (100.0%) |
Families and Households in Vandiver
Median Family Size in Vandiver
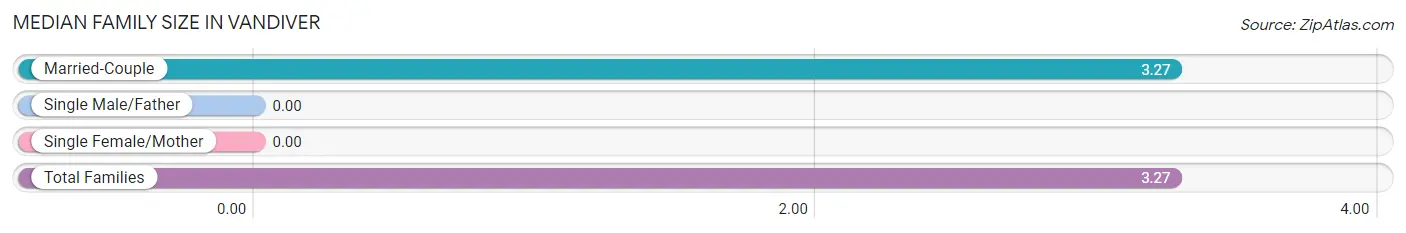
| Family Type | # Families | Family Size |
| Married-Couple | 26 (100.0%) | 3.27 |
| Single Male/Father | 0 (0.0%) | - |
| Single Female/Mother | 0 (0.0%) | - |
| Total Families | 26 (100.0%) | 3.27 |
Median Household Size in Vandiver
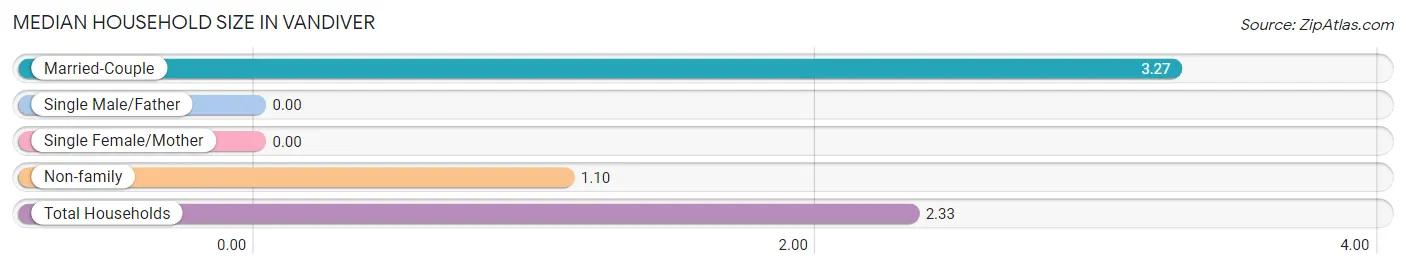
| Household Type | # Households | Household Size |
| Married-Couple | 26 (56.5%) | 3.27 |
| Single Male/Father | 0 (0.0%) | - |
| Single Female/Mother | 0 (0.0%) | - |
| Non-family | 20 (43.5%) | 1.10 |
| Total Households | 46 (100.0%) | 2.33 |
Household Size by Marriage Status in Vandiver
Out of a total of 46 households in Vandiver, 26 (56.5%) are family households, while 20 (43.5%) are nonfamily households. The most numerous type of family households are 2-person households, comprising 14, and the most common type of nonfamily households are 1-person households, comprising 18.
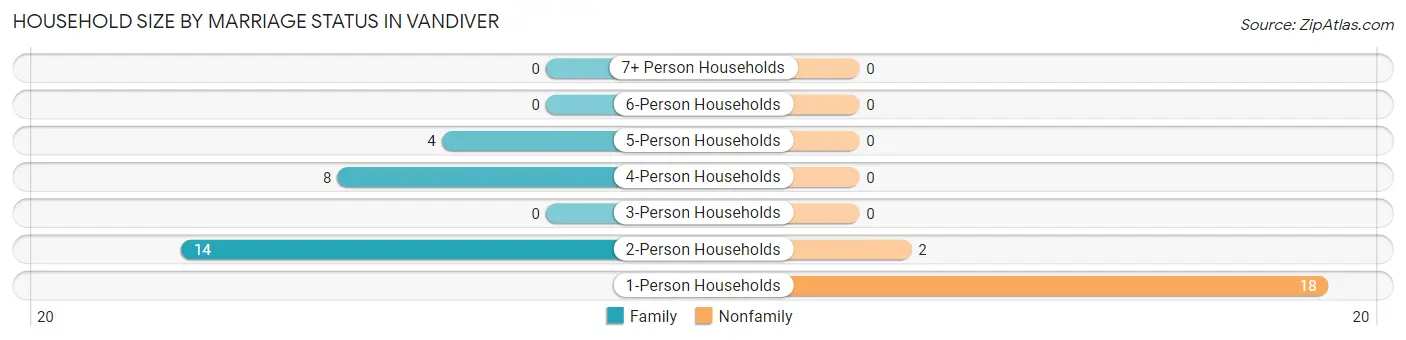
| Household Size | Family Households | Nonfamily Households |
| 1-Person Households | - | 18 (39.1%) |
| 2-Person Households | 14 (30.4%) | 2 (4.3%) |
| 3-Person Households | 0 (0.0%) | 0 (0.0%) |
| 4-Person Households | 8 (17.4%) | 0 (0.0%) |
| 5-Person Households | 4 (8.7%) | 0 (0.0%) |
| 6-Person Households | 0 (0.0%) | 0 (0.0%) |
| 7+ Person Households | 0 (0.0%) | 0 (0.0%) |
| Total | 26 (56.5%) | 20 (43.5%) |
Female Fertility in Vandiver
Fertility by Age in Vandiver
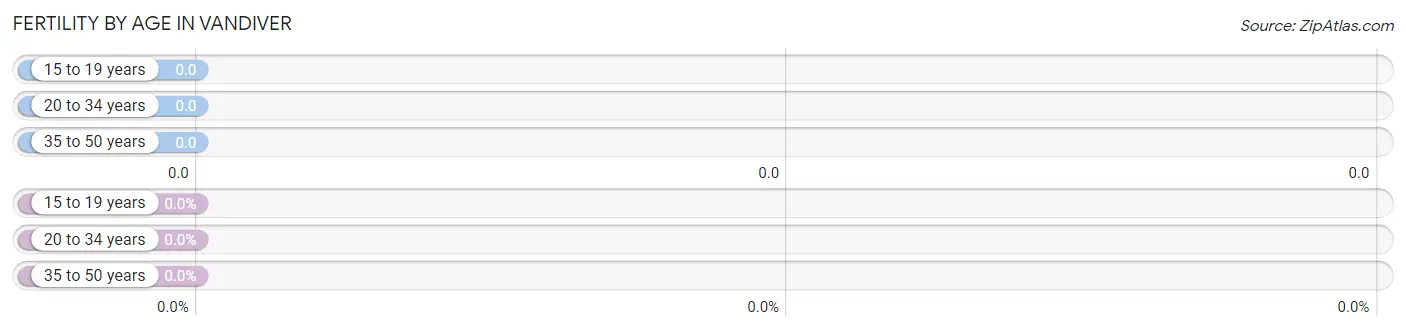
| Age Bracket | Women with Births | Births / 1,000 Women |
| 15 to 19 years | 0 (0.0%) | 0.0 |
| 20 to 34 years | 0 (0.0%) | 0.0 |
| 35 to 50 years | 0 (0.0%) | 0.0 |
| Total | 0 (0.0%) | 0.0 |
Fertility by Age by Marriage Status in Vandiver
| Age Bracket | Married | Unmarried |
| 15 to 19 years | 0 (0.0%) | 0 (0.0%) |
| 20 to 34 years | 0 (0.0%) | 0 (0.0%) |
| 35 to 50 years | 0 (0.0%) | 0 (0.0%) |
| Total | 0 (0.0%) | 0 (0.0%) |
Fertility by Education in Vandiver
| Educational Attainment | Women with Births | Births / 1,000 Women |
| Less than High School | 0 (0.0%) | 0.0 |
| High School Diploma | 0 (0.0%) | 0.0 |
| College or Associate's Degree | 0 (0.0%) | 0.0 |
| Bachelor's Degree | 0 (0.0%) | 0.0 |
| Graduate Degree | 0 (0.0%) | 0.0 |
| Total | 0 (0.0%) | 0.0 |
Fertility by Education by Marriage Status in Vandiver
| Educational Attainment | Married | Unmarried |
| Less than High School | 0 (0.0%) | 0 (0.0%) |
| High School Diploma | 0 (0.0%) | 0 (0.0%) |
| College or Associate's Degree | 0 (0.0%) | 0 (0.0%) |
| Bachelor's Degree | 0 (0.0%) | 0 (0.0%) |
| Graduate Degree | 0 (0.0%) | 0 (0.0%) |
| Total | 0 (0.0%) | 0 (0.0%) |
Employment Characteristics in Vandiver
Employment by Class of Employer in Vandiver
Among the 45 employed individuals in Vandiver, not-for-profit organizations (21 | 46.7%), private company employees (14 | 31.1%), and self-employed (incorporated) (5 | 11.1%) make up the most common classes of employment.
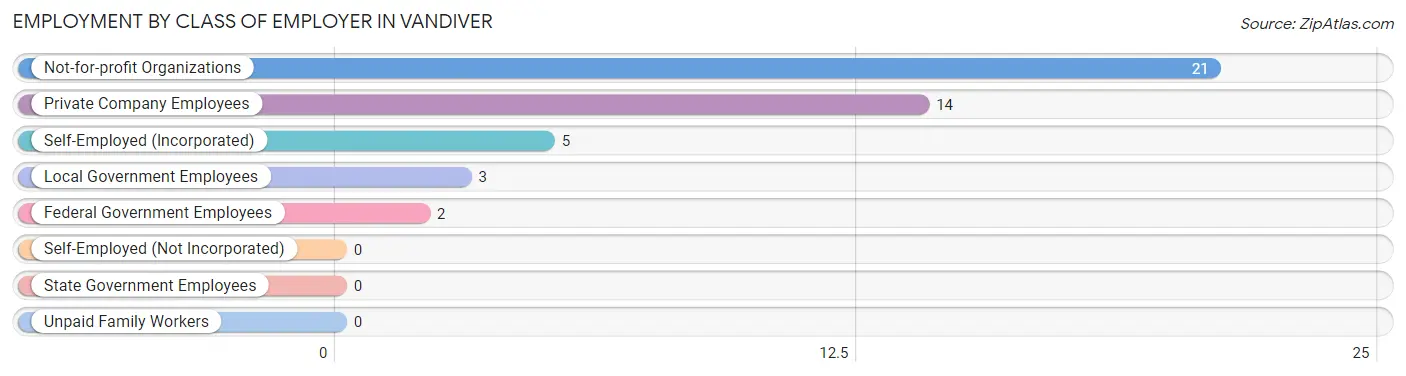
| Employer Class | # Employees | % Employees |
| Private Company Employees | 14 | 31.1% |
| Self-Employed (Incorporated) | 5 | 11.1% |
| Self-Employed (Not Incorporated) | 0 | 0.0% |
| Not-for-profit Organizations | 21 | 46.7% |
| Local Government Employees | 3 | 6.7% |
| State Government Employees | 0 | 0.0% |
| Federal Government Employees | 2 | 4.4% |
| Unpaid Family Workers | 0 | 0.0% |
| Total | 45 | 100.0% |
Employment Status by Age in Vandiver
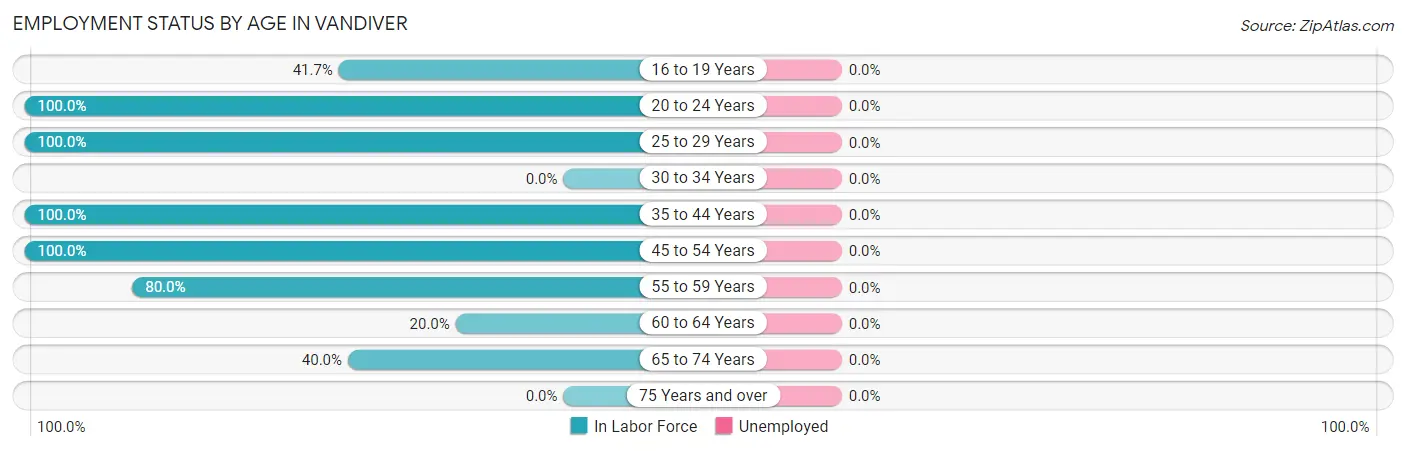
| Age Bracket | In Labor Force | Unemployed |
| 16 to 19 Years | 5 (41.7%) | 0 (0.0%) |
| 20 to 24 Years | 2 (100.0%) | 0 (0.0%) |
| 25 to 29 Years | 3 (100.0%) | 0 (0.0%) |
| 30 to 34 Years | 0 (0.0%) | 0 (0.0%) |
| 35 to 44 Years | 10 (100.0%) | 0 (0.0%) |
| 45 to 54 Years | 13 (100.0%) | 0 (0.0%) |
| 55 to 59 Years | 4 (80.0%) | 0 (0.0%) |
| 60 to 64 Years | 3 (20.0%) | 0 (0.0%) |
| 65 to 74 Years | 8 (40.0%) | 0 (0.0%) |
| 75 Years and over | 0 (0.0%) | 0 (0.0%) |
| Total | 48 (48.5%) | 0 (0.0%) |
Employment Status by Educational Attainment in Vandiver
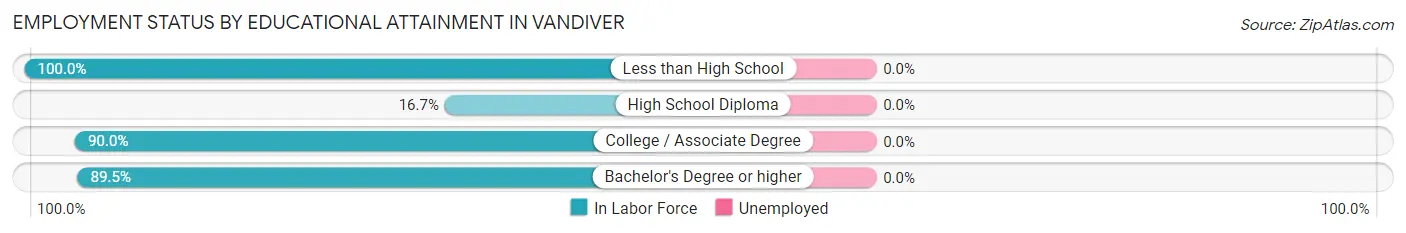
| Educational Attainment | In Labor Force | Unemployed |
| Less than High School | 5 (100.0%) | 0 (0.0%) |
| High School Diploma | 2 (16.7%) | 0 (0.0%) |
| College / Associate Degree | 9 (90.0%) | 0 (0.0%) |
| Bachelor's Degree or higher | 17 (89.5%) | 0 (0.0%) |
| Total | 33 (71.7%) | 0 (0.0%) |
Employment Occupations by Sex in Vandiver
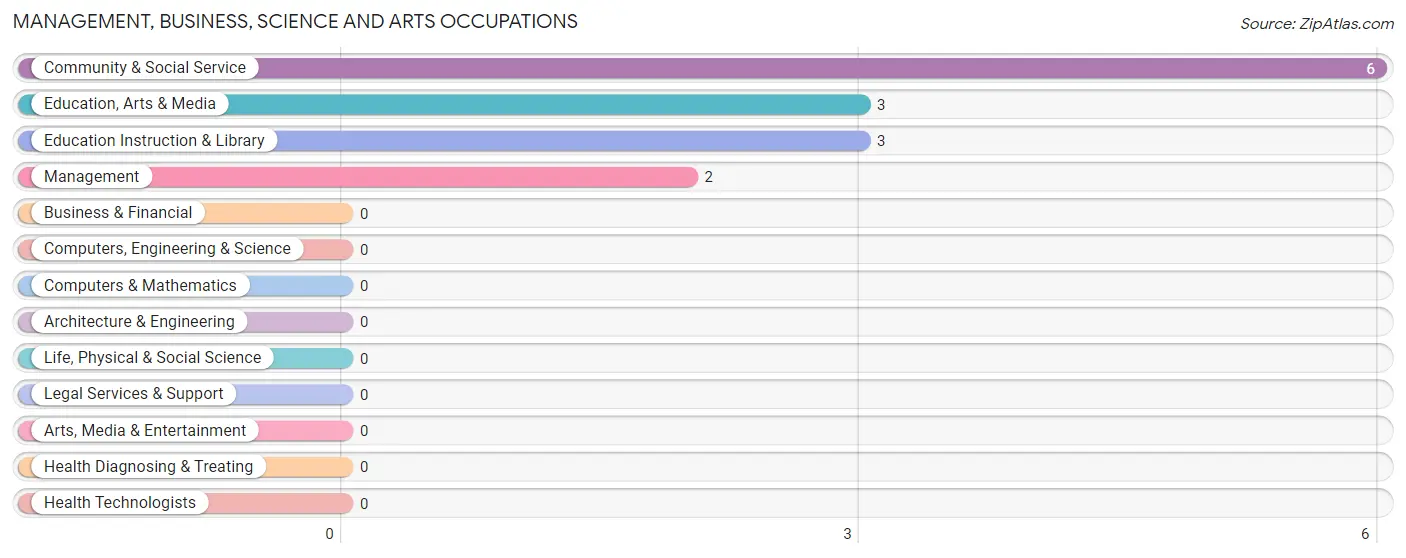
Management, Business, Science and Arts Occupations
The most common Management, Business, Science and Arts occupations in Vandiver are Community & Social Service (6 | 12.5%), Education, Arts & Media (3 | 6.2%), Education Instruction & Library (3 | 6.2%), and Management (2 | 4.2%).
Management, Business, Science and Arts Occupations by Sex
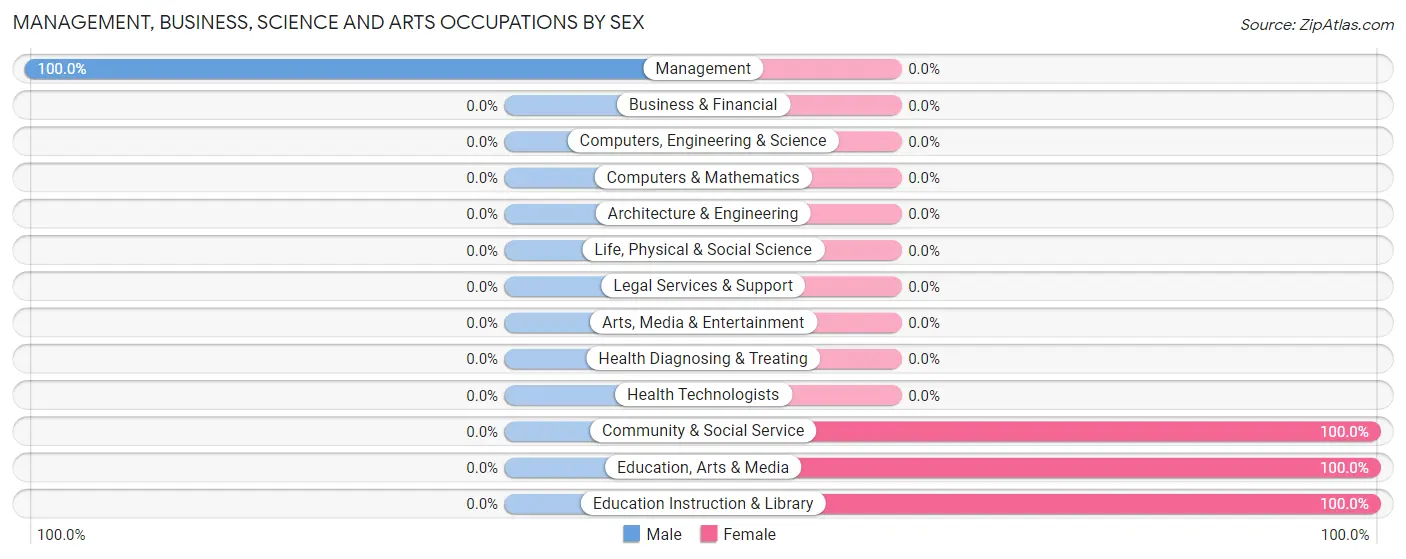
| Occupation | Male | Female |
| Management | 2 (100.0%) | 0 (0.0%) |
| Business & Financial | 0 (0.0%) | 0 (0.0%) |
| Computers, Engineering & Science | 0 (0.0%) | 0 (0.0%) |
| Computers & Mathematics | 0 (0.0%) | 0 (0.0%) |
| Architecture & Engineering | 0 (0.0%) | 0 (0.0%) |
| Life, Physical & Social Science | 0 (0.0%) | 0 (0.0%) |
| Community & Social Service | 0 (0.0%) | 6 (100.0%) |
| Education, Arts & Media | 0 (0.0%) | 3 (100.0%) |
| Legal Services & Support | 0 (0.0%) | 0 (0.0%) |
| Education Instruction & Library | 0 (0.0%) | 3 (100.0%) |
| Arts, Media & Entertainment | 0 (0.0%) | 0 (0.0%) |
| Health Diagnosing & Treating | 0 (0.0%) | 0 (0.0%) |
| Health Technologists | 0 (0.0%) | 0 (0.0%) |
| Total (Category) | 2 (25.0%) | 6 (75.0%) |
| Total (Overall) | 18 (37.5%) | 30 (62.5%) |
Services Occupations
The most common Services occupations in Vandiver are Food Preparation & Serving (2 | 4.2%), and Cleaning & Maintenance (2 | 4.2%).
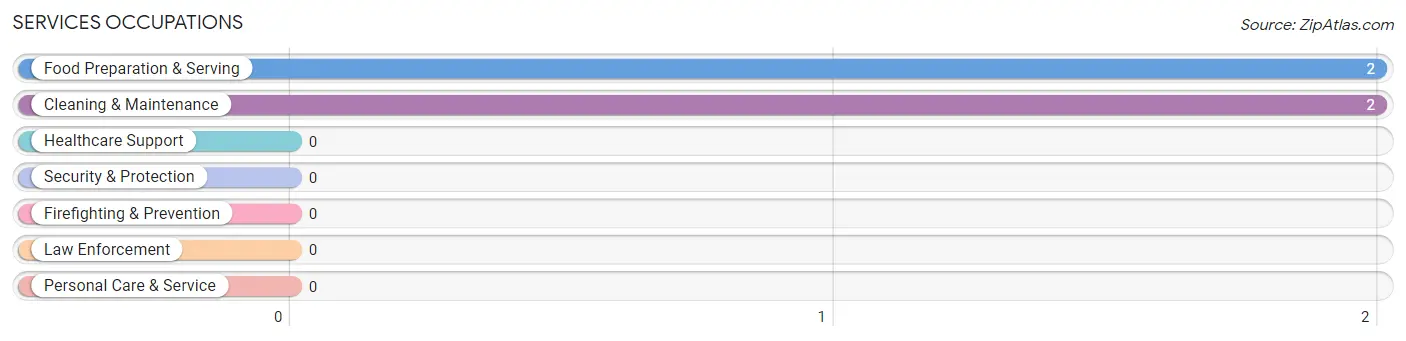
Services Occupations by Sex
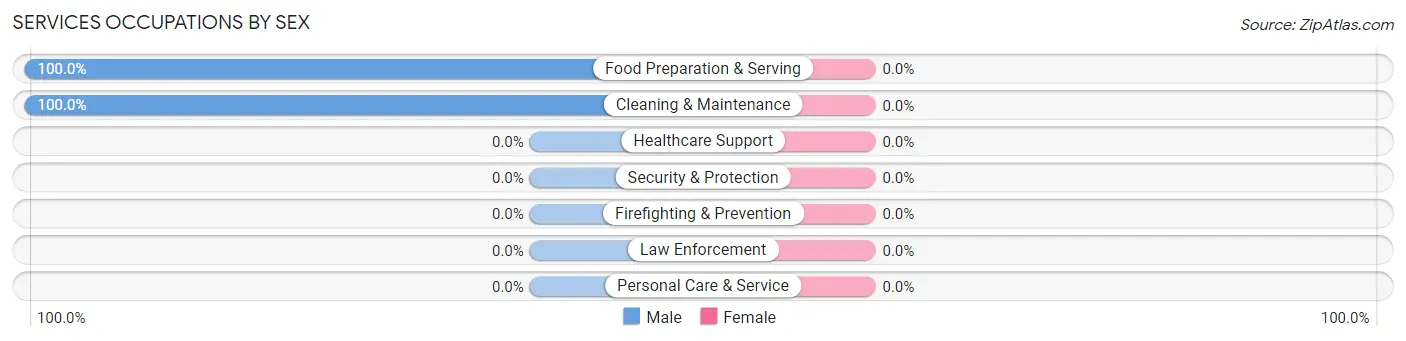
| Occupation | Male | Female |
| Healthcare Support | 0 (0.0%) | 0 (0.0%) |
| Security & Protection | 0 (0.0%) | 0 (0.0%) |
| Firefighting & Prevention | 0 (0.0%) | 0 (0.0%) |
| Law Enforcement | 0 (0.0%) | 0 (0.0%) |
| Food Preparation & Serving | 2 (100.0%) | 0 (0.0%) |
| Cleaning & Maintenance | 2 (100.0%) | 0 (0.0%) |
| Personal Care & Service | 0 (0.0%) | 0 (0.0%) |
| Total (Category) | 4 (100.0%) | 0 (0.0%) |
| Total (Overall) | 18 (37.5%) | 30 (62.5%) |
Sales and Office Occupations
The most common Sales and Office occupations in Vandiver are Office & Administration (9 | 18.8%), and Sales & Related (3 | 6.2%).
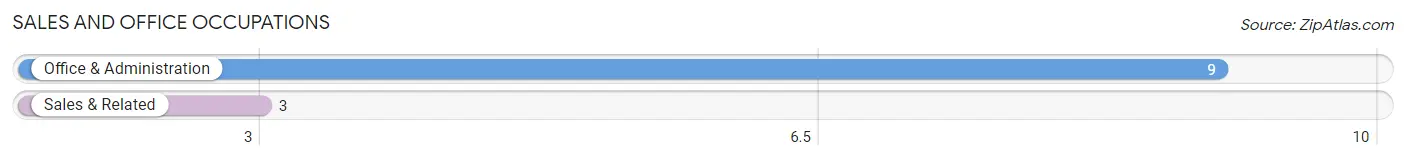
Sales and Office Occupations by Sex
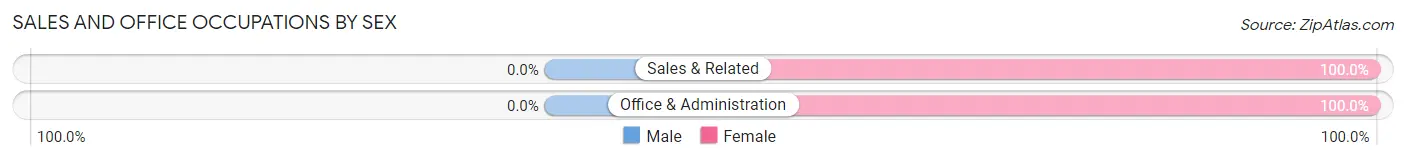
| Occupation | Male | Female |
| Sales & Related | 0 (0.0%) | 3 (100.0%) |
| Office & Administration | 0 (0.0%) | 9 (100.0%) |
| Total (Category) | 0 (0.0%) | 12 (100.0%) |
| Total (Overall) | 18 (37.5%) | 30 (62.5%) |
Natural Resources, Construction and Maintenance Occupations
The most common Natural Resources, Construction and Maintenance occupations in Vandiver are Construction & Extraction (10 | 20.8%), and Installation, Maintenance & Repair (2 | 4.2%).
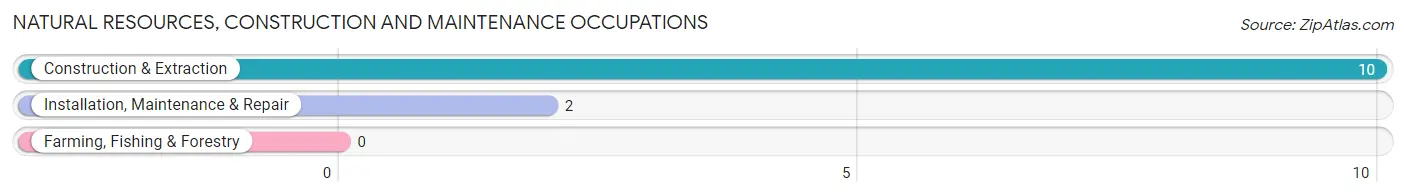
Natural Resources, Construction and Maintenance Occupations by Sex
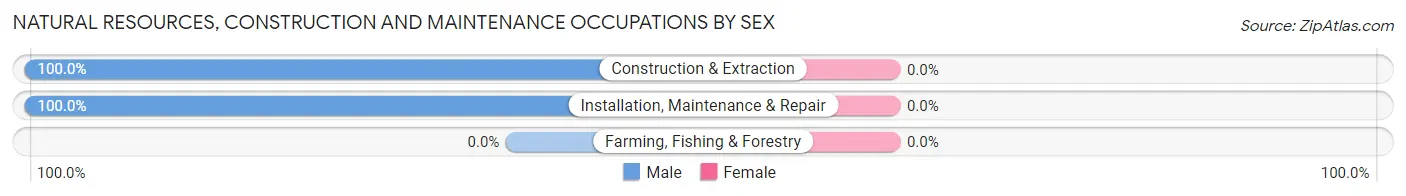
| Occupation | Male | Female |
| Farming, Fishing & Forestry | 0 (0.0%) | 0 (0.0%) |
| Construction & Extraction | 10 (100.0%) | 0 (0.0%) |
| Installation, Maintenance & Repair | 2 (100.0%) | 0 (0.0%) |
| Total (Category) | 12 (100.0%) | 0 (0.0%) |
| Total (Overall) | 18 (37.5%) | 30 (62.5%) |
Production, Transportation and Moving Occupations
The most common Production, Transportation and Moving occupations in Vandiver are , and Production (12 | 25.0%).
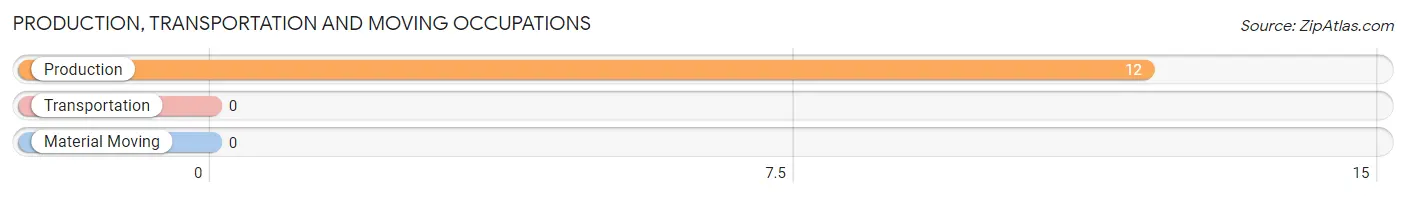
Production, Transportation and Moving Occupations by Sex
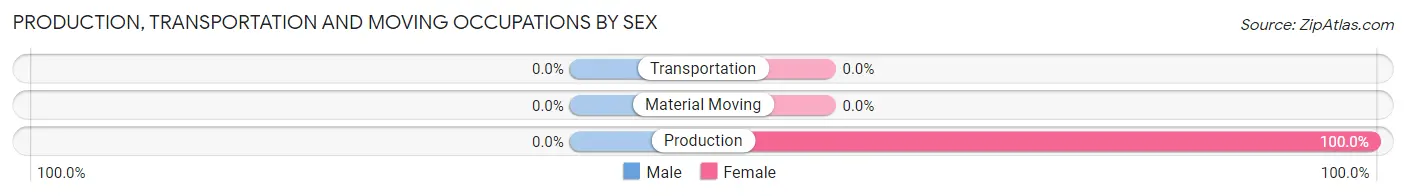
| Occupation | Male | Female |
| Production | 0 (0.0%) | 12 (100.0%) |
| Transportation | 0 (0.0%) | 0 (0.0%) |
| Material Moving | 0 (0.0%) | 0 (0.0%) |
| Total (Category) | 0 (0.0%) | 12 (100.0%) |
| Total (Overall) | 18 (37.5%) | 30 (62.5%) |
Employment Industries by Sex in Vandiver
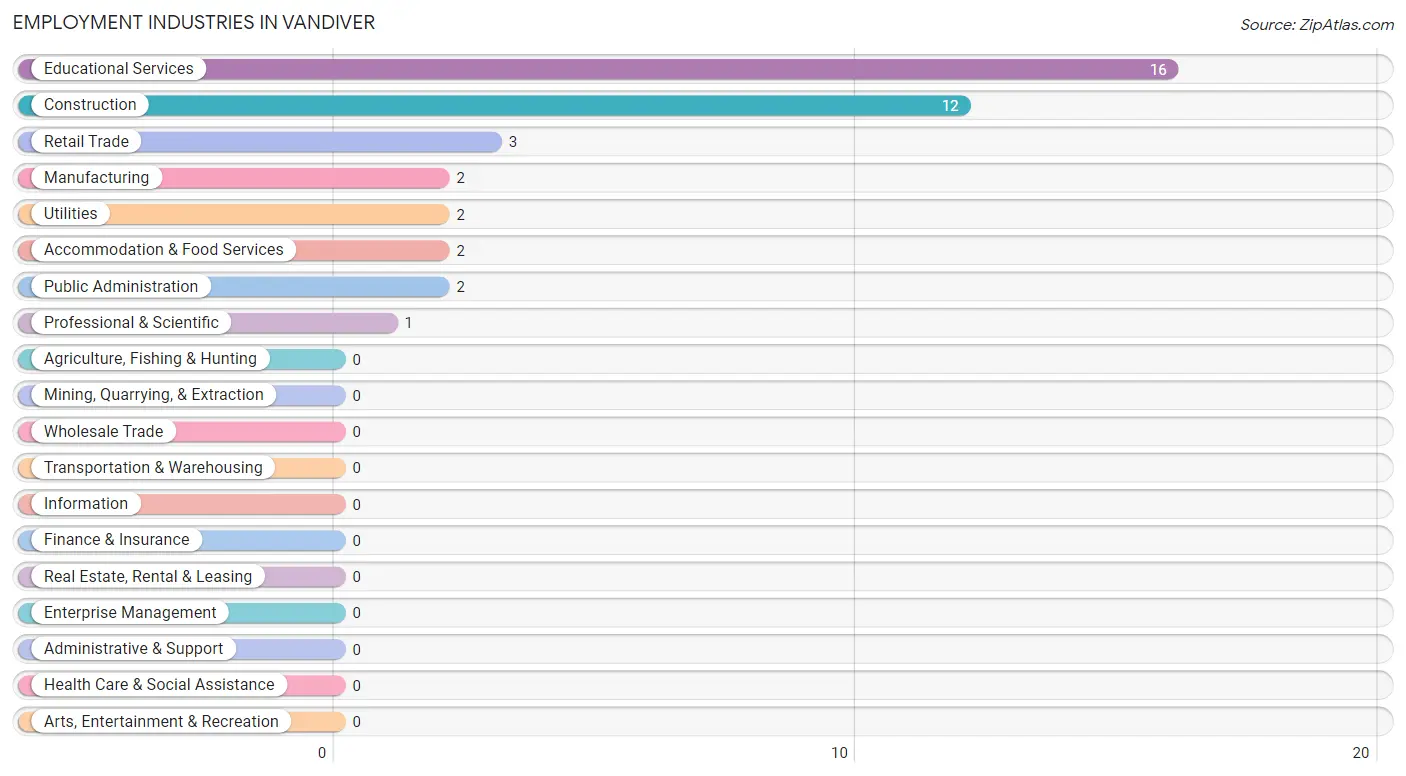
Employment Industries in Vandiver
The major employment industries in Vandiver include Educational Services (16 | 33.3%), Construction (12 | 25.0%), Retail Trade (3 | 6.2%), Manufacturing (2 | 4.2%), and Utilities (2 | 4.2%).
Employment Industries by Sex in Vandiver
The Vandiver industries that see more men than women are Construction (100.0%), Manufacturing (100.0%), and Utilities (100.0%), whereas the industries that tend to have a higher number of women are Retail Trade (100.0%), Professional & Scientific (100.0%), and Educational Services (100.0%).
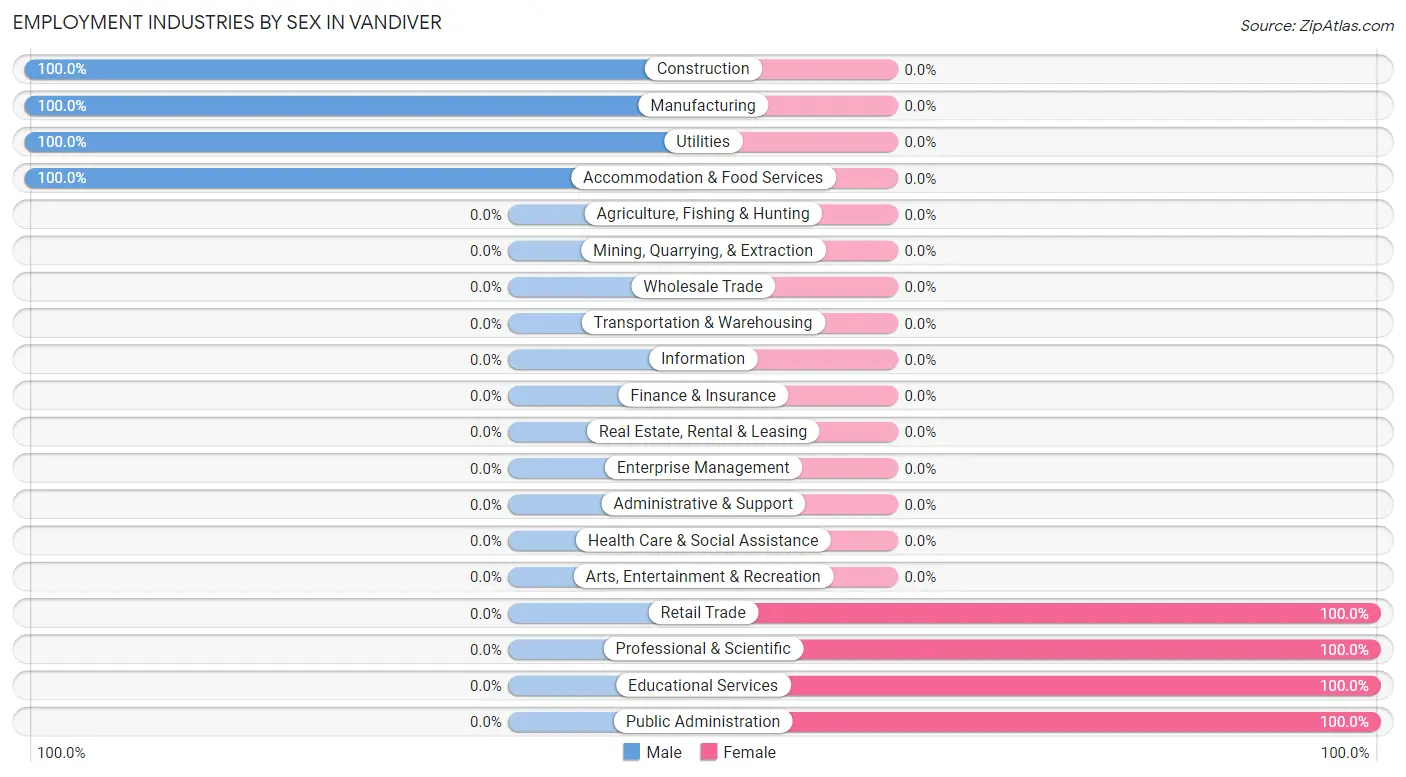
| Industry | Male | Female |
| Agriculture, Fishing & Hunting | 0 (0.0%) | 0 (0.0%) |
| Mining, Quarrying, & Extraction | 0 (0.0%) | 0 (0.0%) |
| Construction | 12 (100.0%) | 0 (0.0%) |
| Manufacturing | 2 (100.0%) | 0 (0.0%) |
| Wholesale Trade | 0 (0.0%) | 0 (0.0%) |
| Retail Trade | 0 (0.0%) | 3 (100.0%) |
| Transportation & Warehousing | 0 (0.0%) | 0 (0.0%) |
| Utilities | 2 (100.0%) | 0 (0.0%) |
| Information | 0 (0.0%) | 0 (0.0%) |
| Finance & Insurance | 0 (0.0%) | 0 (0.0%) |
| Real Estate, Rental & Leasing | 0 (0.0%) | 0 (0.0%) |
| Professional & Scientific | 0 (0.0%) | 1 (100.0%) |
| Enterprise Management | 0 (0.0%) | 0 (0.0%) |
| Administrative & Support | 0 (0.0%) | 0 (0.0%) |
| Educational Services | 0 (0.0%) | 16 (100.0%) |
| Health Care & Social Assistance | 0 (0.0%) | 0 (0.0%) |
| Arts, Entertainment & Recreation | 0 (0.0%) | 0 (0.0%) |
| Accommodation & Food Services | 2 (100.0%) | 0 (0.0%) |
| Public Administration | 0 (0.0%) | 2 (100.0%) |
| Total | 18 (37.5%) | 30 (62.5%) |
Education in Vandiver
School Enrollment in Vandiver
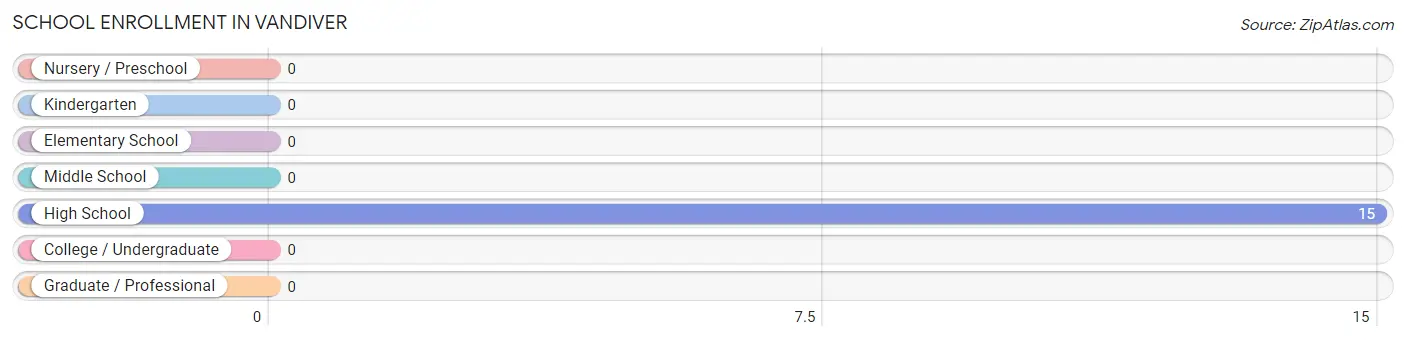
| School Level | # Students | % Students |
| Nursery / Preschool | 0 | 0.0% |
| Kindergarten | 0 | 0.0% |
| Elementary School | 0 | 0.0% |
| Middle School | 0 | 0.0% |
| High School | 15 | 100.0% |
| College / Undergraduate | 0 | 0.0% |
| Graduate / Professional | 0 | 0.0% |
| Total | 15 | 100.0% |
School Enrollment by Age by Funding Source in Vandiver
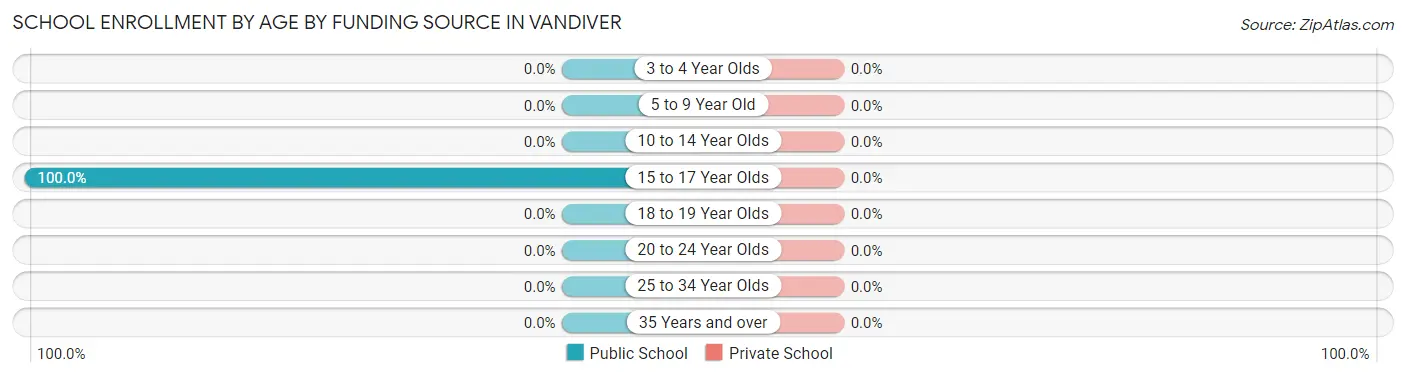
| Age Bracket | Public School | Private School |
| 3 to 4 Year Olds | 0 (0.0%) | 0 (0.0%) |
| 5 to 9 Year Old | 0 (0.0%) | 0 (0.0%) |
| 10 to 14 Year Olds | 0 (0.0%) | 0 (0.0%) |
| 15 to 17 Year Olds | 15 (100.0%) | 0 (0.0%) |
| 18 to 19 Year Olds | 0 (0.0%) | 0 (0.0%) |
| 20 to 24 Year Olds | 0 (0.0%) | 0 (0.0%) |
| 25 to 34 Year Olds | 0 (0.0%) | 0 (0.0%) |
| 35 Years and over | 0 (0.0%) | 0 (0.0%) |
| Total | 15 (100.0%) | 0 (0.0%) |
Educational Attainment by Field of Study in Vandiver
Education (16 | 76.2%), psychology (3 | 14.3%), and business (2 | 9.5%) are the most common fields of study among 21 individuals in Vandiver who have obtained a bachelor's degree or higher.
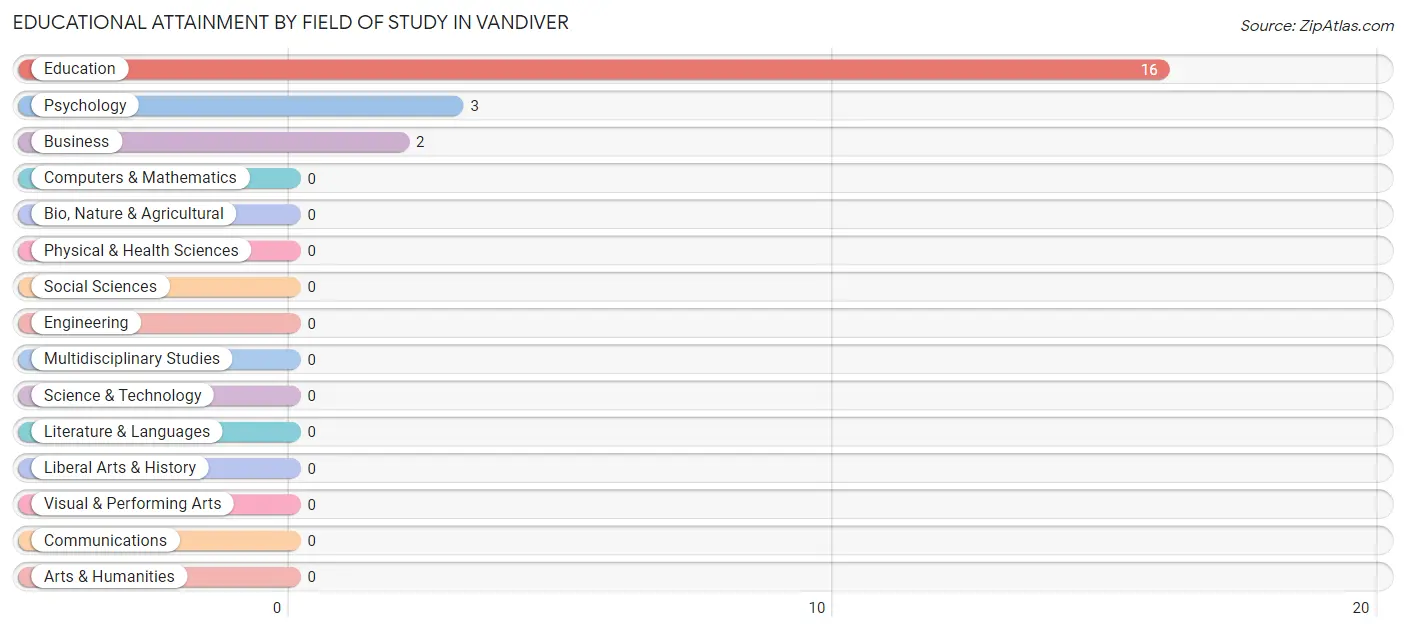
| Field of Study | # Graduates | % Graduates |
| Computers & Mathematics | 0 | 0.0% |
| Bio, Nature & Agricultural | 0 | 0.0% |
| Physical & Health Sciences | 0 | 0.0% |
| Psychology | 3 | 14.3% |
| Social Sciences | 0 | 0.0% |
| Engineering | 0 | 0.0% |
| Multidisciplinary Studies | 0 | 0.0% |
| Science & Technology | 0 | 0.0% |
| Business | 2 | 9.5% |
| Education | 16 | 76.2% |
| Literature & Languages | 0 | 0.0% |
| Liberal Arts & History | 0 | 0.0% |
| Visual & Performing Arts | 0 | 0.0% |
| Communications | 0 | 0.0% |
| Arts & Humanities | 0 | 0.0% |
| Total | 21 | 100.0% |
Transportation & Commute in Vandiver
Vehicle Availability by Sex in Vandiver
The most prevalent vehicle ownership categories in Vandiver are males with 4 vehicles (10, accounting for 55.6%) and females with 4 vehicles (8, making up 37.0%).
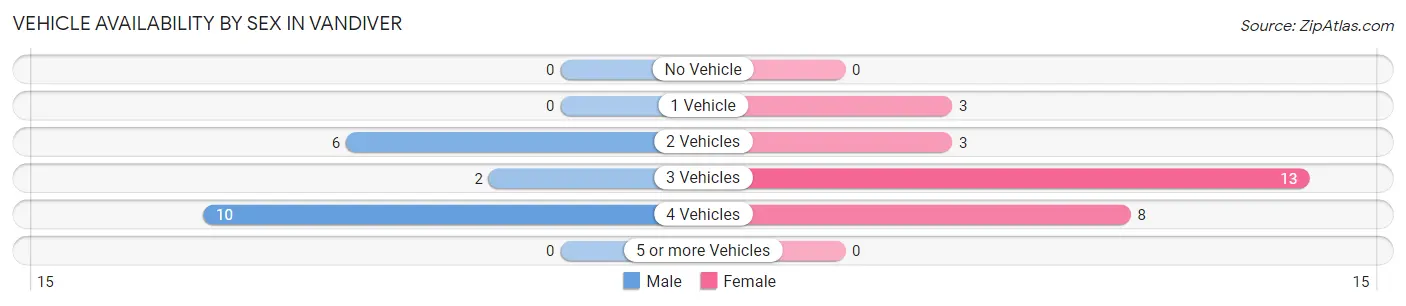
| Vehicles Available | Male | Female |
| No Vehicle | 0 (0.0%) | 0 (0.0%) |
| 1 Vehicle | 0 (0.0%) | 3 (11.1%) |
| 2 Vehicles | 6 (33.3%) | 3 (11.1%) |
| 3 Vehicles | 2 (11.1%) | 13 (48.1%) |
| 4 Vehicles | 10 (55.6%) | 8 (29.6%) |
| 5 or more Vehicles | 0 (0.0%) | 0 (0.0%) |
| Total | 18 (100.0%) | 27 (100.0%) |
Commute Time in Vandiver
The most frequently occuring commute durations in Vandiver are 5 to 9 minutes (18 commuters, 40.0%), 45 to 59 minutes (10 commuters, 22.2%), and 20 to 24 minutes (5 commuters, 11.1%).
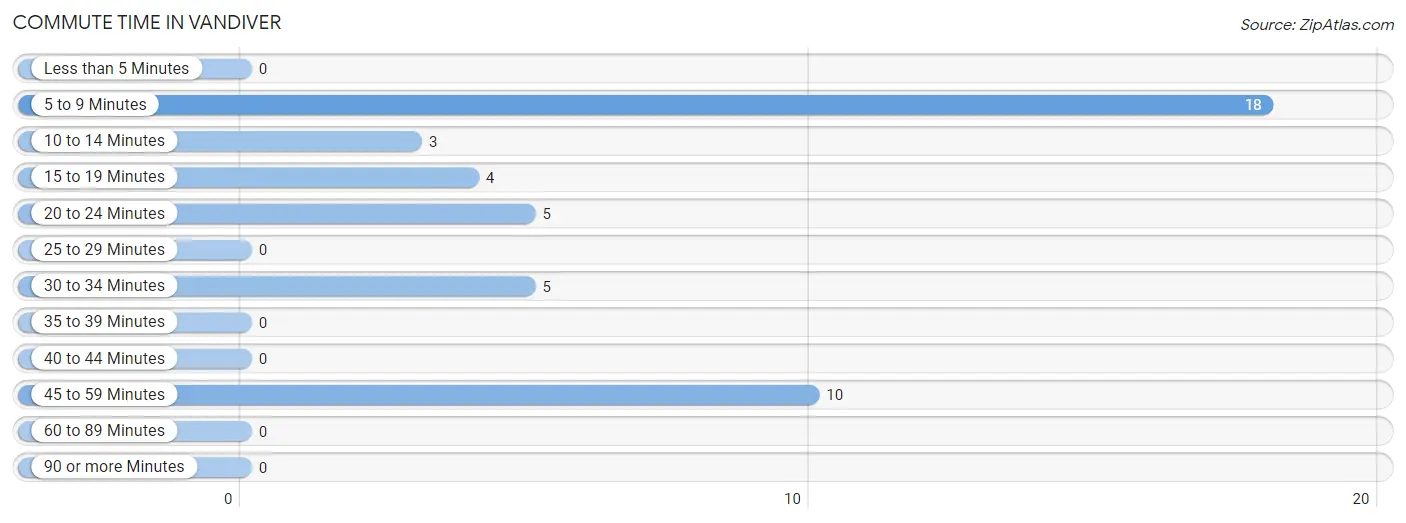
| Commute Time | # Commuters | % Commuters |
| Less than 5 Minutes | 0 | 0.0% |
| 5 to 9 Minutes | 18 | 40.0% |
| 10 to 14 Minutes | 3 | 6.7% |
| 15 to 19 Minutes | 4 | 8.9% |
| 20 to 24 Minutes | 5 | 11.1% |
| 25 to 29 Minutes | 0 | 0.0% |
| 30 to 34 Minutes | 5 | 11.1% |
| 35 to 39 Minutes | 0 | 0.0% |
| 40 to 44 Minutes | 0 | 0.0% |
| 45 to 59 Minutes | 10 | 22.2% |
| 60 to 89 Minutes | 0 | 0.0% |
| 90 or more Minutes | 0 | 0.0% |
Commute Time by Sex in Vandiver
The most common commute times in Vandiver are 20 to 24 minutes (5 commuters, 27.8%) for males and 5 to 9 minutes (16 commuters, 59.3%) for females.
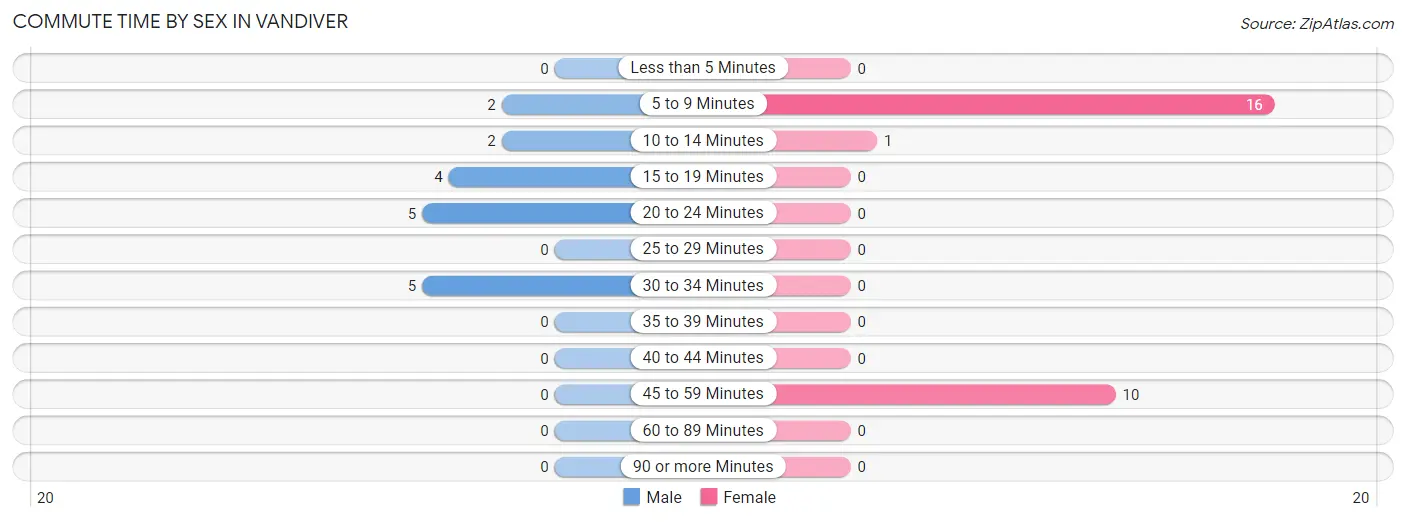
| Commute Time | Male | Female |
| Less than 5 Minutes | 0 (0.0%) | 0 (0.0%) |
| 5 to 9 Minutes | 2 (11.1%) | 16 (59.3%) |
| 10 to 14 Minutes | 2 (11.1%) | 1 (3.7%) |
| 15 to 19 Minutes | 4 (22.2%) | 0 (0.0%) |
| 20 to 24 Minutes | 5 (27.8%) | 0 (0.0%) |
| 25 to 29 Minutes | 0 (0.0%) | 0 (0.0%) |
| 30 to 34 Minutes | 5 (27.8%) | 0 (0.0%) |
| 35 to 39 Minutes | 0 (0.0%) | 0 (0.0%) |
| 40 to 44 Minutes | 0 (0.0%) | 0 (0.0%) |
| 45 to 59 Minutes | 0 (0.0%) | 10 (37.0%) |
| 60 to 89 Minutes | 0 (0.0%) | 0 (0.0%) |
| 90 or more Minutes | 0 (0.0%) | 0 (0.0%) |
Time of Departure to Work by Sex in Vandiver
The most frequent times of departure to work in Vandiver are 6:00 AM to 6:29 AM (7, 38.9%) for males and 7:00 AM to 7:29 AM (12, 44.4%) for females.
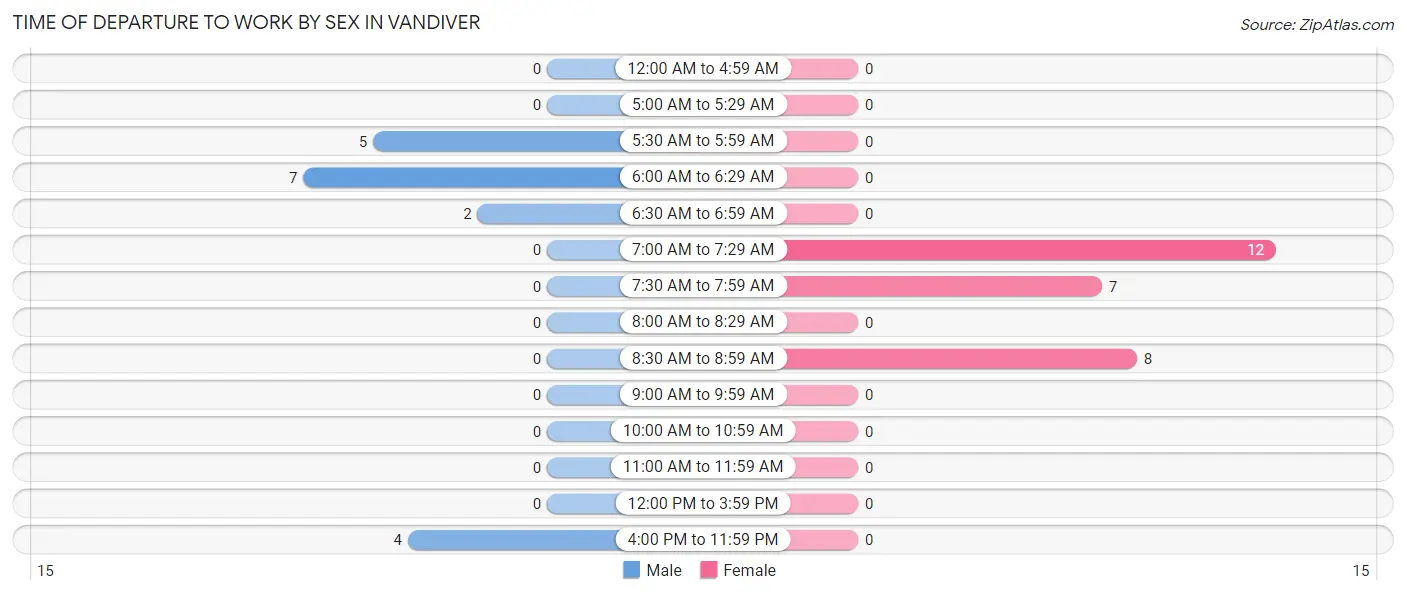
| Time of Departure | Male | Female |
| 12:00 AM to 4:59 AM | 0 (0.0%) | 0 (0.0%) |
| 5:00 AM to 5:29 AM | 0 (0.0%) | 0 (0.0%) |
| 5:30 AM to 5:59 AM | 5 (27.8%) | 0 (0.0%) |
| 6:00 AM to 6:29 AM | 7 (38.9%) | 0 (0.0%) |
| 6:30 AM to 6:59 AM | 2 (11.1%) | 0 (0.0%) |
| 7:00 AM to 7:29 AM | 0 (0.0%) | 12 (44.4%) |
| 7:30 AM to 7:59 AM | 0 (0.0%) | 7 (25.9%) |
| 8:00 AM to 8:29 AM | 0 (0.0%) | 0 (0.0%) |
| 8:30 AM to 8:59 AM | 0 (0.0%) | 8 (29.6%) |
| 9:00 AM to 9:59 AM | 0 (0.0%) | 0 (0.0%) |
| 10:00 AM to 10:59 AM | 0 (0.0%) | 0 (0.0%) |
| 11:00 AM to 11:59 AM | 0 (0.0%) | 0 (0.0%) |
| 12:00 PM to 3:59 PM | 0 (0.0%) | 0 (0.0%) |
| 4:00 PM to 11:59 PM | 4 (22.2%) | 0 (0.0%) |
| Total | 18 (100.0%) | 27 (100.0%) |
Housing Occupancy in Vandiver
Occupancy by Ownership in Vandiver
Of the total 46 dwellings in Vandiver, owner-occupied units account for 36 (78.3%), while renter-occupied units make up 10 (21.7%).
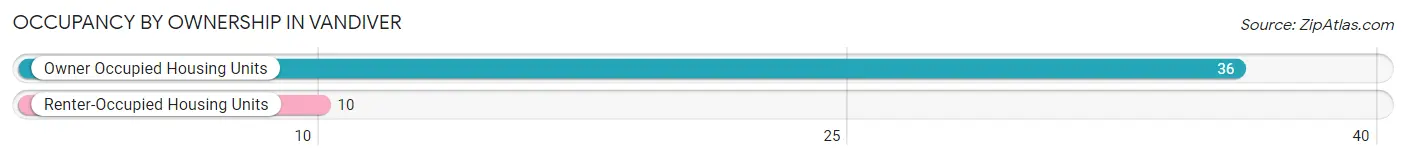
| Occupancy | # Housing Units | % Housing Units |
| Owner Occupied Housing Units | 36 | 78.3% |
| Renter-Occupied Housing Units | 10 | 21.7% |
| Total Occupied Housing Units | 46 | 100.0% |
Occupancy by Household Size in Vandiver
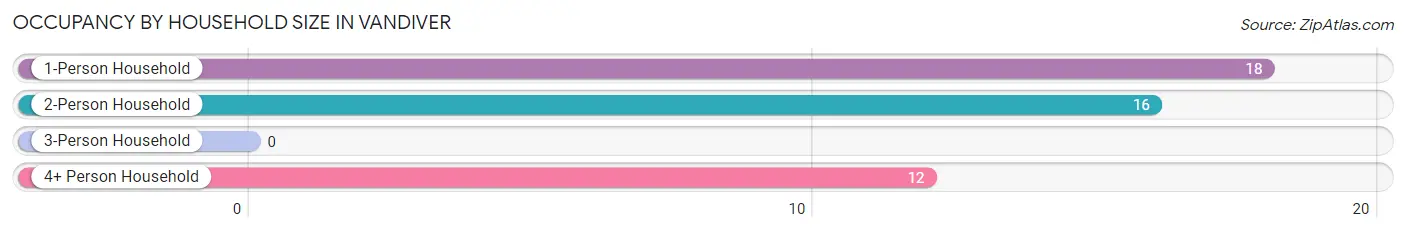
| Household Size | # Housing Units | % Housing Units |
| 1-Person Household | 18 | 39.1% |
| 2-Person Household | 16 | 34.8% |
| 3-Person Household | 0 | 0.0% |
| 4+ Person Household | 12 | 26.1% |
| Total Housing Units | 46 | 100.0% |
Occupancy by Ownership by Household Size in Vandiver
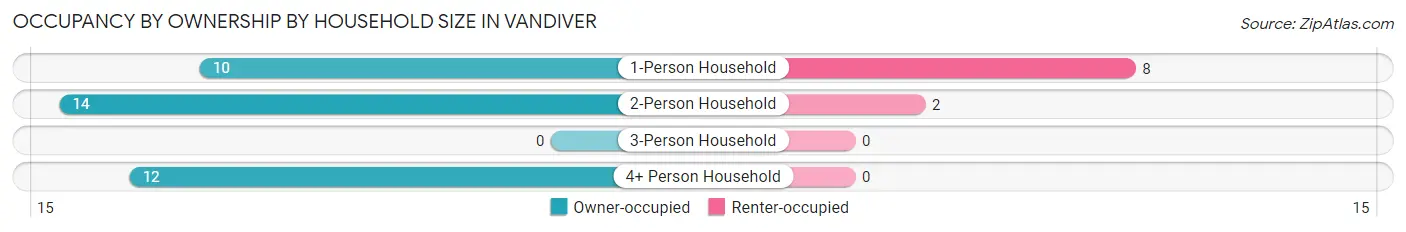
| Household Size | Owner-occupied | Renter-occupied |
| 1-Person Household | 10 (55.6%) | 8 (44.4%) |
| 2-Person Household | 14 (87.5%) | 2 (12.5%) |
| 3-Person Household | 0 (0.0%) | 0 (0.0%) |
| 4+ Person Household | 12 (100.0%) | 0 (0.0%) |
| Total Housing Units | 36 (78.3%) | 10 (21.7%) |
Occupancy by Educational Attainment in Vandiver
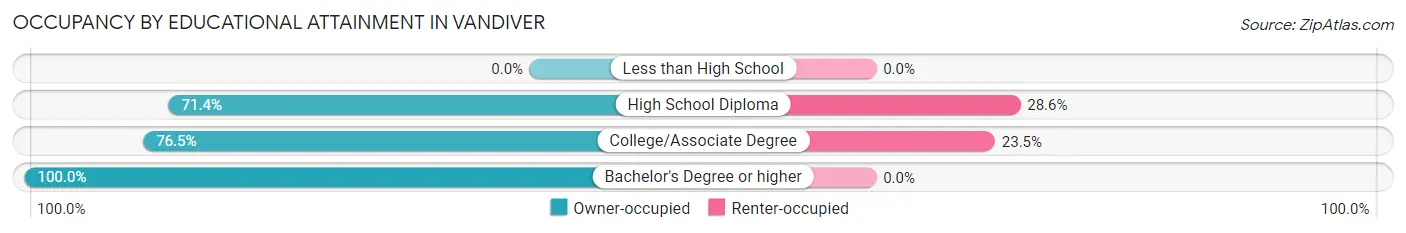
| Household Size | Owner-occupied | Renter-occupied |
| Less than High School | 0 (0.0%) | 0 (0.0%) |
| High School Diploma | 15 (71.4%) | 6 (28.6%) |
| College/Associate Degree | 13 (76.5%) | 4 (23.5%) |
| Bachelor's Degree or higher | 8 (100.0%) | 0 (0.0%) |
Occupancy by Age of Householder in Vandiver
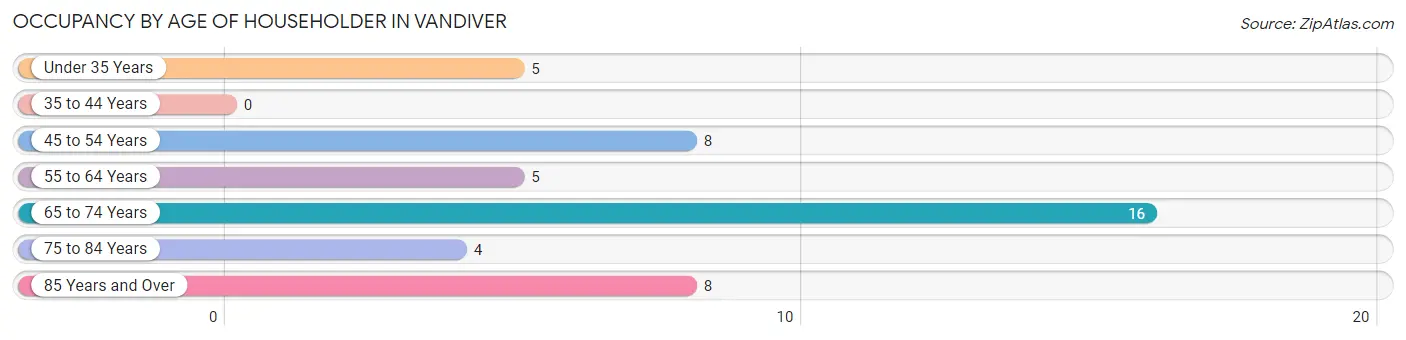
| Age Bracket | # Households | % Households |
| Under 35 Years | 5 | 10.9% |
| 35 to 44 Years | 0 | 0.0% |
| 45 to 54 Years | 8 | 17.4% |
| 55 to 64 Years | 5 | 10.9% |
| 65 to 74 Years | 16 | 34.8% |
| 75 to 84 Years | 4 | 8.7% |
| 85 Years and Over | 8 | 17.4% |
| Total | 46 | 100.0% |
Housing Finances in Vandiver
Median Income by Occupancy in Vandiver
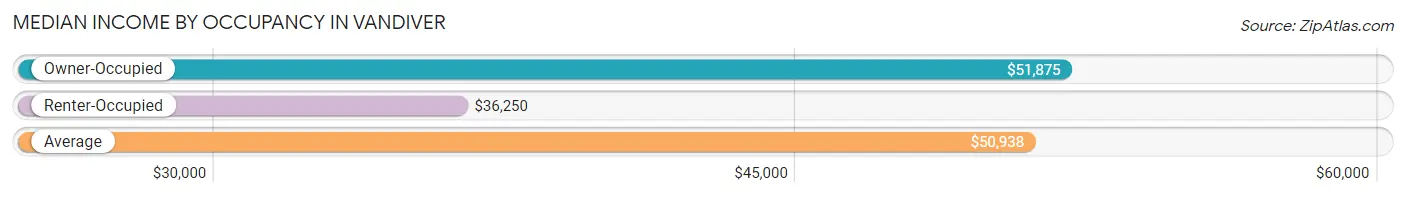
| Occupancy Type | # Households | Median Income |
| Owner-Occupied | 36 (78.3%) | $51,875 |
| Renter-Occupied | 10 (21.7%) | $36,250 |
| Average | 46 (100.0%) | $50,938 |
Occupancy by Householder Income Bracket in Vandiver
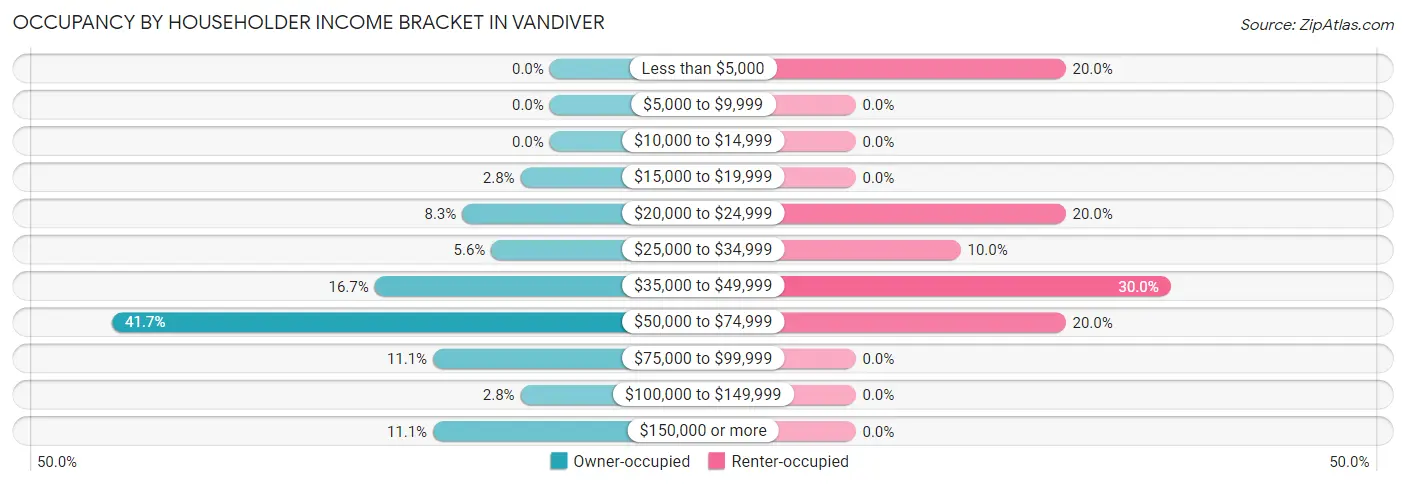
| Income Bracket | Owner-occupied | Renter-occupied |
| Less than $5,000 | 0 (0.0%) | 2 (20.0%) |
| $5,000 to $9,999 | 0 (0.0%) | 0 (0.0%) |
| $10,000 to $14,999 | 0 (0.0%) | 0 (0.0%) |
| $15,000 to $19,999 | 1 (2.8%) | 0 (0.0%) |
| $20,000 to $24,999 | 3 (8.3%) | 2 (20.0%) |
| $25,000 to $34,999 | 2 (5.6%) | 1 (10.0%) |
| $35,000 to $49,999 | 6 (16.7%) | 3 (30.0%) |
| $50,000 to $74,999 | 15 (41.7%) | 2 (20.0%) |
| $75,000 to $99,999 | 4 (11.1%) | 0 (0.0%) |
| $100,000 to $149,999 | 1 (2.8%) | 0 (0.0%) |
| $150,000 or more | 4 (11.1%) | 0 (0.0%) |
| Total | 36 (100.0%) | 10 (100.0%) |
Monthly Housing Cost Tiers in Vandiver
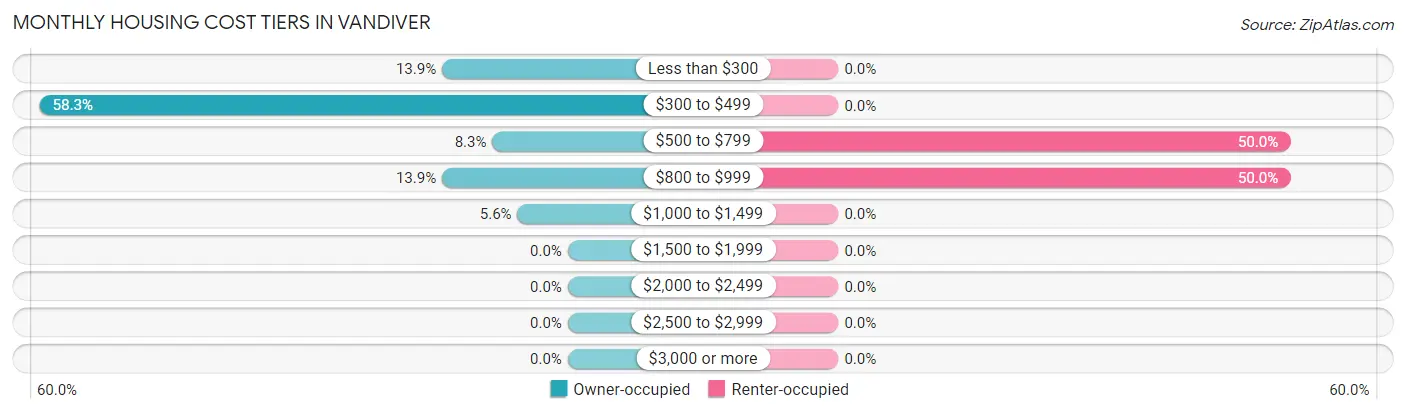
| Monthly Cost | Owner-occupied | Renter-occupied |
| Less than $300 | 5 (13.9%) | 0 (0.0%) |
| $300 to $499 | 21 (58.3%) | 0 (0.0%) |
| $500 to $799 | 3 (8.3%) | 5 (50.0%) |
| $800 to $999 | 5 (13.9%) | 5 (50.0%) |
| $1,000 to $1,499 | 2 (5.6%) | 0 (0.0%) |
| $1,500 to $1,999 | 0 (0.0%) | 0 (0.0%) |
| $2,000 to $2,499 | 0 (0.0%) | 0 (0.0%) |
| $2,500 to $2,999 | 0 (0.0%) | 0 (0.0%) |
| $3,000 or more | 0 (0.0%) | 0 (0.0%) |
| Total | 36 (100.0%) | 10 (100.0%) |
Physical Housing Characteristics in Vandiver
Housing Structures in Vandiver
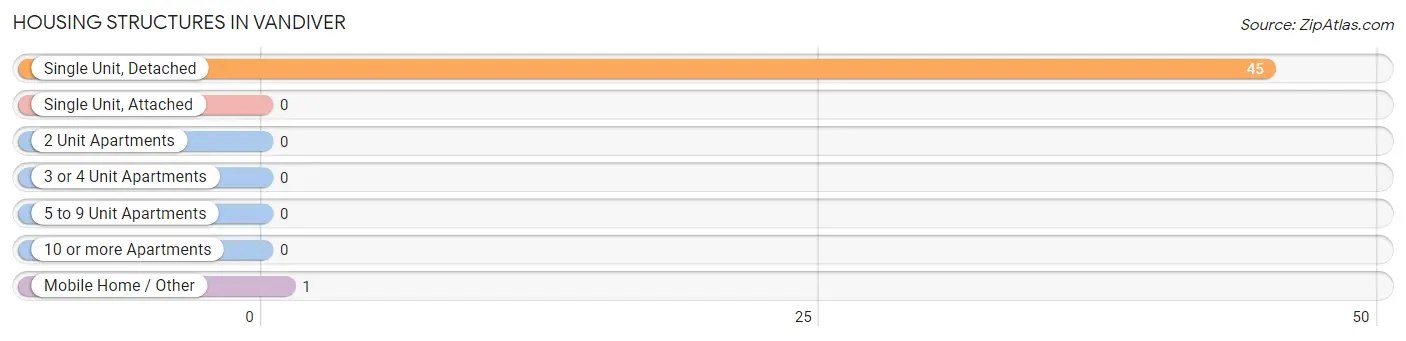
| Structure Type | # Housing Units | % Housing Units |
| Single Unit, Detached | 45 | 97.8% |
| Single Unit, Attached | 0 | 0.0% |
| 2 Unit Apartments | 0 | 0.0% |
| 3 or 4 Unit Apartments | 0 | 0.0% |
| 5 to 9 Unit Apartments | 0 | 0.0% |
| 10 or more Apartments | 0 | 0.0% |
| Mobile Home / Other | 1 | 2.2% |
| Total | 46 | 100.0% |
Housing Structures by Occupancy in Vandiver
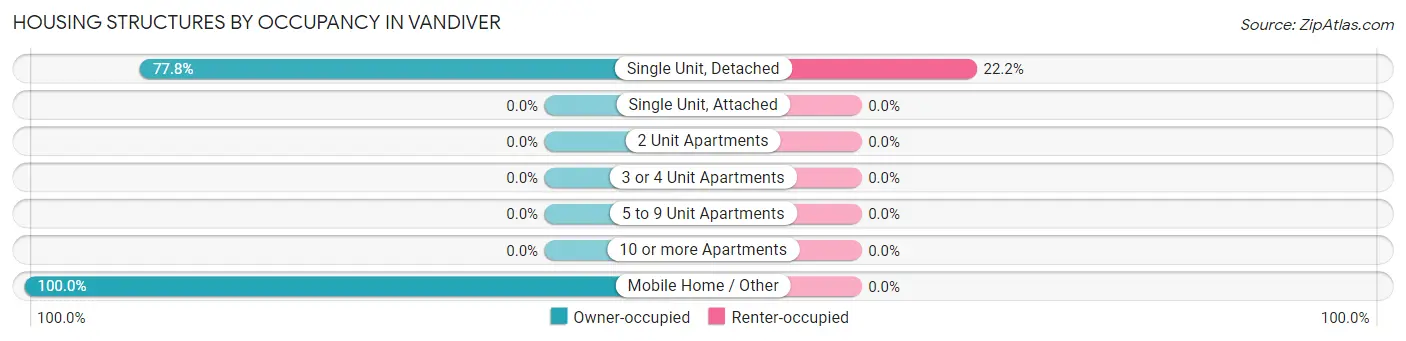
| Structure Type | Owner-occupied | Renter-occupied |
| Single Unit, Detached | 35 (77.8%) | 10 (22.2%) |
| Single Unit, Attached | 0 (0.0%) | 0 (0.0%) |
| 2 Unit Apartments | 0 (0.0%) | 0 (0.0%) |
| 3 or 4 Unit Apartments | 0 (0.0%) | 0 (0.0%) |
| 5 to 9 Unit Apartments | 0 (0.0%) | 0 (0.0%) |
| 10 or more Apartments | 0 (0.0%) | 0 (0.0%) |
| Mobile Home / Other | 1 (100.0%) | 0 (0.0%) |
| Total | 36 (78.3%) | 10 (21.7%) |
Housing Structures by Number of Rooms in Vandiver
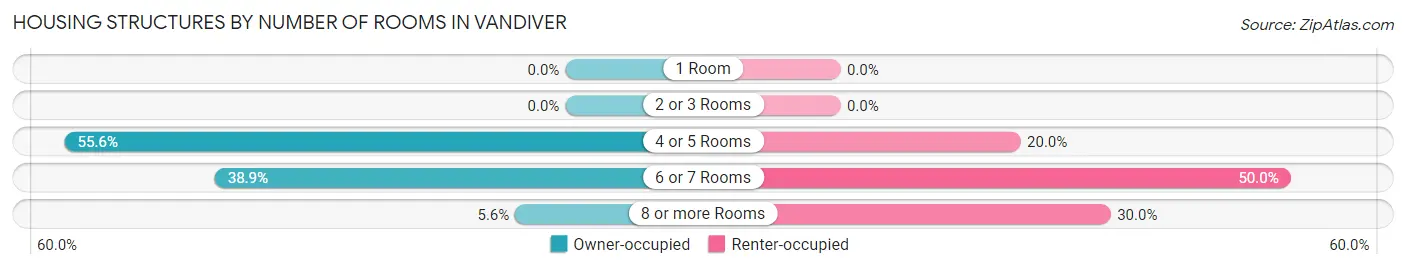
| Number of Rooms | Owner-occupied | Renter-occupied |
| 1 Room | 0 (0.0%) | 0 (0.0%) |
| 2 or 3 Rooms | 0 (0.0%) | 0 (0.0%) |
| 4 or 5 Rooms | 20 (55.6%) | 2 (20.0%) |
| 6 or 7 Rooms | 14 (38.9%) | 5 (50.0%) |
| 8 or more Rooms | 2 (5.6%) | 3 (30.0%) |
| Total | 36 (100.0%) | 10 (100.0%) |
Housing Structure by Heating Type in Vandiver
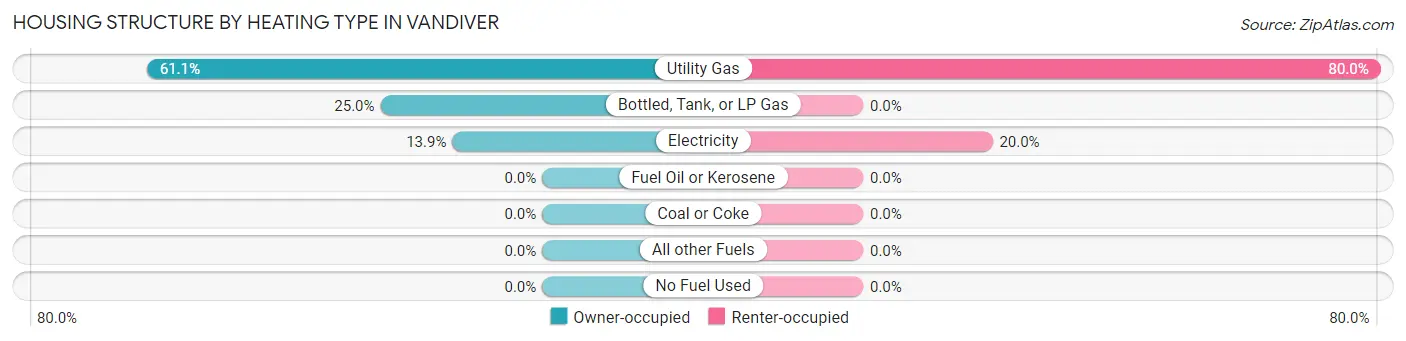
| Heating Type | Owner-occupied | Renter-occupied |
| Utility Gas | 22 (61.1%) | 8 (80.0%) |
| Bottled, Tank, or LP Gas | 9 (25.0%) | 0 (0.0%) |
| Electricity | 5 (13.9%) | 2 (20.0%) |
| Fuel Oil or Kerosene | 0 (0.0%) | 0 (0.0%) |
| Coal or Coke | 0 (0.0%) | 0 (0.0%) |
| All other Fuels | 0 (0.0%) | 0 (0.0%) |
| No Fuel Used | 0 (0.0%) | 0 (0.0%) |
| Total | 36 (100.0%) | 10 (100.0%) |
Household Vehicle Usage in Vandiver
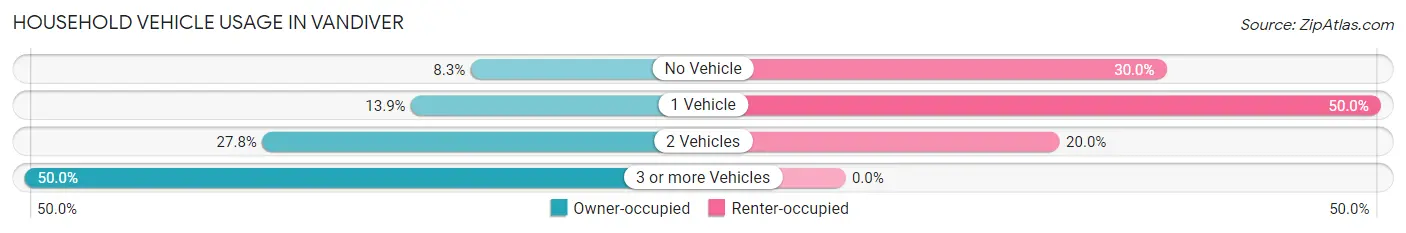
| Vehicles per Household | Owner-occupied | Renter-occupied |
| No Vehicle | 3 (8.3%) | 3 (30.0%) |
| 1 Vehicle | 5 (13.9%) | 5 (50.0%) |
| 2 Vehicles | 10 (27.8%) | 2 (20.0%) |
| 3 or more Vehicles | 18 (50.0%) | 0 (0.0%) |
| Total | 36 (100.0%) | 10 (100.0%) |
Real Estate & Mortgages in Vandiver
Real Estate and Mortgage Overview in Vandiver
| Characteristic | Without Mortgage | With Mortgage |
| Housing Units | 29 | 7 |
| Median Property Value | $85,800 | $95,000 |
| Median Household Income | $51,719 | $2 |
| Monthly Housing Costs | $392 | $0 |
| Real Estate Taxes | $1,017 | $0 |
Property Value by Mortgage Status in Vandiver
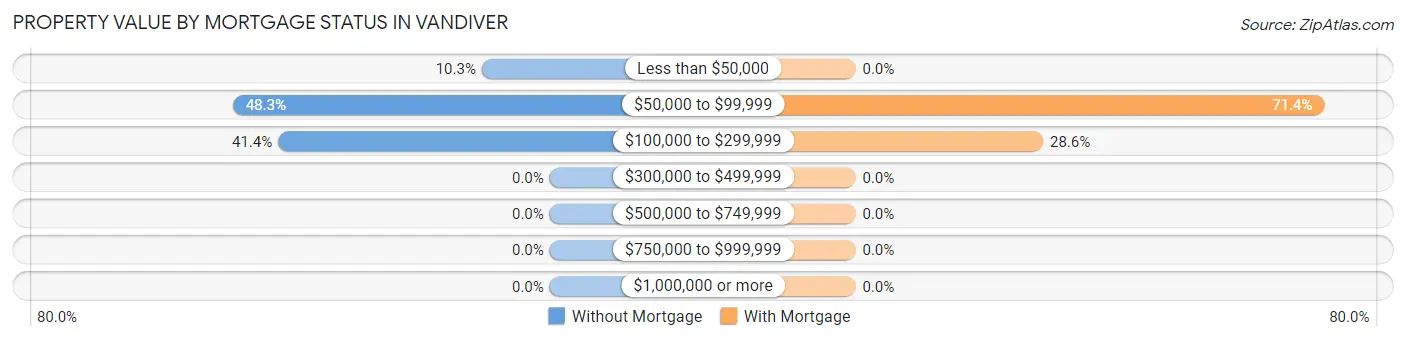
| Property Value | Without Mortgage | With Mortgage |
| Less than $50,000 | 3 (10.3%) | 0 (0.0%) |
| $50,000 to $99,999 | 14 (48.3%) | 5 (71.4%) |
| $100,000 to $299,999 | 12 (41.4%) | 2 (28.6%) |
| $300,000 to $499,999 | 0 (0.0%) | 0 (0.0%) |
| $500,000 to $749,999 | 0 (0.0%) | 0 (0.0%) |
| $750,000 to $999,999 | 0 (0.0%) | 0 (0.0%) |
| $1,000,000 or more | 0 (0.0%) | 0 (0.0%) |
| Total | 29 (100.0%) | 7 (100.0%) |
Household Income by Mortgage Status in Vandiver
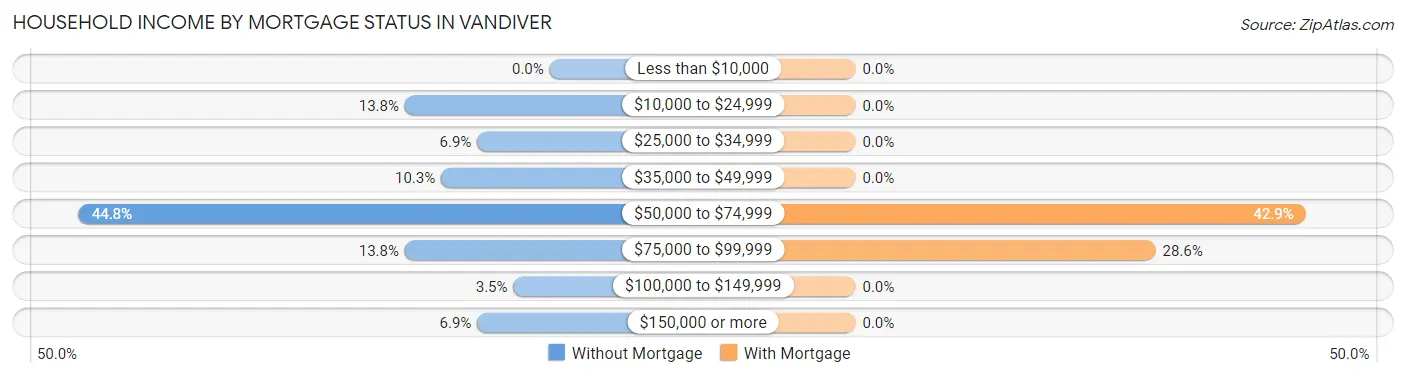
| Household Income | Without Mortgage | With Mortgage |
| Less than $10,000 | 0 (0.0%) | 0 (0.0%) |
| $10,000 to $24,999 | 4 (13.8%) | 0 (0.0%) |
| $25,000 to $34,999 | 2 (6.9%) | 0 (0.0%) |
| $35,000 to $49,999 | 3 (10.3%) | 0 (0.0%) |
| $50,000 to $74,999 | 13 (44.8%) | 3 (42.9%) |
| $75,000 to $99,999 | 4 (13.8%) | 2 (28.6%) |
| $100,000 to $149,999 | 1 (3.5%) | 0 (0.0%) |
| $150,000 or more | 2 (6.9%) | 0 (0.0%) |
| Total | 29 (100.0%) | 7 (100.0%) |
Property Value to Household Income Ratio in Vandiver
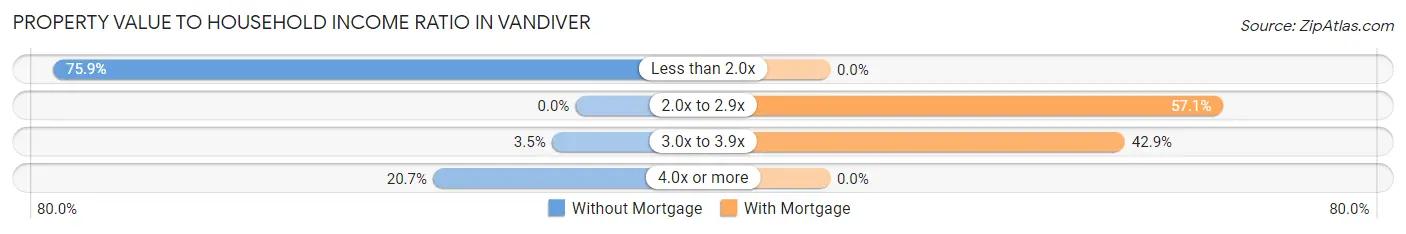
| Value-to-Income Ratio | Without Mortgage | With Mortgage |
| Less than 2.0x | 22 (75.9%) | 0 (0.0%) |
| 2.0x to 2.9x | 0 (0.0%) | 4 (57.1%) |
| 3.0x to 3.9x | 1 (3.5%) | 3 (42.9%) |
| 4.0x or more | 6 (20.7%) | 0 (0.0%) |
| Total | 29 (100.0%) | 7 (100.0%) |
Real Estate Taxes by Mortgage Status in Vandiver
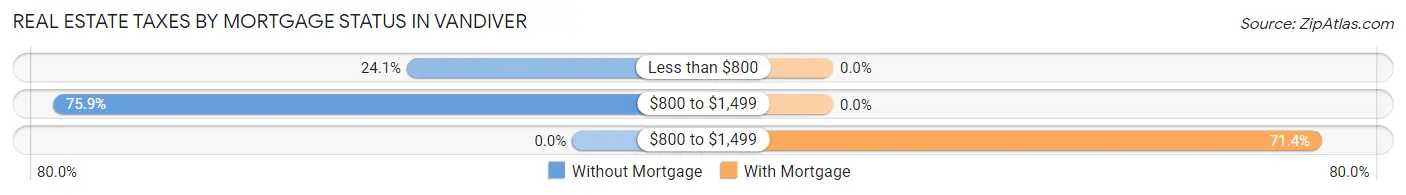
| Property Taxes | Without Mortgage | With Mortgage |
| Less than $800 | 7 (24.1%) | 0 (0.0%) |
| $800 to $1,499 | 22 (75.9%) | 0 (0.0%) |
| $800 to $1,499 | 0 (0.0%) | 5 (71.4%) |
| Total | 29 (100.0%) | 7 (100.0%) |
Health & Disability in Vandiver
Health Insurance Coverage by Age in Vandiver
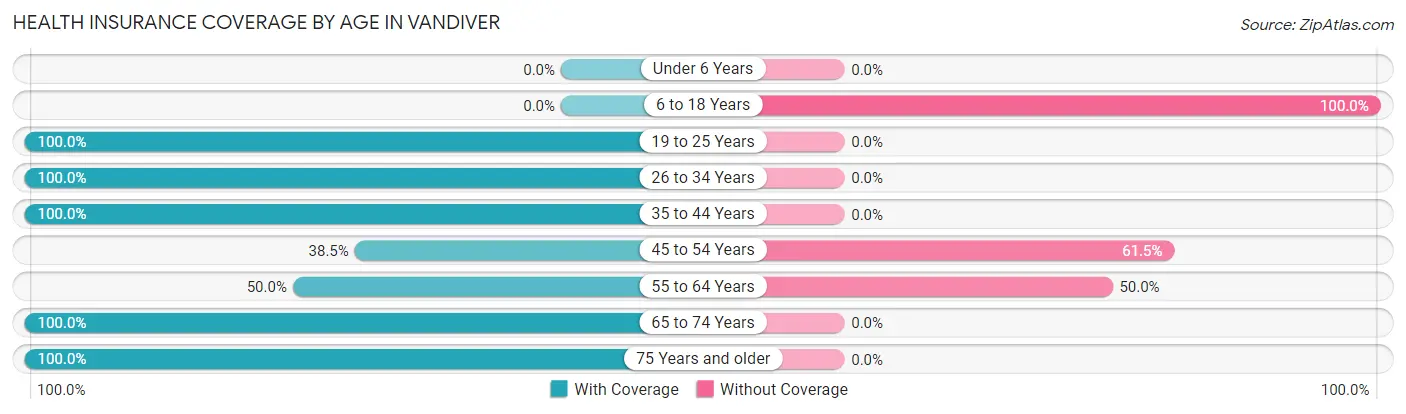
| Age Bracket | With Coverage | Without Coverage |
| Under 6 Years | 0 (0.0%) | 0 (0.0%) |
| 6 to 18 Years | 0 (0.0%) | 20 (100.0%) |
| 19 to 25 Years | 2 (100.0%) | 0 (0.0%) |
| 26 to 34 Years | 3 (100.0%) | 0 (0.0%) |
| 35 to 44 Years | 10 (100.0%) | 0 (0.0%) |
| 45 to 54 Years | 5 (38.5%) | 8 (61.5%) |
| 55 to 64 Years | 10 (50.0%) | 10 (50.0%) |
| 65 to 74 Years | 20 (100.0%) | 0 (0.0%) |
| 75 Years and older | 19 (100.0%) | 0 (0.0%) |
| Total | 69 (64.5%) | 38 (35.5%) |
Health Insurance Coverage by Citizenship Status in Vandiver
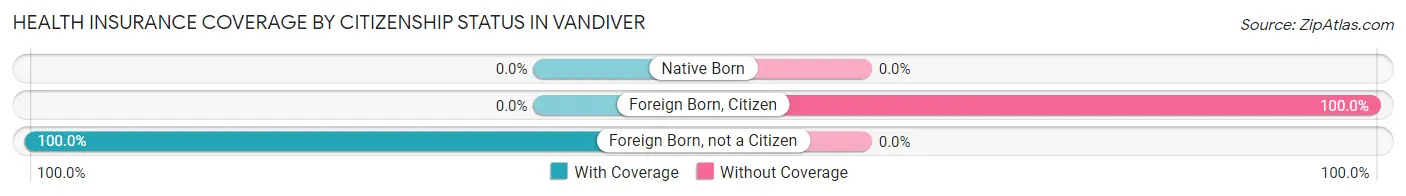
| Citizenship Status | With Coverage | Without Coverage |
| Native Born | 0 (0.0%) | 0 (0.0%) |
| Foreign Born, Citizen | 0 (0.0%) | 20 (100.0%) |
| Foreign Born, not a Citizen | 2 (100.0%) | 0 (0.0%) |
Health Insurance Coverage by Household Income in Vandiver
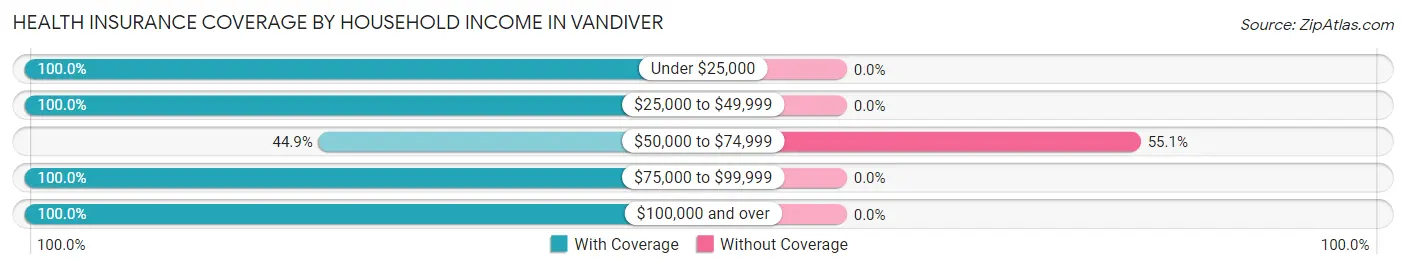
| Household Income | With Coverage | Without Coverage |
| Under $25,000 | 8 (100.0%) | 0 (0.0%) |
| $25,000 to $49,999 | 14 (100.0%) | 0 (0.0%) |
| $50,000 to $74,999 | 31 (44.9%) | 38 (55.1%) |
| $75,000 to $99,999 | 8 (100.0%) | 0 (0.0%) |
| $100,000 and over | 8 (100.0%) | 0 (0.0%) |
Public vs Private Health Insurance Coverage by Age in Vandiver
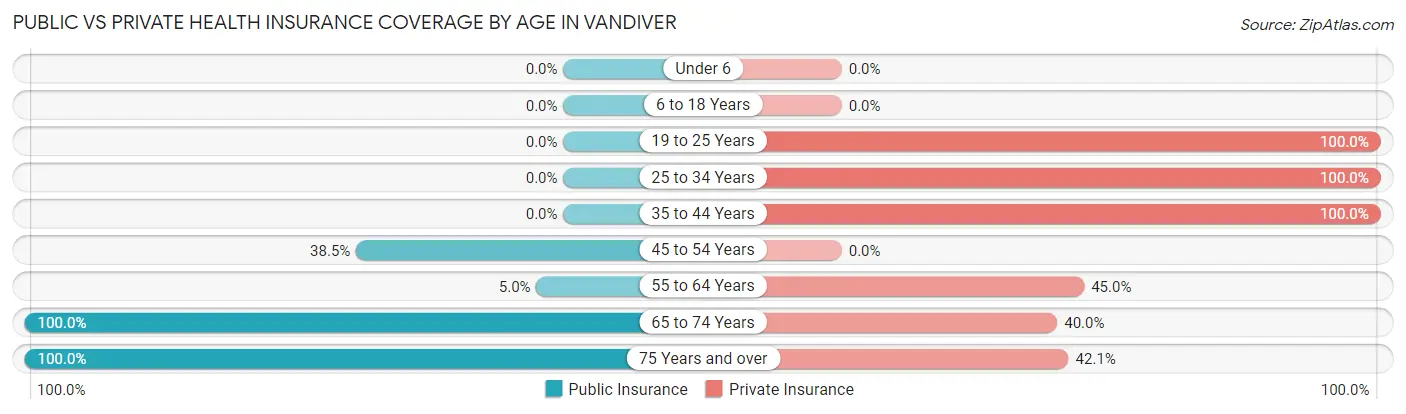
| Age Bracket | Public Insurance | Private Insurance |
| Under 6 | 0 (0.0%) | 0 (0.0%) |
| 6 to 18 Years | 0 (0.0%) | 0 (0.0%) |
| 19 to 25 Years | 0 (0.0%) | 2 (100.0%) |
| 25 to 34 Years | 0 (0.0%) | 3 (100.0%) |
| 35 to 44 Years | 0 (0.0%) | 10 (100.0%) |
| 45 to 54 Years | 5 (38.5%) | 0 (0.0%) |
| 55 to 64 Years | 1 (5.0%) | 9 (45.0%) |
| 65 to 74 Years | 20 (100.0%) | 8 (40.0%) |
| 75 Years and over | 19 (100.0%) | 8 (42.1%) |
| Total | 45 (42.1%) | 40 (37.4%) |
Disability Status by Sex by Age in Vandiver
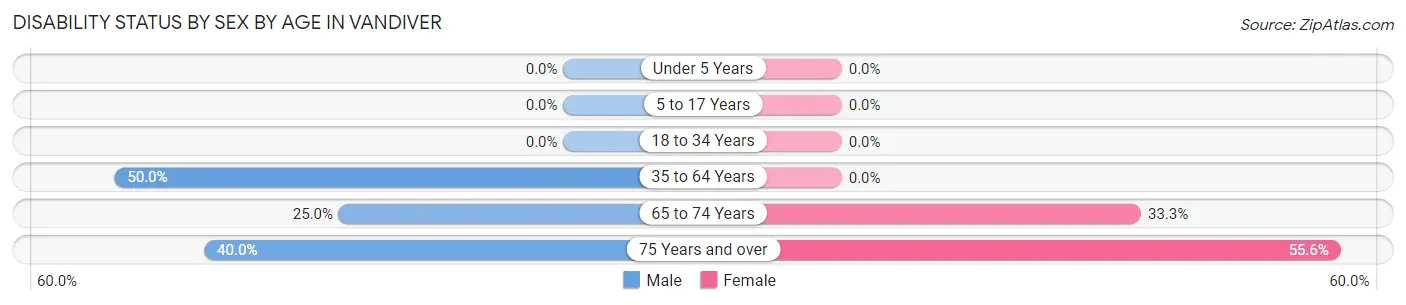
| Age Bracket | Male | Female |
| Under 5 Years | 0 (0.0%) | 0 (0.0%) |
| 5 to 17 Years | 0 (0.0%) | 0 (0.0%) |
| 18 to 34 Years | 0 (0.0%) | 0 (0.0%) |
| 35 to 64 Years | 11 (50.0%) | 0 (0.0%) |
| 65 to 74 Years | 2 (25.0%) | 4 (33.3%) |
| 75 Years and over | 4 (40.0%) | 5 (55.6%) |
Disability Class by Sex by Age in Vandiver
Disability Class: Hearing Difficulty
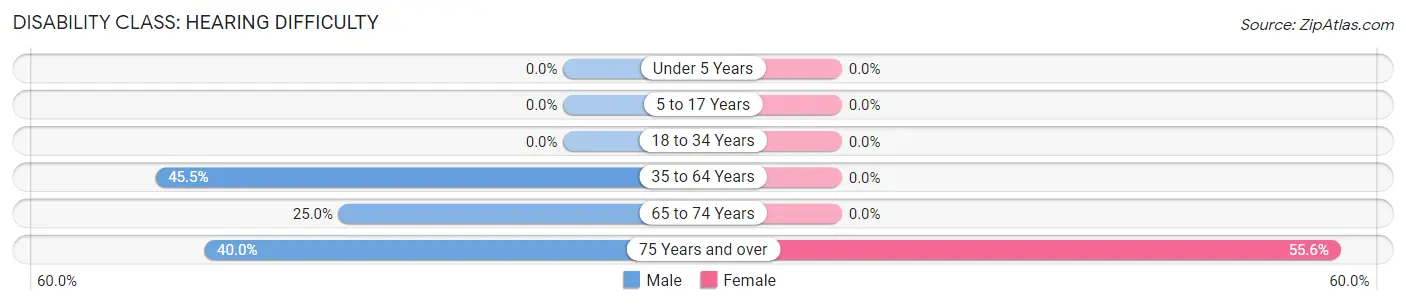
| Age Bracket | Male | Female |
| Under 5 Years | 0 (0.0%) | 0 (0.0%) |
| 5 to 17 Years | 0 (0.0%) | 0 (0.0%) |
| 18 to 34 Years | 0 (0.0%) | 0 (0.0%) |
| 35 to 64 Years | 10 (45.5%) | 0 (0.0%) |
| 65 to 74 Years | 2 (25.0%) | 0 (0.0%) |
| 75 Years and over | 4 (40.0%) | 5 (55.6%) |
Disability Class: Vision Difficulty
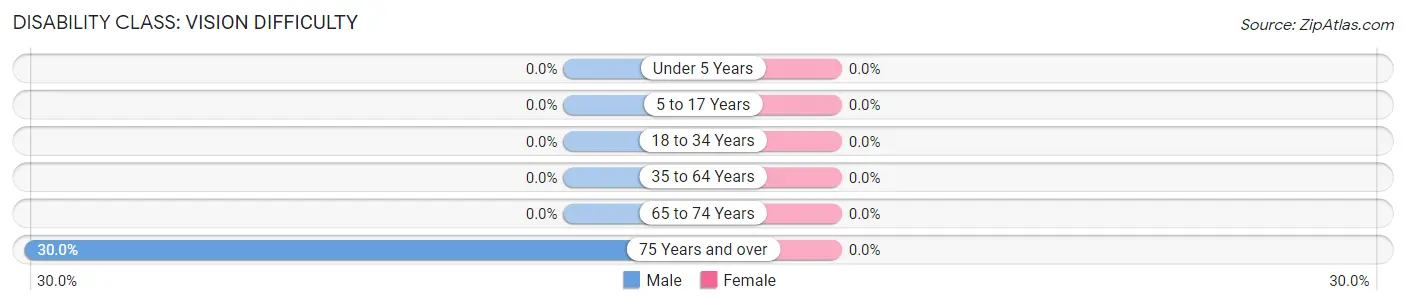
| Age Bracket | Male | Female |
| Under 5 Years | 0 (0.0%) | 0 (0.0%) |
| 5 to 17 Years | 0 (0.0%) | 0 (0.0%) |
| 18 to 34 Years | 0 (0.0%) | 0 (0.0%) |
| 35 to 64 Years | 0 (0.0%) | 0 (0.0%) |
| 65 to 74 Years | 0 (0.0%) | 0 (0.0%) |
| 75 Years and over | 3 (30.0%) | 0 (0.0%) |
Disability Class: Cognitive Difficulty
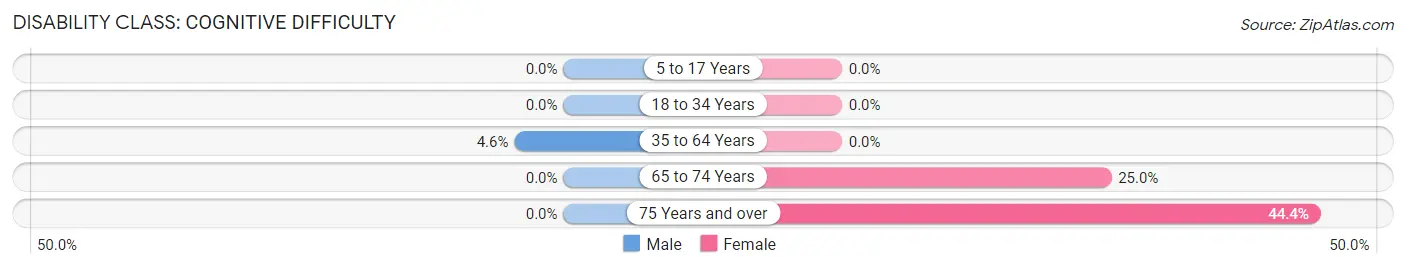
| Age Bracket | Male | Female |
| 5 to 17 Years | 0 (0.0%) | 0 (0.0%) |
| 18 to 34 Years | 0 (0.0%) | 0 (0.0%) |
| 35 to 64 Years | 1 (4.5%) | 0 (0.0%) |
| 65 to 74 Years | 0 (0.0%) | 3 (25.0%) |
| 75 Years and over | 0 (0.0%) | 4 (44.4%) |
Disability Class: Ambulatory Difficulty
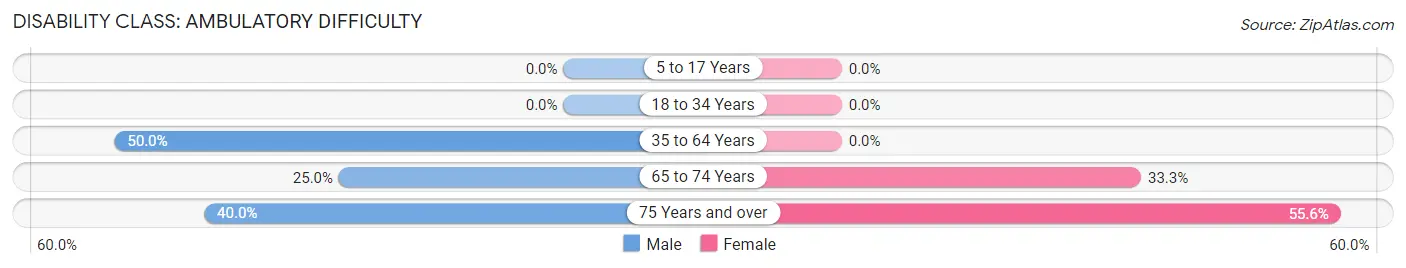
| Age Bracket | Male | Female |
| 5 to 17 Years | 0 (0.0%) | 0 (0.0%) |
| 18 to 34 Years | 0 (0.0%) | 0 (0.0%) |
| 35 to 64 Years | 11 (50.0%) | 0 (0.0%) |
| 65 to 74 Years | 2 (25.0%) | 4 (33.3%) |
| 75 Years and over | 4 (40.0%) | 5 (55.6%) |
Disability Class: Self-Care Difficulty
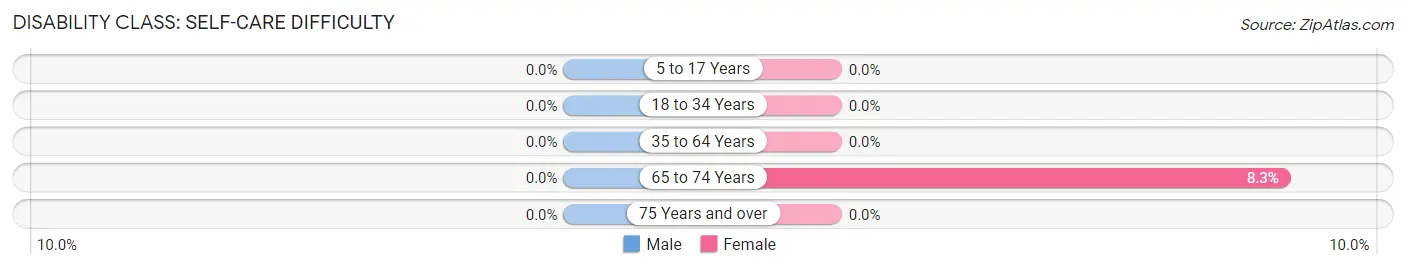
| Age Bracket | Male | Female |
| 5 to 17 Years | 0 (0.0%) | 0 (0.0%) |
| 18 to 34 Years | 0 (0.0%) | 0 (0.0%) |
| 35 to 64 Years | 0 (0.0%) | 0 (0.0%) |
| 65 to 74 Years | 0 (0.0%) | 1 (8.3%) |
| 75 Years and over | 0 (0.0%) | 0 (0.0%) |
Technology Access in Vandiver
Computing Device Access in Vandiver
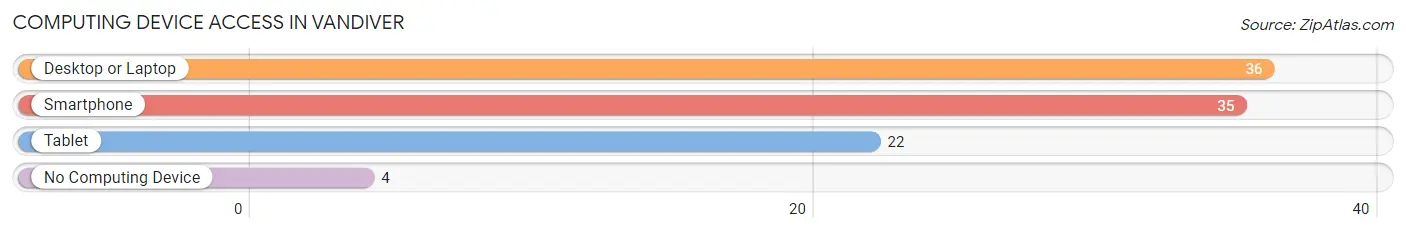
| Device Type | # Households | % Households |
| Desktop or Laptop | 36 | 78.3% |
| Smartphone | 35 | 76.1% |
| Tablet | 22 | 47.8% |
| No Computing Device | 4 | 8.7% |
| Total | 46 | 100.0% |
Internet Access in Vandiver
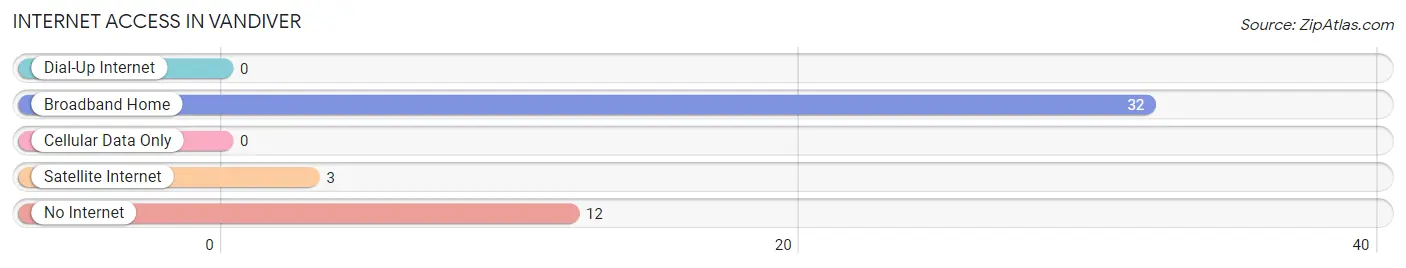
| Internet Type | # Households | % Households |
| Dial-Up Internet | 0 | 0.0% |
| Broadband Home | 32 | 69.6% |
| Cellular Data Only | 0 | 0.0% |
| Satellite Internet | 3 | 6.5% |
| No Internet | 12 | 26.1% |
| Total | 46 | 100.0% |
Vandiver Summary
Vandiver is a small unincorporated community located in Jefferson County, Missouri. It is situated on the banks of the Mississippi River, approximately 20 miles south of St. Louis. The population of Vandiver was estimated to be around 200 people in 2000.
History
Vandiver was founded in 1819 by William Vandiver, a Revolutionary War veteran. He purchased the land from the government and established a ferry service across the Mississippi River. The ferry service was a major source of income for the community and helped to establish it as a trading post.
In 1821, Vandiver was incorporated as a town. The town was named after William Vandiver and was the first town in Jefferson County. The town grew rapidly and soon became a major trading center for the surrounding area.
In 1845, Vandiver was connected to St. Louis by the St. Louis and Iron Mountain Railroad. This allowed for increased trade and commerce between the two cities.
In the late 19th century, Vandiver was a popular tourist destination. It was known for its scenic beauty and its proximity to St. Louis.
Geography
Vandiver is located in Jefferson County, Missouri. It is situated on the banks of the Mississippi River, approximately 20 miles south of St. Louis. The town is surrounded by rolling hills and farmland.
The climate in Vandiver is humid subtropical, with hot, humid summers and mild winters. The average annual temperature is around 60 degrees Fahrenheit.
Economy
The economy of Vandiver is largely based on agriculture. The town is home to several farms and ranches, which produce a variety of crops and livestock.
In addition to agriculture, Vandiver is home to several small businesses. These include a grocery store, a hardware store, a gas station, and a few restaurants.
Demographics
As of the 2000 census, the population of Vandiver was estimated to be around 200 people. The racial makeup of the town was 97.5% White, 0.5% African American, 0.5% Native American, and 1.5% from other races.
The median household income in Vandiver was $35,000, and the median family income was $41,000. The per capita income was $17,000.
Conclusion
Vandiver is a small unincorporated community located in Jefferson County, Missouri. It is situated on the banks of the Mississippi River, approximately 20 miles south of St. Louis. The population of Vandiver was estimated to be around 200 people in 2000. The town was founded in 1819 by William Vandiver and was the first town in Jefferson County. The economy of Vandiver is largely based on agriculture, and the town is home to several small businesses. The racial makeup of the town was 97.5% White, 0.5% African American, 0.5% Native American, and 1.5% from other races. The median household income in Vandiver was $35,000, and the median family income was $41,000. The per capita income was $17,000.
Common Questions
What is Per Capita Income in Vandiver?
Per Capita income in Vandiver is $27,011.
What is the Median Family Income in Vandiver?
Median Family Income in Vandiver is $63,750.
What is the Median Household income in Vandiver?
Median Household Income in Vandiver is $50,938.
What is Income or Wage Gap in Vandiver?
Income or Wage Gap in Vandiver is 35.8%.
Women in Vandiver earn 64.2 cents for every dollar earned by a man.
What is Inequality or Gini Index in Vandiver?
Inequality or Gini Index in Vandiver is 0.34.
What is the Total Population of Vandiver?
Total Population of Vandiver is 107.
What is the Total Male Population of Vandiver?
Total Male Population of Vandiver is 62.
What is the Total Female Population of Vandiver?
Total Female Population of Vandiver is 45.
What is the Ratio of Males per 100 Females in Vandiver?
There are 137.78 Males per 100 Females in Vandiver.
What is the Ratio of Females per 100 Males in Vandiver?
There are 72.58 Females per 100 Males in Vandiver.
What is the Median Population Age in Vandiver?
Median Population Age in Vandiver is 61.1 Years.
What is the Average Family Size in Vandiver
Average Family Size in Vandiver is 3.3 People.
What is the Average Household Size in Vandiver
Average Household Size in Vandiver is 2.3 People.
How Large is the Labor Force in Vandiver?
There are 48 People in the Labor Forcein in Vandiver.
What is the Percentage of People in the Labor Force in Vandiver?
48.5% of People are in the Labor Force in Vandiver.