Zip Codes with the Highest Percentage of Population Employed in Real Estate, Rental & Leasing in Leawood, KS
RELATED REPORTS & OPTIONS
Real Estate, Rental & Leasing
Leawood
Compare Zip Codes
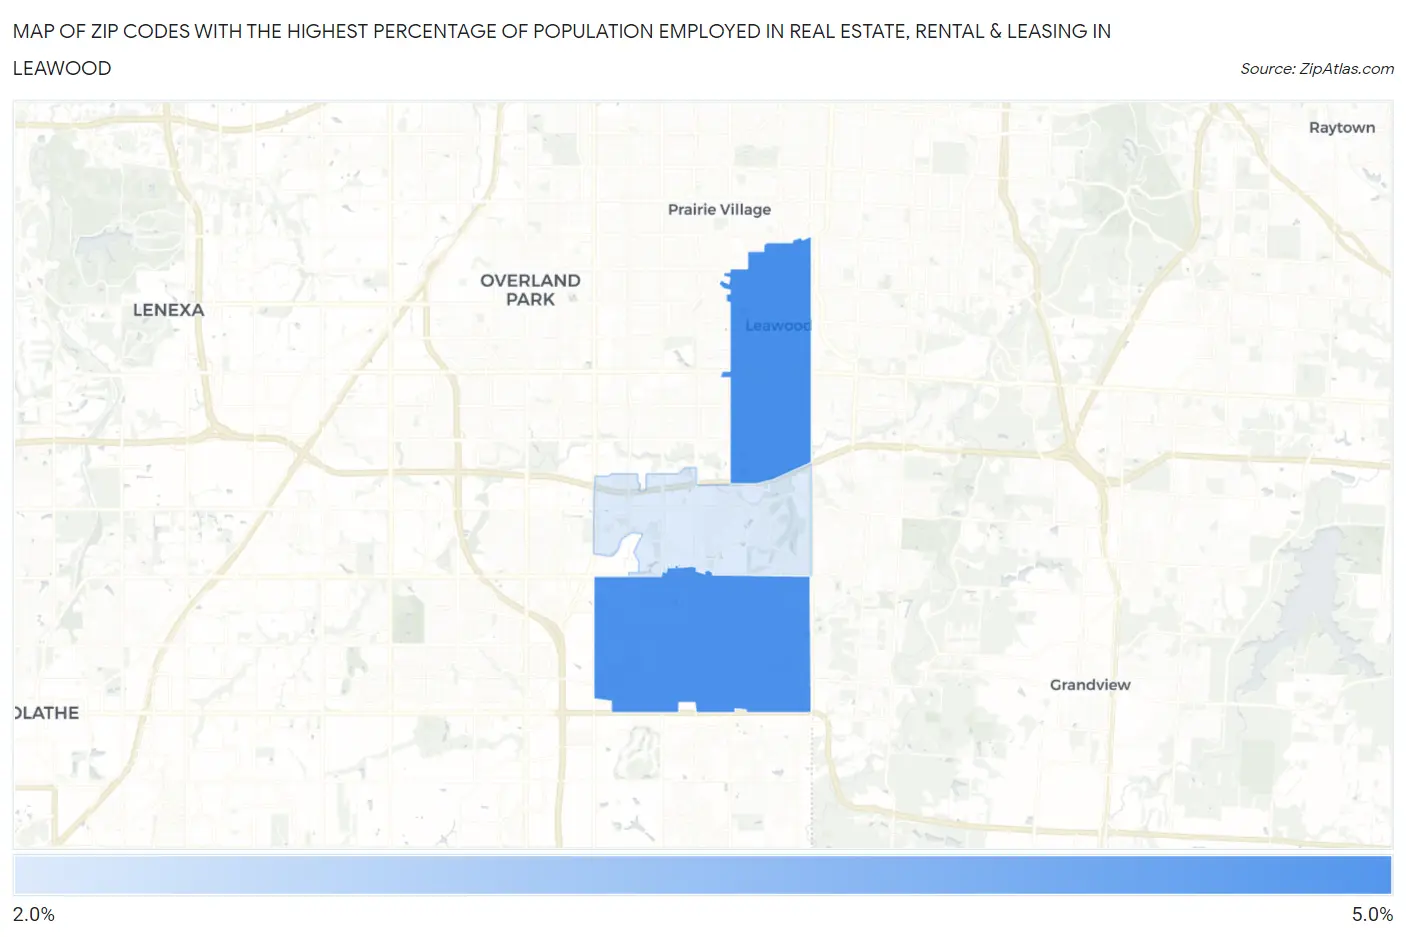
Map of Zip Codes with the Highest Percentage of Population Employed in Real Estate, Rental & Leasing in Leawood
2.4%
4.8%
Zip Codes with the Highest Percentage of Population Employed in Real Estate, Rental & Leasing in Leawood, KS
| Zip Code | % Employed | vs State | vs National | |
| 1. | 66206 | 4.8% | 1.4%(+3.40)#14 | 1.9%(+2.89)#1,517 |
| 2. | 66209 | 4.7% | 1.4%(+3.33)#16 | 1.9%(+2.82)#1,557 |
| 3. | 66211 | 2.4% | 1.4%(+1.05)#62 | 1.9%(+0.532)#5,784 |
1
Common Questions
What are the Top Zip Codes with the Highest Percentage of Population Employed in Real Estate, Rental & Leasing in Leawood, KS?
Top Zip Codes with the Highest Percentage of Population Employed in Real Estate, Rental & Leasing in Leawood, KS are:
What zip code has the Highest Percentage of Population Employed in Real Estate, Rental & Leasing in Leawood, KS?
66206 has the Highest Percentage of Population Employed in Real Estate, Rental & Leasing in Leawood, KS with 4.8%.
What is the Percentage of Population Employed in Real Estate, Rental & Leasing in Leawood, KS?
Percentage of Population Employed in Real Estate, Rental & Leasing in Leawood is 3.1%.
What is the Percentage of Population Employed in Real Estate, Rental & Leasing in Kansas?
Percentage of Population Employed in Real Estate, Rental & Leasing in Kansas is 1.4%.
What is the Percentage of Population Employed in Real Estate, Rental & Leasing in the United States?
Percentage of Population Employed in Real Estate, Rental & Leasing in the United States is 1.9%.