Gas, KS Map & Demographics
Gas Map
Gas Overview
$25,278
PER CAPITA INCOME
$66,184
AVG FAMILY INCOME
$58,750
AVG HOUSEHOLD INCOME
48.9%
WAGE / INCOME GAP [ % ]
51.1¢/ $1
WAGE / INCOME GAP [ $ ]
0.26
INEQUALITY / GINI INDEX
532
TOTAL POPULATION
296
MALE POPULATION
236
FEMALE POPULATION
125.42
MALES / 100 FEMALES
79.73
FEMALES / 100 MALES
45.0
MEDIAN AGE
3.7
AVG FAMILY SIZE
2.8
AVG HOUSEHOLD SIZE
292
LABOR FORCE [ PEOPLE ]
65.5%
PERCENT IN LABOR FORCE
2.7%
UNEMPLOYMENT RATE
Gas Zip Codes
Gas Area Codes
Income in Gas
Income Overview in Gas
Per Capita Income in Gas is $25,278, while median incomes of families and households are $66,184 and $58,750 respectively.
| Characteristic | Number | Measure |
| Per Capita Income | 532 | $25,278 |
| Median Family Income | 114 | $66,184 |
| Mean Family Income | 114 | $64,210 |
| Median Household Income | 193 | $58,750 |
| Mean Household Income | 193 | $59,969 |
| Income Deficit | 114 | $0 |
| Wage / Income Gap (%) | 532 | 48.93% |
| Wage / Income Gap ($) | 532 | 51.07¢ per $1 |
| Gini / Inequality Index | 532 | 0.26 |
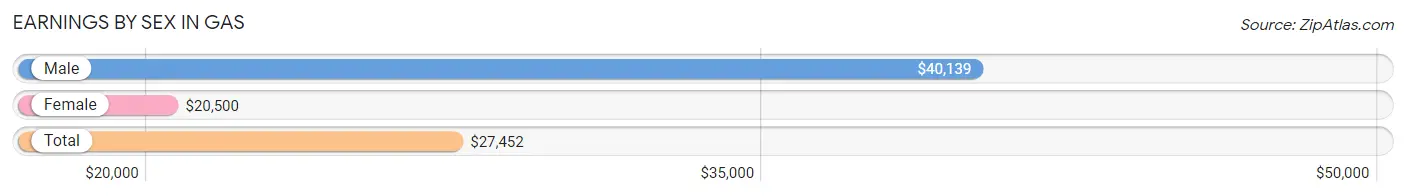
Earnings by Sex in Gas
Average Earnings in Gas are $27,452, $40,139 for men and $20,500 for women, a difference of 48.9%.
| Sex | Number | Average Earnings |
| Male | 197 (64.2%) | $40,139 |
| Female | 110 (35.8%) | $20,500 |
| Total | 307 (100.0%) | $27,452 |
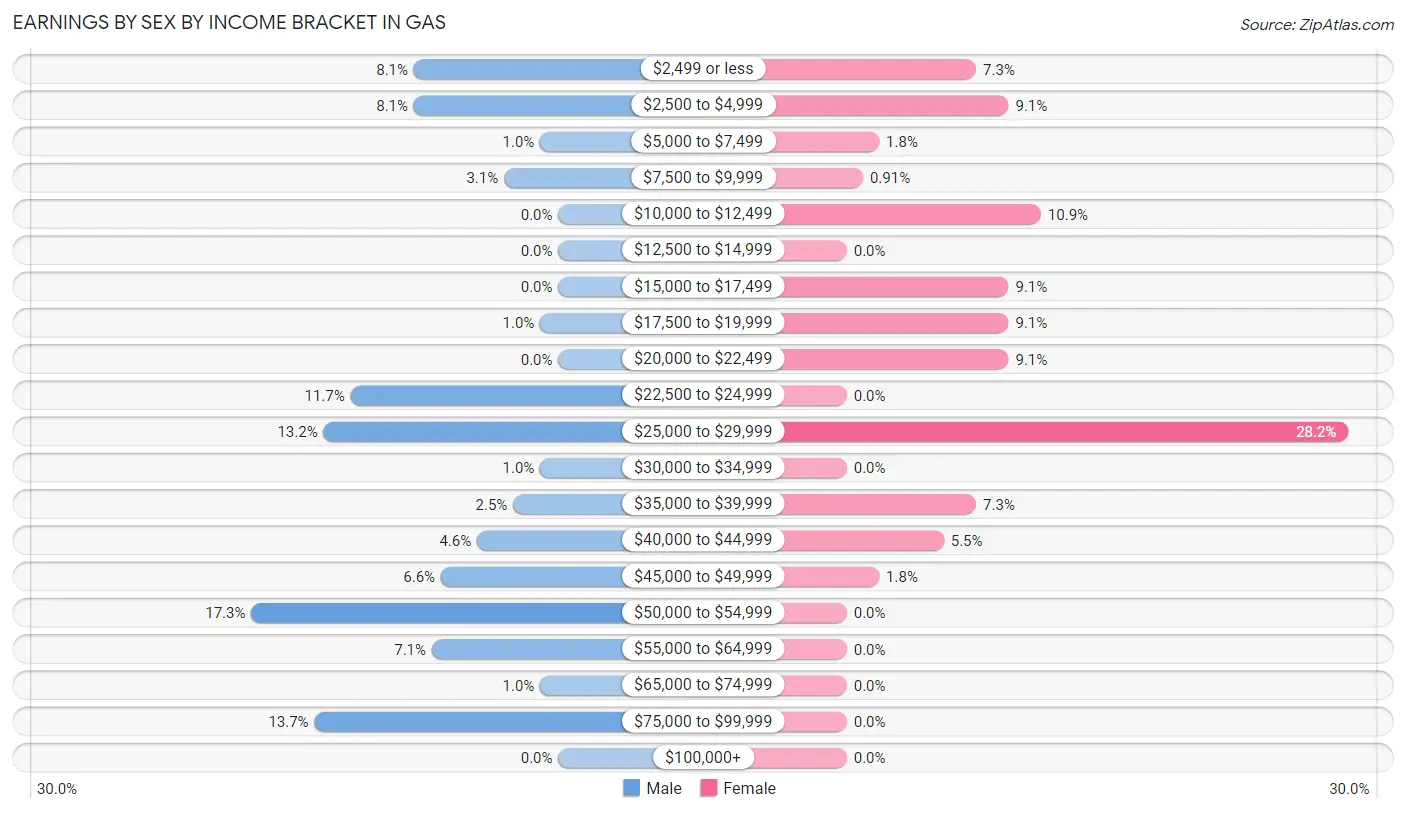
Earnings by Sex by Income Bracket in Gas
The most common earnings brackets in Gas are $50,000 to $54,999 for men (34 | 17.3%) and $25,000 to $29,999 for women (31 | 28.2%).
| Income | Male | Female |
| $2,499 or less | 16 (8.1%) | 8 (7.3%) |
| $2,500 to $4,999 | 16 (8.1%) | 10 (9.1%) |
| $5,000 to $7,499 | 2 (1.0%) | 2 (1.8%) |
| $7,500 to $9,999 | 6 (3.0%) | 1 (0.9%) |
| $10,000 to $12,499 | 0 (0.0%) | 12 (10.9%) |
| $12,500 to $14,999 | 0 (0.0%) | 0 (0.0%) |
| $15,000 to $17,499 | 0 (0.0%) | 10 (9.1%) |
| $17,500 to $19,999 | 2 (1.0%) | 10 (9.1%) |
| $20,000 to $22,499 | 0 (0.0%) | 10 (9.1%) |
| $22,500 to $24,999 | 23 (11.7%) | 0 (0.0%) |
| $25,000 to $29,999 | 26 (13.2%) | 31 (28.2%) |
| $30,000 to $34,999 | 2 (1.0%) | 0 (0.0%) |
| $35,000 to $39,999 | 5 (2.5%) | 8 (7.3%) |
| $40,000 to $44,999 | 9 (4.6%) | 6 (5.4%) |
| $45,000 to $49,999 | 13 (6.6%) | 2 (1.8%) |
| $50,000 to $54,999 | 34 (17.3%) | 0 (0.0%) |
| $55,000 to $64,999 | 14 (7.1%) | 0 (0.0%) |
| $65,000 to $74,999 | 2 (1.0%) | 0 (0.0%) |
| $75,000 to $99,999 | 27 (13.7%) | 0 (0.0%) |
| $100,000+ | 0 (0.0%) | 0 (0.0%) |
| Total | 197 (100.0%) | 110 (100.0%) |
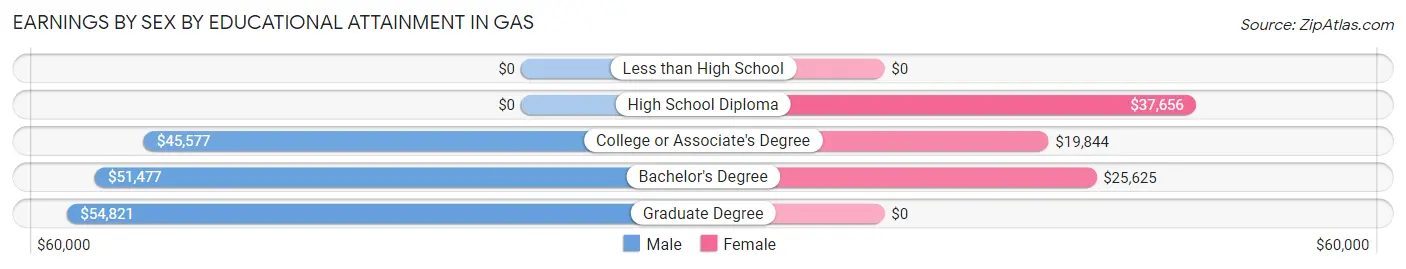
Earnings by Sex by Educational Attainment in Gas
Average earnings in Gas are $46,827 for men and $25,529 for women, a difference of 45.5%. Men with an educational attainment of graduate degree enjoy the highest average annual earnings of $54,821, while those with college or associate's degree education earn the least with $45,577. Women with an educational attainment of high school diploma earn the most with the average annual earnings of $37,656, while those with college or associate's degree education have the smallest earnings of $19,844.
| Educational Attainment | Male Income | Female Income |
| Less than High School | - | - |
| High School Diploma | - | - |
| College or Associate's Degree | $45,577 | $19,844 |
| Bachelor's Degree | $51,477 | $25,625 |
| Graduate Degree | $54,821 | $0 |
| Total | $46,827 | $25,529 |
Family Income in Gas
Family Income Brackets in Gas
According to the Gas family income data, there are 37 families falling into the $50,000 to $74,999 income range, which is the most common income bracket and makes up 32.5% of all families.
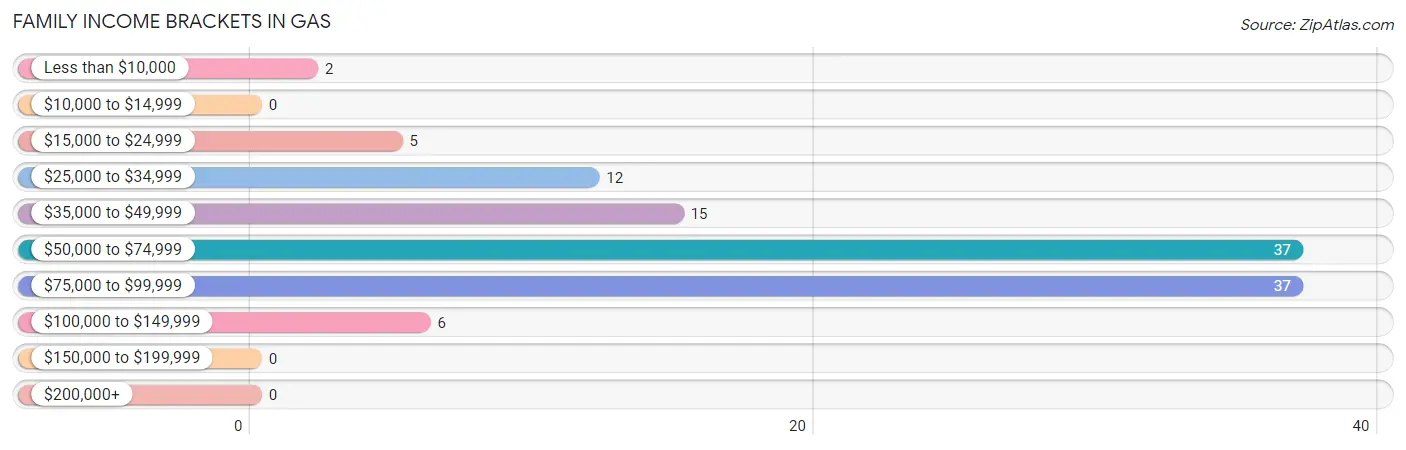
| Income Bracket | # Families | % Families |
| Less than $10,000 | 2 | 1.8% |
| $10,000 to $14,999 | 0 | 0.0% |
| $15,000 to $24,999 | 5 | 4.4% |
| $25,000 to $34,999 | 12 | 10.5% |
| $35,000 to $49,999 | 15 | 13.2% |
| $50,000 to $74,999 | 37 | 32.5% |
| $75,000 to $99,999 | 37 | 32.5% |
| $100,000 to $149,999 | 6 | 5.3% |
| $150,000 to $199,999 | 0 | 0.0% |
| $200,000+ | 0 | 0.0% |
Family Income by Famaliy Size in Gas
4-person families (14 | 12.3%) account for the highest median family income in Gas with $90,833 per family, while 2-person families (59 | 51.7%) have the highest median income of $25,982 per family member.
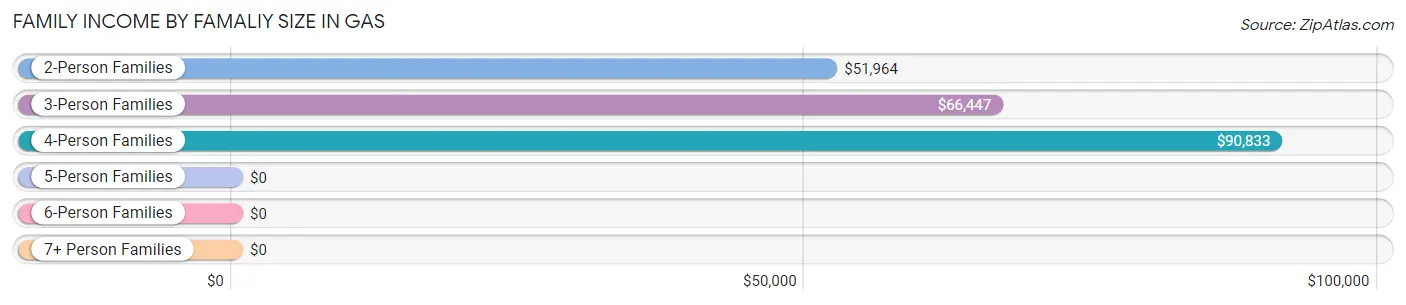
| Income Bracket | # Families | Median Income |
| 2-Person Families | 59 (51.7%) | $51,964 |
| 3-Person Families | 32 (28.1%) | $66,447 |
| 4-Person Families | 14 (12.3%) | $90,833 |
| 5-Person Families | 7 (6.1%) | $0 |
| 6-Person Families | 0 (0.0%) | $0 |
| 7+ Person Families | 2 (1.8%) | $0 |
| Total | 114 (100.0%) | $66,184 |
Family Income by Number of Earners in Gas
The median family income in Gas is $66,184, with families comprising 3+ earners (10) having the highest median family income of $92,917, while families with 1 earner (21) have the lowest median family income of $29,625, accounting for 8.8% and 18.4% of families, respectively.
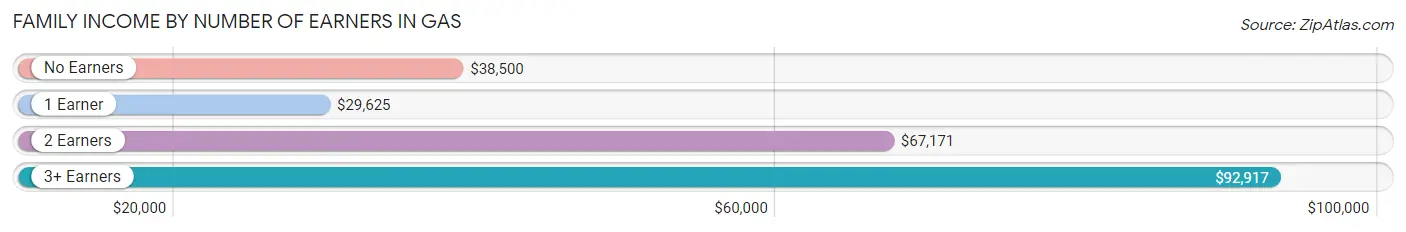
| Number of Earners | # Families | Median Income |
| No Earners | 10 (8.8%) | $38,500 |
| 1 Earner | 21 (18.4%) | $29,625 |
| 2 Earners | 73 (64.0%) | $67,171 |
| 3+ Earners | 10 (8.8%) | $92,917 |
| Total | 114 (100.0%) | $66,184 |
Household Income in Gas
Household Income Brackets in Gas
With 57 households falling in the category, the $50,000 to $74,999 income range is the most frequent in Gas, accounting for 29.5% of all households.
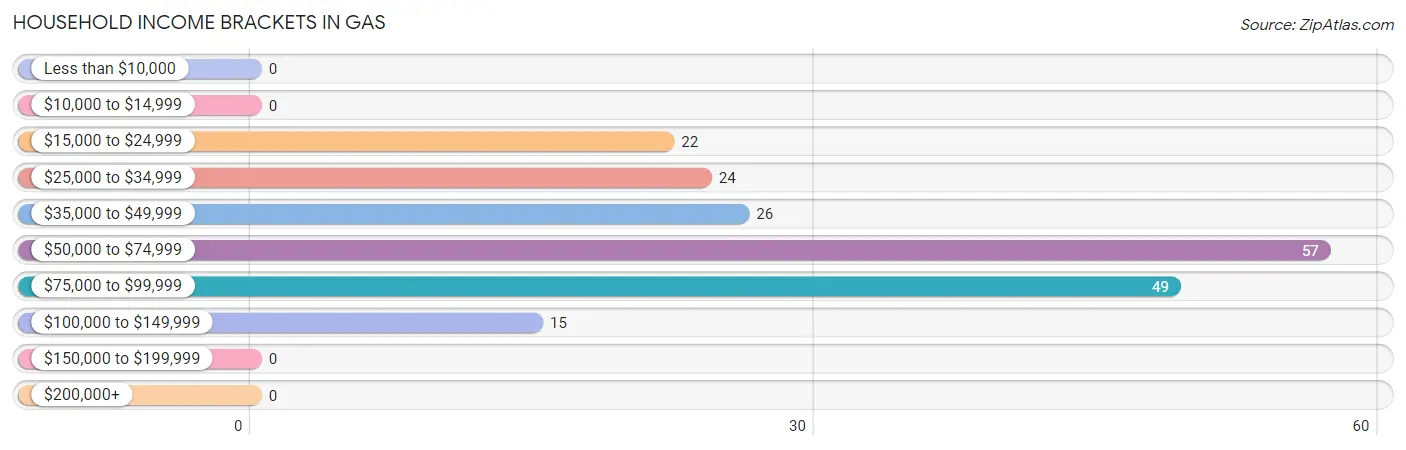
| Income Bracket | # Households | % Households |
| Less than $10,000 | 0 | 0.0% |
| $10,000 to $14,999 | 0 | 0.0% |
| $15,000 to $24,999 | 22 | 11.4% |
| $25,000 to $34,999 | 24 | 12.4% |
| $35,000 to $49,999 | 26 | 13.5% |
| $50,000 to $74,999 | 57 | 29.5% |
| $75,000 to $99,999 | 49 | 25.4% |
| $100,000 to $149,999 | 15 | 7.8% |
| $150,000 to $199,999 | 0 | 0.0% |
| $200,000+ | 0 | 0.0% |
Household Income by Householder Age in Gas
The median household income in Gas is $58,750, with the highest median household income of $76,500 found in the 45 to 64 years age bracket for the primary householder. A total of 90 households (46.6%) fall into this category. Meanwhile, the 15 to 24 years age bracket for the primary householder has the lowest median household income of $0, with 11 households (5.7%) in this group.
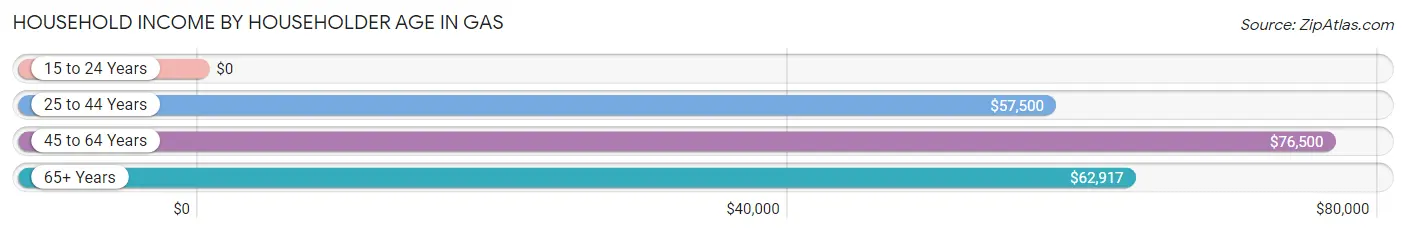
| Income Bracket | # Households | Median Income |
| 15 to 24 Years | 11 (5.7%) | $0 |
| 25 to 44 Years | 60 (31.1%) | $57,500 |
| 45 to 64 Years | 90 (46.6%) | $76,500 |
| 65+ Years | 32 (16.6%) | $62,917 |
| Total | 193 (100.0%) | $58,750 |
Poverty in Gas
Income Below Poverty by Sex and Age in Gas
With 3.0% poverty level for males and 32.6% for females among the residents of Gas, 6 to 11 year old males and 65 to 74 year old females are the most vulnerable to poverty, with 2 males (9.5%) and 68 females (74.7%) in their respective age groups living below the poverty level.
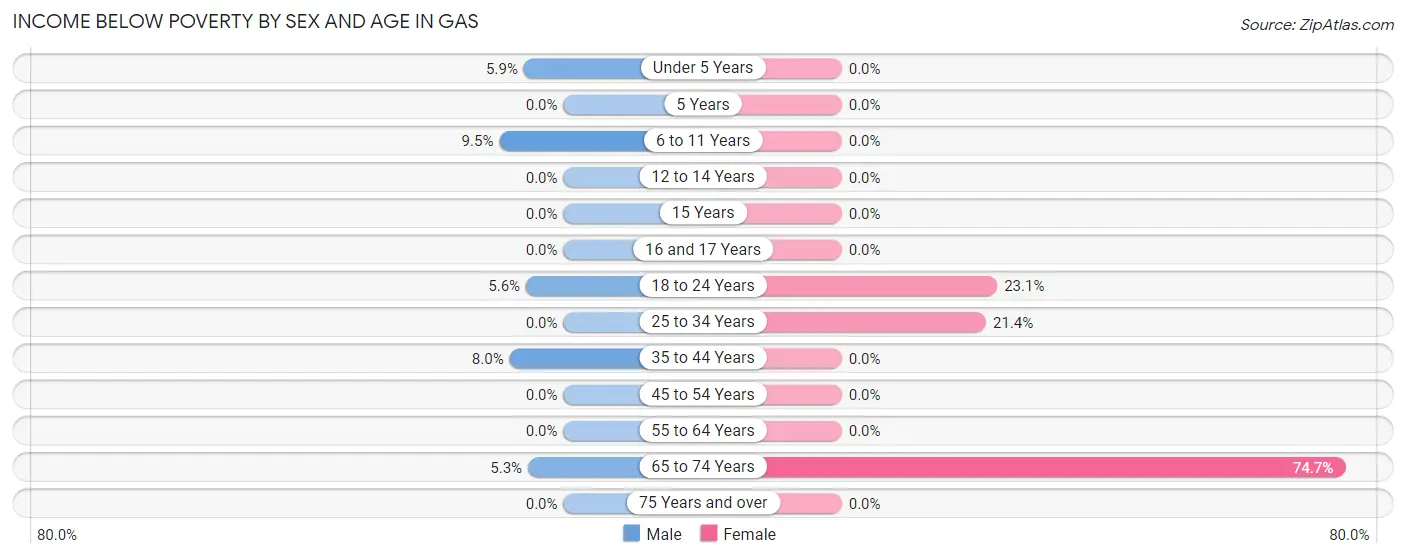
| Age Bracket | Male | Female |
| Under 5 Years | 2 (5.9%) | 0 (0.0%) |
| 5 Years | 0 (0.0%) | 0 (0.0%) |
| 6 to 11 Years | 2 (9.5%) | 0 (0.0%) |
| 12 to 14 Years | 0 (0.0%) | 0 (0.0%) |
| 15 Years | 0 (0.0%) | 0 (0.0%) |
| 16 and 17 Years | 0 (0.0%) | 0 (0.0%) |
| 18 to 24 Years | 2 (5.6%) | 6 (23.1%) |
| 25 to 34 Years | 0 (0.0%) | 3 (21.4%) |
| 35 to 44 Years | 2 (8.0%) | 0 (0.0%) |
| 45 to 54 Years | 0 (0.0%) | 0 (0.0%) |
| 55 to 64 Years | 0 (0.0%) | 0 (0.0%) |
| 65 to 74 Years | 1 (5.3%) | 68 (74.7%) |
| 75 Years and over | 0 (0.0%) | 0 (0.0%) |
| Total | 9 (3.0%) | 77 (32.6%) |
Income Above Poverty by Sex and Age in Gas
According to the poverty statistics in Gas, males aged 12 to 14 years and females aged 6 to 11 years are the age groups that are most secure financially, with 100.0% of males and 100.0% of females in these age groups living above the poverty line.
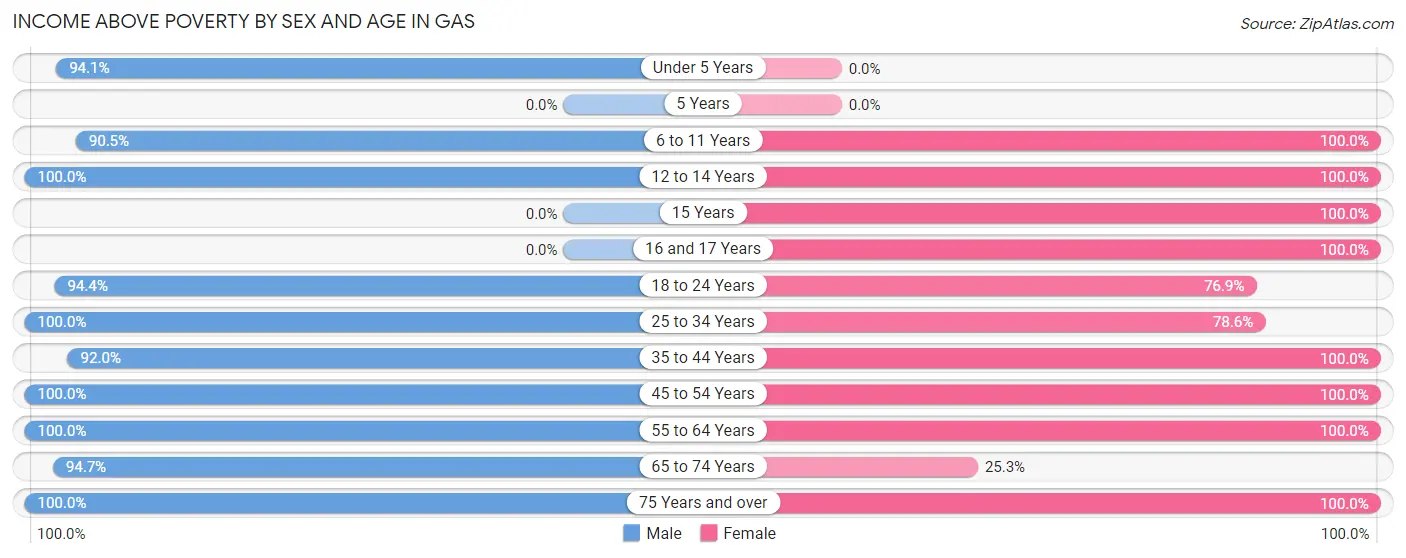
| Age Bracket | Male | Female |
| Under 5 Years | 32 (94.1%) | 0 (0.0%) |
| 5 Years | 0 (0.0%) | 0 (0.0%) |
| 6 to 11 Years | 19 (90.5%) | 14 (100.0%) |
| 12 to 14 Years | 3 (100.0%) | 12 (100.0%) |
| 15 Years | 0 (0.0%) | 2 (100.0%) |
| 16 and 17 Years | 0 (0.0%) | 1 (100.0%) |
| 18 to 24 Years | 34 (94.4%) | 20 (76.9%) |
| 25 to 34 Years | 55 (100.0%) | 11 (78.6%) |
| 35 to 44 Years | 23 (92.0%) | 23 (100.0%) |
| 45 to 54 Years | 60 (100.0%) | 28 (100.0%) |
| 55 to 64 Years | 35 (100.0%) | 21 (100.0%) |
| 65 to 74 Years | 18 (94.7%) | 23 (25.3%) |
| 75 Years and over | 8 (100.0%) | 4 (100.0%) |
| Total | 287 (97.0%) | 159 (67.4%) |
Income Below Poverty Among Married-Couple Families in Gas
The poverty statistics for married-couple families in Gas show that 1.1% or 1 of the total 93 families live below the poverty line. Families with no children have the highest poverty rate of 1.9%, comprising of 1 families. On the other hand, families with 1 or 2 children have the lowest poverty rate of 0.0%, which includes 0 families.
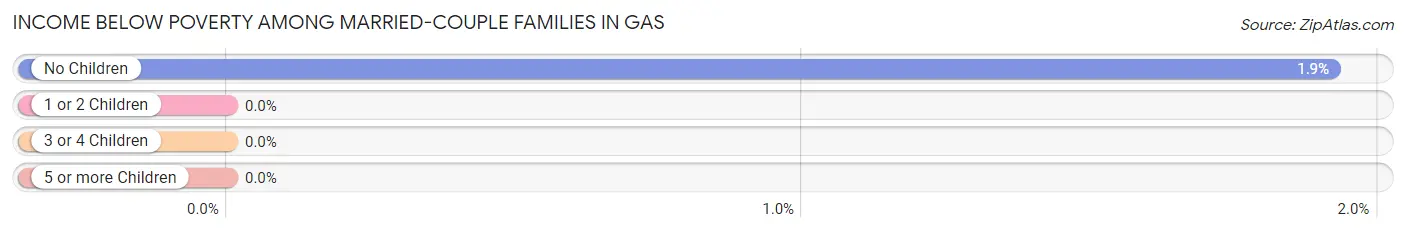
| Children | Above Poverty | Below Poverty |
| No Children | 51 (98.1%) | 1 (1.9%) |
| 1 or 2 Children | 32 (100.0%) | 0 (0.0%) |
| 3 or 4 Children | 7 (100.0%) | 0 (0.0%) |
| 5 or more Children | 2 (100.0%) | 0 (0.0%) |
| Total | 92 (98.9%) | 1 (1.1%) |
Income Below Poverty Among Single-Parent Households in Gas
According to the poverty data in Gas, 13.3% or 2 single-father households and 33.3% or 2 single-mother households are living below the poverty line. Among single-father households, those with no children have the highest poverty rate, with 2 households (16.7%) experiencing poverty. Likewise, among single-mother households, those with 1 or 2 children have the highest poverty rate, with 2 households (50.0%) falling below the poverty line.
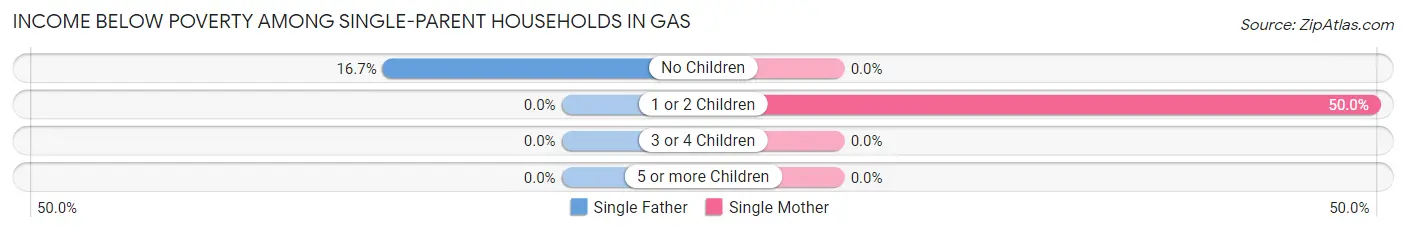
| Children | Single Father | Single Mother |
| No Children | 2 (16.7%) | 0 (0.0%) |
| 1 or 2 Children | 0 (0.0%) | 2 (50.0%) |
| 3 or 4 Children | 0 (0.0%) | 0 (0.0%) |
| 5 or more Children | 0 (0.0%) | 0 (0.0%) |
| Total | 2 (13.3%) | 2 (33.3%) |
Income Below Poverty Among Married-Couple vs Single-Parent Households in Gas
The poverty data for Gas shows that 1 of the married-couple family households (1.1%) and 4 of the single-parent households (19.1%) are living below the poverty level. Within the married-couple family households, those with no children have the highest poverty rate, with 1 households (1.9%) falling below the poverty line. Among the single-parent households, those with 1 or 2 children have the highest poverty rate, with 2 household (28.6%) living below poverty.
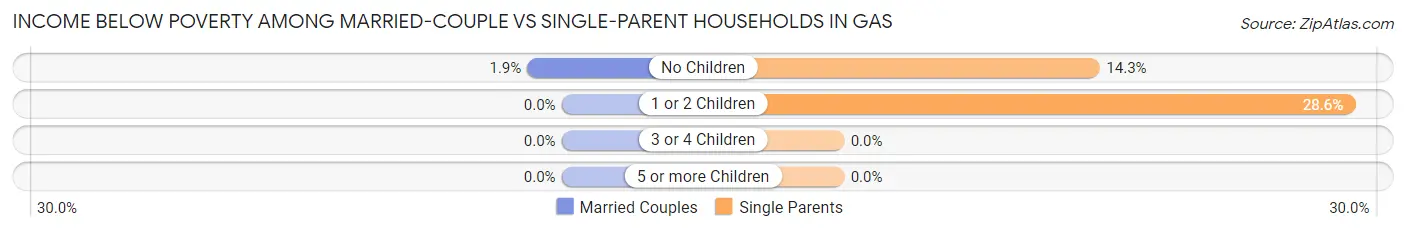
| Children | Married-Couple Families | Single-Parent Households |
| No Children | 1 (1.9%) | 2 (14.3%) |
| 1 or 2 Children | 0 (0.0%) | 2 (28.6%) |
| 3 or 4 Children | 0 (0.0%) | 0 (0.0%) |
| 5 or more Children | 0 (0.0%) | 0 (0.0%) |
| Total | 1 (1.1%) | 4 (19.1%) |
Race in Gas
The most populous races in Gas are White / Caucasian (464 | 87.2%), Native / Alaskan (68 | 12.8%), and Hispanic or Latino (49 | 9.2%).
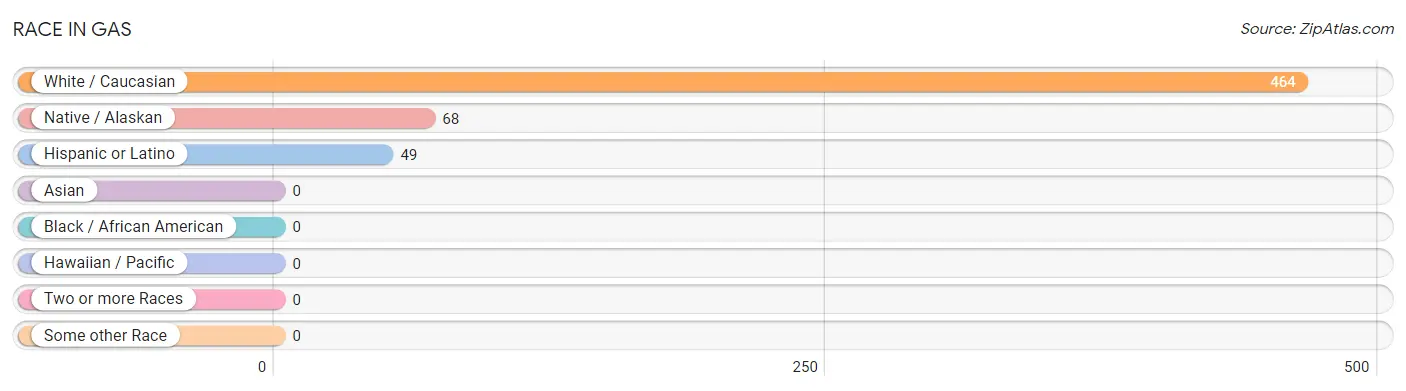
| Race | # Population | % Population |
| Asian | 0 | 0.0% |
| Black / African American | 0 | 0.0% |
| Hawaiian / Pacific | 0 | 0.0% |
| Hispanic or Latino | 49 | 9.2% |
| Native / Alaskan | 68 | 12.8% |
| White / Caucasian | 464 | 87.2% |
| Two or more Races | 0 | 0.0% |
| Some other Race | 0 | 0.0% |
| Total | 532 | 100.0% |
Ancestry in Gas
The most populous ancestries reported in Gas are German (155 | 29.1%), American (93 | 17.5%), Sioux (68 | 12.8%), Spaniard (42 | 7.9%), and English (41 | 7.7%), together accounting for 75.0% of all Gas residents.
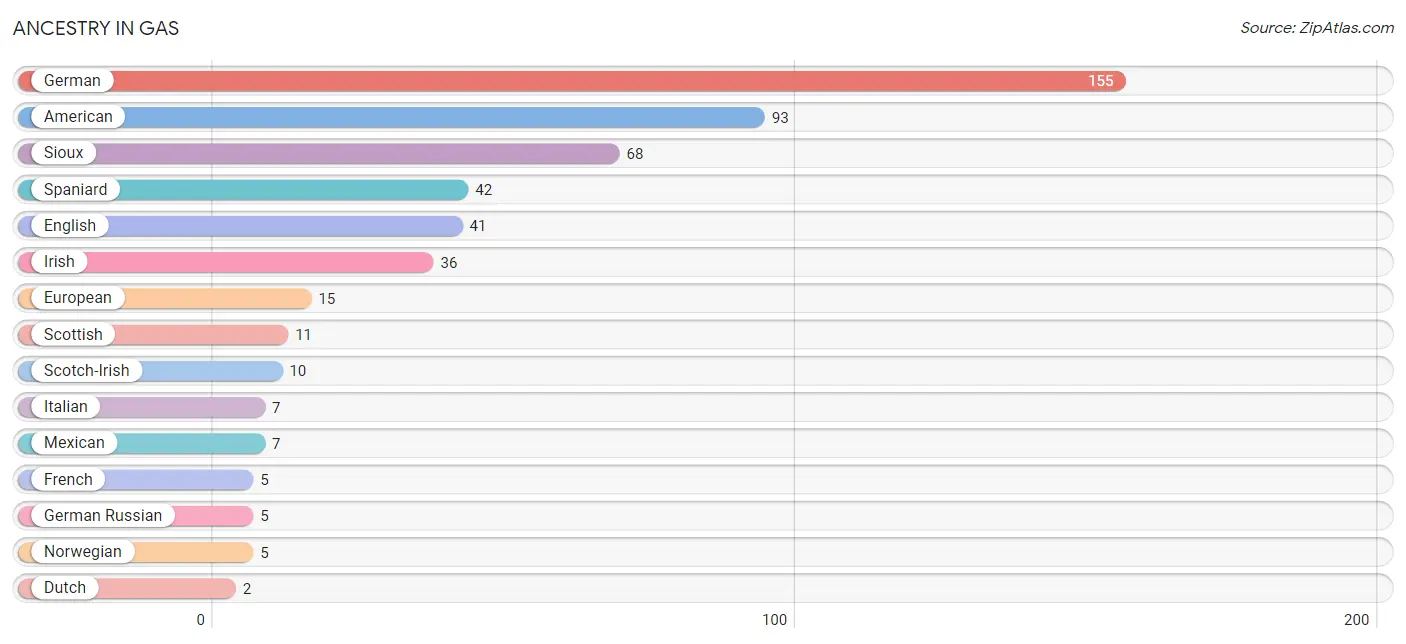
| Ancestry | # Population | % Population |
| American | 93 | 17.5% |
| Dutch | 2 | 0.4% |
| English | 41 | 7.7% |
| European | 15 | 2.8% |
| French | 5 | 0.9% |
| German | 155 | 29.1% |
| German Russian | 5 | 0.9% |
| Irish | 36 | 6.8% |
| Italian | 7 | 1.3% |
| Mexican | 7 | 1.3% |
| Norwegian | 5 | 0.9% |
| Scotch-Irish | 10 | 1.9% |
| Scottish | 11 | 2.1% |
| Sioux | 68 | 12.8% |
| Spaniard | 42 | 7.9% |
| Swedish | 2 | 0.4% | View All 16 Rows |
Immigrants in Gas

| Immigration Origin | # Population | % Population | View All 0 Rows |
Sex and Age in Gas
Sex and Age in Gas
The most populous age groups in Gas are 25 to 29 Years (42 | 14.2%) for men and 70 to 74 Years (80 | 33.9%) for women.
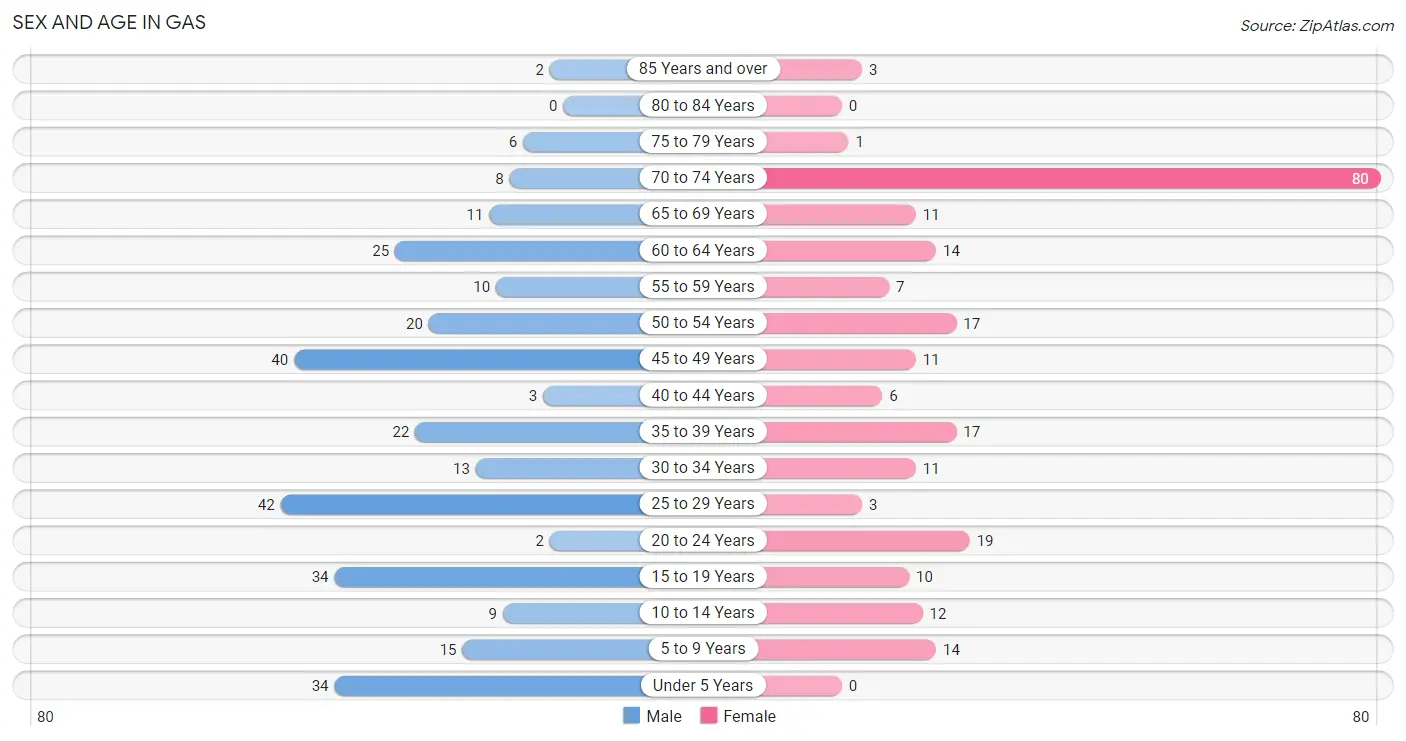
| Age Bracket | Male | Female |
| Under 5 Years | 34 (11.5%) | 0 (0.0%) |
| 5 to 9 Years | 15 (5.1%) | 14 (5.9%) |
| 10 to 14 Years | 9 (3.0%) | 12 (5.1%) |
| 15 to 19 Years | 34 (11.5%) | 10 (4.2%) |
| 20 to 24 Years | 2 (0.7%) | 19 (8.1%) |
| 25 to 29 Years | 42 (14.2%) | 3 (1.3%) |
| 30 to 34 Years | 13 (4.4%) | 11 (4.7%) |
| 35 to 39 Years | 22 (7.4%) | 17 (7.2%) |
| 40 to 44 Years | 3 (1.0%) | 6 (2.5%) |
| 45 to 49 Years | 40 (13.5%) | 11 (4.7%) |
| 50 to 54 Years | 20 (6.8%) | 17 (7.2%) |
| 55 to 59 Years | 10 (3.4%) | 7 (3.0%) |
| 60 to 64 Years | 25 (8.5%) | 14 (5.9%) |
| 65 to 69 Years | 11 (3.7%) | 11 (4.7%) |
| 70 to 74 Years | 8 (2.7%) | 80 (33.9%) |
| 75 to 79 Years | 6 (2.0%) | 1 (0.4%) |
| 80 to 84 Years | 0 (0.0%) | 0 (0.0%) |
| 85 Years and over | 2 (0.7%) | 3 (1.3%) |
| Total | 296 (100.0%) | 236 (100.0%) |
Families and Households in Gas
Median Family Size in Gas
The median family size in Gas is 3.68 persons per family, with married-couple families (93 | 81.6%) accounting for the largest median family size of 4.03 persons per family. On the other hand, single male/father families (15 | 13.2%) represent the smallest median family size with 1.87 persons per family.
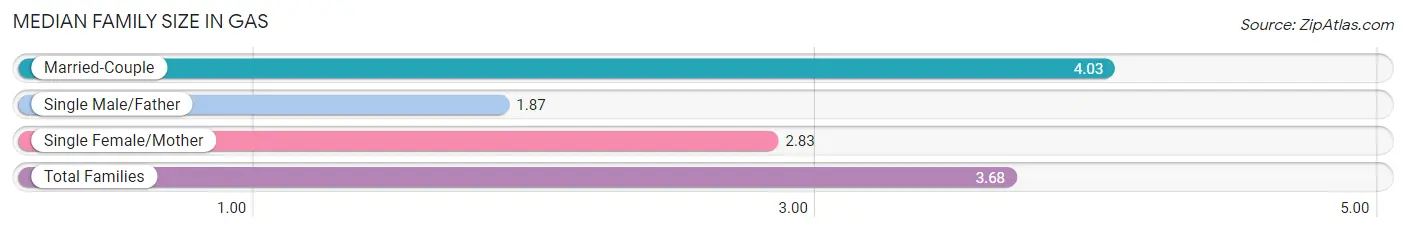
| Family Type | # Families | Family Size |
| Married-Couple | 93 (81.6%) | 4.03 |
| Single Male/Father | 15 (13.2%) | 1.87 |
| Single Female/Mother | 6 (5.3%) | 2.83 |
| Total Families | 114 (100.0%) | 3.68 |
Median Household Size in Gas
The median household size in Gas is 2.76 persons per household, with married-couple households (93 | 48.2%) accounting for the largest median household size of 4.03 persons per household. non-family households (79 | 40.9%) represent the smallest median household size with 1.33 persons per household.
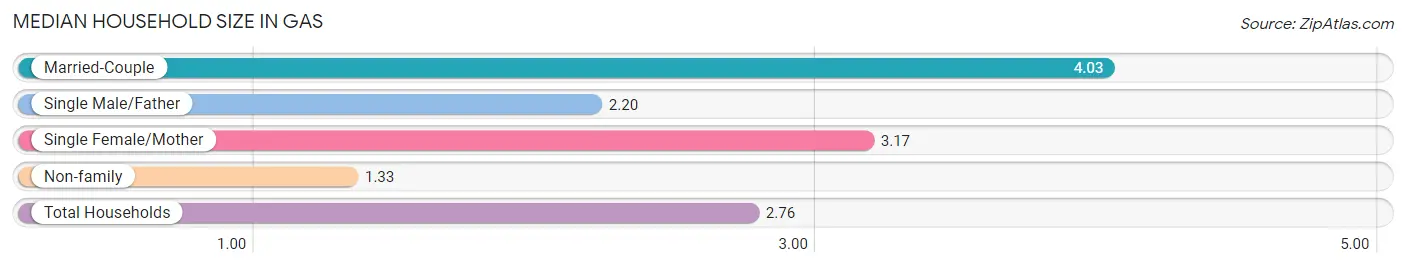
| Household Type | # Households | Household Size |
| Married-Couple | 93 (48.2%) | 4.03 |
| Single Male/Father | 15 (7.8%) | 2.20 |
| Single Female/Mother | 6 (3.1%) | 3.17 |
| Non-family | 79 (40.9%) | 1.33 |
| Total Households | 193 (100.0%) | 2.76 |
Household Size by Marriage Status in Gas
Out of a total of 193 households in Gas, 114 (59.1%) are family households, while 79 (40.9%) are nonfamily households. The most numerous type of family households are 2-person households, comprising 54, and the most common type of nonfamily households are 1-person households, comprising 69.
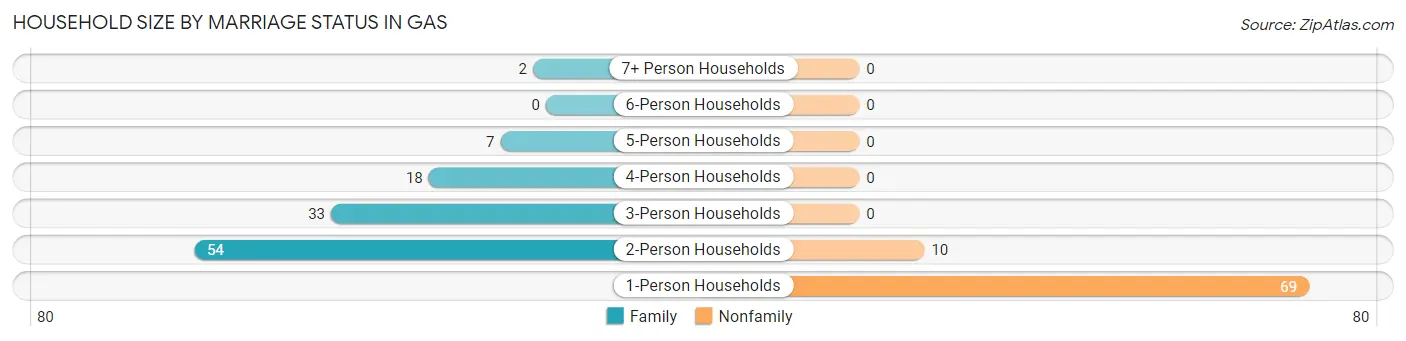
| Household Size | Family Households | Nonfamily Households |
| 1-Person Households | - | 69 (35.7%) |
| 2-Person Households | 54 (28.0%) | 10 (5.2%) |
| 3-Person Households | 33 (17.1%) | 0 (0.0%) |
| 4-Person Households | 18 (9.3%) | 0 (0.0%) |
| 5-Person Households | 7 (3.6%) | 0 (0.0%) |
| 6-Person Households | 0 (0.0%) | 0 (0.0%) |
| 7+ Person Households | 2 (1.0%) | 0 (0.0%) |
| Total | 114 (59.1%) | 79 (40.9%) |
Female Fertility in Gas
Fertility by Age in Gas
Average fertility rate in Gas is 188.0 births per 1,000 women. Women in the age bracket of 20 to 34 years have the highest fertility rate with 455.0 births per 1,000 women. Women in the age bracket of 20 to 34 years acount for 100.0% of all women with births.
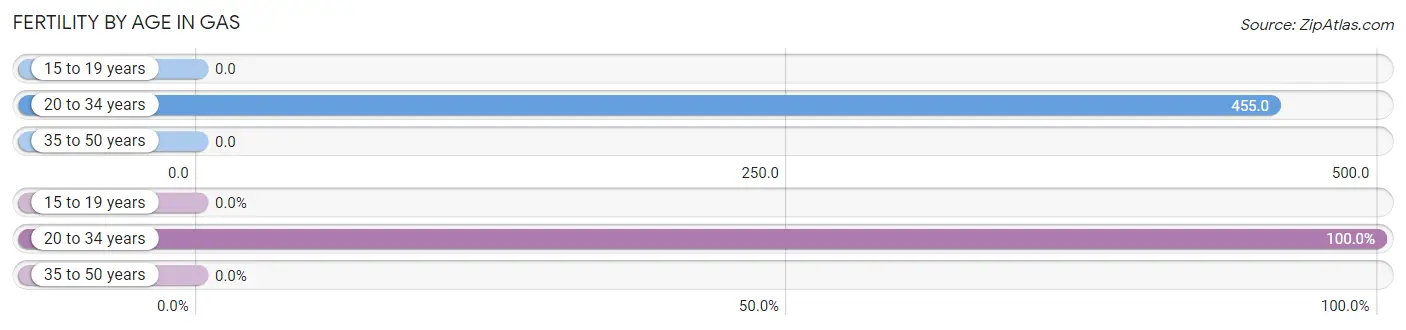
| Age Bracket | Women with Births | Births / 1,000 Women |
| 15 to 19 years | 0 (0.0%) | 0.0 |
| 20 to 34 years | 15 (100.0%) | 455.0 |
| 35 to 50 years | 0 (0.0%) | 0.0 |
| Total | 15 (100.0%) | 188.0 |
Fertility by Age by Marriage Status in Gas
86.7% of women with births (15) in Gas are married. The highest percentage of unmarried women with births falls into 20 to 34 years age bracket with 13.3% of them unmarried at the time of birth, while the lowest percentage of unmarried women with births belong to 20 to 34 years age bracket with 13.3% of them unmarried.
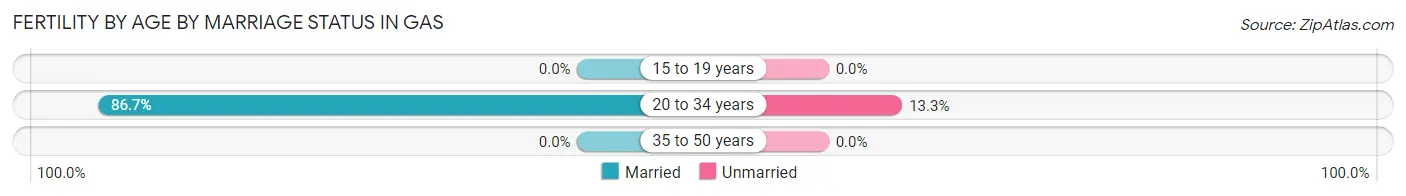
| Age Bracket | Married | Unmarried |
| 15 to 19 years | 0 (0.0%) | 0 (0.0%) |
| 20 to 34 years | 13 (86.7%) | 2 (13.3%) |
| 35 to 50 years | 0 (0.0%) | 0 (0.0%) |
| Total | 13 (86.7%) | 2 (13.3%) |
Fertility by Education in Gas
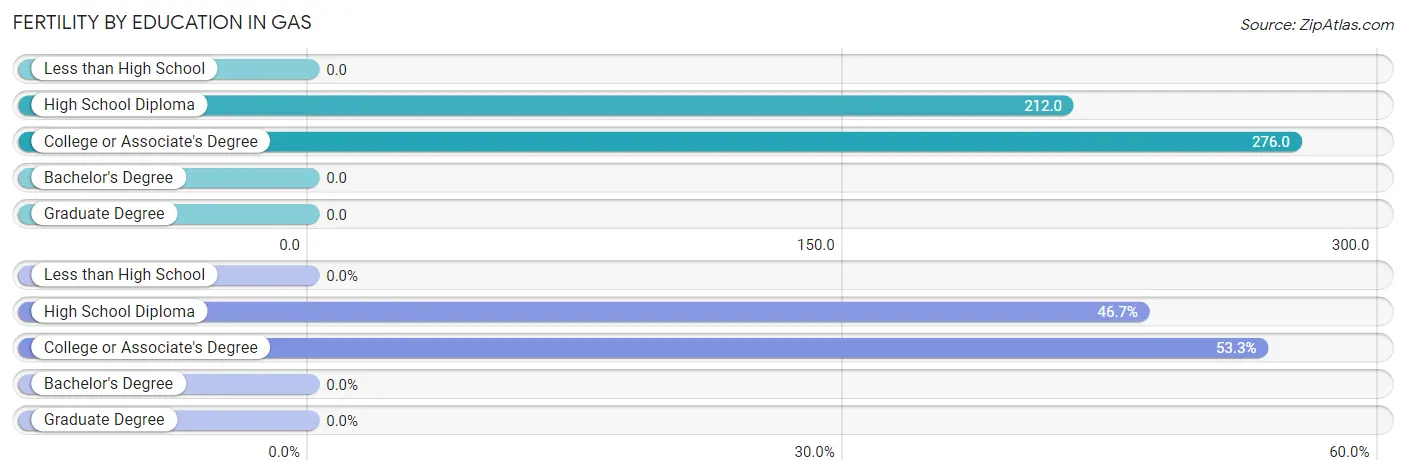
| Educational Attainment | Women with Births | Births / 1,000 Women |
| Less than High School | 0 (0.0%) | 0.0 |
| High School Diploma | 7 (46.7%) | 212.0 |
| College or Associate's Degree | 8 (53.3%) | 276.0 |
| Bachelor's Degree | 0 (0.0%) | 0.0 |
| Graduate Degree | 0 (0.0%) | 0.0 |
| Total | 15 (100.0%) | 188.0 |
Fertility by Education by Marriage Status in Gas
13.3% of women with births in Gas are unmarried. Women with the educational attainment of high school diploma are most likely to be married with 100.0% of them married at childbirth, while women with the educational attainment of college or associate's degree are least likely to be married with 25.0% of them unmarried at childbirth.
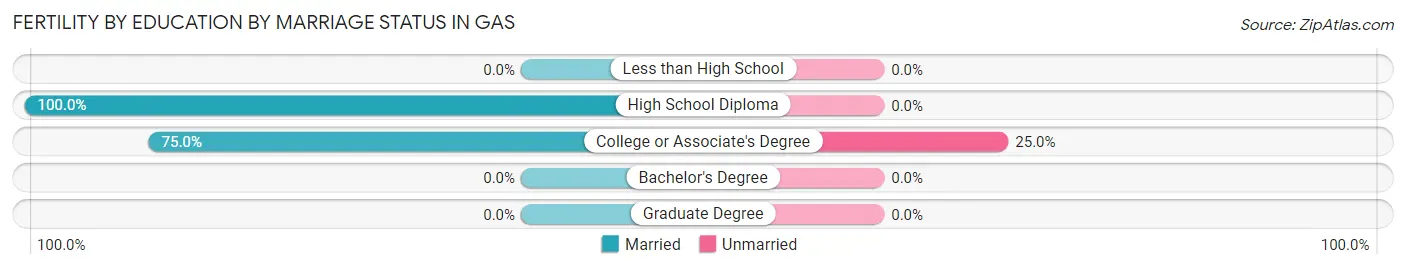
| Educational Attainment | Married | Unmarried |
| Less than High School | 0 (0.0%) | 0 (0.0%) |
| High School Diploma | 7 (100.0%) | 0 (0.0%) |
| College or Associate's Degree | 6 (75.0%) | 2 (25.0%) |
| Bachelor's Degree | 0 (0.0%) | 0 (0.0%) |
| Graduate Degree | 0 (0.0%) | 0 (0.0%) |
| Total | 13 (86.7%) | 2 (13.3%) |
Employment Characteristics in Gas
Employment by Class of Employer in Gas
Among the 284 employed individuals in Gas, private company employees (207 | 72.9%), self-employed (not incorporated) (21 | 7.4%), and state government employees (20 | 7.0%) make up the most common classes of employment.
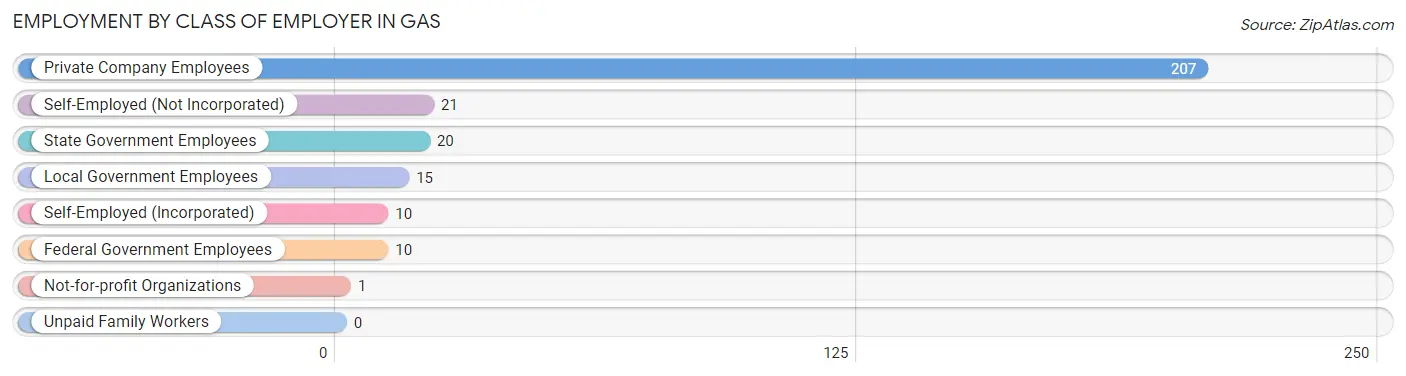
| Employer Class | # Employees | % Employees |
| Private Company Employees | 207 | 72.9% |
| Self-Employed (Incorporated) | 10 | 3.5% |
| Self-Employed (Not Incorporated) | 21 | 7.4% |
| Not-for-profit Organizations | 1 | 0.4% |
| Local Government Employees | 15 | 5.3% |
| State Government Employees | 20 | 7.0% |
| Federal Government Employees | 10 | 3.5% |
| Unpaid Family Workers | 0 | 0.0% |
| Total | 284 | 100.0% |
Employment Status by Age in Gas
According to the labor force statistics for Gas, out of the total population over 16 years of age (446), 65.5% or 292 individuals are in the labor force, with 2.7% or 8 of them unemployed. The age group with the highest labor force participation rate is 16 to 19 years, with 100.0% or 42 individuals in the labor force. Within the labor force, the 20 to 24 years age range has the highest percentage of unemployed individuals, with 11.8% or 2 of them being unemployed.
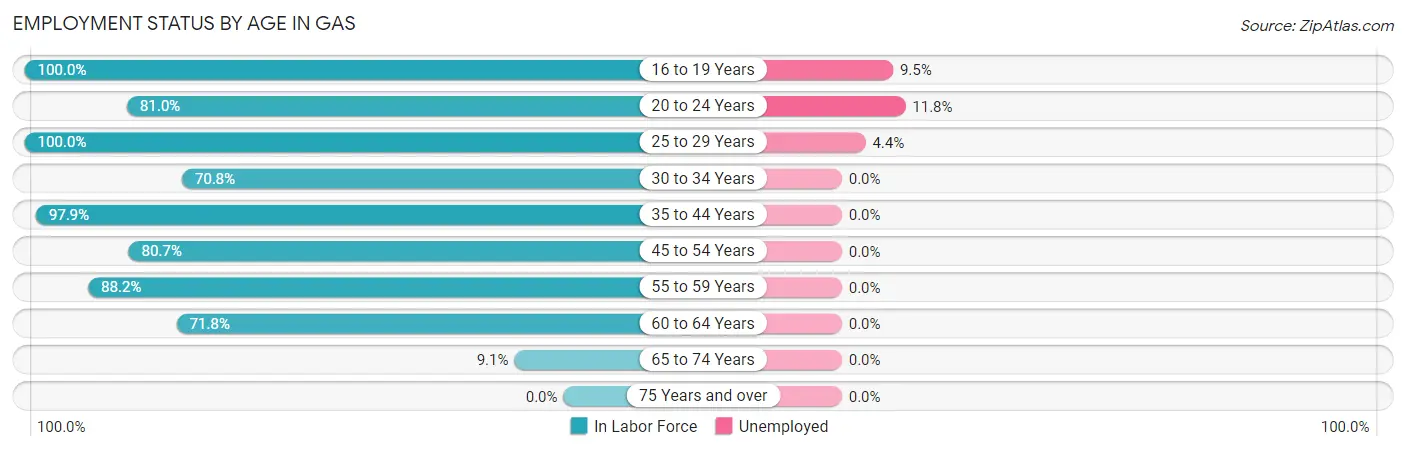
| Age Bracket | In Labor Force | Unemployed |
| 16 to 19 Years | 42 (100.0%) | 4 (9.5%) |
| 20 to 24 Years | 17 (81.0%) | 2 (11.8%) |
| 25 to 29 Years | 45 (100.0%) | 2 (4.4%) |
| 30 to 34 Years | 17 (70.8%) | 0 (0.0%) |
| 35 to 44 Years | 47 (97.9%) | 0 (0.0%) |
| 45 to 54 Years | 71 (80.7%) | 0 (0.0%) |
| 55 to 59 Years | 15 (88.2%) | 0 (0.0%) |
| 60 to 64 Years | 28 (71.8%) | 0 (0.0%) |
| 65 to 74 Years | 10 (9.1%) | 0 (0.0%) |
| 75 Years and over | 0 (0.0%) | 0 (0.0%) |
| Total | 292 (65.5%) | 8 (2.7%) |
Employment Status by Educational Attainment in Gas
According to labor force statistics for Gas, 85.4% of individuals (223) out of the total population between 25 and 64 years of age (261) are in the labor force, with 0.9% or 2 of them being unemployed. The group with the highest labor force participation rate are those with the educational attainment of less than high school, with 100.0% or 10 individuals in the labor force. Within the labor force, individuals with college / associate degree education have the highest percentage of unemployment, with 2.5% or 2 of them being unemployed.
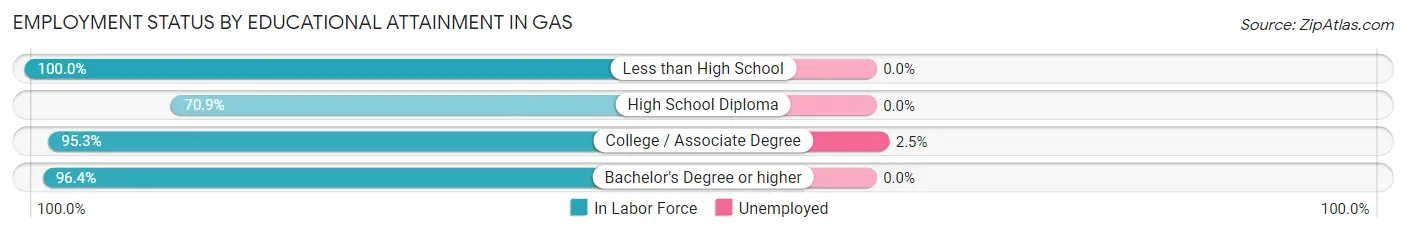
| Educational Attainment | In Labor Force | Unemployed |
| Less than High School | 10 (100.0%) | 0 (0.0%) |
| High School Diploma | 78 (70.9%) | 0 (0.0%) |
| College / Associate Degree | 81 (95.3%) | 2 (2.5%) |
| Bachelor's Degree or higher | 54 (96.4%) | 0 (0.0%) |
| Total | 223 (85.4%) | 2 (0.9%) |
Employment Occupations by Sex in Gas
Management, Business, Science and Arts Occupations
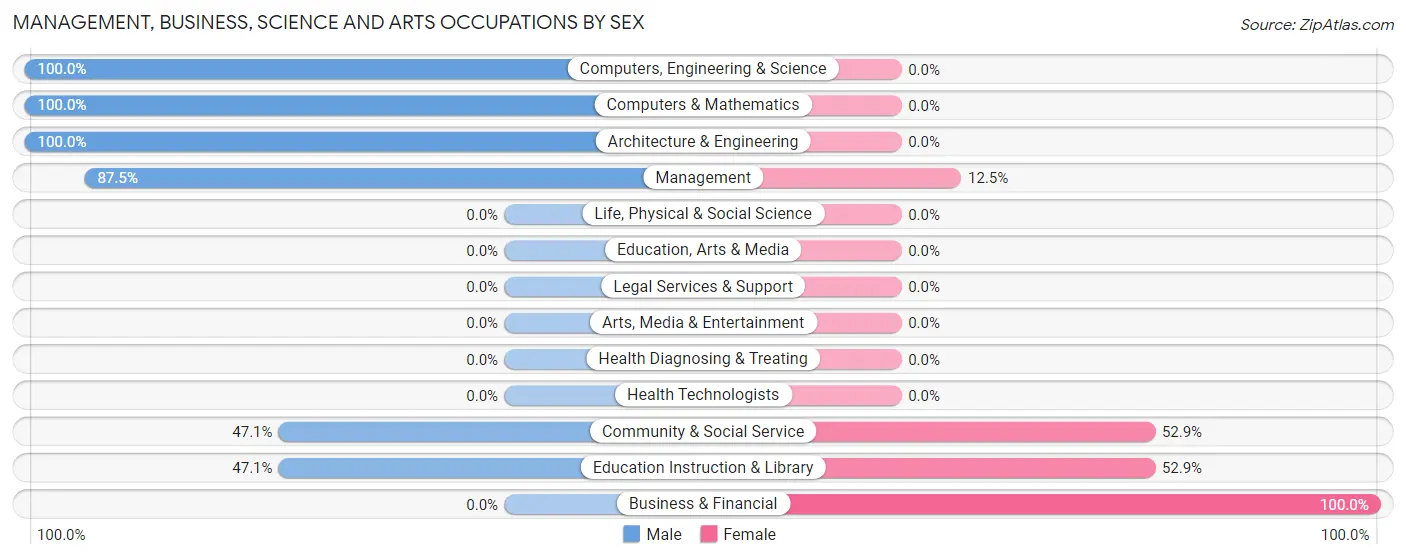
The most common Management, Business, Science and Arts occupations in Gas are Community & Social Service (17 | 6.0%), Education Instruction & Library (17 | 6.0%), Management (16 | 5.6%), Computers, Engineering & Science (10 | 3.5%), and Computers & Mathematics (5 | 1.8%).
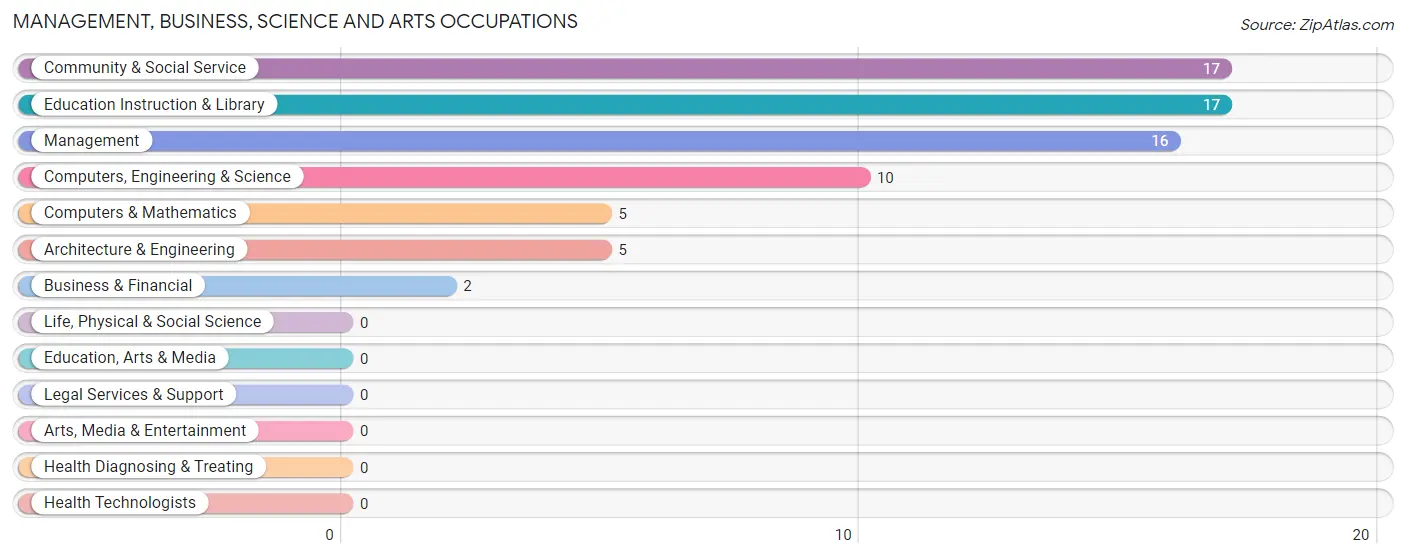
Management, Business, Science and Arts Occupations by Sex
Within the Management, Business, Science and Arts occupations in Gas, the most male-oriented occupations are Computers, Engineering & Science (100.0%), Computers & Mathematics (100.0%), and Architecture & Engineering (100.0%), while the most female-oriented occupations are Business & Financial (100.0%), Community & Social Service (52.9%), and Education Instruction & Library (52.9%).
| Occupation | Male | Female |
| Management | 14 (87.5%) | 2 (12.5%) |
| Business & Financial | 0 (0.0%) | 2 (100.0%) |
| Computers, Engineering & Science | 10 (100.0%) | 0 (0.0%) |
| Computers & Mathematics | 5 (100.0%) | 0 (0.0%) |
| Architecture & Engineering | 5 (100.0%) | 0 (0.0%) |
| Life, Physical & Social Science | 0 (0.0%) | 0 (0.0%) |
| Community & Social Service | 8 (47.1%) | 9 (52.9%) |
| Education, Arts & Media | 0 (0.0%) | 0 (0.0%) |
| Legal Services & Support | 0 (0.0%) | 0 (0.0%) |
| Education Instruction & Library | 8 (47.1%) | 9 (52.9%) |
| Arts, Media & Entertainment | 0 (0.0%) | 0 (0.0%) |
| Health Diagnosing & Treating | 0 (0.0%) | 0 (0.0%) |
| Health Technologists | 0 (0.0%) | 0 (0.0%) |
| Total (Category) | 32 (71.1%) | 13 (28.9%) |
| Total (Overall) | 189 (66.5%) | 95 (33.5%) |
Services Occupations
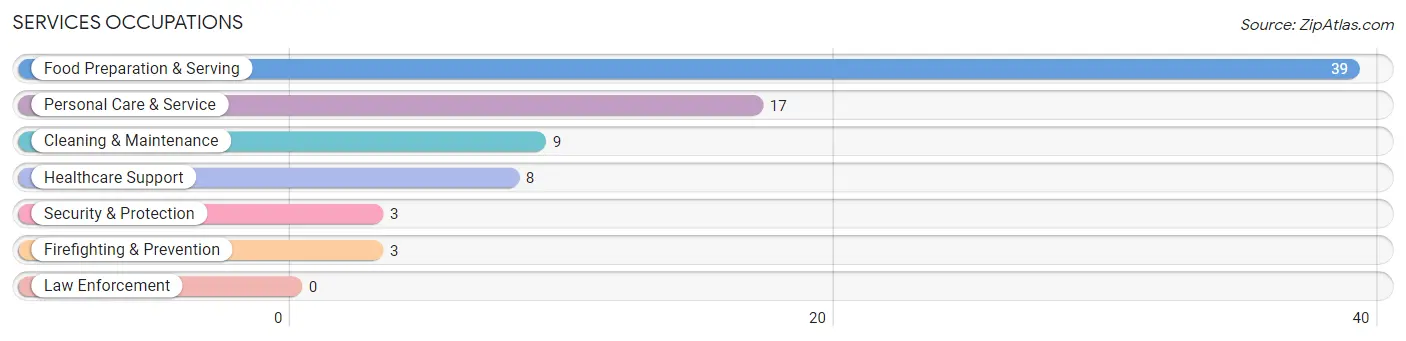
The most common Services occupations in Gas are Food Preparation & Serving (39 | 13.7%), Personal Care & Service (17 | 6.0%), Cleaning & Maintenance (9 | 3.2%), Healthcare Support (8 | 2.8%), and Security & Protection (3 | 1.1%).
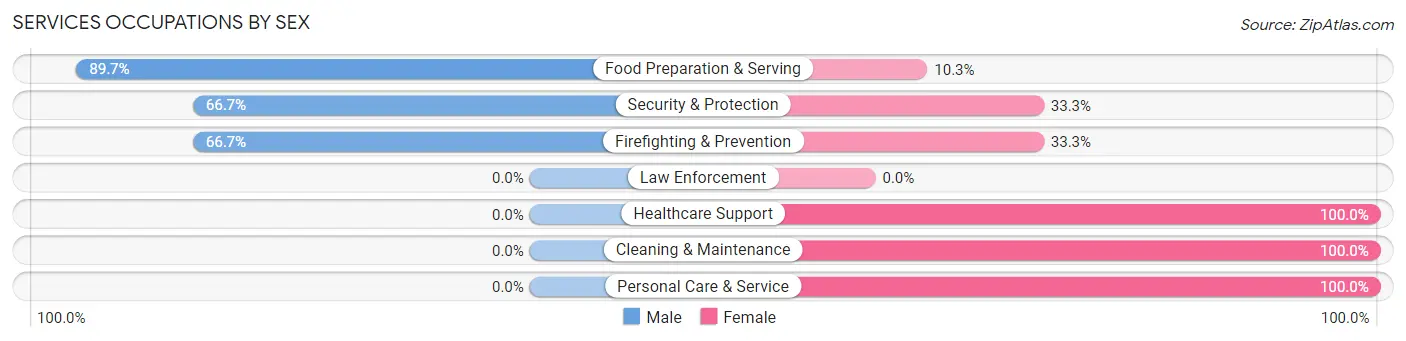
Services Occupations by Sex
Within the Services occupations in Gas, the most male-oriented occupations are Food Preparation & Serving (89.7%), Security & Protection (66.7%), and Firefighting & Prevention (66.7%), while the most female-oriented occupations are Healthcare Support (100.0%), Cleaning & Maintenance (100.0%), and Personal Care & Service (100.0%).
| Occupation | Male | Female |
| Healthcare Support | 0 (0.0%) | 8 (100.0%) |
| Security & Protection | 2 (66.7%) | 1 (33.3%) |
| Firefighting & Prevention | 2 (66.7%) | 1 (33.3%) |
| Law Enforcement | 0 (0.0%) | 0 (0.0%) |
| Food Preparation & Serving | 35 (89.7%) | 4 (10.3%) |
| Cleaning & Maintenance | 0 (0.0%) | 9 (100.0%) |
| Personal Care & Service | 0 (0.0%) | 17 (100.0%) |
| Total (Category) | 37 (48.7%) | 39 (51.3%) |
| Total (Overall) | 189 (66.5%) | 95 (33.5%) |
Sales and Office Occupations
The most common Sales and Office occupations in Gas are Office & Administration (43 | 15.1%), and Sales & Related (19 | 6.7%).

Sales and Office Occupations by Sex

| Occupation | Male | Female |
| Sales & Related | 17 (89.5%) | 2 (10.5%) |
| Office & Administration | 13 (30.2%) | 30 (69.8%) |
| Total (Category) | 30 (48.4%) | 32 (51.6%) |
| Total (Overall) | 189 (66.5%) | 95 (33.5%) |
Natural Resources, Construction and Maintenance Occupations
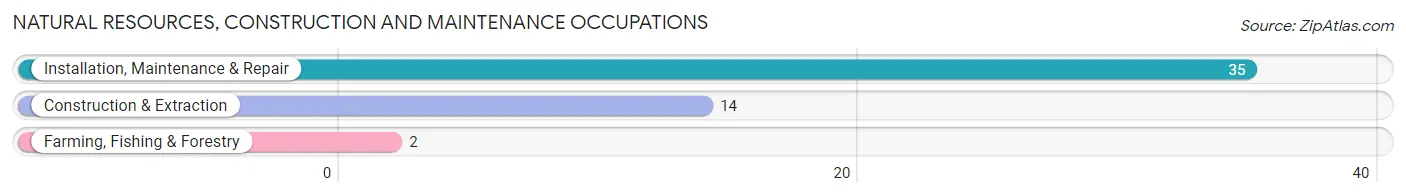
The most common Natural Resources, Construction and Maintenance occupations in Gas are Installation, Maintenance & Repair (35 | 12.3%), Construction & Extraction (14 | 4.9%), and Farming, Fishing & Forestry (2 | 0.7%).
Natural Resources, Construction and Maintenance Occupations by Sex
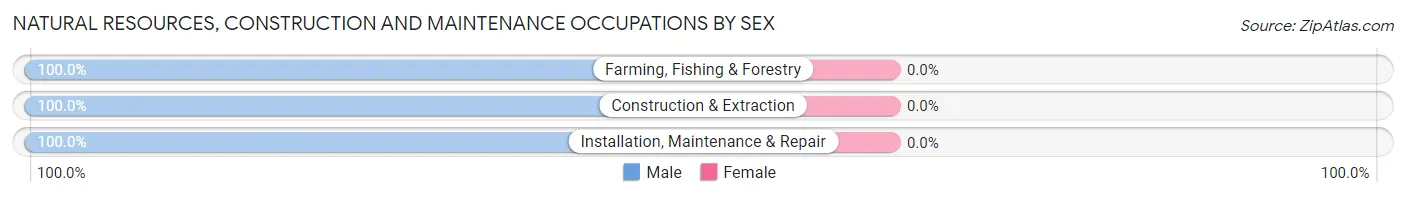
| Occupation | Male | Female |
| Farming, Fishing & Forestry | 2 (100.0%) | 0 (0.0%) |
| Construction & Extraction | 14 (100.0%) | 0 (0.0%) |
| Installation, Maintenance & Repair | 35 (100.0%) | 0 (0.0%) |
| Total (Category) | 51 (100.0%) | 0 (0.0%) |
| Total (Overall) | 189 (66.5%) | 95 (33.5%) |
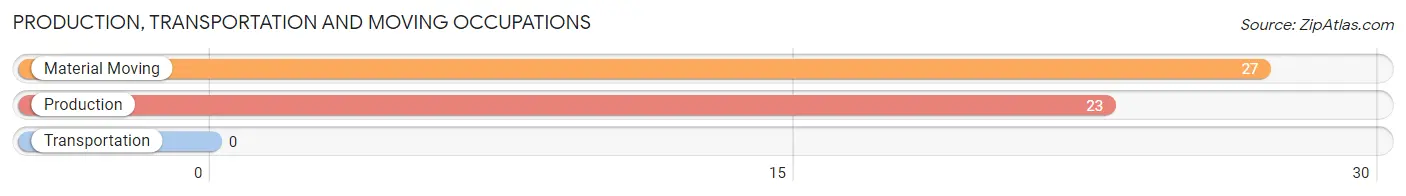
Production, Transportation and Moving Occupations
The most common Production, Transportation and Moving occupations in Gas are Material Moving (27 | 9.5%), and Production (23 | 8.1%).
Production, Transportation and Moving Occupations by Sex
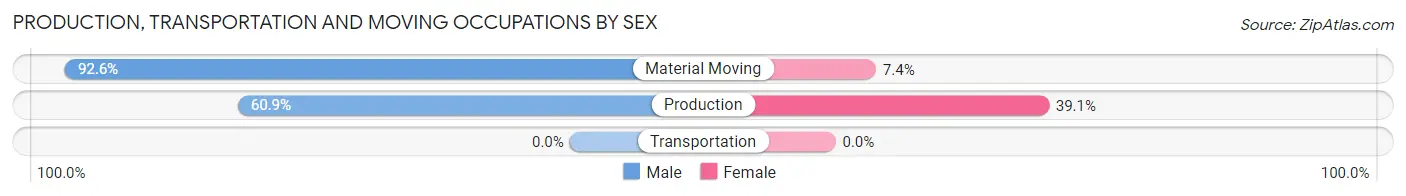
| Occupation | Male | Female |
| Production | 14 (60.9%) | 9 (39.1%) |
| Transportation | 0 (0.0%) | 0 (0.0%) |
| Material Moving | 25 (92.6%) | 2 (7.4%) |
| Total (Category) | 39 (78.0%) | 11 (22.0%) |
| Total (Overall) | 189 (66.5%) | 95 (33.5%) |
Employment Industries by Sex in Gas
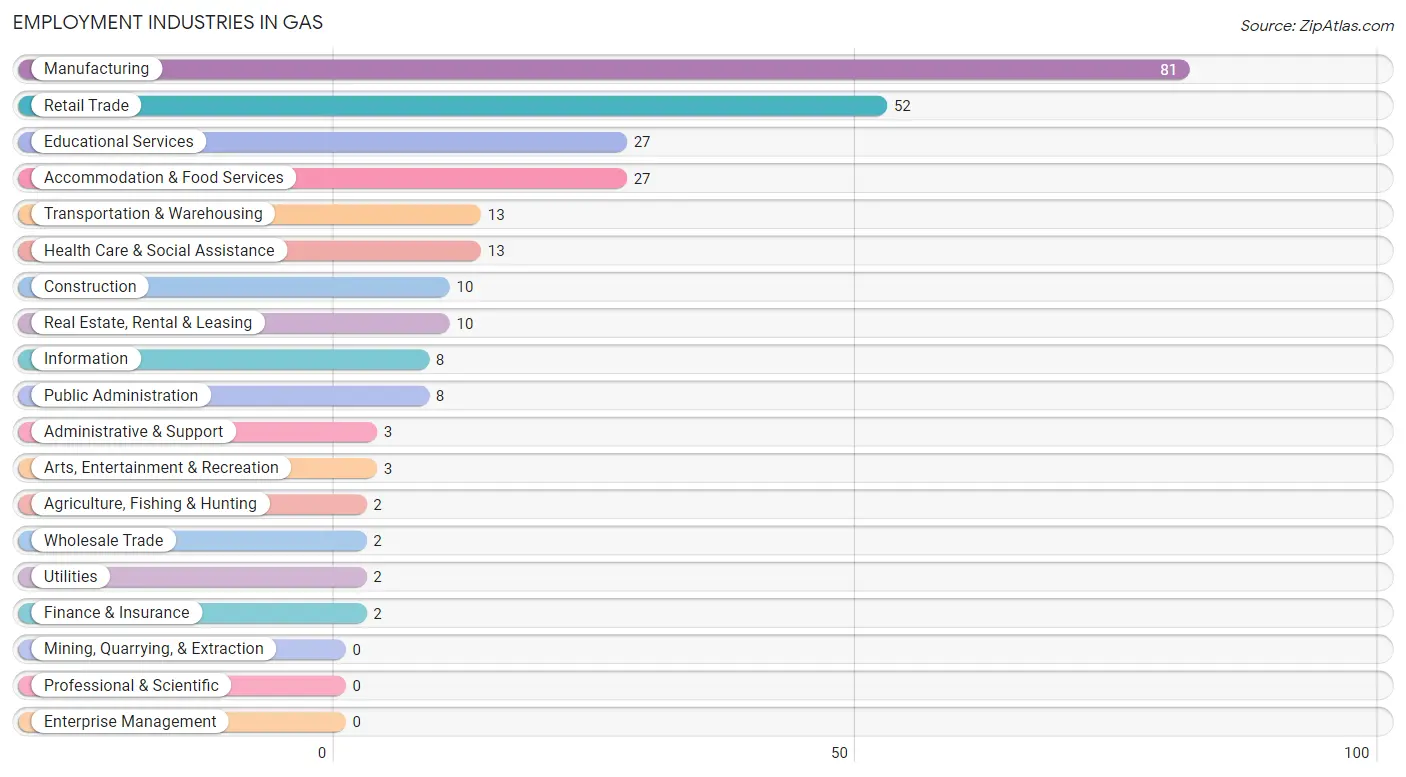
Employment Industries in Gas
The major employment industries in Gas include Manufacturing (81 | 28.5%), Retail Trade (52 | 18.3%), Educational Services (27 | 9.5%), Accommodation & Food Services (27 | 9.5%), and Transportation & Warehousing (13 | 4.6%).
Employment Industries by Sex in Gas
The Gas industries that see more men than women are Agriculture, Fishing & Hunting (100.0%), Construction (100.0%), and Wholesale Trade (100.0%), whereas the industries that tend to have a higher number of women are Finance & Insurance (100.0%), Health Care & Social Assistance (100.0%), and Arts, Entertainment & Recreation (100.0%).
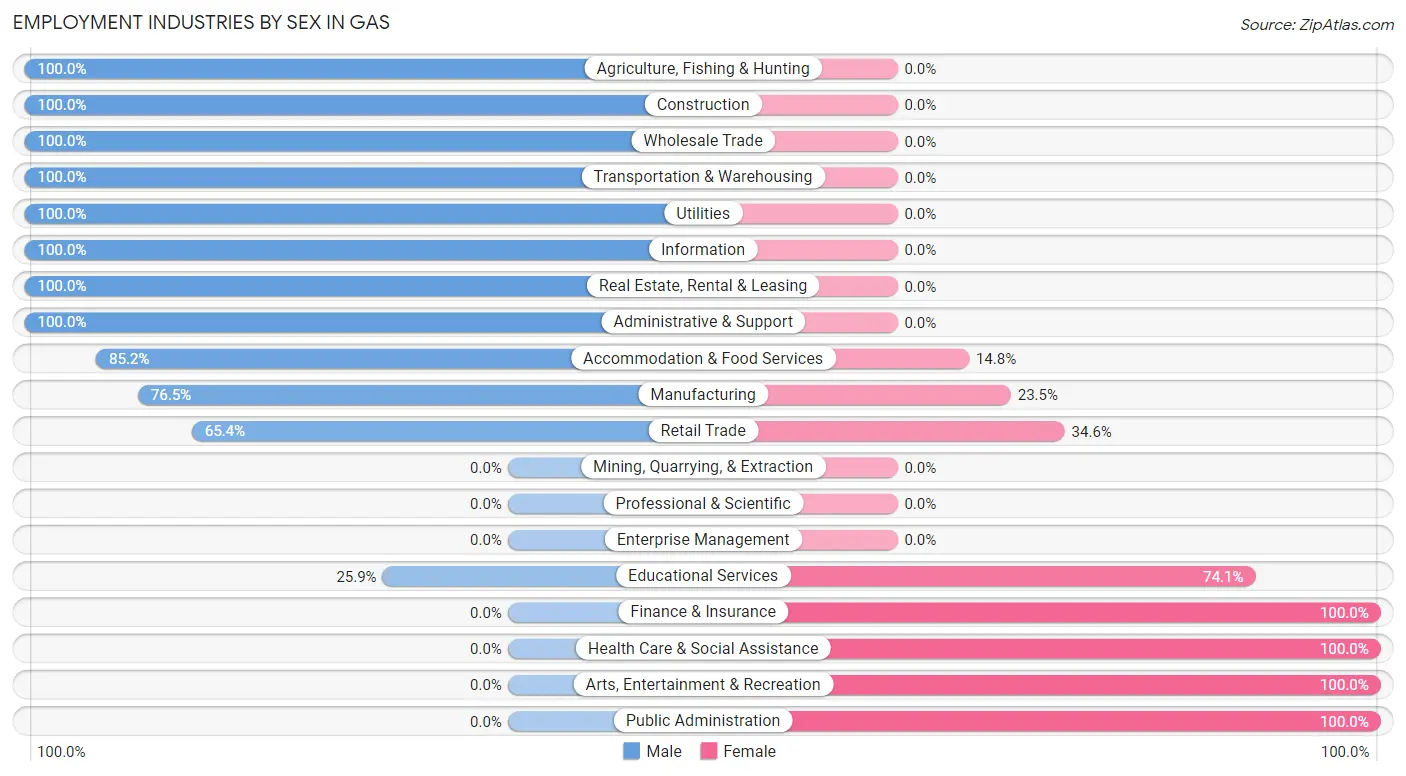
| Industry | Male | Female |
| Agriculture, Fishing & Hunting | 2 (100.0%) | 0 (0.0%) |
| Mining, Quarrying, & Extraction | 0 (0.0%) | 0 (0.0%) |
| Construction | 10 (100.0%) | 0 (0.0%) |
| Manufacturing | 62 (76.5%) | 19 (23.5%) |
| Wholesale Trade | 2 (100.0%) | 0 (0.0%) |
| Retail Trade | 34 (65.4%) | 18 (34.6%) |
| Transportation & Warehousing | 13 (100.0%) | 0 (0.0%) |
| Utilities | 2 (100.0%) | 0 (0.0%) |
| Information | 8 (100.0%) | 0 (0.0%) |
| Finance & Insurance | 0 (0.0%) | 2 (100.0%) |
| Real Estate, Rental & Leasing | 10 (100.0%) | 0 (0.0%) |
| Professional & Scientific | 0 (0.0%) | 0 (0.0%) |
| Enterprise Management | 0 (0.0%) | 0 (0.0%) |
| Administrative & Support | 3 (100.0%) | 0 (0.0%) |
| Educational Services | 7 (25.9%) | 20 (74.1%) |
| Health Care & Social Assistance | 0 (0.0%) | 13 (100.0%) |
| Arts, Entertainment & Recreation | 0 (0.0%) | 3 (100.0%) |
| Accommodation & Food Services | 23 (85.2%) | 4 (14.8%) |
| Public Administration | 0 (0.0%) | 8 (100.0%) |
| Total | 189 (66.5%) | 95 (33.5%) |
Education in Gas
School Enrollment in Gas
The most common levels of schooling among the 89 students in Gas are high school (35 | 39.3%), elementary school (29 | 32.6%), and middle school (21 | 23.6%).
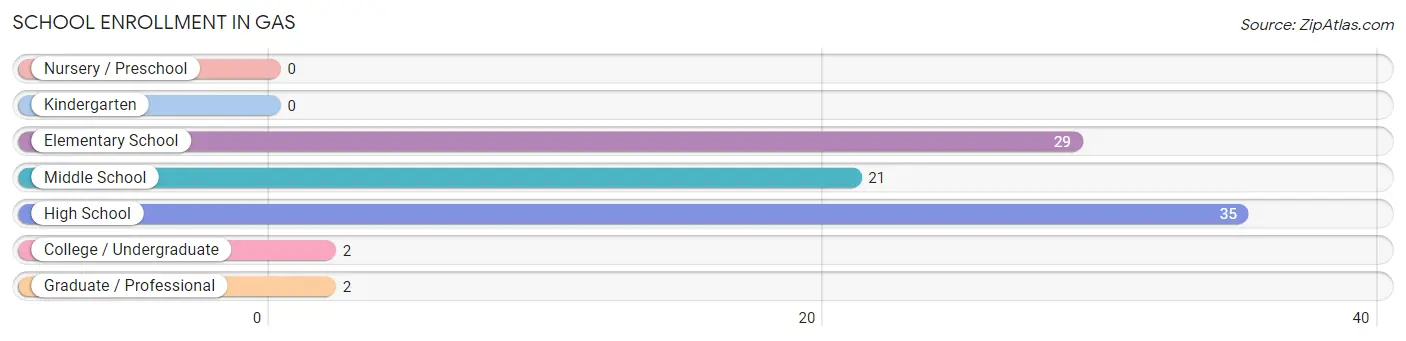
| School Level | # Students | % Students |
| Nursery / Preschool | 0 | 0.0% |
| Kindergarten | 0 | 0.0% |
| Elementary School | 29 | 32.6% |
| Middle School | 21 | 23.6% |
| High School | 35 | 39.3% |
| College / Undergraduate | 2 | 2.2% |
| Graduate / Professional | 2 | 2.2% |
| Total | 89 | 100.0% |
School Enrollment by Age by Funding Source in Gas
Out of a total of 89 students who are enrolled in schools in Gas, 8 (9.0%) attend a private institution, while the remaining 81 (91.0%) are enrolled in public schools. The age group of 5 to 9 year old has the highest likelihood of being enrolled in private schools, with 8 (27.6% in the age bracket) enrolled. Conversely, the age group of 10 to 14 year olds has the lowest likelihood of being enrolled in a private school, with 21 (100.0% in the age bracket) attending a public institution.
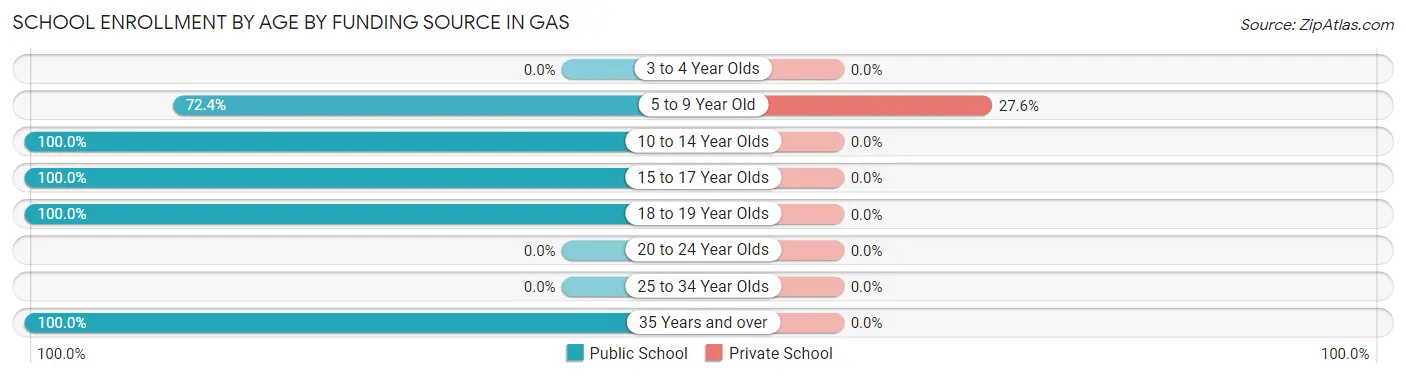
| Age Bracket | Public School | Private School |
| 3 to 4 Year Olds | 0 (0.0%) | 0 (0.0%) |
| 5 to 9 Year Old | 21 (72.4%) | 8 (27.6%) |
| 10 to 14 Year Olds | 21 (100.0%) | 0 (0.0%) |
| 15 to 17 Year Olds | 3 (100.0%) | 0 (0.0%) |
| 18 to 19 Year Olds | 34 (100.0%) | 0 (0.0%) |
| 20 to 24 Year Olds | 0 (0.0%) | 0 (0.0%) |
| 25 to 34 Year Olds | 0 (0.0%) | 0 (0.0%) |
| 35 Years and over | 2 (100.0%) | 0 (0.0%) |
| Total | 81 (91.0%) | 8 (9.0%) |
Educational Attainment by Field of Study in Gas
Education (22 | 29.7%), science & technology (21 | 28.4%), liberal arts & history (10 | 13.5%), visual & performing arts (7 | 9.5%), and bio, nature & agricultural (6 | 8.1%) are the most common fields of study among 74 individuals in Gas who have obtained a bachelor's degree or higher.
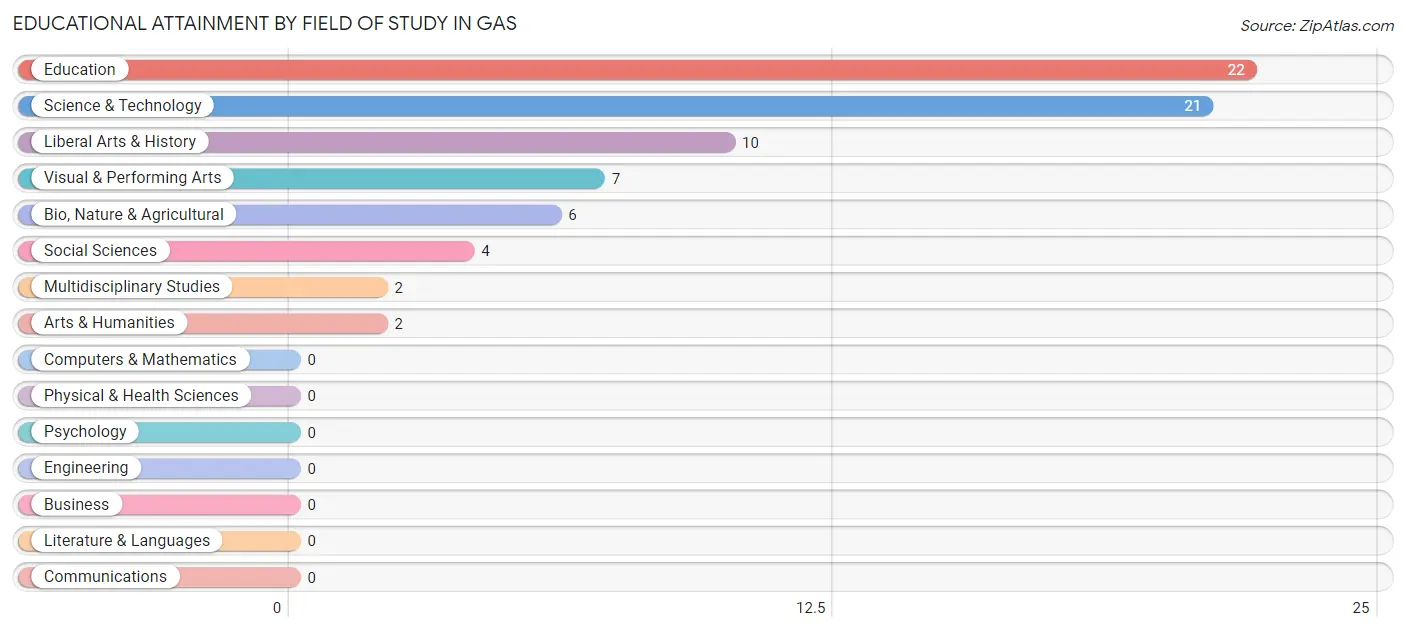
| Field of Study | # Graduates | % Graduates |
| Computers & Mathematics | 0 | 0.0% |
| Bio, Nature & Agricultural | 6 | 8.1% |
| Physical & Health Sciences | 0 | 0.0% |
| Psychology | 0 | 0.0% |
| Social Sciences | 4 | 5.4% |
| Engineering | 0 | 0.0% |
| Multidisciplinary Studies | 2 | 2.7% |
| Science & Technology | 21 | 28.4% |
| Business | 0 | 0.0% |
| Education | 22 | 29.7% |
| Literature & Languages | 0 | 0.0% |
| Liberal Arts & History | 10 | 13.5% |
| Visual & Performing Arts | 7 | 9.5% |
| Communications | 0 | 0.0% |
| Arts & Humanities | 2 | 2.7% |
| Total | 74 | 100.0% |
Transportation & Commute in Gas
Vehicle Availability by Sex in Gas
The most prevalent vehicle ownership categories in Gas are males with 2 vehicles (91, accounting for 48.1%) and females with 2 vehicles (62, making up 95.8%).
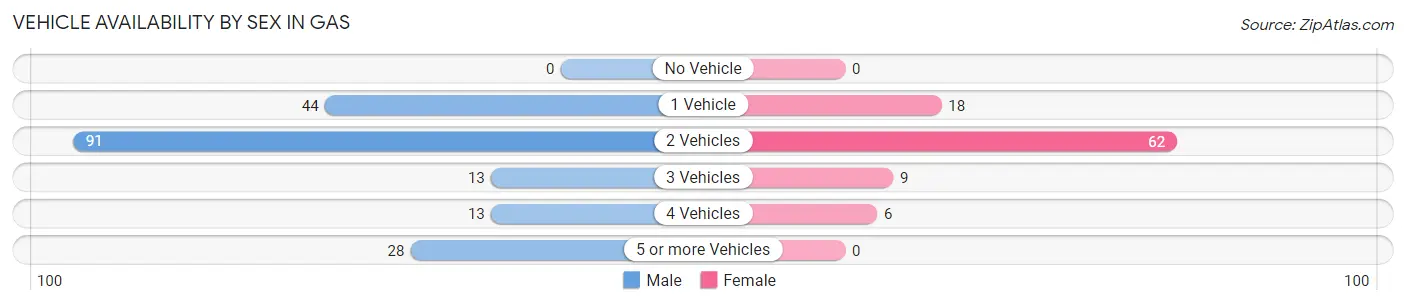
| Vehicles Available | Male | Female |
| No Vehicle | 0 (0.0%) | 0 (0.0%) |
| 1 Vehicle | 44 (23.3%) | 18 (19.0%) |
| 2 Vehicles | 91 (48.1%) | 62 (65.3%) |
| 3 Vehicles | 13 (6.9%) | 9 (9.5%) |
| 4 Vehicles | 13 (6.9%) | 6 (6.3%) |
| 5 or more Vehicles | 28 (14.8%) | 0 (0.0%) |
| Total | 189 (100.0%) | 95 (100.0%) |
Commute Time in Gas
The most frequently occuring commute durations in Gas are 10 to 14 minutes (141 commuters, 51.8%), 5 to 9 minutes (54 commuters, 19.9%), and 15 to 19 minutes (26 commuters, 9.6%).
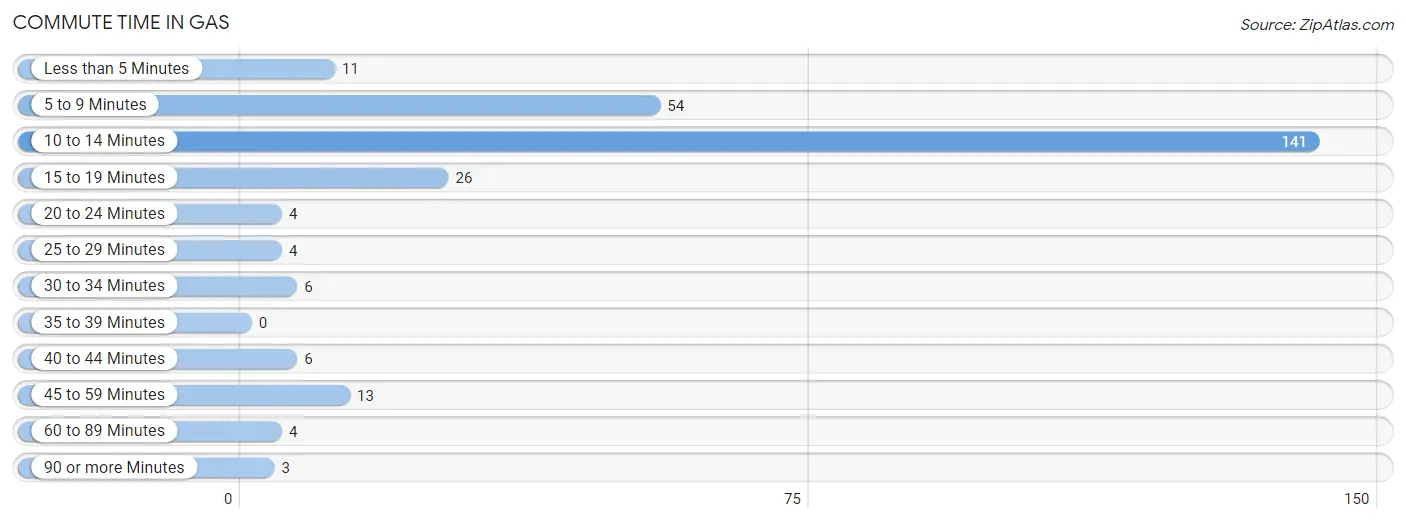
| Commute Time | # Commuters | % Commuters |
| Less than 5 Minutes | 11 | 4.0% |
| 5 to 9 Minutes | 54 | 19.9% |
| 10 to 14 Minutes | 141 | 51.8% |
| 15 to 19 Minutes | 26 | 9.6% |
| 20 to 24 Minutes | 4 | 1.5% |
| 25 to 29 Minutes | 4 | 1.5% |
| 30 to 34 Minutes | 6 | 2.2% |
| 35 to 39 Minutes | 0 | 0.0% |
| 40 to 44 Minutes | 6 | 2.2% |
| 45 to 59 Minutes | 13 | 4.8% |
| 60 to 89 Minutes | 4 | 1.5% |
| 90 or more Minutes | 3 | 1.1% |
Commute Time by Sex in Gas
The most common commute times in Gas are 10 to 14 minutes (92 commuters, 48.7%) for males and 10 to 14 minutes (49 commuters, 59.0%) for females.
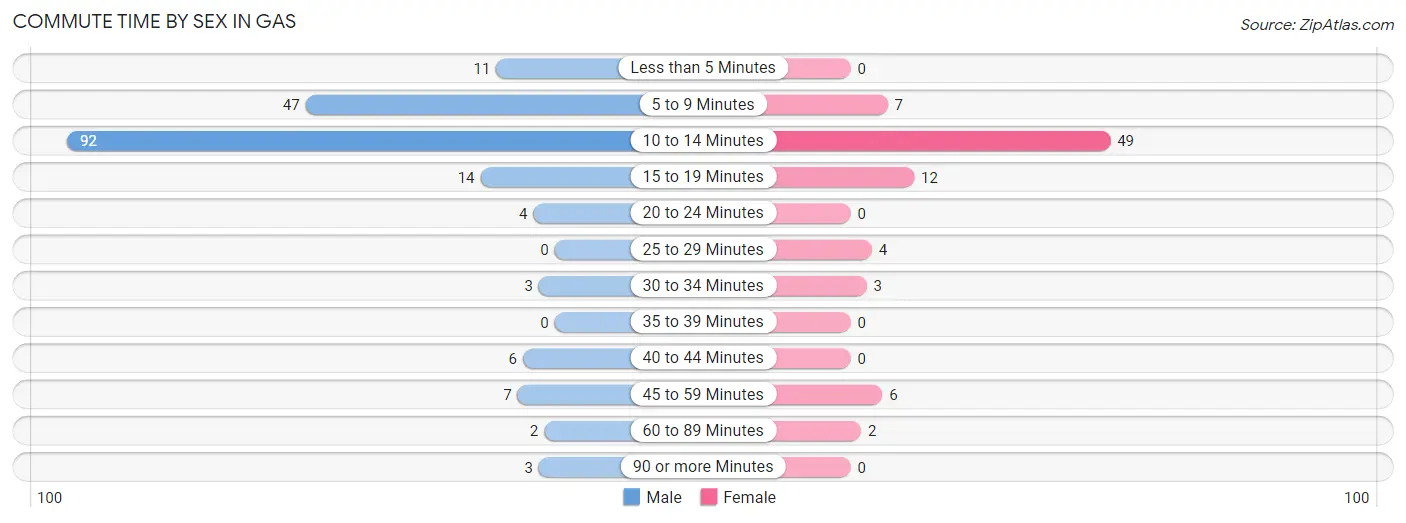
| Commute Time | Male | Female |
| Less than 5 Minutes | 11 (5.8%) | 0 (0.0%) |
| 5 to 9 Minutes | 47 (24.9%) | 7 (8.4%) |
| 10 to 14 Minutes | 92 (48.7%) | 49 (59.0%) |
| 15 to 19 Minutes | 14 (7.4%) | 12 (14.5%) |
| 20 to 24 Minutes | 4 (2.1%) | 0 (0.0%) |
| 25 to 29 Minutes | 0 (0.0%) | 4 (4.8%) |
| 30 to 34 Minutes | 3 (1.6%) | 3 (3.6%) |
| 35 to 39 Minutes | 0 (0.0%) | 0 (0.0%) |
| 40 to 44 Minutes | 6 (3.2%) | 0 (0.0%) |
| 45 to 59 Minutes | 7 (3.7%) | 6 (7.2%) |
| 60 to 89 Minutes | 2 (1.1%) | 2 (2.4%) |
| 90 or more Minutes | 3 (1.6%) | 0 (0.0%) |
Time of Departure to Work by Sex in Gas
The most frequent times of departure to work in Gas are 7:30 AM to 7:59 AM (59, 31.2%) for males and 7:30 AM to 7:59 AM (18, 21.7%) for females.
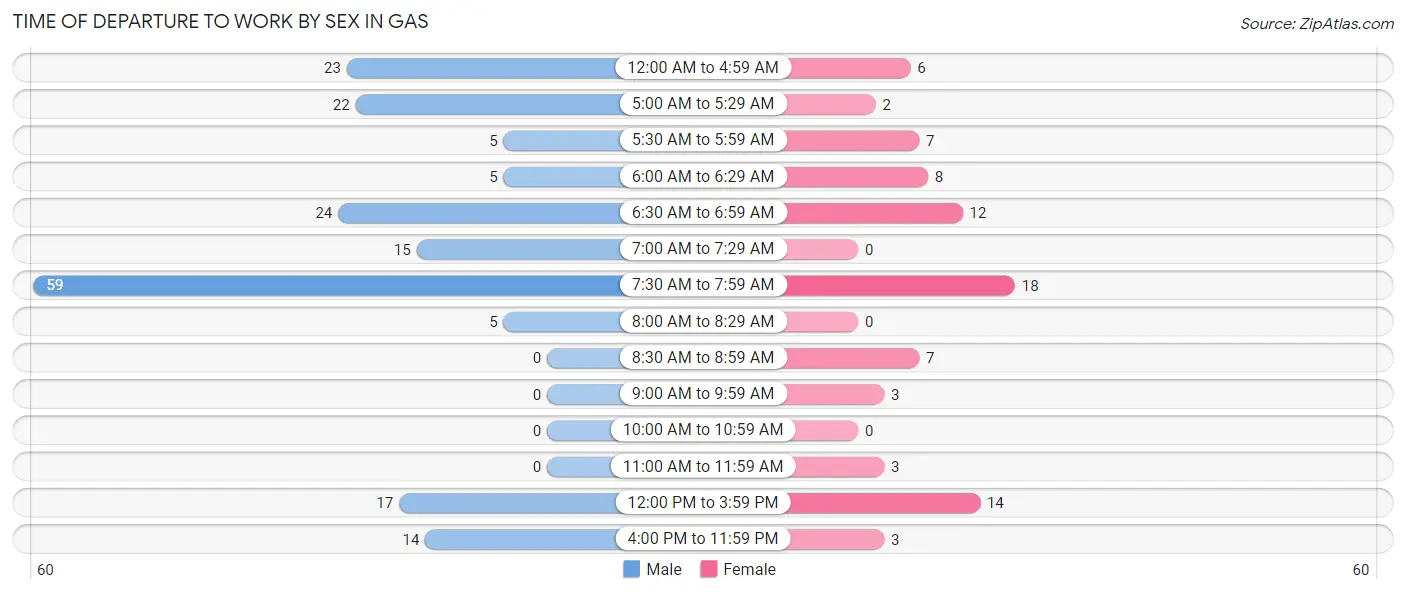
| Time of Departure | Male | Female |
| 12:00 AM to 4:59 AM | 23 (12.2%) | 6 (7.2%) |
| 5:00 AM to 5:29 AM | 22 (11.6%) | 2 (2.4%) |
| 5:30 AM to 5:59 AM | 5 (2.6%) | 7 (8.4%) |
| 6:00 AM to 6:29 AM | 5 (2.6%) | 8 (9.6%) |
| 6:30 AM to 6:59 AM | 24 (12.7%) | 12 (14.5%) |
| 7:00 AM to 7:29 AM | 15 (7.9%) | 0 (0.0%) |
| 7:30 AM to 7:59 AM | 59 (31.2%) | 18 (21.7%) |
| 8:00 AM to 8:29 AM | 5 (2.6%) | 0 (0.0%) |
| 8:30 AM to 8:59 AM | 0 (0.0%) | 7 (8.4%) |
| 9:00 AM to 9:59 AM | 0 (0.0%) | 3 (3.6%) |
| 10:00 AM to 10:59 AM | 0 (0.0%) | 0 (0.0%) |
| 11:00 AM to 11:59 AM | 0 (0.0%) | 3 (3.6%) |
| 12:00 PM to 3:59 PM | 17 (9.0%) | 14 (16.9%) |
| 4:00 PM to 11:59 PM | 14 (7.4%) | 3 (3.6%) |
| Total | 189 (100.0%) | 83 (100.0%) |
Housing Occupancy in Gas
Occupancy by Ownership in Gas
Of the total 193 dwellings in Gas, owner-occupied units account for 148 (76.7%), while renter-occupied units make up 45 (23.3%).
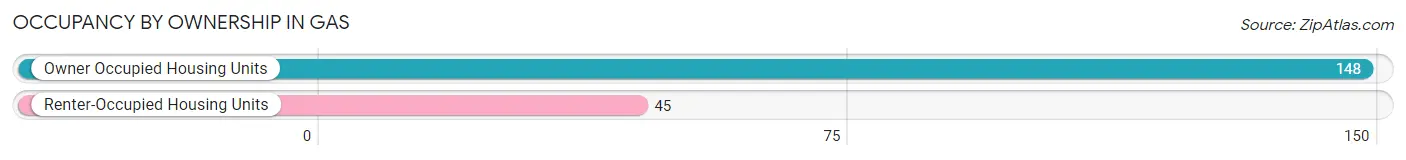
| Occupancy | # Housing Units | % Housing Units |
| Owner Occupied Housing Units | 148 | 76.7% |
| Renter-Occupied Housing Units | 45 | 23.3% |
| Total Occupied Housing Units | 193 | 100.0% |
Occupancy by Household Size in Gas
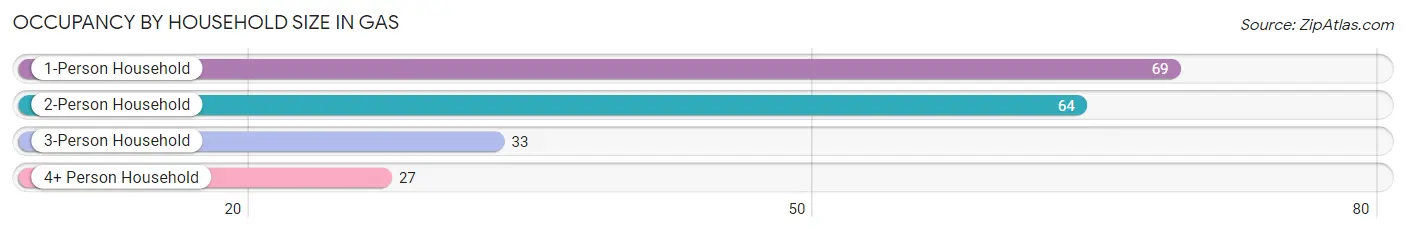
| Household Size | # Housing Units | % Housing Units |
| 1-Person Household | 69 | 35.7% |
| 2-Person Household | 64 | 33.2% |
| 3-Person Household | 33 | 17.1% |
| 4+ Person Household | 27 | 14.0% |
| Total Housing Units | 193 | 100.0% |
Occupancy by Ownership by Household Size in Gas
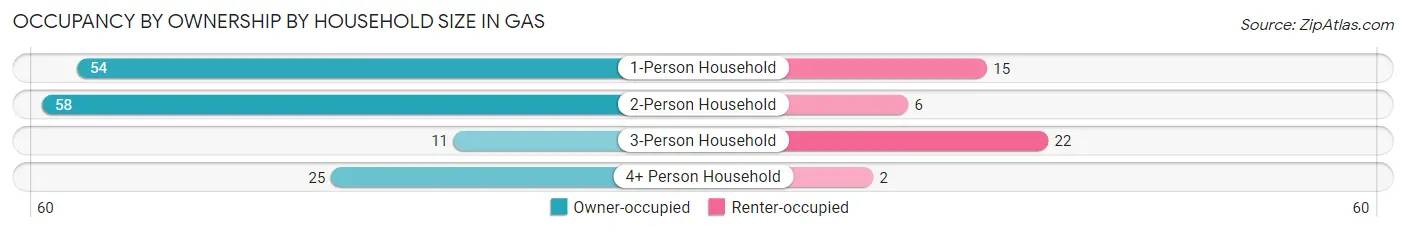
| Household Size | Owner-occupied | Renter-occupied |
| 1-Person Household | 54 (78.3%) | 15 (21.7%) |
| 2-Person Household | 58 (90.6%) | 6 (9.4%) |
| 3-Person Household | 11 (33.3%) | 22 (66.7%) |
| 4+ Person Household | 25 (92.6%) | 2 (7.4%) |
| Total Housing Units | 148 (76.7%) | 45 (23.3%) |
Occupancy by Educational Attainment in Gas
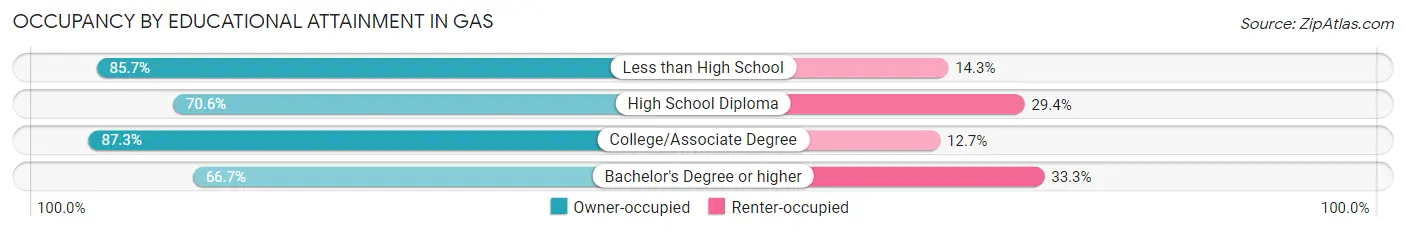
| Household Size | Owner-occupied | Renter-occupied |
| Less than High School | 12 (85.7%) | 2 (14.3%) |
| High School Diploma | 36 (70.6%) | 15 (29.4%) |
| College/Associate Degree | 62 (87.3%) | 9 (12.7%) |
| Bachelor's Degree or higher | 38 (66.7%) | 19 (33.3%) |
Occupancy by Age of Householder in Gas
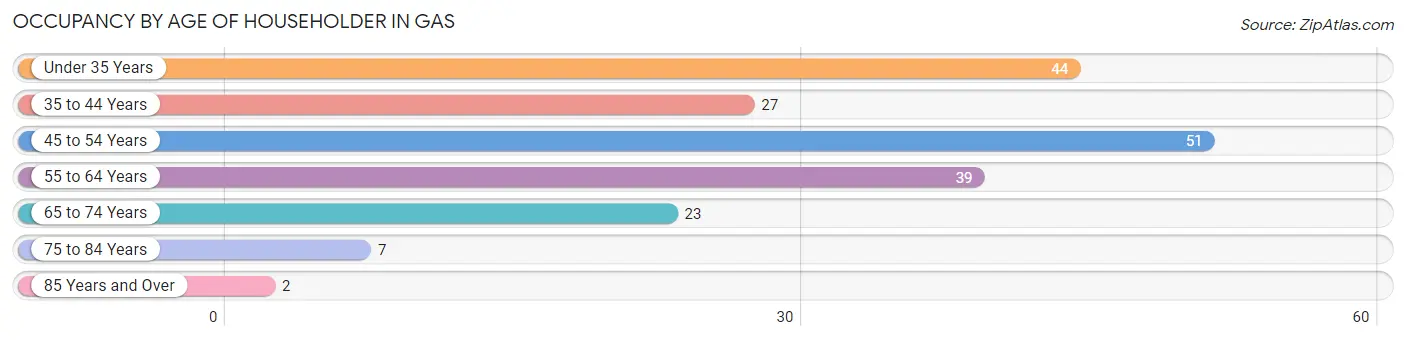
| Age Bracket | # Households | % Households |
| Under 35 Years | 44 | 22.8% |
| 35 to 44 Years | 27 | 14.0% |
| 45 to 54 Years | 51 | 26.4% |
| 55 to 64 Years | 39 | 20.2% |
| 65 to 74 Years | 23 | 11.9% |
| 75 to 84 Years | 7 | 3.6% |
| 85 Years and Over | 2 | 1.0% |
| Total | 193 | 100.0% |
Housing Finances in Gas
Median Income by Occupancy in Gas
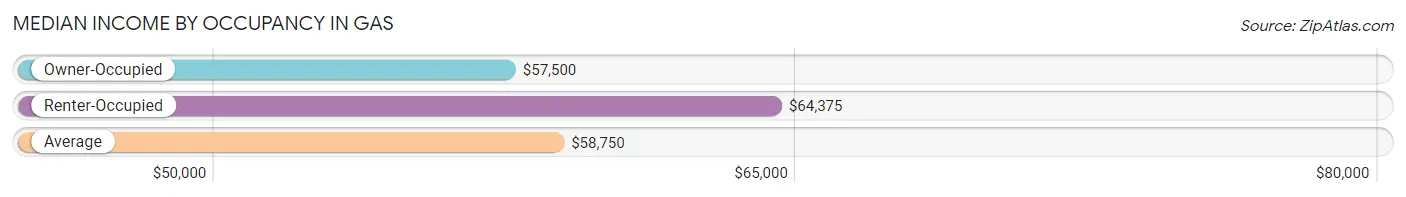
| Occupancy Type | # Households | Median Income |
| Owner-Occupied | 148 (76.7%) | $57,500 |
| Renter-Occupied | 45 (23.3%) | $64,375 |
| Average | 193 (100.0%) | $58,750 |
Occupancy by Householder Income Bracket in Gas
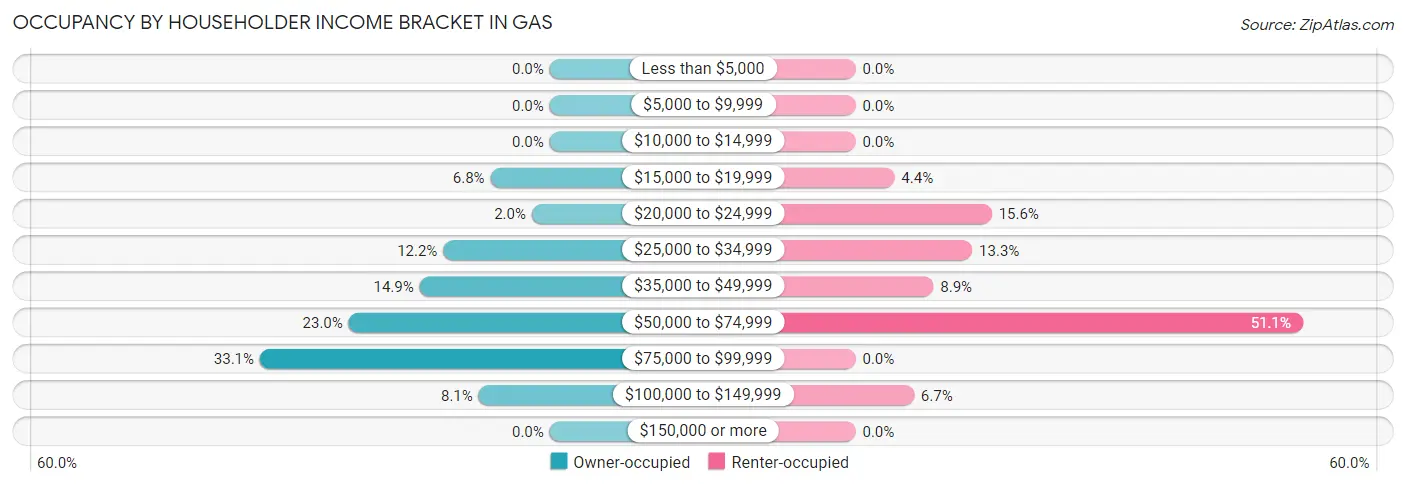
| Income Bracket | Owner-occupied | Renter-occupied |
| Less than $5,000 | 0 (0.0%) | 0 (0.0%) |
| $5,000 to $9,999 | 0 (0.0%) | 0 (0.0%) |
| $10,000 to $14,999 | 0 (0.0%) | 0 (0.0%) |
| $15,000 to $19,999 | 10 (6.8%) | 2 (4.4%) |
| $20,000 to $24,999 | 3 (2.0%) | 7 (15.6%) |
| $25,000 to $34,999 | 18 (12.2%) | 6 (13.3%) |
| $35,000 to $49,999 | 22 (14.9%) | 4 (8.9%) |
| $50,000 to $74,999 | 34 (23.0%) | 23 (51.1%) |
| $75,000 to $99,999 | 49 (33.1%) | 0 (0.0%) |
| $100,000 to $149,999 | 12 (8.1%) | 3 (6.7%) |
| $150,000 or more | 0 (0.0%) | 0 (0.0%) |
| Total | 148 (100.0%) | 45 (100.0%) |
Monthly Housing Cost Tiers in Gas
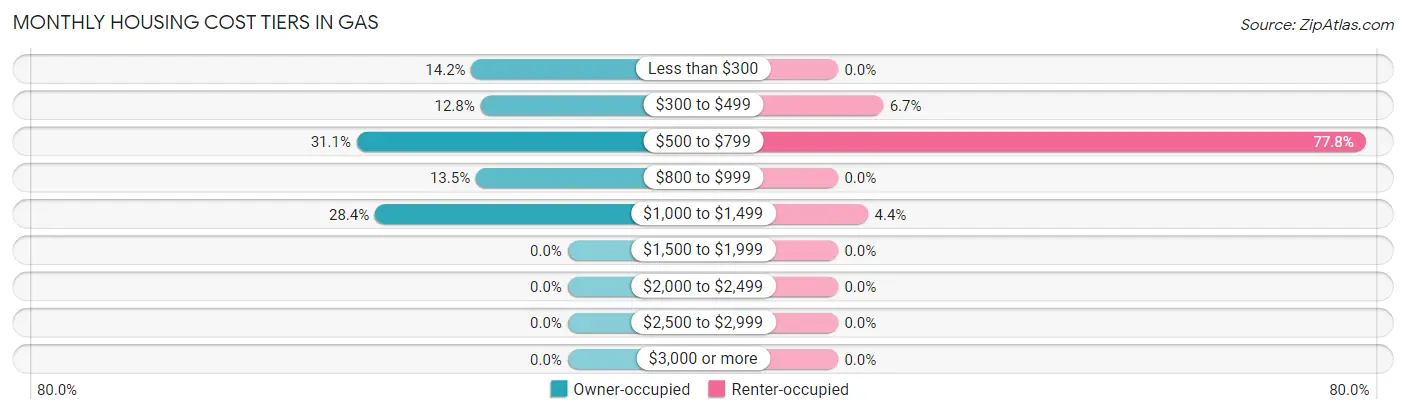
| Monthly Cost | Owner-occupied | Renter-occupied |
| Less than $300 | 21 (14.2%) | 0 (0.0%) |
| $300 to $499 | 19 (12.8%) | 3 (6.7%) |
| $500 to $799 | 46 (31.1%) | 35 (77.8%) |
| $800 to $999 | 20 (13.5%) | 0 (0.0%) |
| $1,000 to $1,499 | 42 (28.4%) | 2 (4.4%) |
| $1,500 to $1,999 | 0 (0.0%) | 0 (0.0%) |
| $2,000 to $2,499 | 0 (0.0%) | 0 (0.0%) |
| $2,500 to $2,999 | 0 (0.0%) | 0 (0.0%) |
| $3,000 or more | 0 (0.0%) | 0 (0.0%) |
| Total | 148 (100.0%) | 45 (100.0%) |
Physical Housing Characteristics in Gas
Housing Structures in Gas
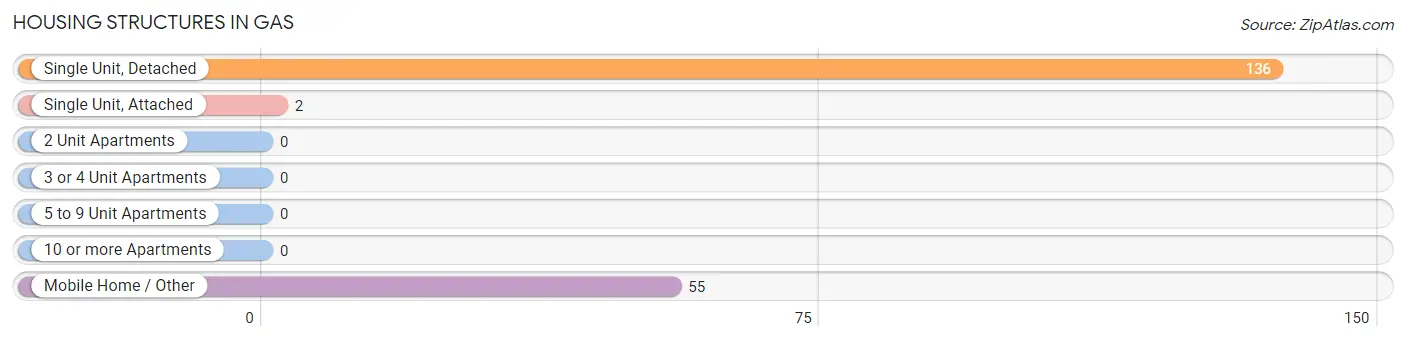
| Structure Type | # Housing Units | % Housing Units |
| Single Unit, Detached | 136 | 70.5% |
| Single Unit, Attached | 2 | 1.0% |
| 2 Unit Apartments | 0 | 0.0% |
| 3 or 4 Unit Apartments | 0 | 0.0% |
| 5 to 9 Unit Apartments | 0 | 0.0% |
| 10 or more Apartments | 0 | 0.0% |
| Mobile Home / Other | 55 | 28.5% |
| Total | 193 | 100.0% |
Housing Structures by Occupancy in Gas
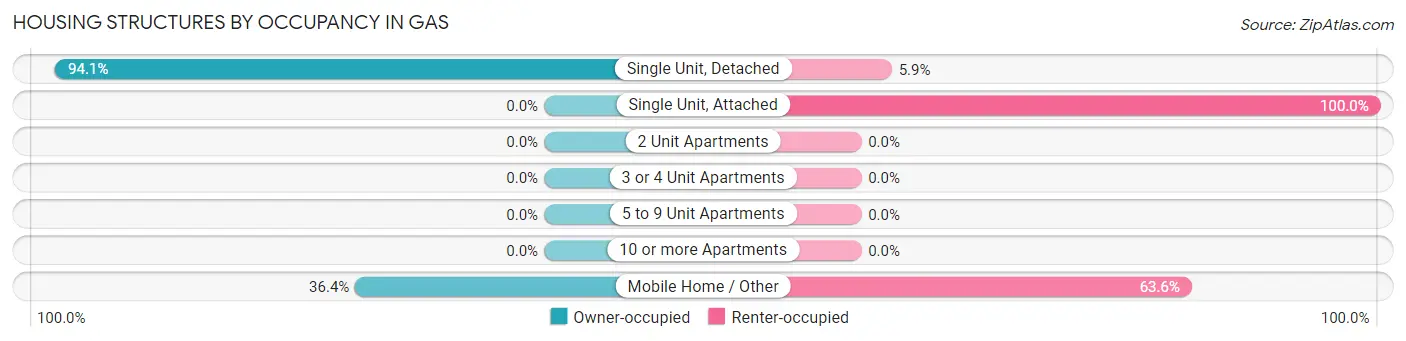
| Structure Type | Owner-occupied | Renter-occupied |
| Single Unit, Detached | 128 (94.1%) | 8 (5.9%) |
| Single Unit, Attached | 0 (0.0%) | 2 (100.0%) |
| 2 Unit Apartments | 0 (0.0%) | 0 (0.0%) |
| 3 or 4 Unit Apartments | 0 (0.0%) | 0 (0.0%) |
| 5 to 9 Unit Apartments | 0 (0.0%) | 0 (0.0%) |
| 10 or more Apartments | 0 (0.0%) | 0 (0.0%) |
| Mobile Home / Other | 20 (36.4%) | 35 (63.6%) |
| Total | 148 (76.7%) | 45 (23.3%) |
Housing Structures by Number of Rooms in Gas
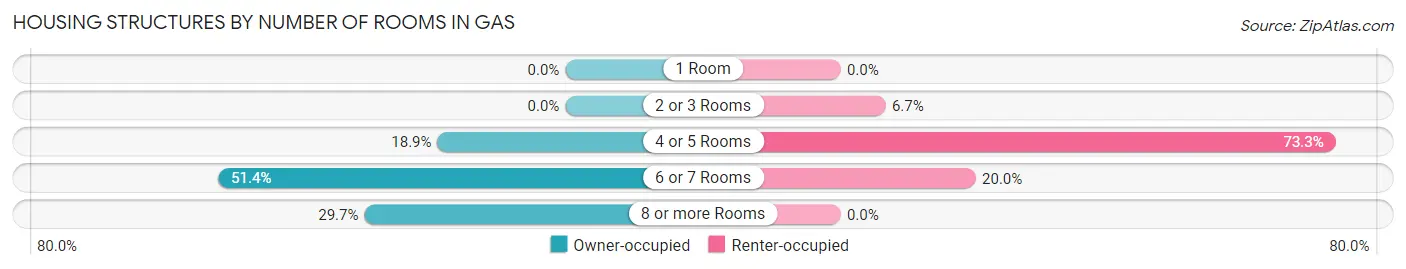
| Number of Rooms | Owner-occupied | Renter-occupied |
| 1 Room | 0 (0.0%) | 0 (0.0%) |
| 2 or 3 Rooms | 0 (0.0%) | 3 (6.7%) |
| 4 or 5 Rooms | 28 (18.9%) | 33 (73.3%) |
| 6 or 7 Rooms | 76 (51.3%) | 9 (20.0%) |
| 8 or more Rooms | 44 (29.7%) | 0 (0.0%) |
| Total | 148 (100.0%) | 45 (100.0%) |
Housing Structure by Heating Type in Gas
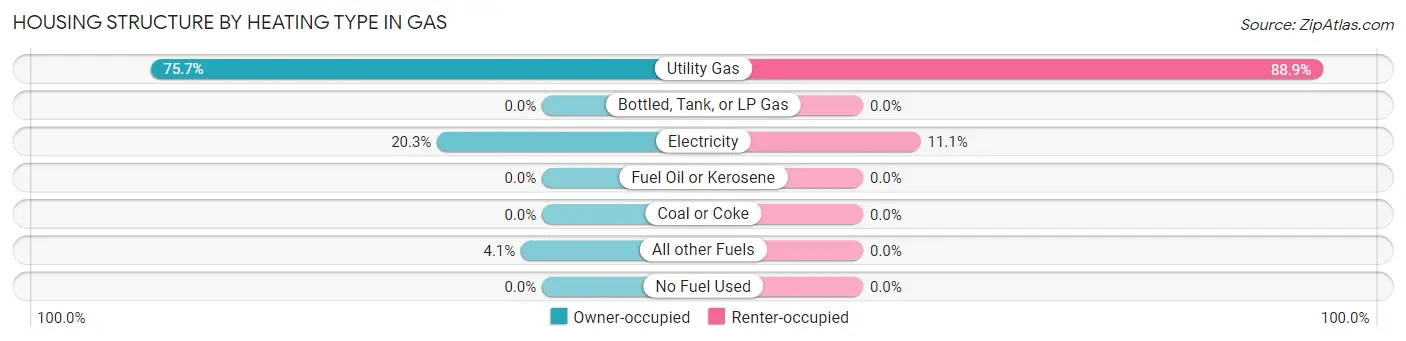
| Heating Type | Owner-occupied | Renter-occupied |
| Utility Gas | 112 (75.7%) | 40 (88.9%) |
| Bottled, Tank, or LP Gas | 0 (0.0%) | 0 (0.0%) |
| Electricity | 30 (20.3%) | 5 (11.1%) |
| Fuel Oil or Kerosene | 0 (0.0%) | 0 (0.0%) |
| Coal or Coke | 0 (0.0%) | 0 (0.0%) |
| All other Fuels | 6 (4.1%) | 0 (0.0%) |
| No Fuel Used | 0 (0.0%) | 0 (0.0%) |
| Total | 148 (100.0%) | 45 (100.0%) |
Household Vehicle Usage in Gas
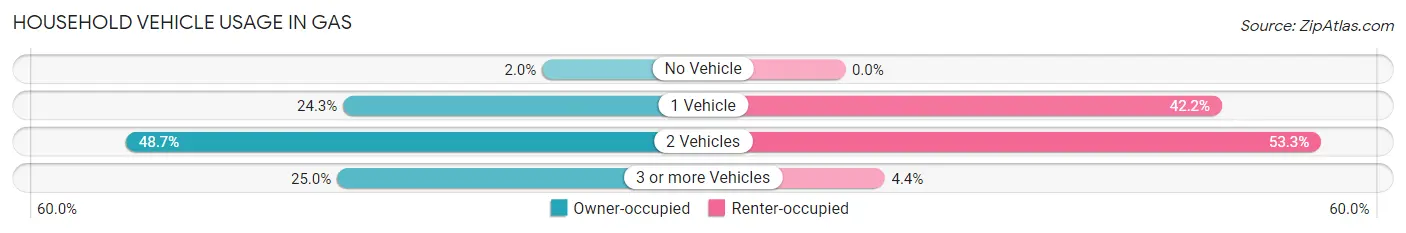
| Vehicles per Household | Owner-occupied | Renter-occupied |
| No Vehicle | 3 (2.0%) | 0 (0.0%) |
| 1 Vehicle | 36 (24.3%) | 19 (42.2%) |
| 2 Vehicles | 72 (48.6%) | 24 (53.3%) |
| 3 or more Vehicles | 37 (25.0%) | 2 (4.4%) |
| Total | 148 (100.0%) | 45 (100.0%) |
Real Estate & Mortgages in Gas
Real Estate and Mortgage Overview in Gas
| Characteristic | Without Mortgage | With Mortgage |
| Housing Units | 65 | 83 |
| Median Property Value | $75,000 | $65,000 |
| Median Household Income | $64,375 | $0 |
| Monthly Housing Costs | $446 | $0 |
| Real Estate Taxes | $1,047 | $0 |
Property Value by Mortgage Status in Gas
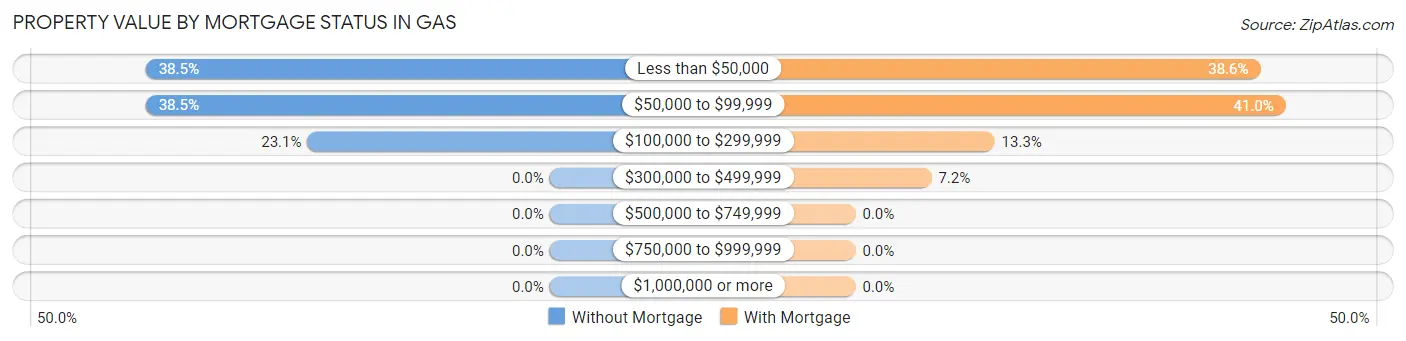
| Property Value | Without Mortgage | With Mortgage |
| Less than $50,000 | 25 (38.5%) | 32 (38.6%) |
| $50,000 to $99,999 | 25 (38.5%) | 34 (41.0%) |
| $100,000 to $299,999 | 15 (23.1%) | 11 (13.3%) |
| $300,000 to $499,999 | 0 (0.0%) | 6 (7.2%) |
| $500,000 to $749,999 | 0 (0.0%) | 0 (0.0%) |
| $750,000 to $999,999 | 0 (0.0%) | 0 (0.0%) |
| $1,000,000 or more | 0 (0.0%) | 0 (0.0%) |
| Total | 65 (100.0%) | 83 (100.0%) |
Household Income by Mortgage Status in Gas
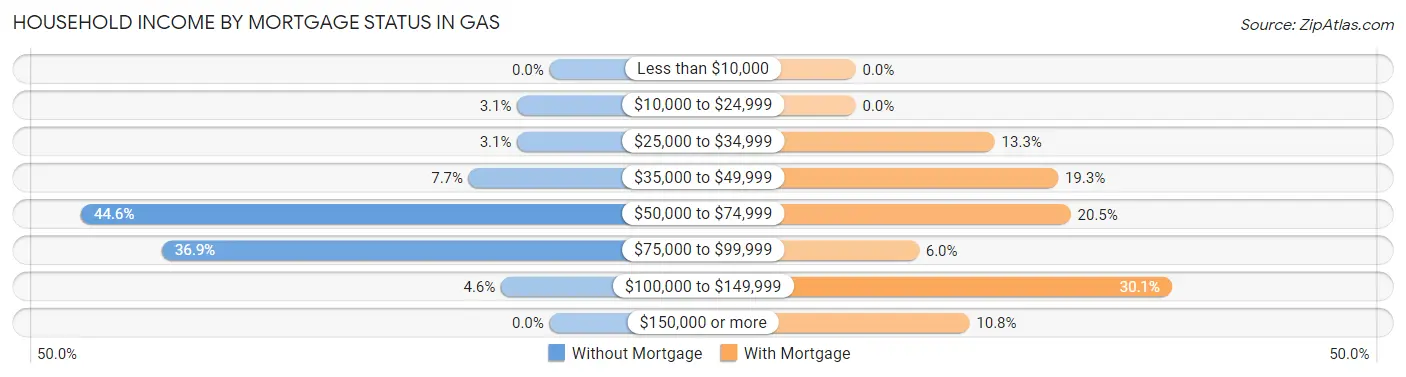
| Household Income | Without Mortgage | With Mortgage |
| Less than $10,000 | 0 (0.0%) | 0 (0.0%) |
| $10,000 to $24,999 | 2 (3.1%) | 0 (0.0%) |
| $25,000 to $34,999 | 2 (3.1%) | 11 (13.3%) |
| $35,000 to $49,999 | 5 (7.7%) | 16 (19.3%) |
| $50,000 to $74,999 | 29 (44.6%) | 17 (20.5%) |
| $75,000 to $99,999 | 24 (36.9%) | 5 (6.0%) |
| $100,000 to $149,999 | 3 (4.6%) | 25 (30.1%) |
| $150,000 or more | 0 (0.0%) | 9 (10.8%) |
| Total | 65 (100.0%) | 83 (100.0%) |
Property Value to Household Income Ratio in Gas
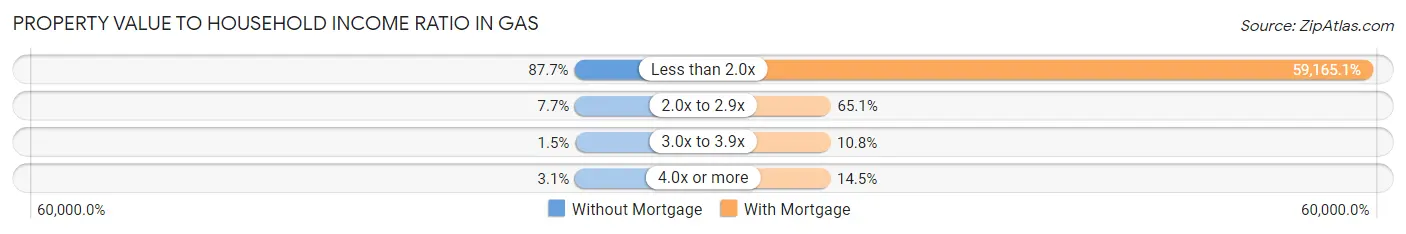
| Value-to-Income Ratio | Without Mortgage | With Mortgage |
| Less than 2.0x | 57 (87.7%) | 49,107 (59,165.1%) |
| 2.0x to 2.9x | 5 (7.7%) | 54 (65.1%) |
| 3.0x to 3.9x | 1 (1.5%) | 9 (10.8%) |
| 4.0x or more | 2 (3.1%) | 12 (14.5%) |
| Total | 65 (100.0%) | 83 (100.0%) |
Real Estate Taxes by Mortgage Status in Gas
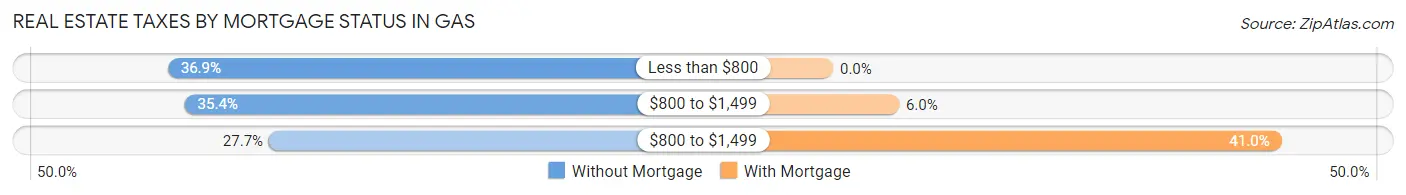
| Property Taxes | Without Mortgage | With Mortgage |
| Less than $800 | 24 (36.9%) | 0 (0.0%) |
| $800 to $1,499 | 23 (35.4%) | 5 (6.0%) |
| $800 to $1,499 | 18 (27.7%) | 34 (41.0%) |
| Total | 65 (100.0%) | 83 (100.0%) |
Health & Disability in Gas
Health Insurance Coverage by Age in Gas
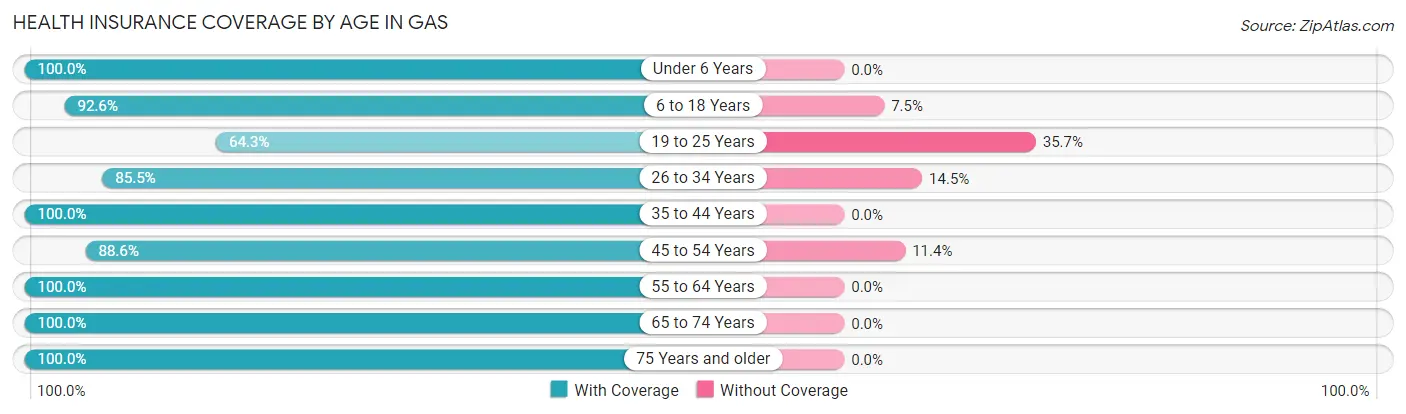
| Age Bracket | With Coverage | Without Coverage |
| Under 6 Years | 34 (100.0%) | 0 (0.0%) |
| 6 to 18 Years | 87 (92.5%) | 7 (7.4%) |
| 19 to 25 Years | 18 (64.3%) | 10 (35.7%) |
| 26 to 34 Years | 53 (85.5%) | 9 (14.5%) |
| 35 to 44 Years | 48 (100.0%) | 0 (0.0%) |
| 45 to 54 Years | 78 (88.6%) | 10 (11.4%) |
| 55 to 64 Years | 56 (100.0%) | 0 (0.0%) |
| 65 to 74 Years | 110 (100.0%) | 0 (0.0%) |
| 75 Years and older | 12 (100.0%) | 0 (0.0%) |
| Total | 496 (93.2%) | 36 (6.8%) |
Health Insurance Coverage by Citizenship Status in Gas
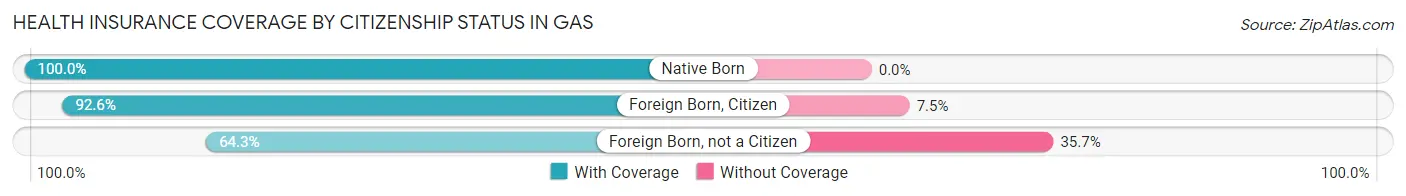
| Citizenship Status | With Coverage | Without Coverage |
| Native Born | 34 (100.0%) | 0 (0.0%) |
| Foreign Born, Citizen | 87 (92.5%) | 7 (7.4%) |
| Foreign Born, not a Citizen | 18 (64.3%) | 10 (35.7%) |
Health Insurance Coverage by Household Income in Gas
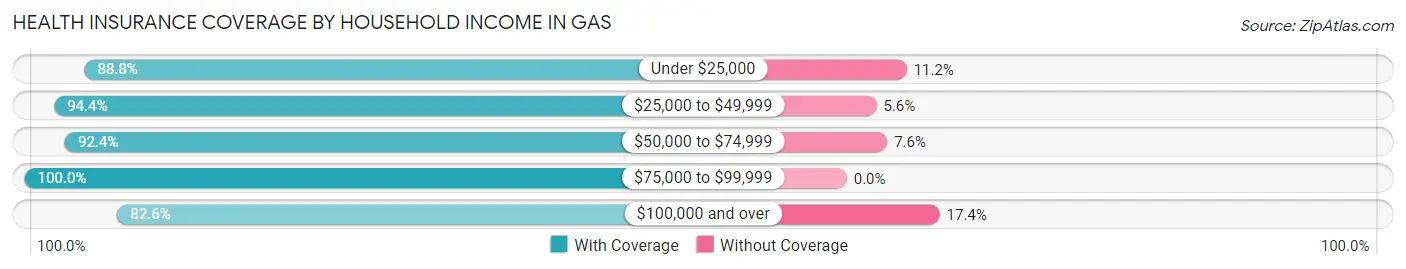
| Household Income | With Coverage | Without Coverage |
| Under $25,000 | 87 (88.8%) | 11 (11.2%) |
| $25,000 to $49,999 | 119 (94.4%) | 7 (5.6%) |
| $50,000 to $74,999 | 122 (92.4%) | 10 (7.6%) |
| $75,000 to $99,999 | 130 (100.0%) | 0 (0.0%) |
| $100,000 and over | 38 (82.6%) | 8 (17.4%) |
Public vs Private Health Insurance Coverage by Age in Gas
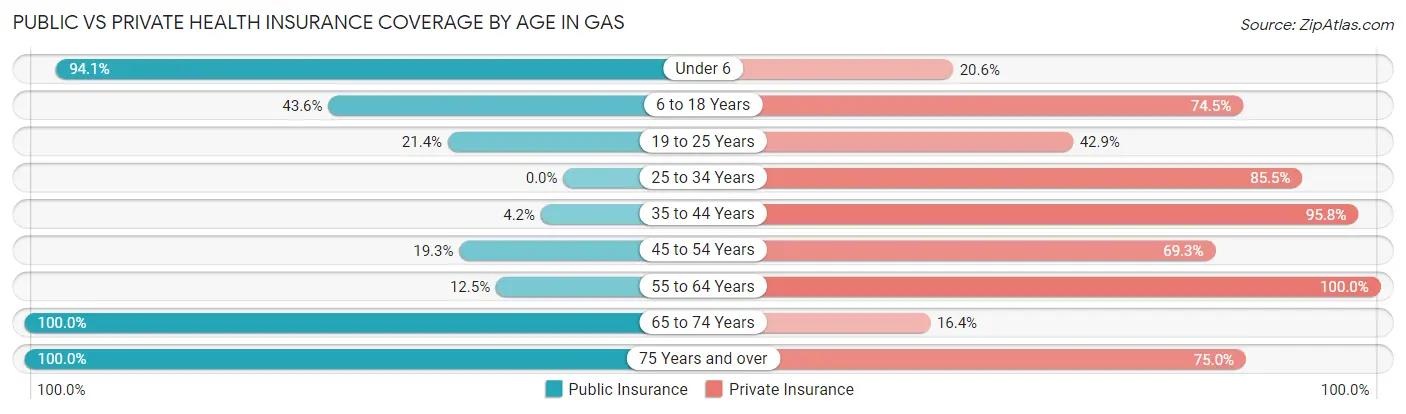
| Age Bracket | Public Insurance | Private Insurance |
| Under 6 | 32 (94.1%) | 7 (20.6%) |
| 6 to 18 Years | 41 (43.6%) | 70 (74.5%) |
| 19 to 25 Years | 6 (21.4%) | 12 (42.9%) |
| 25 to 34 Years | 0 (0.0%) | 53 (85.5%) |
| 35 to 44 Years | 2 (4.2%) | 46 (95.8%) |
| 45 to 54 Years | 17 (19.3%) | 61 (69.3%) |
| 55 to 64 Years | 7 (12.5%) | 56 (100.0%) |
| 65 to 74 Years | 110 (100.0%) | 18 (16.4%) |
| 75 Years and over | 12 (100.0%) | 9 (75.0%) |
| Total | 227 (42.7%) | 332 (62.4%) |
Disability Status by Sex by Age in Gas
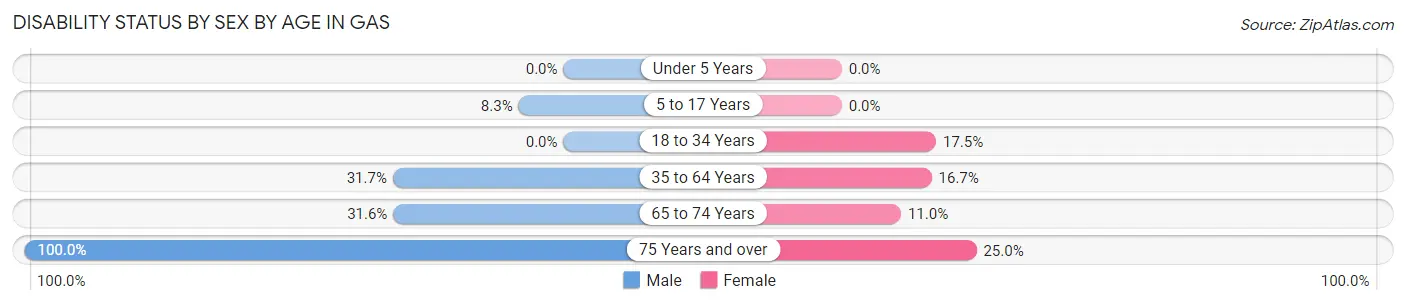
| Age Bracket | Male | Female |
| Under 5 Years | 0 (0.0%) | 0 (0.0%) |
| 5 to 17 Years | 2 (8.3%) | 0 (0.0%) |
| 18 to 34 Years | 0 (0.0%) | 7 (17.5%) |
| 35 to 64 Years | 38 (31.7%) | 12 (16.7%) |
| 65 to 74 Years | 6 (31.6%) | 10 (11.0%) |
| 75 Years and over | 8 (100.0%) | 1 (25.0%) |
Disability Class by Sex by Age in Gas
Disability Class: Hearing Difficulty
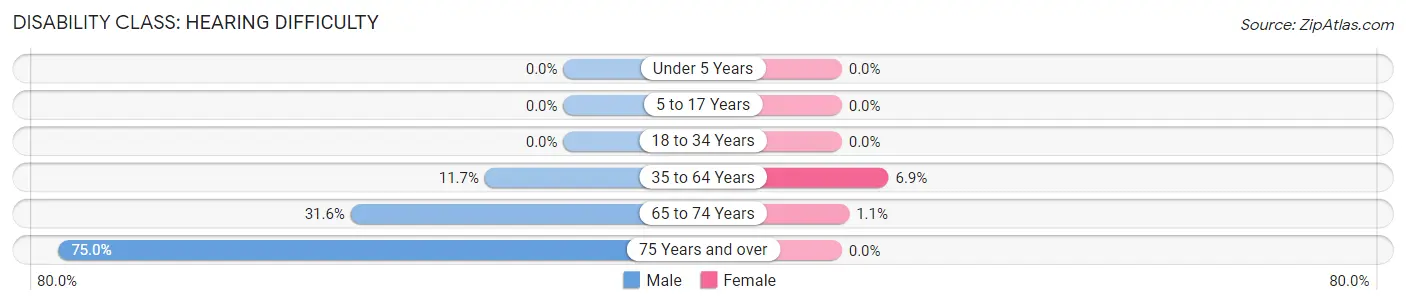
| Age Bracket | Male | Female |
| Under 5 Years | 0 (0.0%) | 0 (0.0%) |
| 5 to 17 Years | 0 (0.0%) | 0 (0.0%) |
| 18 to 34 Years | 0 (0.0%) | 0 (0.0%) |
| 35 to 64 Years | 14 (11.7%) | 5 (6.9%) |
| 65 to 74 Years | 6 (31.6%) | 1 (1.1%) |
| 75 Years and over | 6 (75.0%) | 0 (0.0%) |
Disability Class: Vision Difficulty
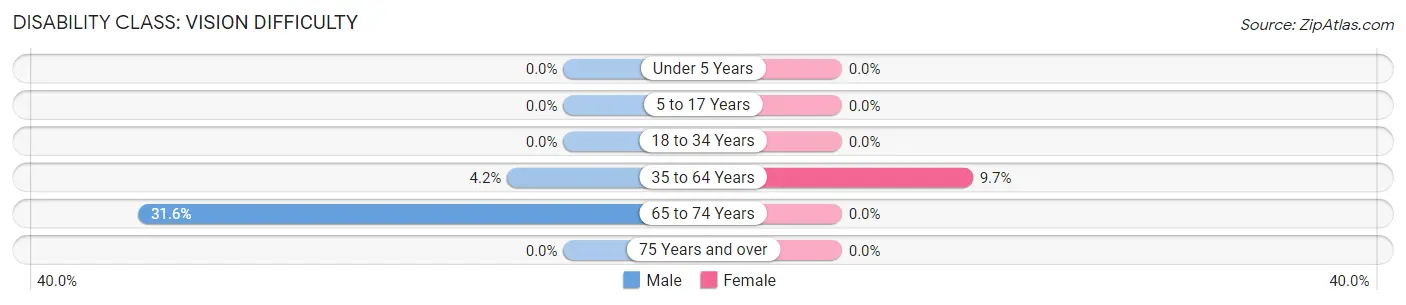
| Age Bracket | Male | Female |
| Under 5 Years | 0 (0.0%) | 0 (0.0%) |
| 5 to 17 Years | 0 (0.0%) | 0 (0.0%) |
| 18 to 34 Years | 0 (0.0%) | 0 (0.0%) |
| 35 to 64 Years | 5 (4.2%) | 7 (9.7%) |
| 65 to 74 Years | 6 (31.6%) | 0 (0.0%) |
| 75 Years and over | 0 (0.0%) | 0 (0.0%) |
Disability Class: Cognitive Difficulty
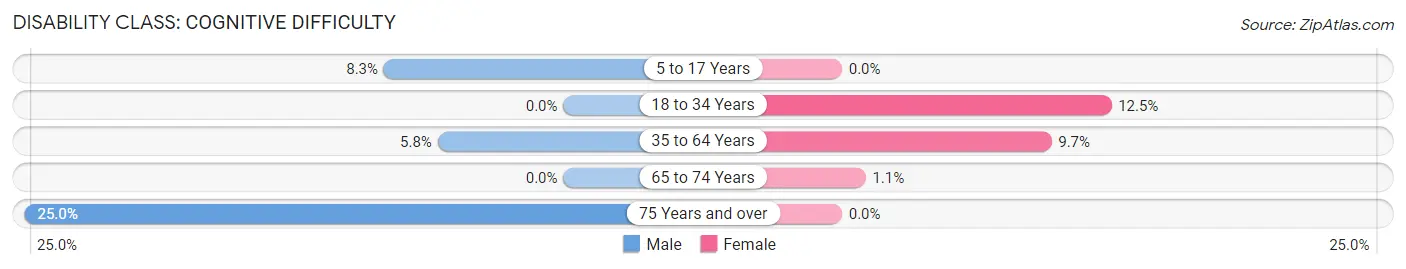
| Age Bracket | Male | Female |
| 5 to 17 Years | 2 (8.3%) | 0 (0.0%) |
| 18 to 34 Years | 0 (0.0%) | 5 (12.5%) |
| 35 to 64 Years | 7 (5.8%) | 7 (9.7%) |
| 65 to 74 Years | 0 (0.0%) | 1 (1.1%) |
| 75 Years and over | 2 (25.0%) | 0 (0.0%) |
Disability Class: Ambulatory Difficulty
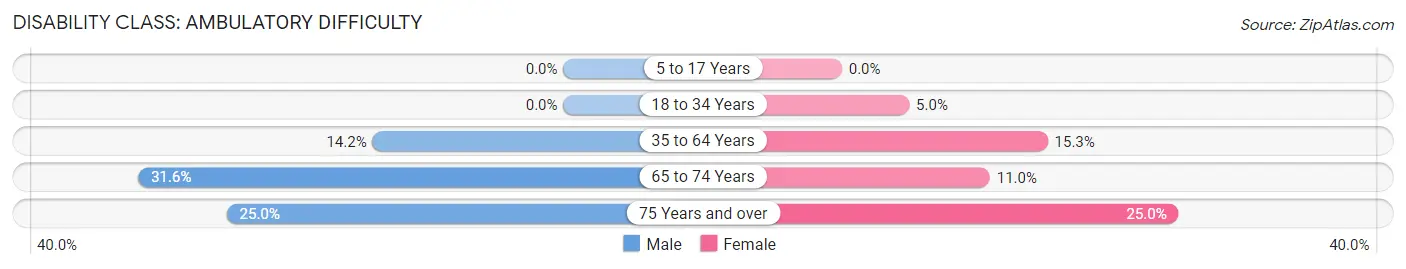
| Age Bracket | Male | Female |
| 5 to 17 Years | 0 (0.0%) | 0 (0.0%) |
| 18 to 34 Years | 0 (0.0%) | 2 (5.0%) |
| 35 to 64 Years | 17 (14.2%) | 11 (15.3%) |
| 65 to 74 Years | 6 (31.6%) | 10 (11.0%) |
| 75 Years and over | 2 (25.0%) | 1 (25.0%) |
Disability Class: Self-Care Difficulty
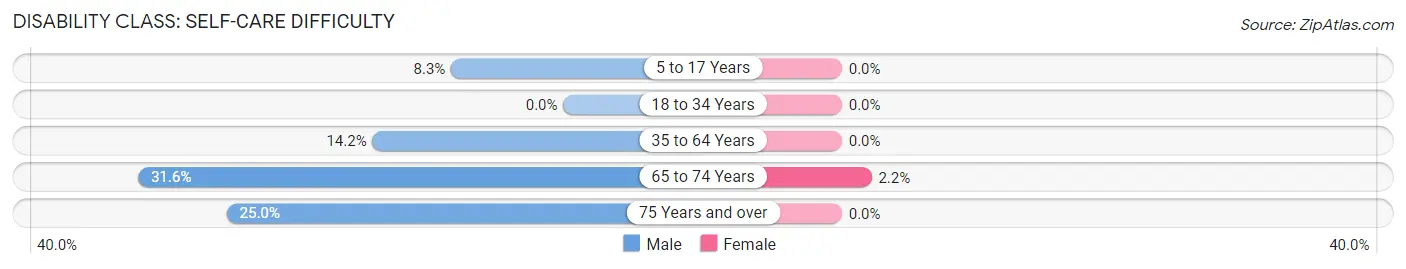
| Age Bracket | Male | Female |
| 5 to 17 Years | 2 (8.3%) | 0 (0.0%) |
| 18 to 34 Years | 0 (0.0%) | 0 (0.0%) |
| 35 to 64 Years | 17 (14.2%) | 0 (0.0%) |
| 65 to 74 Years | 6 (31.6%) | 2 (2.2%) |
| 75 Years and over | 2 (25.0%) | 0 (0.0%) |
Technology Access in Gas
Computing Device Access in Gas
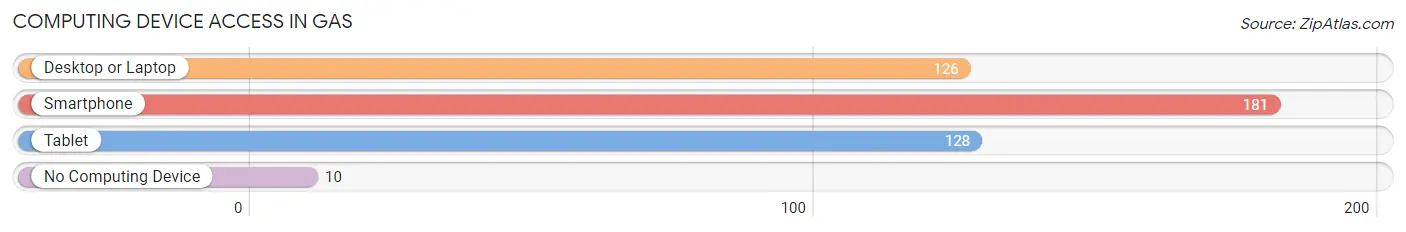
| Device Type | # Households | % Households |
| Desktop or Laptop | 126 | 65.3% |
| Smartphone | 181 | 93.8% |
| Tablet | 128 | 66.3% |
| No Computing Device | 10 | 5.2% |
| Total | 193 | 100.0% |
Internet Access in Gas
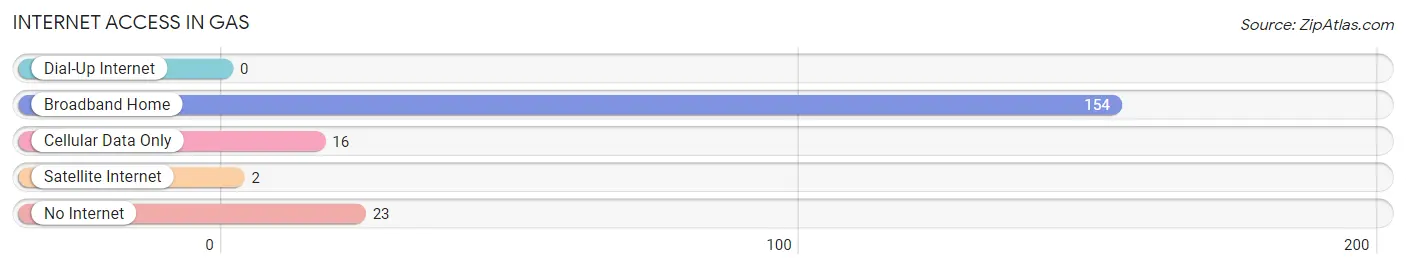
| Internet Type | # Households | % Households |
| Dial-Up Internet | 0 | 0.0% |
| Broadband Home | 154 | 79.8% |
| Cellular Data Only | 16 | 8.3% |
| Satellite Internet | 2 | 1.0% |
| No Internet | 23 | 11.9% |
| Total | 193 | 100.0% |
Gas Summary
Kansas is a state located in the Midwestern United States. It is bordered by Nebraska to the north, Missouri to the east, Oklahoma to the south, and Colorado to the west. Kansas is the 15th most populous state in the United States, with an estimated population of 2,913,314 in 2019.
History
The area now known as Kansas was first inhabited by Native American tribes, including the Kansa, Osage, Pawnee, and Wichita. The first European to explore the area was the Spanish explorer Francisco Vásquez de Coronado, who arrived in 1541. The area was part of the Louisiana Purchase in 1803, and became part of the United States in 1854 when it was admitted to the Union as a free state.
During the American Civil War, Kansas was a major battleground between pro-slavery and anti-slavery forces. The state was the site of several battles, including the Battle of Mine Creek and the Battle of Marais des Cygnes. After the war, Kansas became a major center of agriculture and industry.
Geography
Kansas is located in the Midwestern United States, and is bordered by Nebraska to the north, Missouri to the east, Oklahoma to the south, and Colorado to the west. The state has an area of 82,278 square miles, making it the 15th largest state in the country.
The geography of Kansas is diverse, with the eastern part of the state being mostly flat and the western part being more hilly and mountainous. The state is divided into 105 counties, and is home to several major rivers, including the Kansas, Arkansas, and Missouri.
Economy
The economy of Kansas is largely based on agriculture, with the state being a major producer of wheat, corn, sorghum, and soybeans. The state is also a major producer of beef, pork, and dairy products.
In addition to agriculture, Kansas is home to several major industries, including aerospace, biotechnology, and manufacturing. The state is also home to several major companies, including Sprint, Garmin, and Koch Industries.
Demographics
As of 2019, the population of Kansas was estimated to be 2,913,314. The state has a population density of 35.3 people per square mile, making it the 33rd most densely populated state in the country.
The racial makeup of Kansas is 87.2% White, 6.3% Black or African American, 1.7% Asian, 0.2% Native American, and 4.6% from other races. The state also has a large Hispanic or Latino population, making up 11.2% of the population.
The median household income in Kansas is $56,422, and the median home value is $153,400. The state has a poverty rate of 11.3%, and the unemployment rate is 3.3%.
Common Questions
What is Per Capita Income in Gas?
Per Capita income in Gas is $25,278.
What is the Median Family Income in Gas?
Median Family Income in Gas is $66,184.
What is the Median Household income in Gas?
Median Household Income in Gas is $58,750.
What is Income or Wage Gap in Gas?
Income or Wage Gap in Gas is 48.9%.
Women in Gas earn 51.1 cents for every dollar earned by a man.
What is Inequality or Gini Index in Gas?
Inequality or Gini Index in Gas is 0.26.
What is the Total Population of Gas?
Total Population of Gas is 532.
What is the Total Male Population of Gas?
Total Male Population of Gas is 296.
What is the Total Female Population of Gas?
Total Female Population of Gas is 236.
What is the Ratio of Males per 100 Females in Gas?
There are 125.42 Males per 100 Females in Gas.
What is the Ratio of Females per 100 Males in Gas?
There are 79.73 Females per 100 Males in Gas.
What is the Median Population Age in Gas?
Median Population Age in Gas is 45.0 Years.
What is the Average Family Size in Gas
Average Family Size in Gas is 3.7 People.
What is the Average Household Size in Gas
Average Household Size in Gas is 2.8 People.
How Large is the Labor Force in Gas?
There are 292 People in the Labor Forcein in Gas.
What is the Percentage of People in the Labor Force in Gas?
65.5% of People are in the Labor Force in Gas.
What is the Unemployment Rate in Gas?
Unemployment Rate in Gas is 2.7%.