Feather Sound, FL Map & Demographics
Feather Sound Map
Feather Sound Overview
$67,296
PER CAPITA INCOME
$113,523
AVG FAMILY INCOME
$93,273
AVG HOUSEHOLD INCOME
9.1%
WAGE / INCOME GAP [ % ]
90.9¢/ $1
WAGE / INCOME GAP [ $ ]
$8,215
FAMILY INCOME DEFICIT
0.46
INEQUALITY / GINI INDEX
3,289
TOTAL POPULATION
1,733
MALE POPULATION
1,556
FEMALE POPULATION
111.38
MALES / 100 FEMALES
89.79
FEMALES / 100 MALES
48.5
MEDIAN AGE
2.5
AVG FAMILY SIZE
2.0
AVG HOUSEHOLD SIZE
2,126
LABOR FORCE [ PEOPLE ]
71.5%
PERCENT IN LABOR FORCE
4.1%
UNEMPLOYMENT RATE
Income in Feather Sound
Income Overview in Feather Sound
Per Capita Income in Feather Sound is $67,296, while median incomes of families and households are $113,523 and $93,273 respectively.
| Characteristic | Number | Measure |
| Per Capita Income | 3,289 | $67,296 |
| Median Family Income | 897 | $113,523 |
| Mean Family Income | 897 | $166,284 |
| Median Household Income | 1,668 | $93,273 |
| Mean Household Income | 1,668 | $130,502 |
| Income Deficit | 897 | $8,215 |
| Wage / Income Gap (%) | 3,289 | 9.13% |
| Wage / Income Gap ($) | 3,289 | 90.87¢ per $1 |
| Gini / Inequality Index | 3,289 | 0.46 |
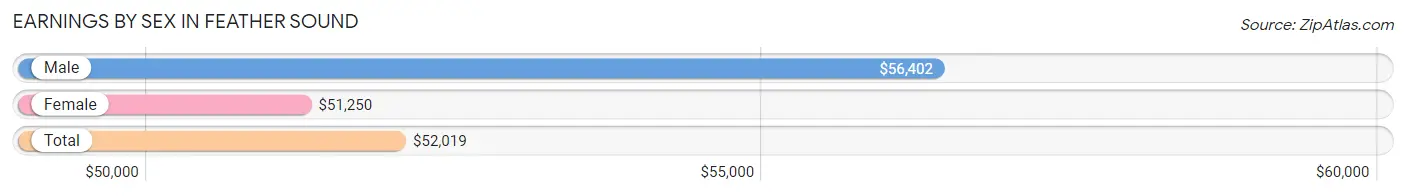
Earnings by Sex in Feather Sound
Average Earnings in Feather Sound are $52,019, $56,402 for men and $51,250 for women, a difference of 9.1%.
| Sex | Number | Average Earnings |
| Male | 1,145 (51.4%) | $56,402 |
| Female | 1,082 (48.6%) | $51,250 |
| Total | 2,227 (100.0%) | $52,019 |
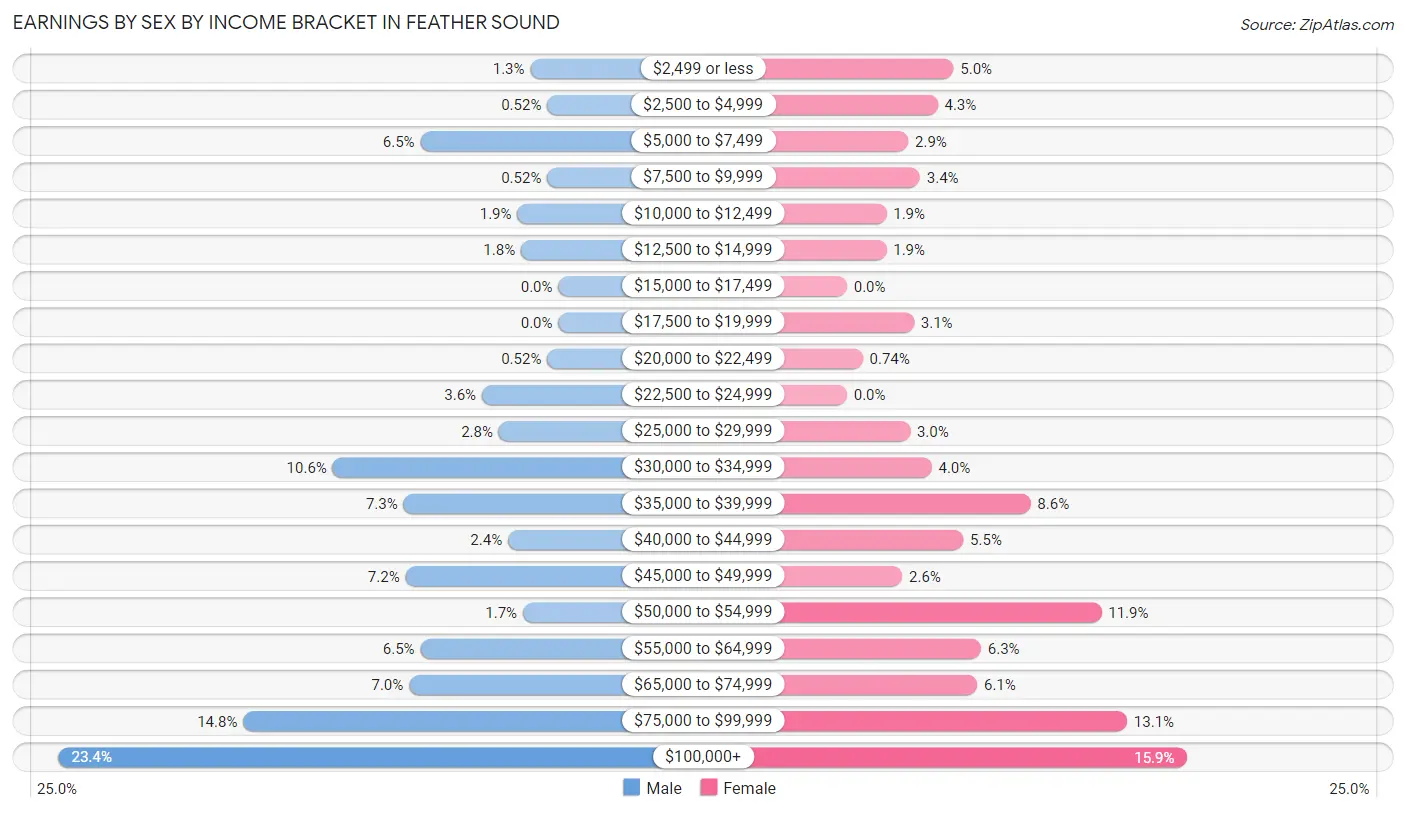
Earnings by Sex by Income Bracket in Feather Sound
The most common earnings brackets in Feather Sound are $100,000+ for men (268 | 23.4%) and $100,000+ for women (172 | 15.9%).
| Income | Male | Female |
| $2,499 or less | 15 (1.3%) | 54 (5.0%) |
| $2,500 to $4,999 | 6 (0.5%) | 46 (4.3%) |
| $5,000 to $7,499 | 74 (6.5%) | 31 (2.9%) |
| $7,500 to $9,999 | 6 (0.5%) | 37 (3.4%) |
| $10,000 to $12,499 | 22 (1.9%) | 20 (1.8%) |
| $12,500 to $14,999 | 20 (1.8%) | 20 (1.8%) |
| $15,000 to $17,499 | 0 (0.0%) | 0 (0.0%) |
| $17,500 to $19,999 | 0 (0.0%) | 34 (3.1%) |
| $20,000 to $22,499 | 6 (0.5%) | 8 (0.7%) |
| $22,500 to $24,999 | 41 (3.6%) | 0 (0.0%) |
| $25,000 to $29,999 | 32 (2.8%) | 32 (3.0%) |
| $30,000 to $34,999 | 121 (10.6%) | 43 (4.0%) |
| $35,000 to $39,999 | 83 (7.2%) | 93 (8.6%) |
| $40,000 to $44,999 | 27 (2.4%) | 59 (5.4%) |
| $45,000 to $49,999 | 82 (7.2%) | 28 (2.6%) |
| $50,000 to $54,999 | 19 (1.7%) | 129 (11.9%) |
| $55,000 to $64,999 | 74 (6.5%) | 68 (6.3%) |
| $65,000 to $74,999 | 80 (7.0%) | 66 (6.1%) |
| $75,000 to $99,999 | 169 (14.8%) | 142 (13.1%) |
| $100,000+ | 268 (23.4%) | 172 (15.9%) |
| Total | 1,145 (100.0%) | 1,082 (100.0%) |
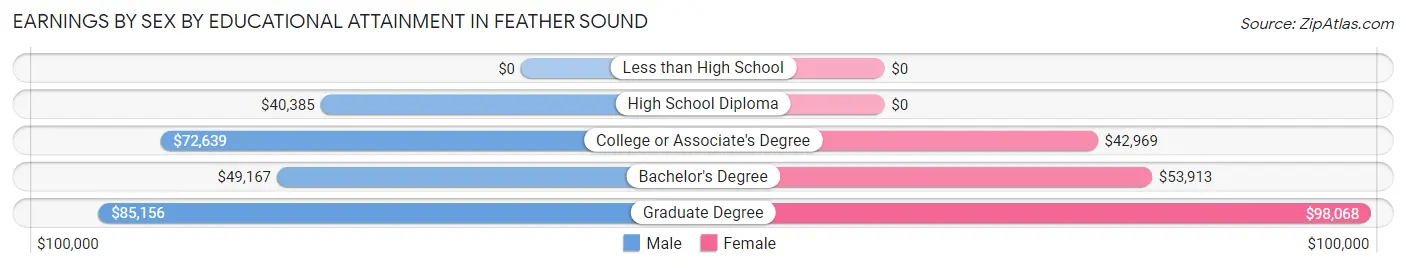
Earnings by Sex by Educational Attainment in Feather Sound
Average earnings in Feather Sound are $61,500 for men and $52,719 for women, a difference of 14.3%. Men with an educational attainment of graduate degree enjoy the highest average annual earnings of $85,156, while those with high school diploma education earn the least with $40,385. Women with an educational attainment of graduate degree earn the most with the average annual earnings of $98,068, while those with college or associate's degree education have the smallest earnings of $42,969.
| Educational Attainment | Male Income | Female Income |
| Less than High School | - | - |
| High School Diploma | $40,385 | $0 |
| College or Associate's Degree | $72,639 | $42,969 |
| Bachelor's Degree | $49,167 | $53,913 |
| Graduate Degree | $85,156 | $98,068 |
| Total | $61,500 | $52,719 |
Family Income in Feather Sound
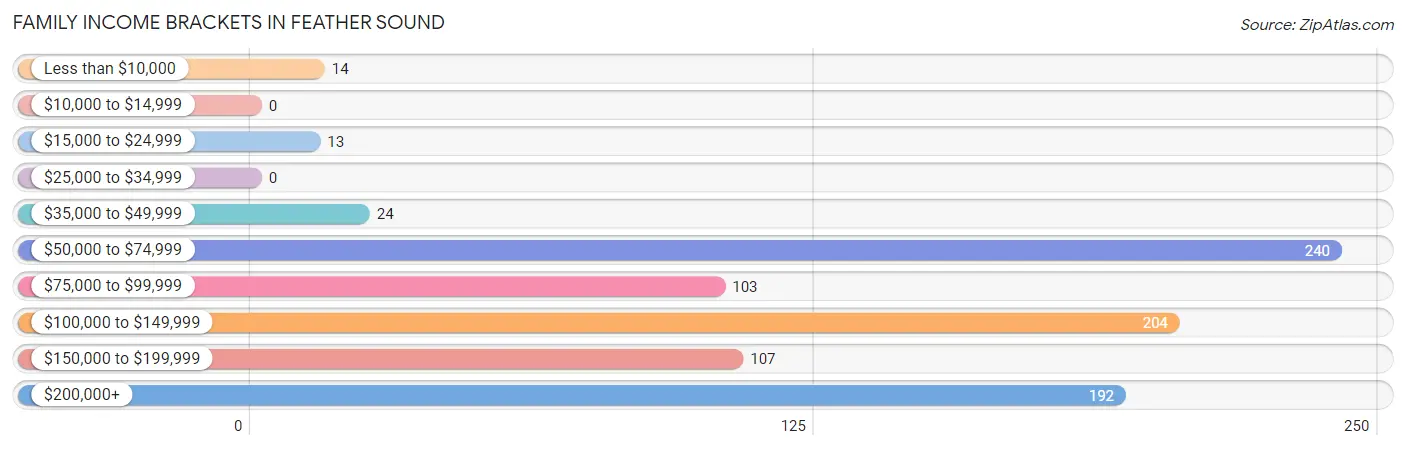
Family Income Brackets in Feather Sound
According to the Feather Sound family income data, there are 240 families falling into the $50,000 to $74,999 income range, which is the most common income bracket and makes up 26.8% of all families.
| Income Bracket | # Families | % Families |
| Less than $10,000 | 14 | 1.6% |
| $10,000 to $14,999 | 0 | 0.0% |
| $15,000 to $24,999 | 13 | 1.4% |
| $25,000 to $34,999 | 0 | 0.0% |
| $35,000 to $49,999 | 24 | 2.7% |
| $50,000 to $74,999 | 240 | 26.8% |
| $75,000 to $99,999 | 103 | 11.5% |
| $100,000 to $149,999 | 204 | 22.7% |
| $150,000 to $199,999 | 107 | 11.9% |
| $200,000+ | 192 | 21.4% |
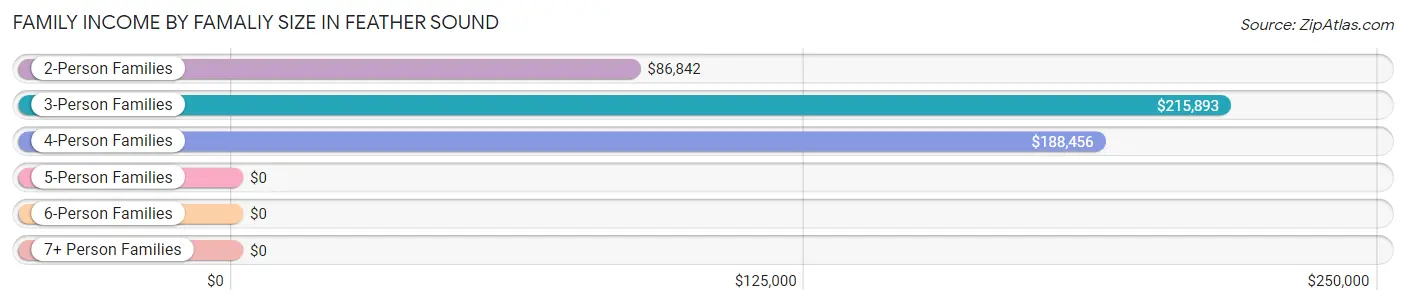
Family Income by Famaliy Size in Feather Sound
3-person families (163 | 18.2%) account for the highest median family income in Feather Sound with $215,893 per family, while 3-person families (163 | 18.2%) have the highest median income of $71,964 per family member.
| Income Bracket | # Families | Median Income |
| 2-Person Families | 648 (72.2%) | $86,842 |
| 3-Person Families | 163 (18.2%) | $215,893 |
| 4-Person Families | 69 (7.7%) | $188,456 |
| 5-Person Families | 17 (1.9%) | $0 |
| 6-Person Families | 0 (0.0%) | $0 |
| 7+ Person Families | 0 (0.0%) | $0 |
| Total | 897 (100.0%) | $113,523 |
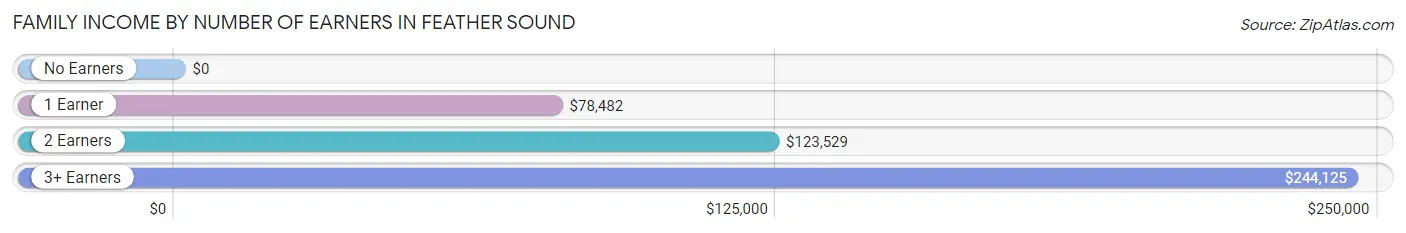
Family Income by Number of Earners in Feather Sound
| Number of Earners | # Families | Median Income |
| No Earners | 119 (13.3%) | $0 |
| 1 Earner | 325 (36.2%) | $78,482 |
| 2 Earners | 364 (40.6%) | $123,529 |
| 3+ Earners | 89 (9.9%) | $244,125 |
| Total | 897 (100.0%) | $113,523 |
Household Income in Feather Sound
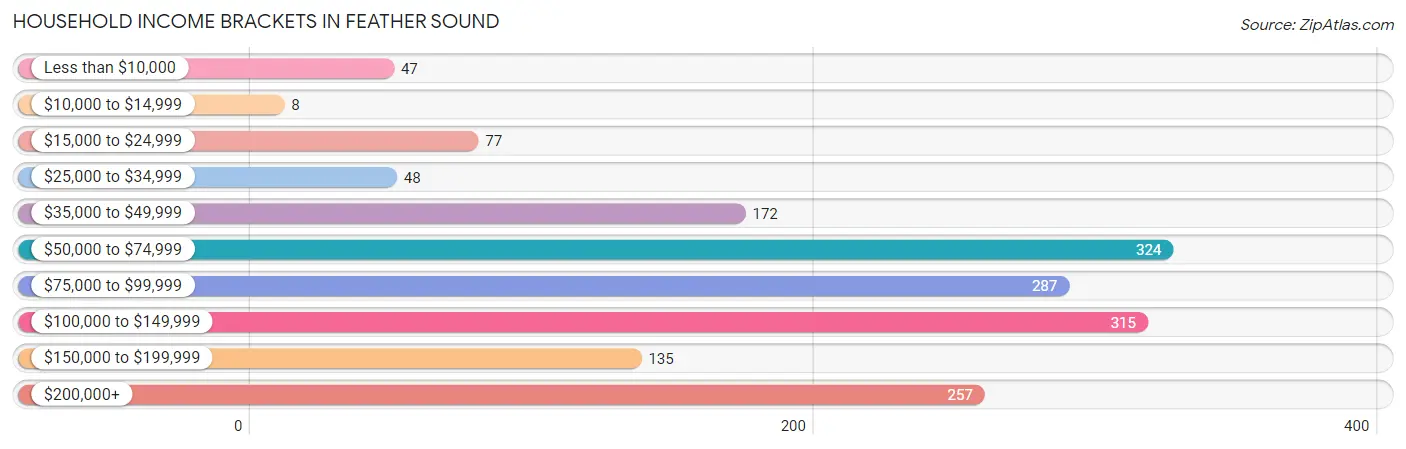
Household Income Brackets in Feather Sound
With 324 households falling in the category, the $50,000 to $74,999 income range is the most frequent in Feather Sound, accounting for 19.4% of all households. In contrast, only 8 households (0.5%) fall into the $10,000 to $14,999 income bracket, making it the least populous group.
| Income Bracket | # Households | % Households |
| Less than $10,000 | 47 | 2.8% |
| $10,000 to $14,999 | 8 | 0.5% |
| $15,000 to $24,999 | 77 | 4.6% |
| $25,000 to $34,999 | 48 | 2.9% |
| $35,000 to $49,999 | 172 | 10.3% |
| $50,000 to $74,999 | 324 | 19.4% |
| $75,000 to $99,999 | 287 | 17.2% |
| $100,000 to $149,999 | 315 | 18.9% |
| $150,000 to $199,999 | 135 | 8.1% |
| $200,000+ | 257 | 15.4% |
Household Income by Householder Age in Feather Sound
The median household income in Feather Sound is $93,273, with the highest median household income of $96,719 found in the 45 to 64 years age bracket for the primary householder. A total of 727 households (43.6%) fall into this category. Meanwhile, the 15 to 24 years age bracket for the primary householder has the lowest median household income of $0, with 15 households (0.9%) in this group.
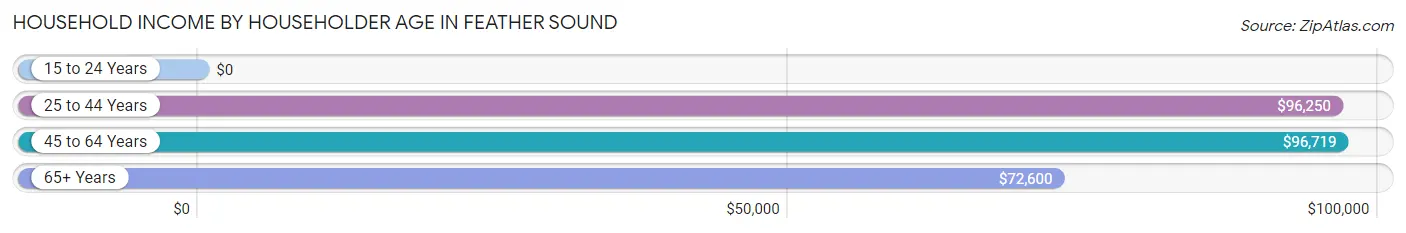
| Income Bracket | # Households | Median Income |
| 15 to 24 Years | 15 (0.9%) | $0 |
| 25 to 44 Years | 458 (27.5%) | $96,250 |
| 45 to 64 Years | 727 (43.6%) | $96,719 |
| 65+ Years | 468 (28.1%) | $72,600 |
| Total | 1,668 (100.0%) | $93,273 |
Poverty in Feather Sound
Income Below Poverty by Sex and Age in Feather Sound
With 7.4% poverty level for males and 4.2% for females among the residents of Feather Sound, 45 to 54 year old males and 15 year old females are the most vulnerable to poverty, with 40 males (20.8%) and 8 females (100.0%) in their respective age groups living below the poverty level.
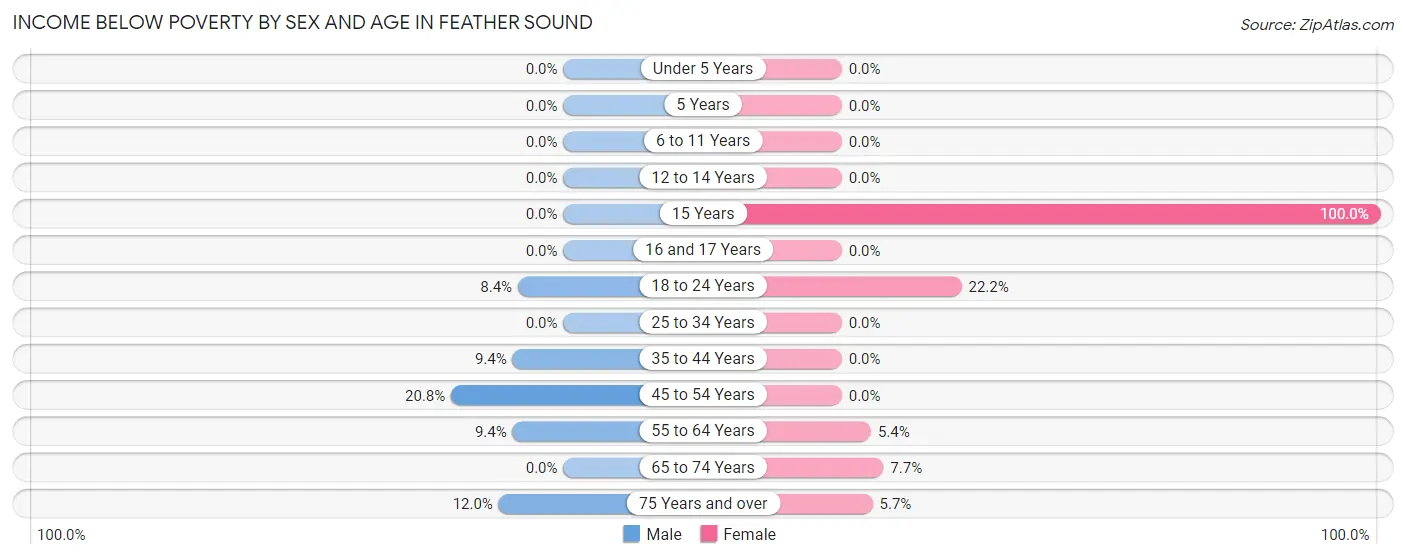
| Age Bracket | Male | Female |
| Under 5 Years | 0 (0.0%) | 0 (0.0%) |
| 5 Years | 0 (0.0%) | 0 (0.0%) |
| 6 to 11 Years | 0 (0.0%) | 0 (0.0%) |
| 12 to 14 Years | 0 (0.0%) | 0 (0.0%) |
| 15 Years | 0 (0.0%) | 8 (100.0%) |
| 16 and 17 Years | 0 (0.0%) | 0 (0.0%) |
| 18 to 24 Years | 7 (8.4%) | 10 (22.2%) |
| 25 to 34 Years | 0 (0.0%) | 0 (0.0%) |
| 35 to 44 Years | 33 (9.4%) | 0 (0.0%) |
| 45 to 54 Years | 40 (20.8%) | 0 (0.0%) |
| 55 to 64 Years | 28 (9.4%) | 20 (5.4%) |
| 65 to 74 Years | 0 (0.0%) | 20 (7.7%) |
| 75 Years and over | 21 (12.0%) | 8 (5.7%) |
| Total | 129 (7.4%) | 66 (4.2%) |
Income Above Poverty by Sex and Age in Feather Sound
According to the poverty statistics in Feather Sound, males aged under 5 years and females aged under 5 years are the age groups that are most secure financially, with 100.0% of males and 100.0% of females in these age groups living above the poverty line.
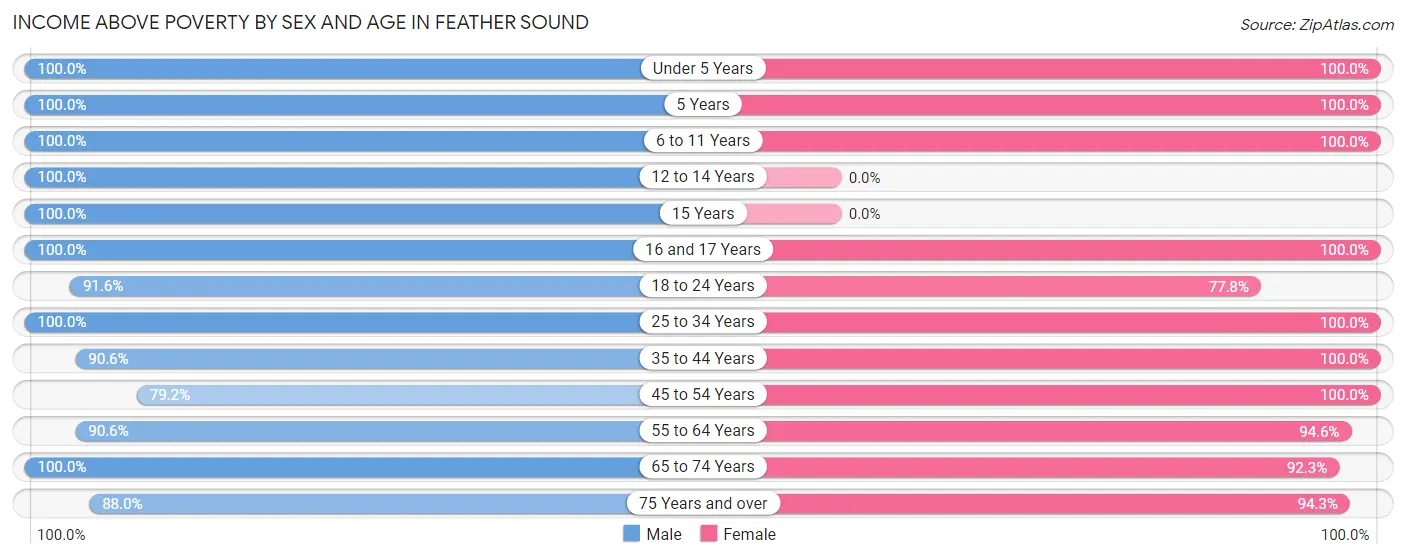
| Age Bracket | Male | Female |
| Under 5 Years | 64 (100.0%) | 19 (100.0%) |
| 5 Years | 11 (100.0%) | 10 (100.0%) |
| 6 to 11 Years | 48 (100.0%) | 32 (100.0%) |
| 12 to 14 Years | 87 (100.0%) | 0 (0.0%) |
| 15 Years | 37 (100.0%) | 0 (0.0%) |
| 16 and 17 Years | 25 (100.0%) | 48 (100.0%) |
| 18 to 24 Years | 76 (91.6%) | 35 (77.8%) |
| 25 to 34 Years | 216 (100.0%) | 203 (100.0%) |
| 35 to 44 Years | 317 (90.6%) | 182 (100.0%) |
| 45 to 54 Years | 152 (79.2%) | 240 (100.0%) |
| 55 to 64 Years | 269 (90.6%) | 350 (94.6%) |
| 65 to 74 Years | 148 (100.0%) | 239 (92.3%) |
| 75 Years and over | 154 (88.0%) | 132 (94.3%) |
| Total | 1,604 (92.6%) | 1,490 (95.8%) |
Income Below Poverty Among Married-Couple Families in Feather Sound
The poverty statistics for married-couple families in Feather Sound show that 4.1% or 27 of the total 662 families live below the poverty line. Families with no children have the highest poverty rate of 5.9%, comprising of 27 families. On the other hand, families with 1 or 2 children have the lowest poverty rate of 0.0%, which includes 0 families.
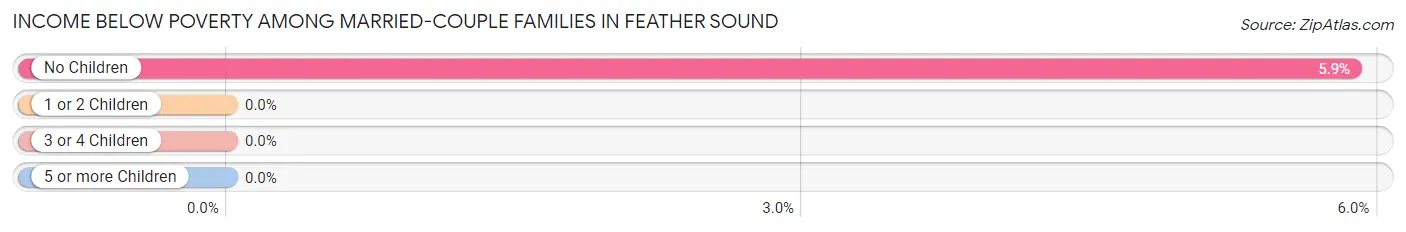
| Children | Above Poverty | Below Poverty |
| No Children | 433 (94.1%) | 27 (5.9%) |
| 1 or 2 Children | 185 (100.0%) | 0 (0.0%) |
| 3 or 4 Children | 17 (100.0%) | 0 (0.0%) |
| 5 or more Children | 0 (0.0%) | 0 (0.0%) |
| Total | 635 (95.9%) | 27 (4.1%) |
Income Below Poverty Among Single-Parent Households in Feather Sound
| Children | Single Father | Single Mother |
| No Children | 0 (0.0%) | 0 (0.0%) |
| 1 or 2 Children | 0 (0.0%) | 0 (0.0%) |
| 3 or 4 Children | 0 (0.0%) | 0 (0.0%) |
| 5 or more Children | 0 (0.0%) | 0 (0.0%) |
| Total | 0 (0.0%) | 0 (0.0%) |
Income Below Poverty Among Married-Couple vs Single-Parent Households in Feather Sound
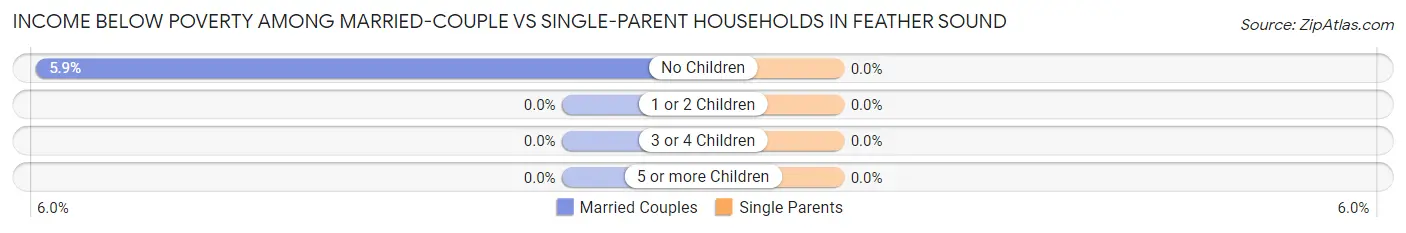
| Children | Married-Couple Families | Single-Parent Households |
| No Children | 27 (5.9%) | 0 (0.0%) |
| 1 or 2 Children | 0 (0.0%) | 0 (0.0%) |
| 3 or 4 Children | 0 (0.0%) | 0 (0.0%) |
| 5 or more Children | 0 (0.0%) | 0 (0.0%) |
| Total | 27 (4.1%) | 0 (0.0%) |
Race in Feather Sound
The most populous races in Feather Sound are White / Caucasian (2,715 | 82.6%), Hispanic or Latino (275 | 8.4%), and Two or more Races (210 | 6.4%).
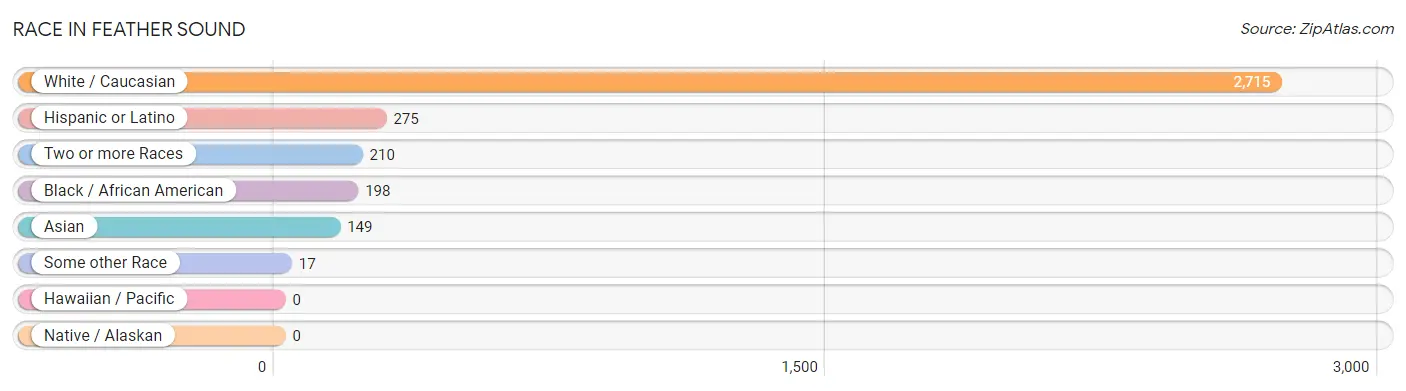
| Race | # Population | % Population |
| Asian | 149 | 4.5% |
| Black / African American | 198 | 6.0% |
| Hawaiian / Pacific | 0 | 0.0% |
| Hispanic or Latino | 275 | 8.4% |
| Native / Alaskan | 0 | 0.0% |
| White / Caucasian | 2,715 | 82.6% |
| Two or more Races | 210 | 6.4% |
| Some other Race | 17 | 0.5% |
| Total | 3,289 | 100.0% |
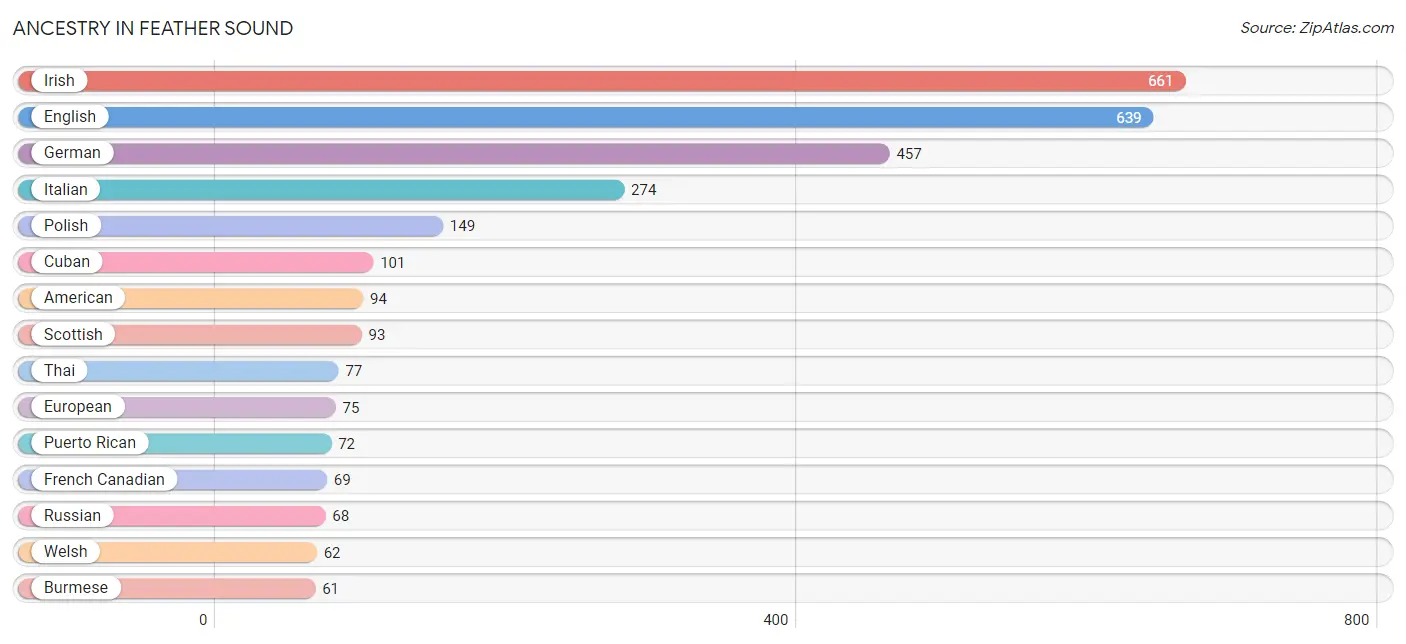
Ancestry in Feather Sound
The most populous ancestries reported in Feather Sound are Irish (661 | 20.1%), English (639 | 19.4%), German (457 | 13.9%), Italian (274 | 8.3%), and Polish (149 | 4.5%), together accounting for 66.3% of all Feather Sound residents.
| Ancestry | # Population | % Population |
| African | 20 | 0.6% |
| American | 94 | 2.9% |
| Arab | 8 | 0.2% |
| Austrian | 10 | 0.3% |
| Basque | 11 | 0.3% |
| British | 7 | 0.2% |
| Burmese | 61 | 1.8% |
| Central American | 16 | 0.5% |
| Cherokee | 20 | 0.6% |
| Colombian | 6 | 0.2% |
| Croatian | 32 | 1.0% |
| Cuban | 101 | 3.1% |
| Czech | 48 | 1.5% |
| Czechoslovakian | 6 | 0.2% |
| Danish | 31 | 0.9% |
| Dutch | 46 | 1.4% |
| Ecuadorian | 11 | 0.3% |
| English | 639 | 19.4% |
| Estonian | 7 | 0.2% |
| European | 75 | 2.3% |
| Finnish | 17 | 0.5% |
| French | 39 | 1.2% |
| French Canadian | 69 | 2.1% |
| German | 457 | 13.9% |
| Greek | 25 | 0.8% |
| Guatemalan | 9 | 0.3% |
| Indian (Asian) | 25 | 0.8% |
| Irish | 661 | 20.1% |
| Italian | 274 | 8.3% |
| Lithuanian | 33 | 1.0% |
| Native Hawaiian | 9 | 0.3% |
| Nigerian | 8 | 0.2% |
| Norwegian | 61 | 1.8% |
| Panamanian | 7 | 0.2% |
| Peruvian | 12 | 0.4% |
| Polish | 149 | 4.5% |
| Puerto Rican | 72 | 2.2% |
| Romanian | 12 | 0.4% |
| Russian | 68 | 2.1% |
| Scandinavian | 18 | 0.5% |
| Scotch-Irish | 22 | 0.7% |
| Scottish | 93 | 2.8% |
| South American | 41 | 1.3% |
| Sri Lankan | 10 | 0.3% |
| Subsaharan African | 28 | 0.9% |
| Swedish | 32 | 1.0% |
| Thai | 77 | 2.3% |
| Ukrainian | 37 | 1.1% |
| Venezuelan | 12 | 0.4% |
| Welsh | 62 | 1.9% |
| Yugoslavian | 24 | 0.7% | View All 51 Rows |
Immigrants in Feather Sound
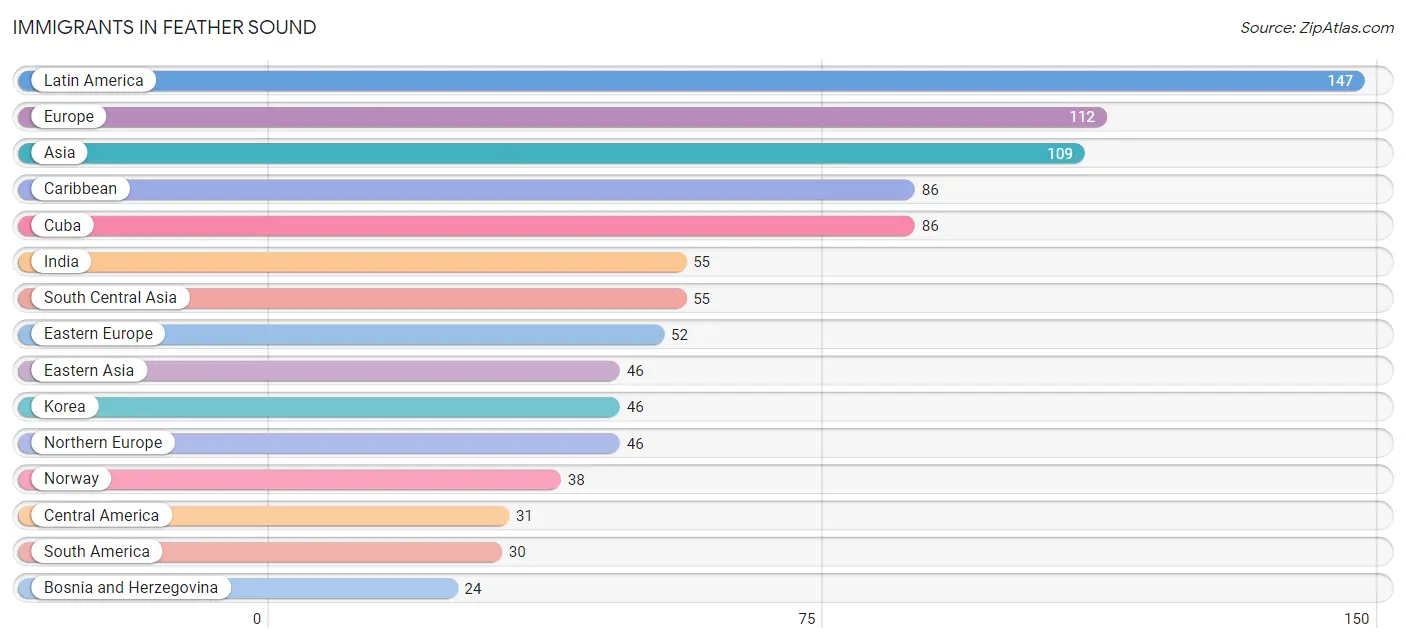
The most numerous immigrant groups reported in Feather Sound came from Latin America (147 | 4.5%), Europe (112 | 3.4%), Asia (109 | 3.3%), Caribbean (86 | 2.6%), and Cuba (86 | 2.6%), together accounting for 16.4% of all Feather Sound residents.
| Immigration Origin | # Population | % Population |
| Asia | 109 | 3.3% |
| Bosnia and Herzegovina | 24 | 0.7% |
| Canada | 7 | 0.2% |
| Caribbean | 86 | 2.6% |
| Central America | 31 | 0.9% |
| Colombia | 6 | 0.2% |
| Costa Rica | 15 | 0.5% |
| Cuba | 86 | 2.6% |
| Eastern Asia | 46 | 1.4% |
| Eastern Europe | 52 | 1.6% |
| England | 8 | 0.2% |
| Europe | 112 | 3.4% |
| Germany | 7 | 0.2% |
| Guatemala | 9 | 0.3% |
| India | 55 | 1.7% |
| Korea | 46 | 1.4% |
| Latin America | 147 | 4.5% |
| Lebanon | 8 | 0.2% |
| Netherlands | 7 | 0.2% |
| Northern Europe | 46 | 1.4% |
| Norway | 38 | 1.2% |
| Panama | 7 | 0.2% |
| Peru | 12 | 0.4% |
| Romania | 12 | 0.4% |
| South America | 30 | 0.9% |
| South Central Asia | 55 | 1.7% |
| Ukraine | 8 | 0.2% |
| Venezuela | 12 | 0.4% |
| Western Asia | 8 | 0.2% |
| Western Europe | 14 | 0.4% | View All 30 Rows |
Sex and Age in Feather Sound
Sex and Age in Feather Sound
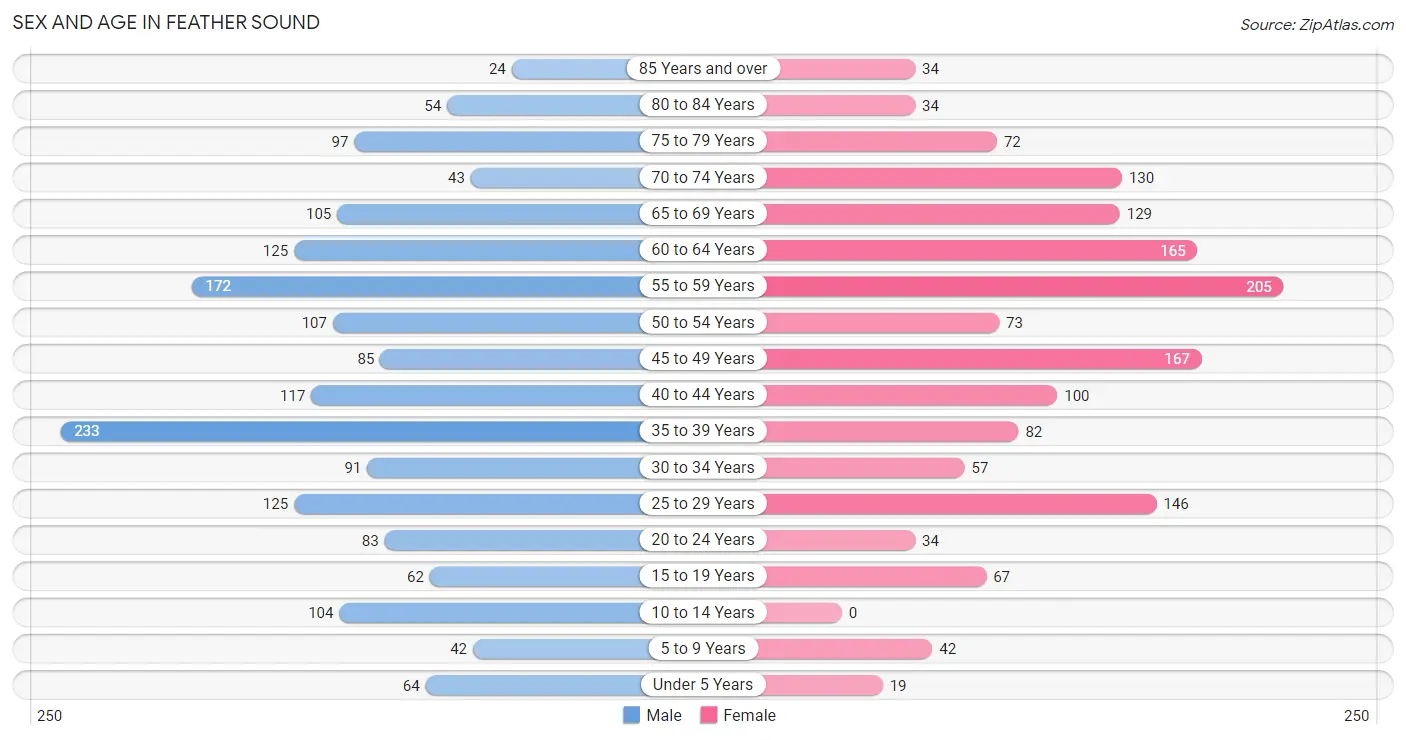
The most populous age groups in Feather Sound are 35 to 39 Years (233 | 13.4%) for men and 55 to 59 Years (205 | 13.2%) for women.
| Age Bracket | Male | Female |
| Under 5 Years | 64 (3.7%) | 19 (1.2%) |
| 5 to 9 Years | 42 (2.4%) | 42 (2.7%) |
| 10 to 14 Years | 104 (6.0%) | 0 (0.0%) |
| 15 to 19 Years | 62 (3.6%) | 67 (4.3%) |
| 20 to 24 Years | 83 (4.8%) | 34 (2.2%) |
| 25 to 29 Years | 125 (7.2%) | 146 (9.4%) |
| 30 to 34 Years | 91 (5.2%) | 57 (3.7%) |
| 35 to 39 Years | 233 (13.4%) | 82 (5.3%) |
| 40 to 44 Years | 117 (6.8%) | 100 (6.4%) |
| 45 to 49 Years | 85 (4.9%) | 167 (10.7%) |
| 50 to 54 Years | 107 (6.2%) | 73 (4.7%) |
| 55 to 59 Years | 172 (9.9%) | 205 (13.2%) |
| 60 to 64 Years | 125 (7.2%) | 165 (10.6%) |
| 65 to 69 Years | 105 (6.1%) | 129 (8.3%) |
| 70 to 74 Years | 43 (2.5%) | 130 (8.4%) |
| 75 to 79 Years | 97 (5.6%) | 72 (4.6%) |
| 80 to 84 Years | 54 (3.1%) | 34 (2.2%) |
| 85 Years and over | 24 (1.4%) | 34 (2.2%) |
| Total | 1,733 (100.0%) | 1,556 (100.0%) |
Families and Households in Feather Sound
Median Family Size in Feather Sound
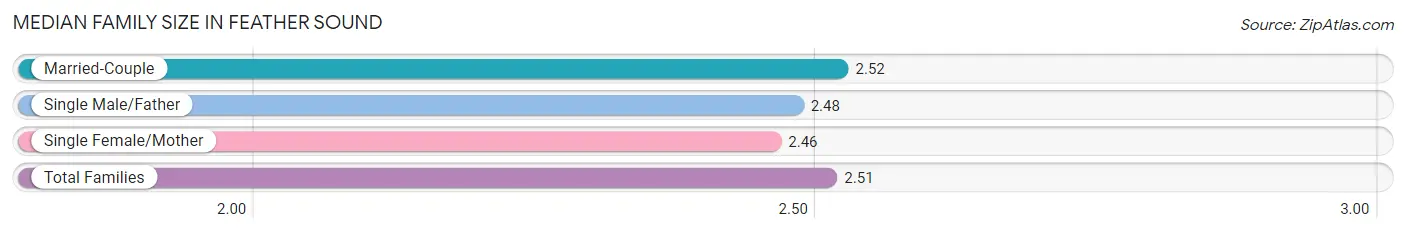
The median family size in Feather Sound is 2.51 persons per family, with married-couple families (662 | 73.8%) accounting for the largest median family size of 2.52 persons per family. On the other hand, single female/mother families (173 | 19.3%) represent the smallest median family size with 2.46 persons per family.
| Family Type | # Families | Family Size |
| Married-Couple | 662 (73.8%) | 2.52 |
| Single Male/Father | 62 (6.9%) | 2.48 |
| Single Female/Mother | 173 (19.3%) | 2.46 |
| Total Families | 897 (100.0%) | 2.51 |
Median Household Size in Feather Sound
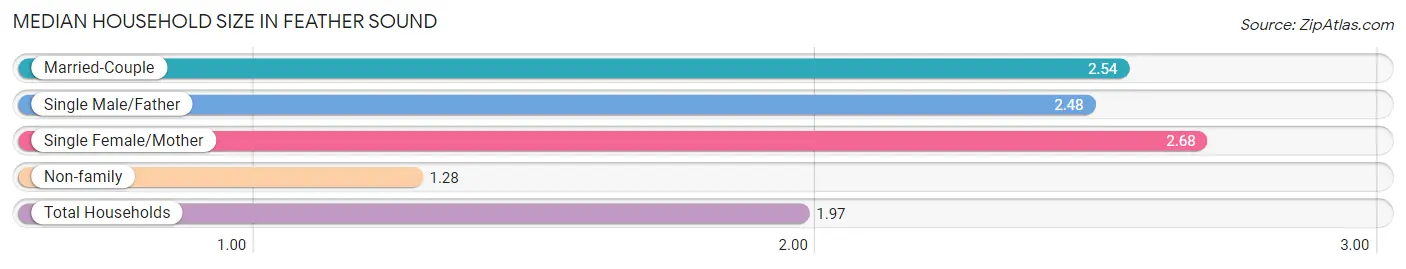
The median household size in Feather Sound is 1.97 persons per household, with single female/mother households (173 | 10.4%) accounting for the largest median household size of 2.68 persons per household. non-family households (771 | 46.2%) represent the smallest median household size with 1.28 persons per household.
| Household Type | # Households | Household Size |
| Married-Couple | 662 (39.7%) | 2.54 |
| Single Male/Father | 62 (3.7%) | 2.48 |
| Single Female/Mother | 173 (10.4%) | 2.68 |
| Non-family | 771 (46.2%) | 1.28 |
| Total Households | 1,668 (100.0%) | 1.97 |
Household Size by Marriage Status in Feather Sound
Out of a total of 1,668 households in Feather Sound, 897 (53.8%) are family households, while 771 (46.2%) are nonfamily households. The most numerous type of family households are 2-person households, comprising 604, and the most common type of nonfamily households are 1-person households, comprising 615.
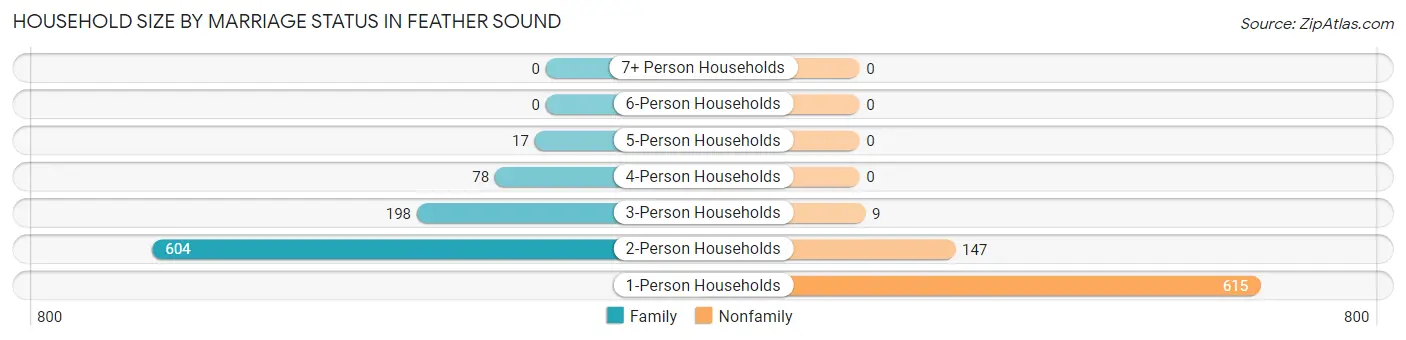
| Household Size | Family Households | Nonfamily Households |
| 1-Person Households | - | 615 (36.9%) |
| 2-Person Households | 604 (36.2%) | 147 (8.8%) |
| 3-Person Households | 198 (11.9%) | 9 (0.5%) |
| 4-Person Households | 78 (4.7%) | 0 (0.0%) |
| 5-Person Households | 17 (1.0%) | 0 (0.0%) |
| 6-Person Households | 0 (0.0%) | 0 (0.0%) |
| 7+ Person Households | 0 (0.0%) | 0 (0.0%) |
| Total | 897 (53.8%) | 771 (46.2%) |
Female Fertility in Feather Sound
Fertility by Age in Feather Sound
Average fertility rate in Feather Sound is 34.0 births per 1,000 women. Women in the age bracket of 35 to 50 years have the highest fertility rate with 40.0 births per 1,000 women. Women in the age bracket of 35 to 50 years acount for 65.2% of all women with births.
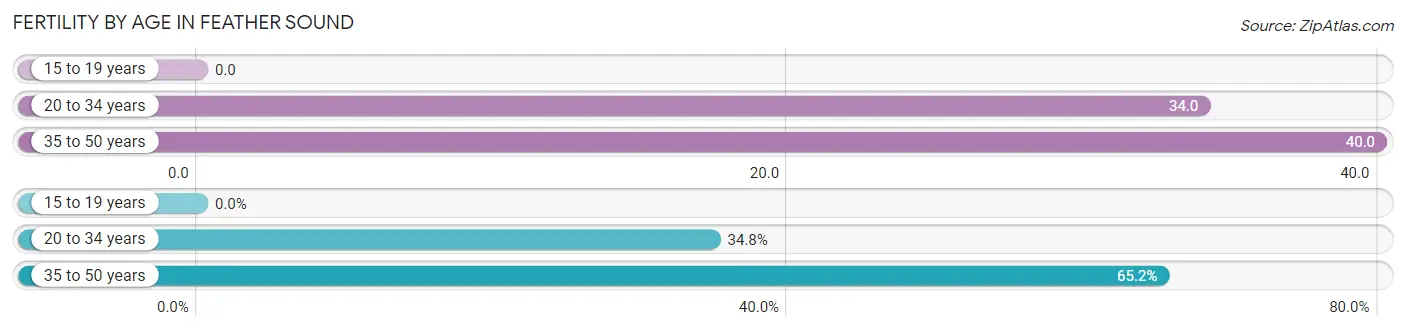
| Age Bracket | Women with Births | Births / 1,000 Women |
| 15 to 19 years | 0 (0.0%) | 0.0 |
| 20 to 34 years | 8 (34.8%) | 34.0 |
| 35 to 50 years | 15 (65.2%) | 40.0 |
| Total | 23 (100.0%) | 34.0 |
Fertility by Age by Marriage Status in Feather Sound
34.8% of women with births (23) in Feather Sound are married. The highest percentage of unmarried women with births falls into 35 to 50 years age bracket with 100.0% of them unmarried at the time of birth, while the lowest percentage of unmarried women with births belong to 20 to 34 years age bracket with 0.0% of them unmarried.
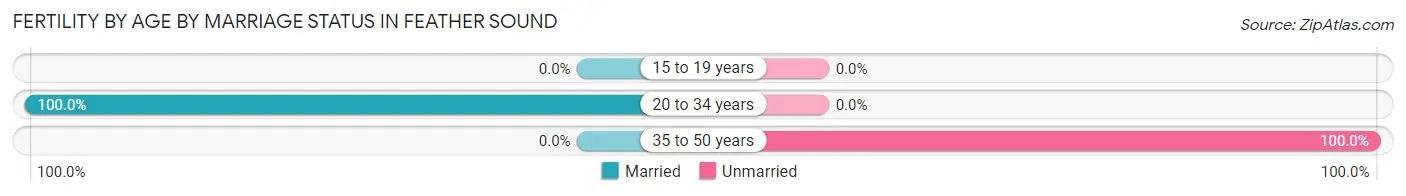
| Age Bracket | Married | Unmarried |
| 15 to 19 years | 0 (0.0%) | 0 (0.0%) |
| 20 to 34 years | 8 (100.0%) | 0 (0.0%) |
| 35 to 50 years | 0 (0.0%) | 15 (100.0%) |
| Total | 8 (34.8%) | 15 (65.2%) |
Fertility by Education in Feather Sound
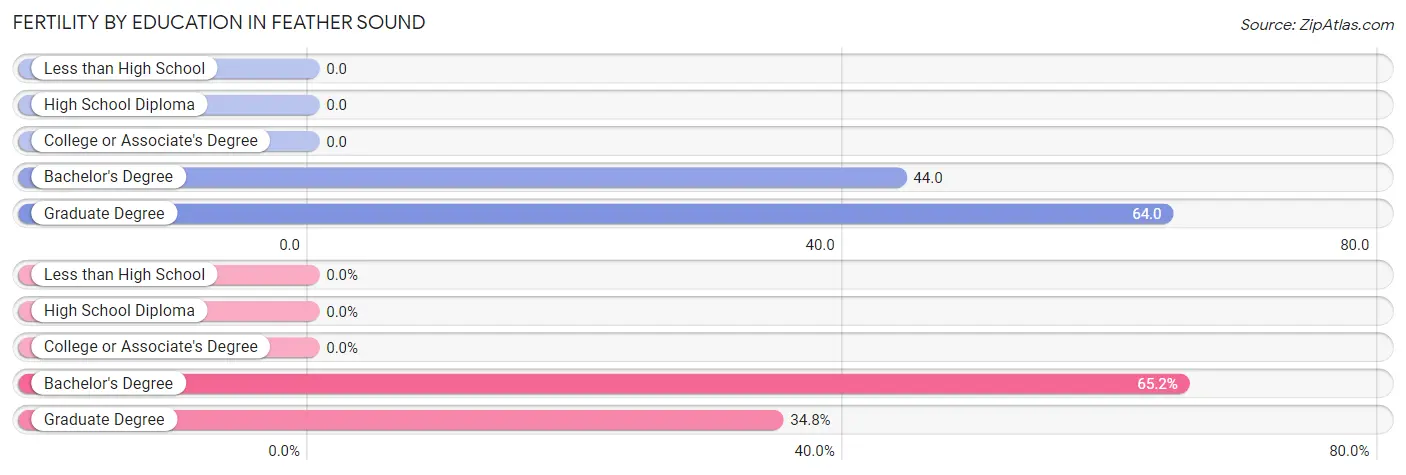
| Educational Attainment | Women with Births | Births / 1,000 Women |
| Less than High School | 0 (0.0%) | 0.0 |
| High School Diploma | 0 (0.0%) | 0.0 |
| College or Associate's Degree | 0 (0.0%) | 0.0 |
| Bachelor's Degree | 15 (65.2%) | 44.0 |
| Graduate Degree | 8 (34.8%) | 64.0 |
| Total | 23 (100.0%) | 34.0 |
Fertility by Education by Marriage Status in Feather Sound
65.2% of women with births in Feather Sound are unmarried. Women with the educational attainment of graduate degree are most likely to be married with 100.0% of them married at childbirth, while women with the educational attainment of bachelor's degree are least likely to be married with 100.0% of them unmarried at childbirth.
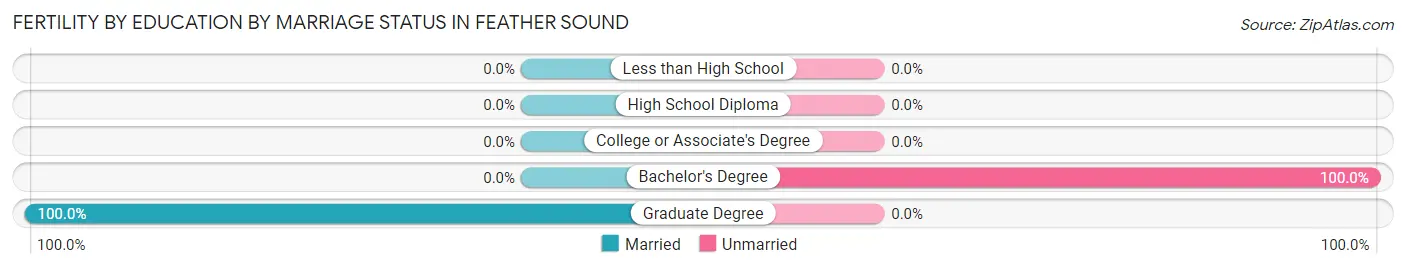
| Educational Attainment | Married | Unmarried |
| Less than High School | 0 (0.0%) | 0 (0.0%) |
| High School Diploma | 0 (0.0%) | 0 (0.0%) |
| College or Associate's Degree | 0 (0.0%) | 0 (0.0%) |
| Bachelor's Degree | 0 (0.0%) | 15 (100.0%) |
| Graduate Degree | 8 (100.0%) | 0 (0.0%) |
| Total | 8 (34.8%) | 15 (65.2%) |
Employment Characteristics in Feather Sound
Employment by Class of Employer in Feather Sound
Among the 2,027 employed individuals in Feather Sound, private company employees (1,530 | 75.5%), local government employees (137 | 6.8%), and self-employed (incorporated) (104 | 5.1%) make up the most common classes of employment.
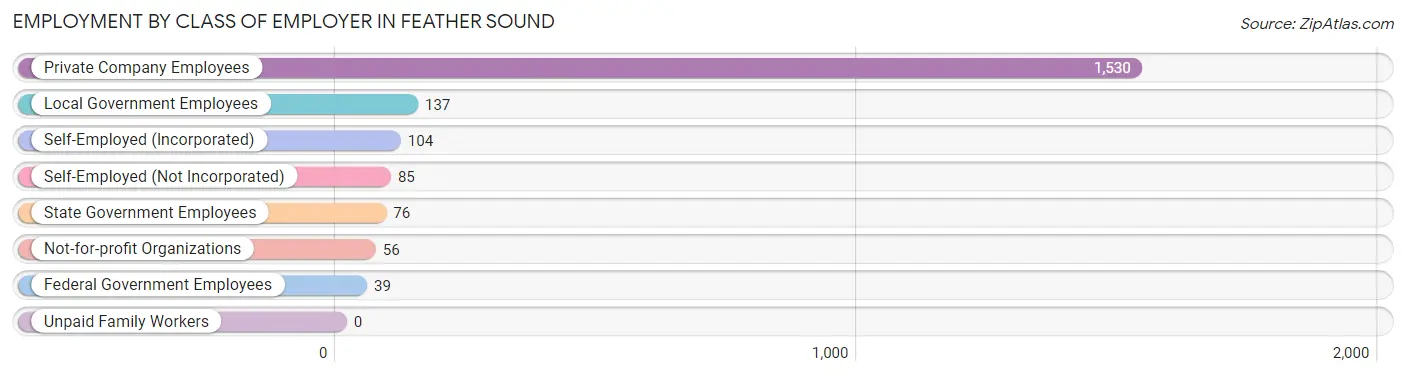
| Employer Class | # Employees | % Employees |
| Private Company Employees | 1,530 | 75.5% |
| Self-Employed (Incorporated) | 104 | 5.1% |
| Self-Employed (Not Incorporated) | 85 | 4.2% |
| Not-for-profit Organizations | 56 | 2.8% |
| Local Government Employees | 137 | 6.8% |
| State Government Employees | 76 | 3.7% |
| Federal Government Employees | 39 | 1.9% |
| Unpaid Family Workers | 0 | 0.0% |
| Total | 2,027 | 100.0% |
Employment Status by Age in Feather Sound
According to the labor force statistics for Feather Sound, out of the total population over 16 years of age (2,973), 71.5% or 2,126 individuals are in the labor force, with 4.1% or 87 of them unemployed. The age group with the highest labor force participation rate is 25 to 29 years, with 100.0% or 271 individuals in the labor force. Within the labor force, the 16 to 19 years age range has the highest percentage of unemployed individuals, with 25.6% or 11 of them being unemployed.
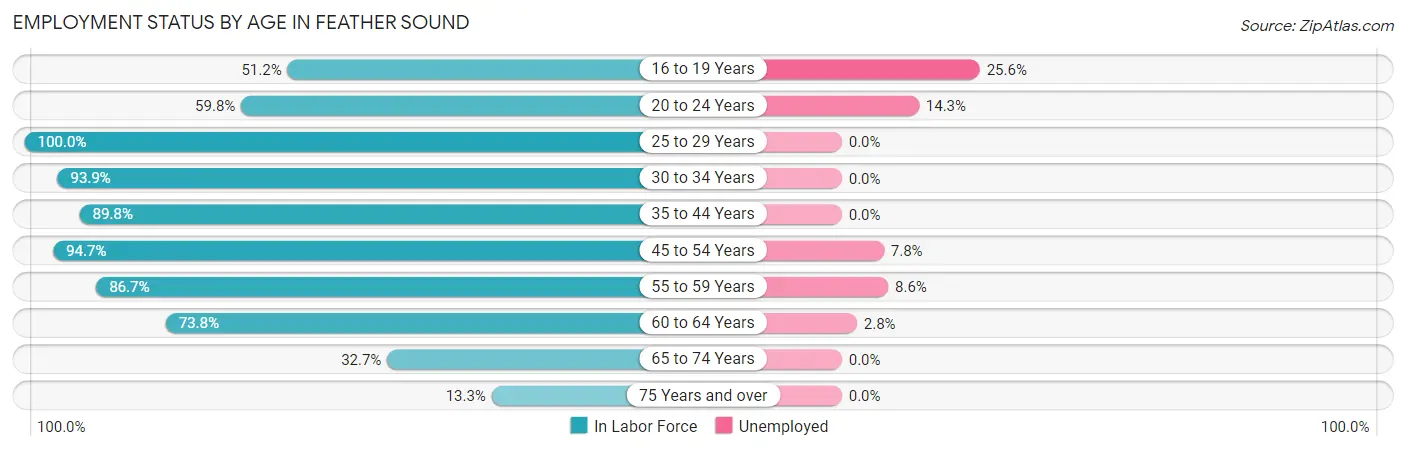
| Age Bracket | In Labor Force | Unemployed |
| 16 to 19 Years | 43 (51.2%) | 11 (25.6%) |
| 20 to 24 Years | 70 (59.8%) | 10 (14.3%) |
| 25 to 29 Years | 271 (100.0%) | 0 (0.0%) |
| 30 to 34 Years | 139 (93.9%) | 0 (0.0%) |
| 35 to 44 Years | 478 (89.8%) | 0 (0.0%) |
| 45 to 54 Years | 409 (94.7%) | 32 (7.8%) |
| 55 to 59 Years | 327 (86.7%) | 28 (8.6%) |
| 60 to 64 Years | 214 (73.8%) | 6 (2.8%) |
| 65 to 74 Years | 133 (32.7%) | 0 (0.0%) |
| 75 Years and over | 42 (13.3%) | 0 (0.0%) |
| Total | 2,126 (71.5%) | 87 (4.1%) |
Employment Status by Educational Attainment in Feather Sound
According to labor force statistics for Feather Sound, 89.7% of individuals (1,839) out of the total population between 25 and 64 years of age (2,050) are in the labor force, with 3.6% or 66 of them being unemployed. The group with the highest labor force participation rate are those with the educational attainment of bachelor's degree or higher, with 92.4% or 1,161 individuals in the labor force. Within the labor force, individuals with high school diploma education have the highest percentage of unemployment, with 5.5% or 10 of them being unemployed.
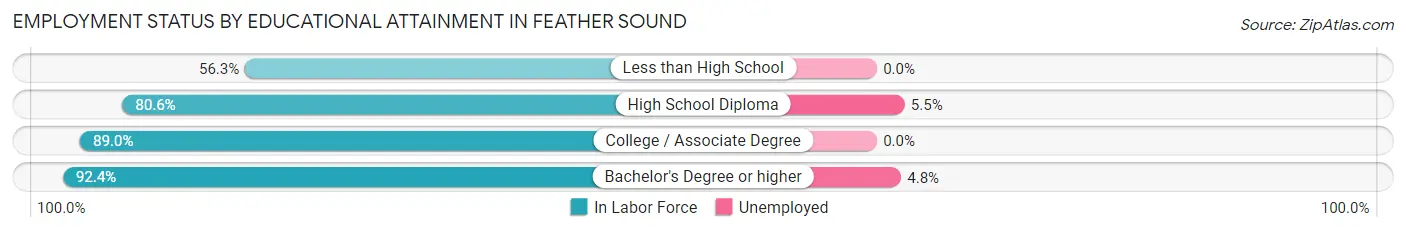
| Educational Attainment | In Labor Force | Unemployed |
| Less than High School | 18 (56.3%) | 0 (0.0%) |
| High School Diploma | 183 (80.6%) | 12 (5.5%) |
| College / Associate Degree | 475 (89.0%) | 0 (0.0%) |
| Bachelor's Degree or higher | 1,161 (92.4%) | 60 (4.8%) |
| Total | 1,839 (89.7%) | 74 (3.6%) |
Employment Occupations by Sex in Feather Sound
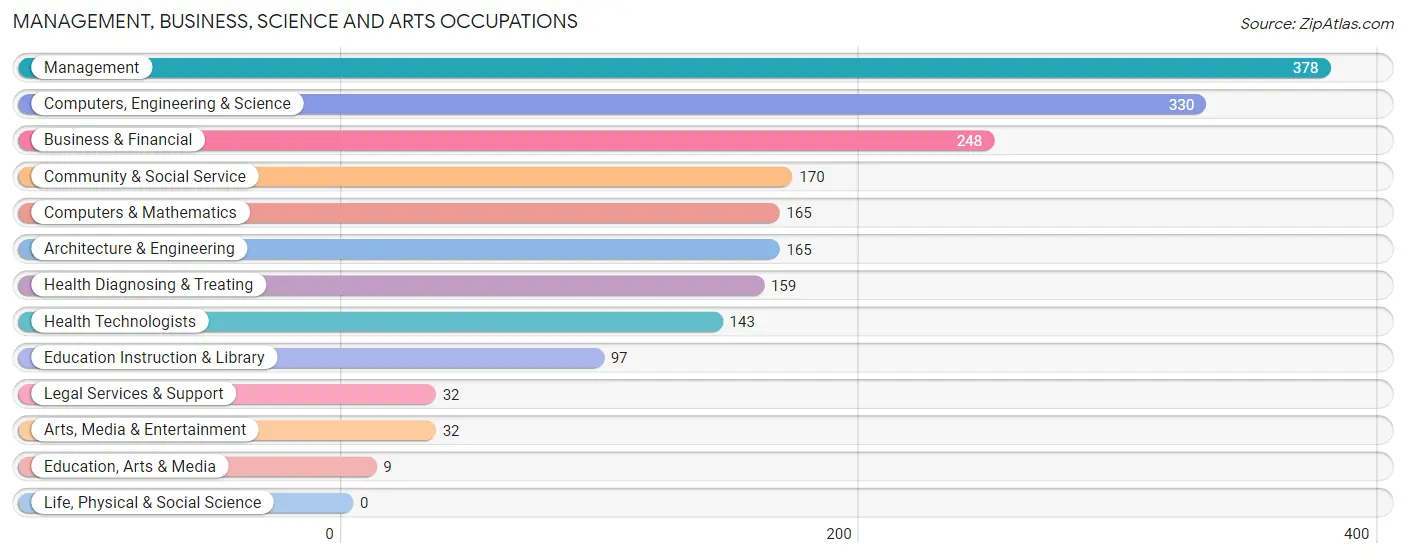
Management, Business, Science and Arts Occupations
The most common Management, Business, Science and Arts occupations in Feather Sound are Management (378 | 18.5%), Computers, Engineering & Science (330 | 16.2%), Business & Financial (248 | 12.2%), Community & Social Service (170 | 8.3%), and Computers & Mathematics (165 | 8.1%).
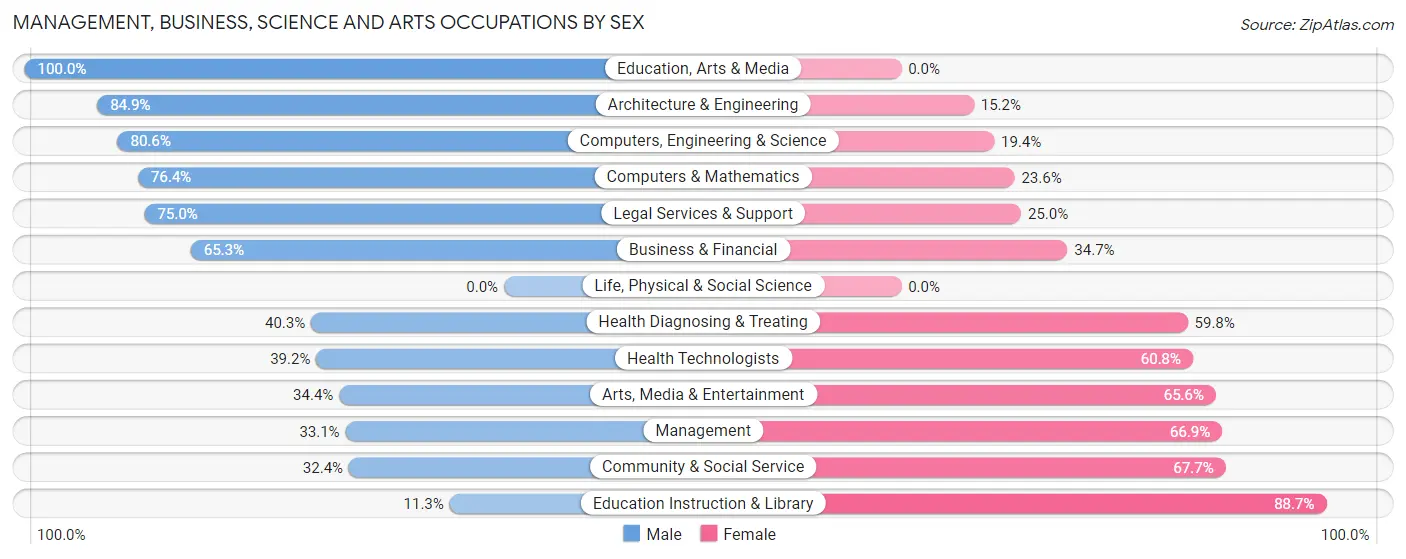
Management, Business, Science and Arts Occupations by Sex
Within the Management, Business, Science and Arts occupations in Feather Sound, the most male-oriented occupations are Education, Arts & Media (100.0%), Architecture & Engineering (84.9%), and Computers, Engineering & Science (80.6%), while the most female-oriented occupations are Education Instruction & Library (88.7%), Community & Social Service (67.6%), and Management (66.9%).
| Occupation | Male | Female |
| Management | 125 (33.1%) | 253 (66.9%) |
| Business & Financial | 162 (65.3%) | 86 (34.7%) |
| Computers, Engineering & Science | 266 (80.6%) | 64 (19.4%) |
| Computers & Mathematics | 126 (76.4%) | 39 (23.6%) |
| Architecture & Engineering | 140 (84.9%) | 25 (15.1%) |
| Life, Physical & Social Science | 0 (0.0%) | 0 (0.0%) |
| Community & Social Service | 55 (32.4%) | 115 (67.6%) |
| Education, Arts & Media | 9 (100.0%) | 0 (0.0%) |
| Legal Services & Support | 24 (75.0%) | 8 (25.0%) |
| Education Instruction & Library | 11 (11.3%) | 86 (88.7%) |
| Arts, Media & Entertainment | 11 (34.4%) | 21 (65.6%) |
| Health Diagnosing & Treating | 64 (40.3%) | 95 (59.8%) |
| Health Technologists | 56 (39.2%) | 87 (60.8%) |
| Total (Category) | 672 (52.3%) | 613 (47.7%) |
| Total (Overall) | 1,047 (51.3%) | 992 (48.6%) |
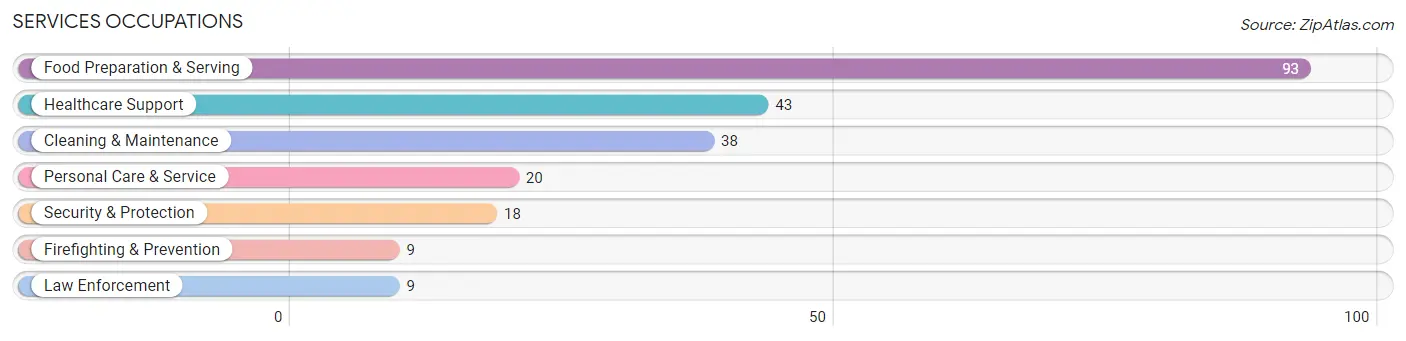
Services Occupations
The most common Services occupations in Feather Sound are Food Preparation & Serving (93 | 4.6%), Healthcare Support (43 | 2.1%), Cleaning & Maintenance (38 | 1.9%), Personal Care & Service (20 | 1.0%), and Security & Protection (18 | 0.9%).
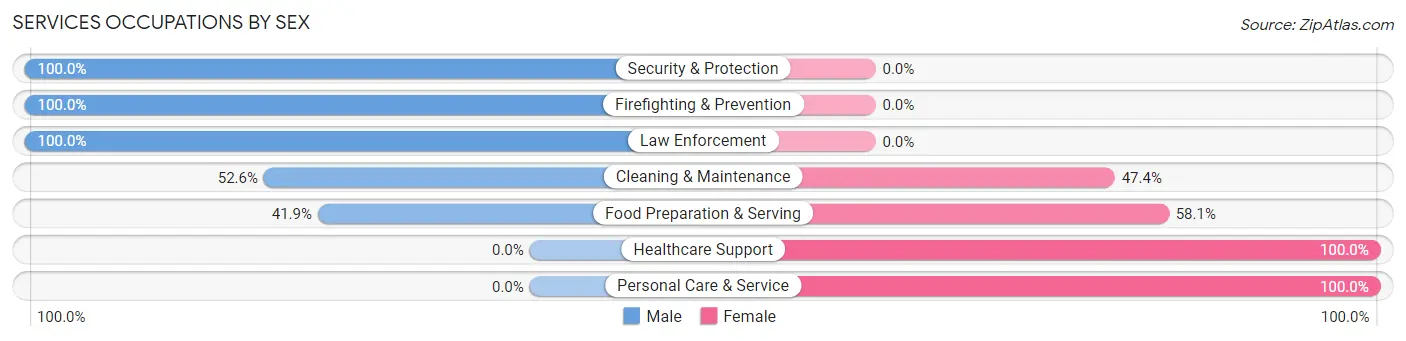
Services Occupations by Sex
Within the Services occupations in Feather Sound, the most male-oriented occupations are Security & Protection (100.0%), Firefighting & Prevention (100.0%), and Law Enforcement (100.0%), while the most female-oriented occupations are Healthcare Support (100.0%), Personal Care & Service (100.0%), and Food Preparation & Serving (58.1%).
| Occupation | Male | Female |
| Healthcare Support | 0 (0.0%) | 43 (100.0%) |
| Security & Protection | 18 (100.0%) | 0 (0.0%) |
| Firefighting & Prevention | 9 (100.0%) | 0 (0.0%) |
| Law Enforcement | 9 (100.0%) | 0 (0.0%) |
| Food Preparation & Serving | 39 (41.9%) | 54 (58.1%) |
| Cleaning & Maintenance | 20 (52.6%) | 18 (47.4%) |
| Personal Care & Service | 0 (0.0%) | 20 (100.0%) |
| Total (Category) | 77 (36.3%) | 135 (63.7%) |
| Total (Overall) | 1,047 (51.3%) | 992 (48.6%) |
Sales and Office Occupations
The most common Sales and Office occupations in Feather Sound are Sales & Related (215 | 10.5%), and Office & Administration (176 | 8.6%).
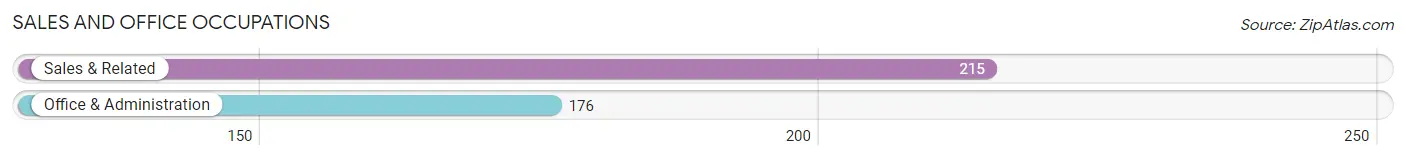
Sales and Office Occupations by Sex
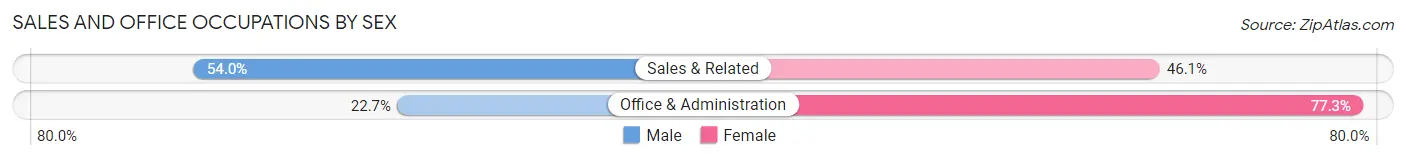
| Occupation | Male | Female |
| Sales & Related | 116 (53.9%) | 99 (46.1%) |
| Office & Administration | 40 (22.7%) | 136 (77.3%) |
| Total (Category) | 156 (39.9%) | 235 (60.1%) |
| Total (Overall) | 1,047 (51.3%) | 992 (48.6%) |
Natural Resources, Construction and Maintenance Occupations
The most common Natural Resources, Construction and Maintenance occupations in Feather Sound are Construction & Extraction (56 | 2.8%), and Installation, Maintenance & Repair (40 | 2.0%).
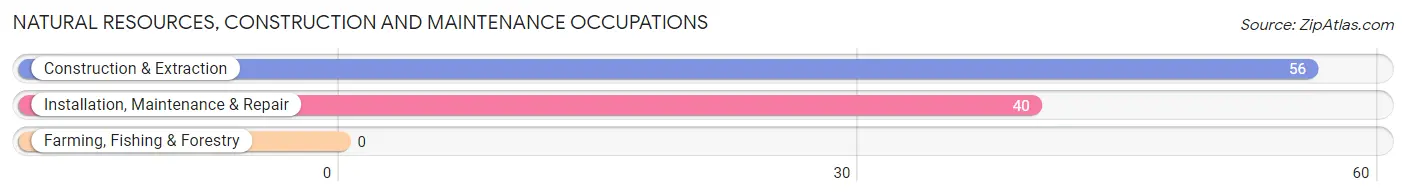
Natural Resources, Construction and Maintenance Occupations by Sex
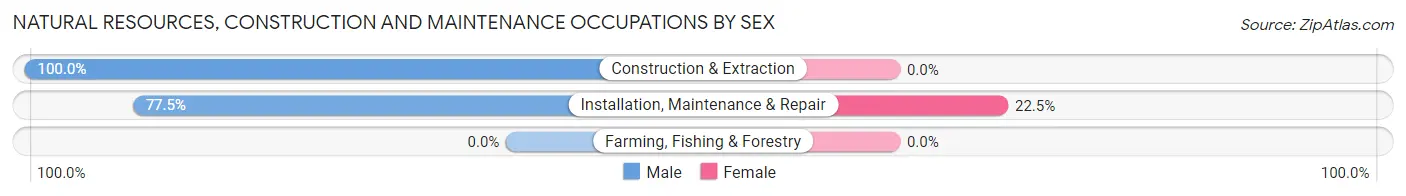
| Occupation | Male | Female |
| Farming, Fishing & Forestry | 0 (0.0%) | 0 (0.0%) |
| Construction & Extraction | 56 (100.0%) | 0 (0.0%) |
| Installation, Maintenance & Repair | 31 (77.5%) | 9 (22.5%) |
| Total (Category) | 87 (90.6%) | 9 (9.4%) |
| Total (Overall) | 1,047 (51.3%) | 992 (48.6%) |
Production, Transportation and Moving Occupations
The most common Production, Transportation and Moving occupations in Feather Sound are Transportation (38 | 1.9%), and Production (17 | 0.8%).
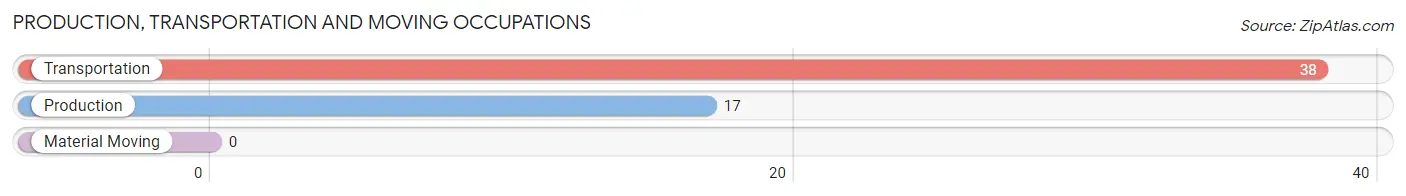
Production, Transportation and Moving Occupations by Sex
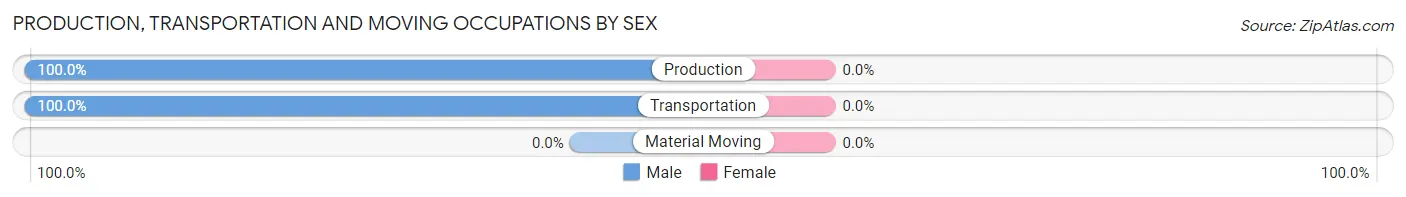
| Occupation | Male | Female |
| Production | 17 (100.0%) | 0 (0.0%) |
| Transportation | 38 (100.0%) | 0 (0.0%) |
| Material Moving | 0 (0.0%) | 0 (0.0%) |
| Total (Category) | 55 (100.0%) | 0 (0.0%) |
| Total (Overall) | 1,047 (51.3%) | 992 (48.6%) |
Employment Industries by Sex in Feather Sound
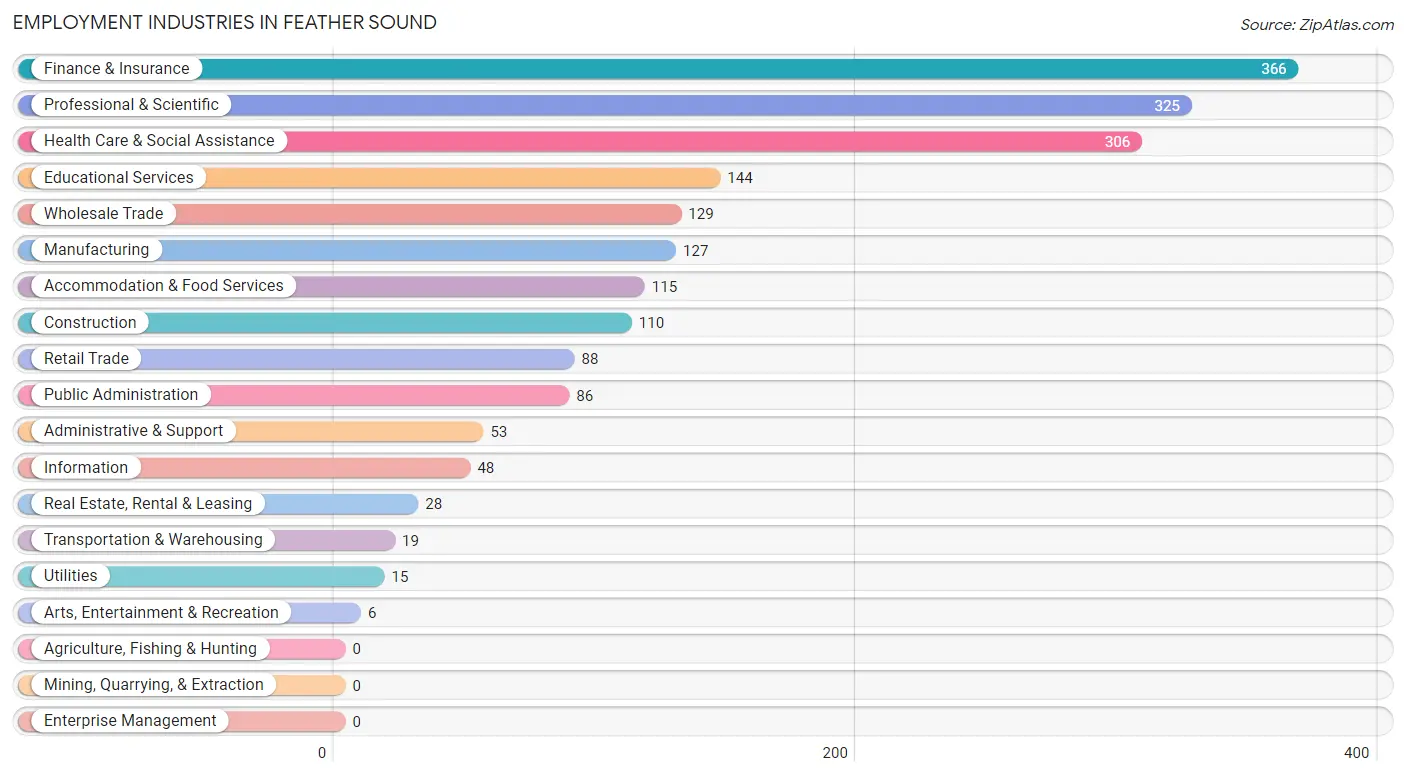
Employment Industries in Feather Sound
The major employment industries in Feather Sound include Finance & Insurance (366 | 17.9%), Professional & Scientific (325 | 15.9%), Health Care & Social Assistance (306 | 15.0%), Educational Services (144 | 7.1%), and Wholesale Trade (129 | 6.3%).
Employment Industries by Sex in Feather Sound
The Feather Sound industries that see more men than women are Wholesale Trade (100.0%), Arts, Entertainment & Recreation (100.0%), and Public Administration (82.6%), whereas the industries that tend to have a higher number of women are Real Estate, Rental & Leasing (100.0%), Health Care & Social Assistance (72.9%), and Educational Services (71.5%).
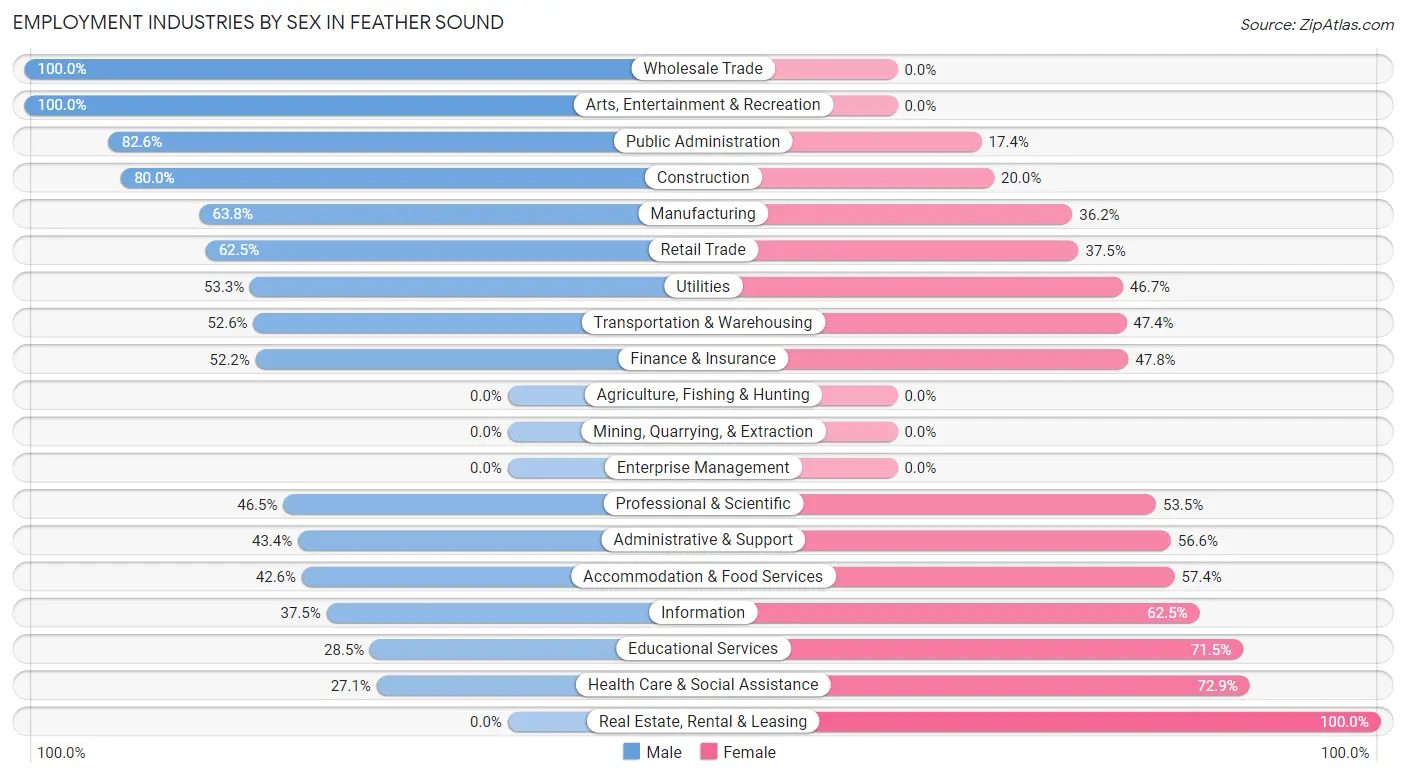
| Industry | Male | Female |
| Agriculture, Fishing & Hunting | 0 (0.0%) | 0 (0.0%) |
| Mining, Quarrying, & Extraction | 0 (0.0%) | 0 (0.0%) |
| Construction | 88 (80.0%) | 22 (20.0%) |
| Manufacturing | 81 (63.8%) | 46 (36.2%) |
| Wholesale Trade | 129 (100.0%) | 0 (0.0%) |
| Retail Trade | 55 (62.5%) | 33 (37.5%) |
| Transportation & Warehousing | 10 (52.6%) | 9 (47.4%) |
| Utilities | 8 (53.3%) | 7 (46.7%) |
| Information | 18 (37.5%) | 30 (62.5%) |
| Finance & Insurance | 191 (52.2%) | 175 (47.8%) |
| Real Estate, Rental & Leasing | 0 (0.0%) | 28 (100.0%) |
| Professional & Scientific | 151 (46.5%) | 174 (53.5%) |
| Enterprise Management | 0 (0.0%) | 0 (0.0%) |
| Administrative & Support | 23 (43.4%) | 30 (56.6%) |
| Educational Services | 41 (28.5%) | 103 (71.5%) |
| Health Care & Social Assistance | 83 (27.1%) | 223 (72.9%) |
| Arts, Entertainment & Recreation | 6 (100.0%) | 0 (0.0%) |
| Accommodation & Food Services | 49 (42.6%) | 66 (57.4%) |
| Public Administration | 71 (82.6%) | 15 (17.4%) |
| Total | 1,047 (51.3%) | 992 (48.6%) |
Education in Feather Sound
School Enrollment in Feather Sound
The most common levels of schooling among the 431 students in Feather Sound are high school (149 | 34.6%), middle school (84 | 19.5%), and graduate / professional (78 | 18.1%).
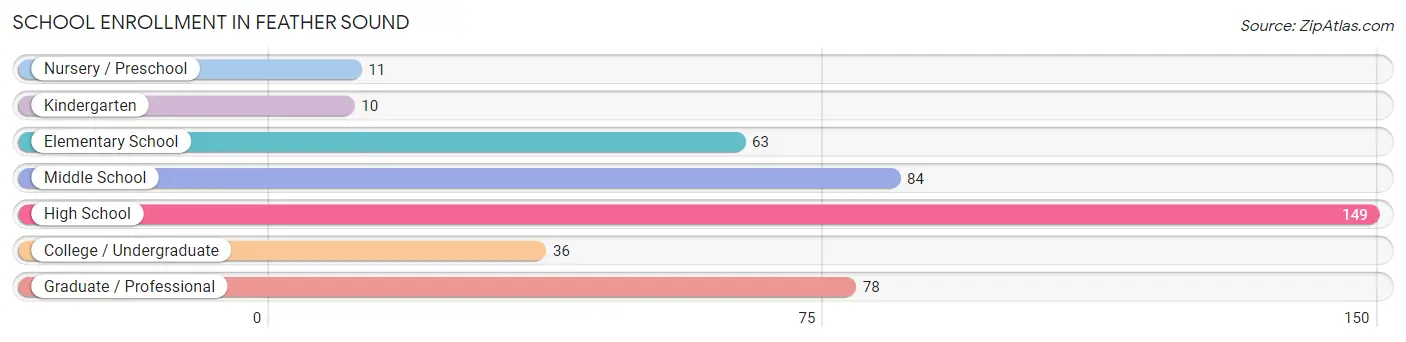
| School Level | # Students | % Students |
| Nursery / Preschool | 11 | 2.5% |
| Kindergarten | 10 | 2.3% |
| Elementary School | 63 | 14.6% |
| Middle School | 84 | 19.5% |
| High School | 149 | 34.6% |
| College / Undergraduate | 36 | 8.4% |
| Graduate / Professional | 78 | 18.1% |
| Total | 431 | 100.0% |
School Enrollment by Age by Funding Source in Feather Sound
Out of a total of 431 students who are enrolled in schools in Feather Sound, 185 (42.9%) attend a private institution, while the remaining 246 (57.1%) are enrolled in public schools. The age group of 20 to 24 year olds has the highest likelihood of being enrolled in private schools, with 10 (100.0% in the age bracket) enrolled. Conversely, the age group of 18 to 19 year olds has the lowest likelihood of being enrolled in a private school, with 11 (100.0% in the age bracket) attending a public institution.
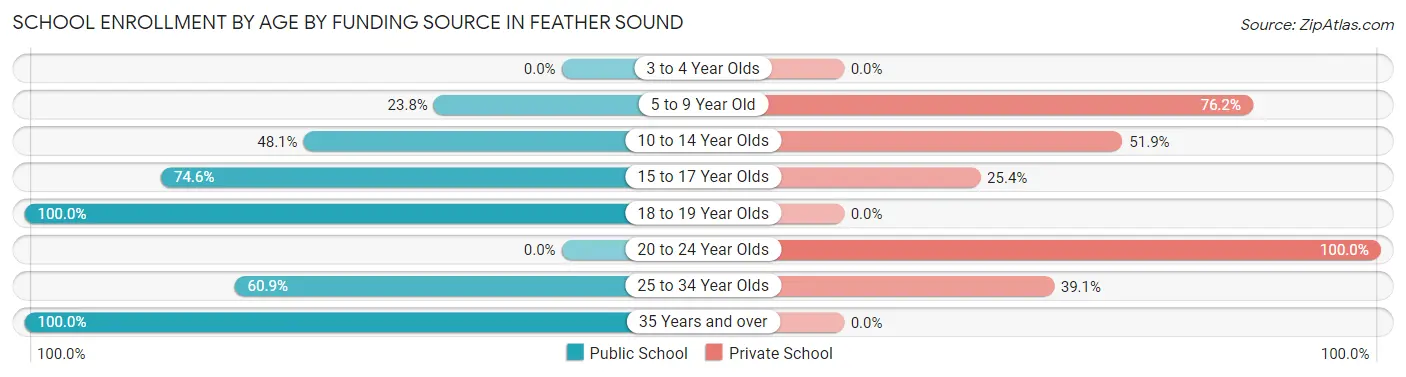
| Age Bracket | Public School | Private School |
| 3 to 4 Year Olds | 0 (0.0%) | 0 (0.0%) |
| 5 to 9 Year Old | 20 (23.8%) | 64 (76.2%) |
| 10 to 14 Year Olds | 50 (48.1%) | 54 (51.9%) |
| 15 to 17 Year Olds | 88 (74.6%) | 30 (25.4%) |
| 18 to 19 Year Olds | 11 (100.0%) | 0 (0.0%) |
| 20 to 24 Year Olds | 0 (0.0%) | 10 (100.0%) |
| 25 to 34 Year Olds | 42 (60.9%) | 27 (39.1%) |
| 35 Years and over | 35 (100.0%) | 0 (0.0%) |
| Total | 246 (57.1%) | 185 (42.9%) |
Educational Attainment by Field of Study in Feather Sound
Business (406 | 22.9%), science & technology (196 | 11.1%), bio, nature & agricultural (185 | 10.4%), social sciences (178 | 10.1%), and education (124 | 7.0%) are the most common fields of study among 1,771 individuals in Feather Sound who have obtained a bachelor's degree or higher.
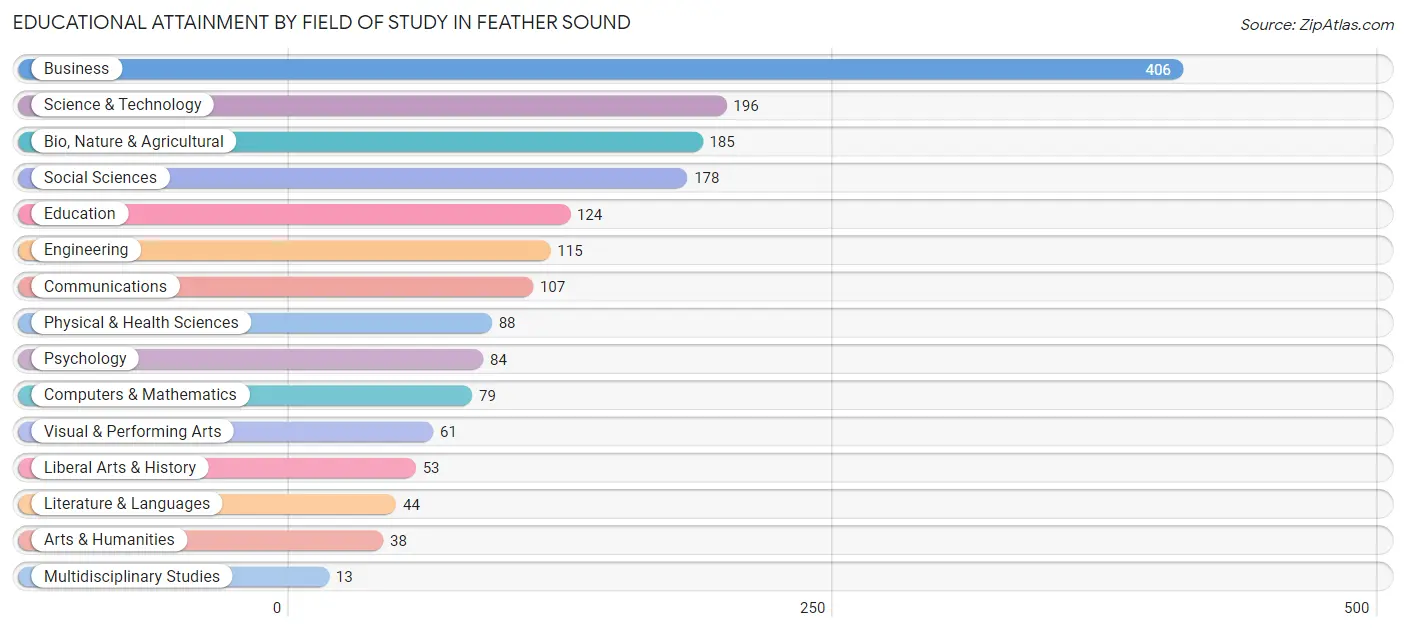
| Field of Study | # Graduates | % Graduates |
| Computers & Mathematics | 79 | 4.5% |
| Bio, Nature & Agricultural | 185 | 10.4% |
| Physical & Health Sciences | 88 | 5.0% |
| Psychology | 84 | 4.7% |
| Social Sciences | 178 | 10.1% |
| Engineering | 115 | 6.5% |
| Multidisciplinary Studies | 13 | 0.7% |
| Science & Technology | 196 | 11.1% |
| Business | 406 | 22.9% |
| Education | 124 | 7.0% |
| Literature & Languages | 44 | 2.5% |
| Liberal Arts & History | 53 | 3.0% |
| Visual & Performing Arts | 61 | 3.4% |
| Communications | 107 | 6.0% |
| Arts & Humanities | 38 | 2.1% |
| Total | 1,771 | 100.0% |
Transportation & Commute in Feather Sound
Vehicle Availability by Sex in Feather Sound
The most prevalent vehicle ownership categories in Feather Sound are males with 2 vehicles (549, accounting for 52.4%) and females with 2 vehicles (479, making up 56.0%).
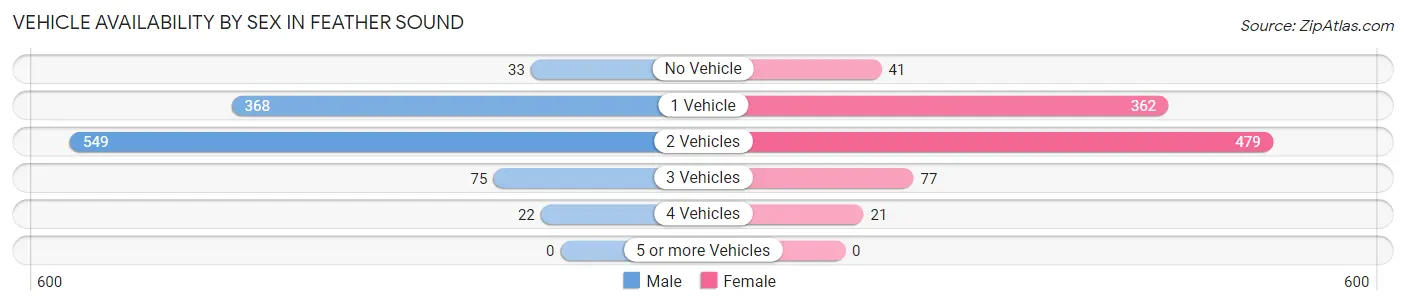
| Vehicles Available | Male | Female |
| No Vehicle | 33 (3.2%) | 41 (4.2%) |
| 1 Vehicle | 368 (35.1%) | 362 (36.9%) |
| 2 Vehicles | 549 (52.4%) | 479 (48.9%) |
| 3 Vehicles | 75 (7.2%) | 77 (7.9%) |
| 4 Vehicles | 22 (2.1%) | 21 (2.1%) |
| 5 or more Vehicles | 0 (0.0%) | 0 (0.0%) |
| Total | 1,047 (100.0%) | 980 (100.0%) |
Commute Time in Feather Sound
The most frequently occuring commute durations in Feather Sound are 20 to 24 minutes (439 commuters, 26.3%), 30 to 34 minutes (259 commuters, 15.5%), and 5 to 9 minutes (229 commuters, 13.7%).
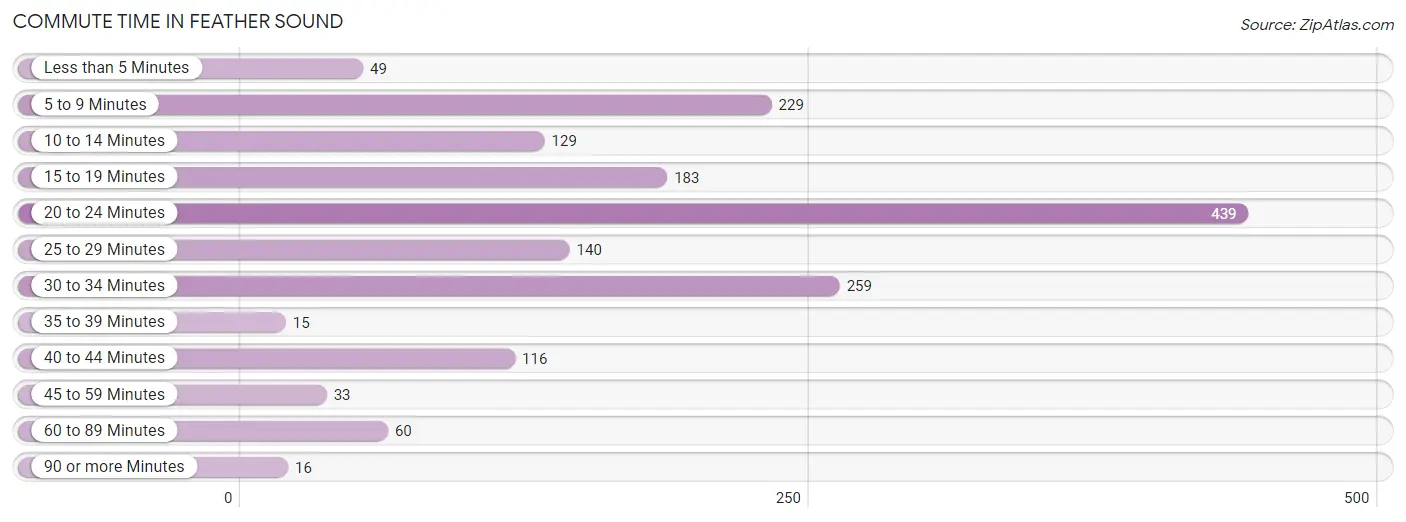
| Commute Time | # Commuters | % Commuters |
| Less than 5 Minutes | 49 | 2.9% |
| 5 to 9 Minutes | 229 | 13.7% |
| 10 to 14 Minutes | 129 | 7.7% |
| 15 to 19 Minutes | 183 | 11.0% |
| 20 to 24 Minutes | 439 | 26.3% |
| 25 to 29 Minutes | 140 | 8.4% |
| 30 to 34 Minutes | 259 | 15.5% |
| 35 to 39 Minutes | 15 | 0.9% |
| 40 to 44 Minutes | 116 | 7.0% |
| 45 to 59 Minutes | 33 | 2.0% |
| 60 to 89 Minutes | 60 | 3.6% |
| 90 or more Minutes | 16 | 1.0% |
Commute Time by Sex in Feather Sound
The most common commute times in Feather Sound are 20 to 24 minutes (268 commuters, 30.8%) for males and 20 to 24 minutes (171 commuters, 21.4%) for females.
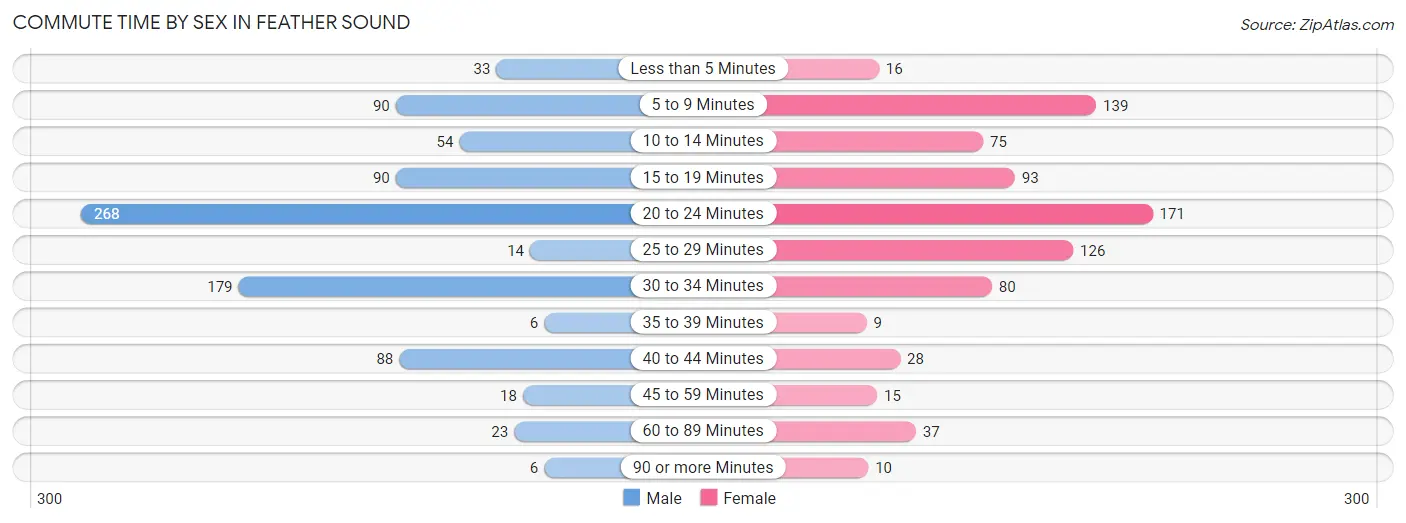
| Commute Time | Male | Female |
| Less than 5 Minutes | 33 (3.8%) | 16 (2.0%) |
| 5 to 9 Minutes | 90 (10.4%) | 139 (17.4%) |
| 10 to 14 Minutes | 54 (6.2%) | 75 (9.4%) |
| 15 to 19 Minutes | 90 (10.4%) | 93 (11.6%) |
| 20 to 24 Minutes | 268 (30.8%) | 171 (21.4%) |
| 25 to 29 Minutes | 14 (1.6%) | 126 (15.8%) |
| 30 to 34 Minutes | 179 (20.6%) | 80 (10.0%) |
| 35 to 39 Minutes | 6 (0.7%) | 9 (1.1%) |
| 40 to 44 Minutes | 88 (10.1%) | 28 (3.5%) |
| 45 to 59 Minutes | 18 (2.1%) | 15 (1.9%) |
| 60 to 89 Minutes | 23 (2.6%) | 37 (4.6%) |
| 90 or more Minutes | 6 (0.7%) | 10 (1.3%) |
Time of Departure to Work by Sex in Feather Sound
The most frequent times of departure to work in Feather Sound are 6:30 AM to 6:59 AM (198, 22.8%) for males and 7:00 AM to 7:29 AM (170, 21.3%) for females.
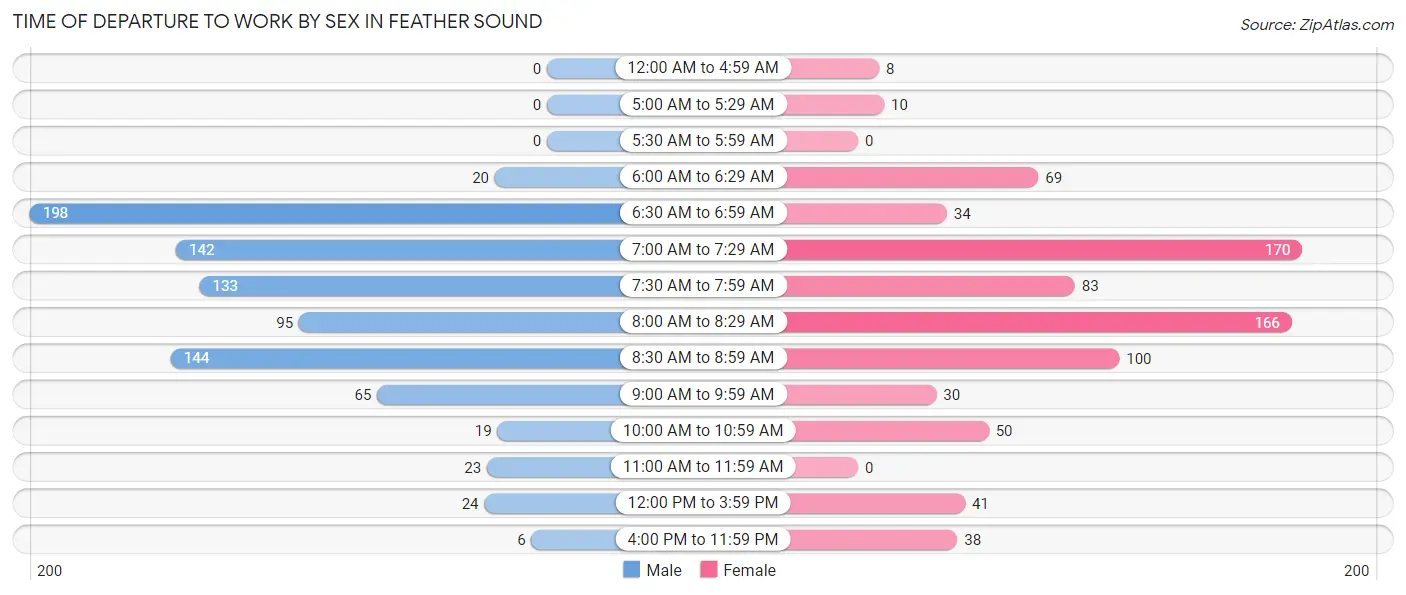
| Time of Departure | Male | Female |
| 12:00 AM to 4:59 AM | 0 (0.0%) | 8 (1.0%) |
| 5:00 AM to 5:29 AM | 0 (0.0%) | 10 (1.3%) |
| 5:30 AM to 5:59 AM | 0 (0.0%) | 0 (0.0%) |
| 6:00 AM to 6:29 AM | 20 (2.3%) | 69 (8.6%) |
| 6:30 AM to 6:59 AM | 198 (22.8%) | 34 (4.3%) |
| 7:00 AM to 7:29 AM | 142 (16.3%) | 170 (21.3%) |
| 7:30 AM to 7:59 AM | 133 (15.3%) | 83 (10.4%) |
| 8:00 AM to 8:29 AM | 95 (10.9%) | 166 (20.8%) |
| 8:30 AM to 8:59 AM | 144 (16.6%) | 100 (12.5%) |
| 9:00 AM to 9:59 AM | 65 (7.5%) | 30 (3.7%) |
| 10:00 AM to 10:59 AM | 19 (2.2%) | 50 (6.3%) |
| 11:00 AM to 11:59 AM | 23 (2.6%) | 0 (0.0%) |
| 12:00 PM to 3:59 PM | 24 (2.8%) | 41 (5.1%) |
| 4:00 PM to 11:59 PM | 6 (0.7%) | 38 (4.8%) |
| Total | 869 (100.0%) | 799 (100.0%) |
Housing Occupancy in Feather Sound
Occupancy by Ownership in Feather Sound
Of the total 1,668 dwellings in Feather Sound, owner-occupied units account for 1,143 (68.5%), while renter-occupied units make up 525 (31.5%).
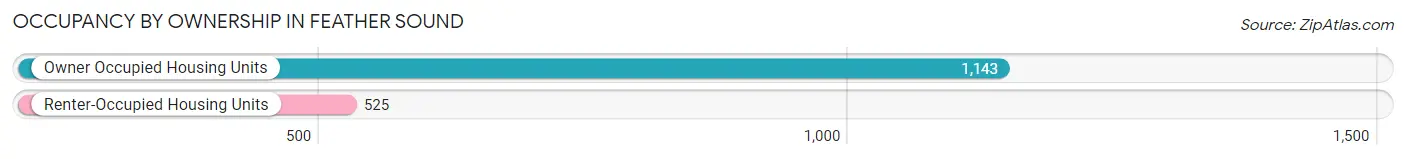
| Occupancy | # Housing Units | % Housing Units |
| Owner Occupied Housing Units | 1,143 | 68.5% |
| Renter-Occupied Housing Units | 525 | 31.5% |
| Total Occupied Housing Units | 1,668 | 100.0% |
Occupancy by Household Size in Feather Sound
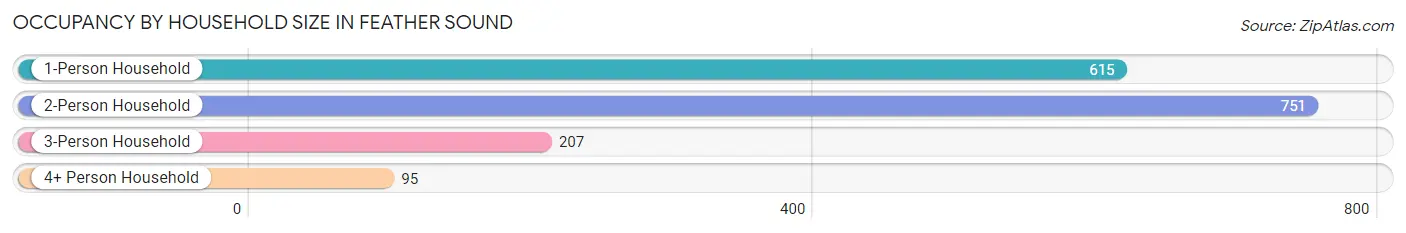
| Household Size | # Housing Units | % Housing Units |
| 1-Person Household | 615 | 36.9% |
| 2-Person Household | 751 | 45.0% |
| 3-Person Household | 207 | 12.4% |
| 4+ Person Household | 95 | 5.7% |
| Total Housing Units | 1,668 | 100.0% |
Occupancy by Ownership by Household Size in Feather Sound
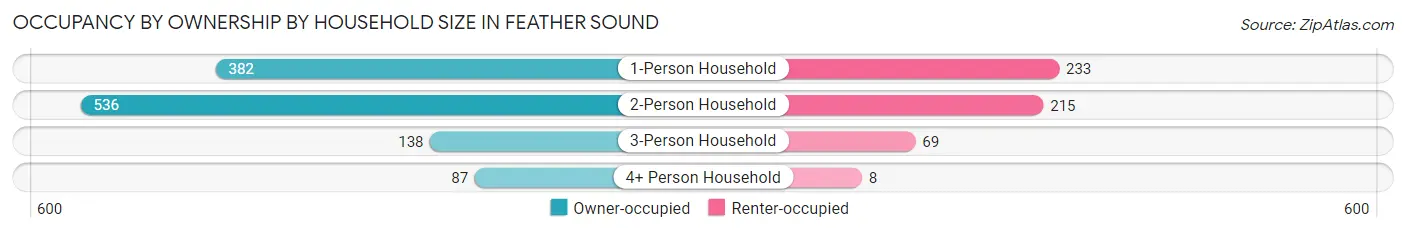
| Household Size | Owner-occupied | Renter-occupied |
| 1-Person Household | 382 (62.1%) | 233 (37.9%) |
| 2-Person Household | 536 (71.4%) | 215 (28.6%) |
| 3-Person Household | 138 (66.7%) | 69 (33.3%) |
| 4+ Person Household | 87 (91.6%) | 8 (8.4%) |
| Total Housing Units | 1,143 (68.5%) | 525 (31.5%) |
Occupancy by Educational Attainment in Feather Sound
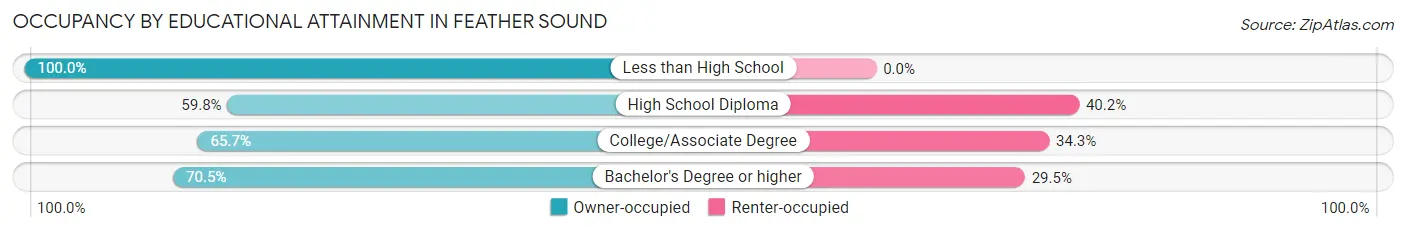
| Household Size | Owner-occupied | Renter-occupied |
| Less than High School | 7 (100.0%) | 0 (0.0%) |
| High School Diploma | 58 (59.8%) | 39 (40.2%) |
| College/Associate Degree | 343 (65.7%) | 179 (34.3%) |
| Bachelor's Degree or higher | 735 (70.5%) | 307 (29.5%) |
Occupancy by Age of Householder in Feather Sound
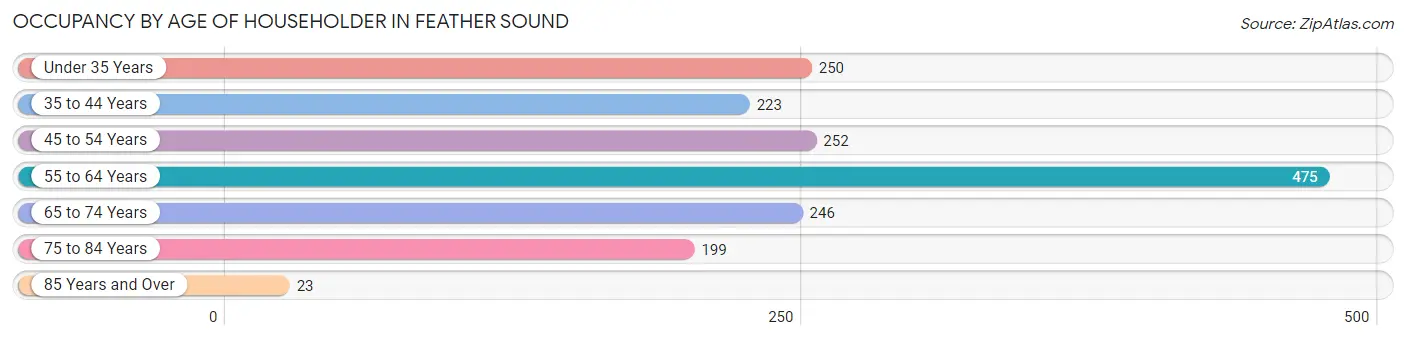
| Age Bracket | # Households | % Households |
| Under 35 Years | 250 | 15.0% |
| 35 to 44 Years | 223 | 13.4% |
| 45 to 54 Years | 252 | 15.1% |
| 55 to 64 Years | 475 | 28.5% |
| 65 to 74 Years | 246 | 14.7% |
| 75 to 84 Years | 199 | 11.9% |
| 85 Years and Over | 23 | 1.4% |
| Total | 1,668 | 100.0% |
Housing Finances in Feather Sound
Median Income by Occupancy in Feather Sound
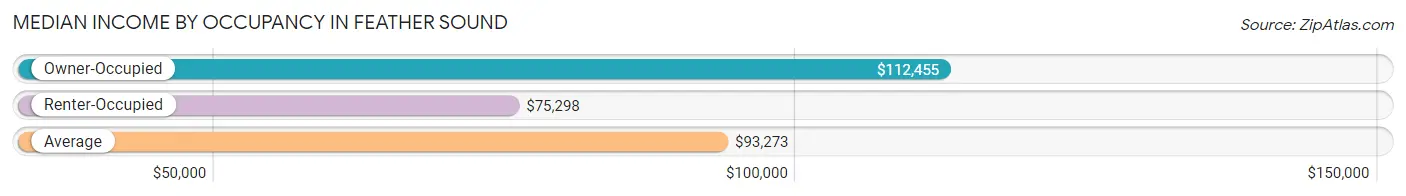
| Occupancy Type | # Households | Median Income |
| Owner-Occupied | 1,143 (68.5%) | $112,455 |
| Renter-Occupied | 525 (31.5%) | $75,298 |
| Average | 1,668 (100.0%) | $93,273 |
Occupancy by Householder Income Bracket in Feather Sound
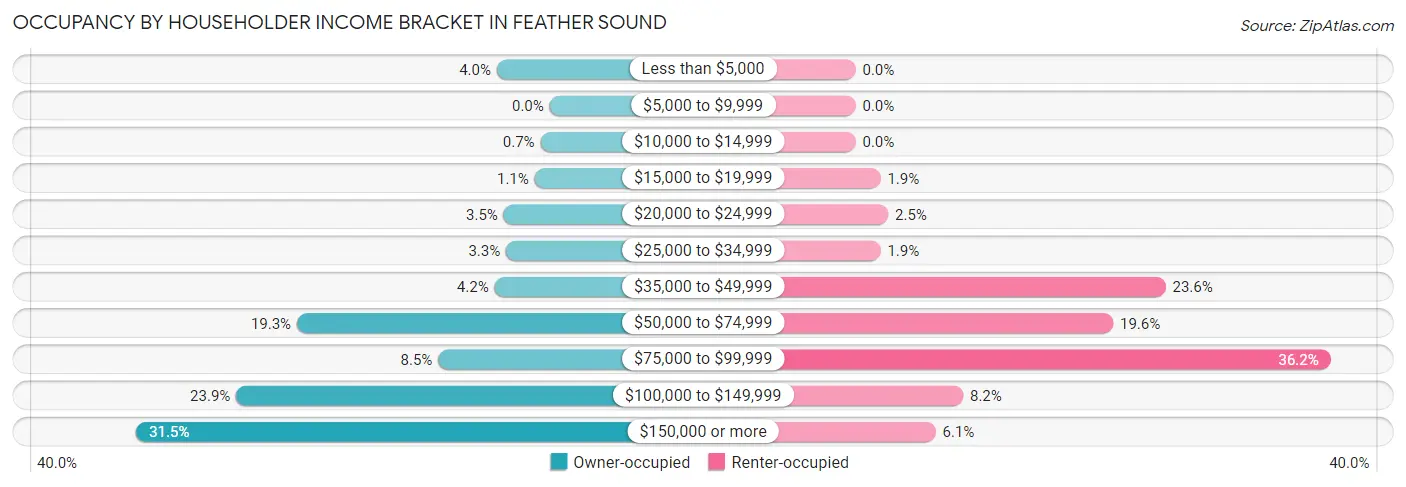
| Income Bracket | Owner-occupied | Renter-occupied |
| Less than $5,000 | 46 (4.0%) | 0 (0.0%) |
| $5,000 to $9,999 | 0 (0.0%) | 0 (0.0%) |
| $10,000 to $14,999 | 8 (0.7%) | 0 (0.0%) |
| $15,000 to $19,999 | 13 (1.1%) | 10 (1.9%) |
| $20,000 to $24,999 | 40 (3.5%) | 13 (2.5%) |
| $25,000 to $34,999 | 38 (3.3%) | 10 (1.9%) |
| $35,000 to $49,999 | 48 (4.2%) | 124 (23.6%) |
| $50,000 to $74,999 | 220 (19.3%) | 103 (19.6%) |
| $75,000 to $99,999 | 97 (8.5%) | 190 (36.2%) |
| $100,000 to $149,999 | 273 (23.9%) | 43 (8.2%) |
| $150,000 or more | 360 (31.5%) | 32 (6.1%) |
| Total | 1,143 (100.0%) | 525 (100.0%) |
Monthly Housing Cost Tiers in Feather Sound
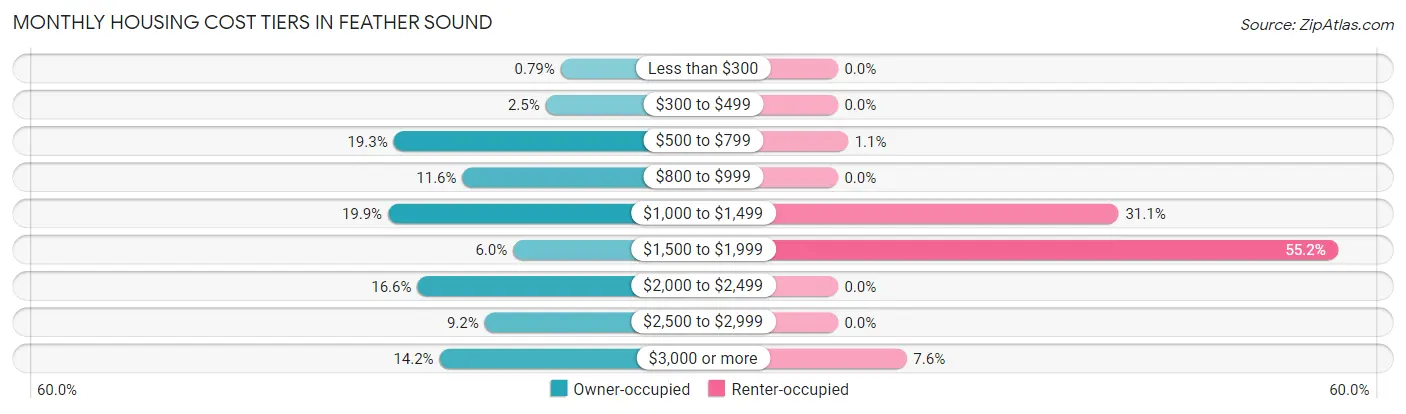
| Monthly Cost | Owner-occupied | Renter-occupied |
| Less than $300 | 9 (0.8%) | 0 (0.0%) |
| $300 to $499 | 28 (2.5%) | 0 (0.0%) |
| $500 to $799 | 220 (19.3%) | 6 (1.1%) |
| $800 to $999 | 133 (11.6%) | 0 (0.0%) |
| $1,000 to $1,499 | 227 (19.9%) | 163 (31.0%) |
| $1,500 to $1,999 | 69 (6.0%) | 290 (55.2%) |
| $2,000 to $2,499 | 190 (16.6%) | 0 (0.0%) |
| $2,500 to $2,999 | 105 (9.2%) | 0 (0.0%) |
| $3,000 or more | 162 (14.2%) | 40 (7.6%) |
| Total | 1,143 (100.0%) | 525 (100.0%) |
Physical Housing Characteristics in Feather Sound
Housing Structures in Feather Sound
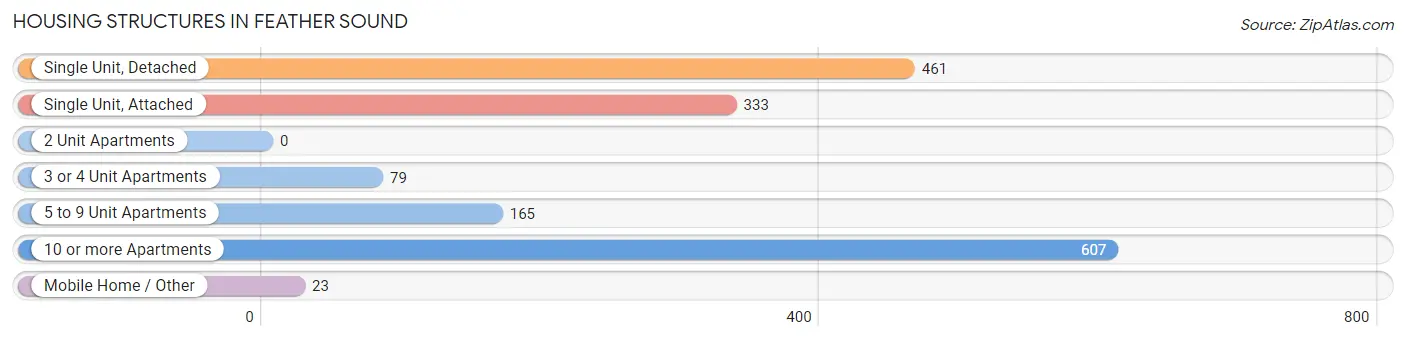
| Structure Type | # Housing Units | % Housing Units |
| Single Unit, Detached | 461 | 27.6% |
| Single Unit, Attached | 333 | 20.0% |
| 2 Unit Apartments | 0 | 0.0% |
| 3 or 4 Unit Apartments | 79 | 4.7% |
| 5 to 9 Unit Apartments | 165 | 9.9% |
| 10 or more Apartments | 607 | 36.4% |
| Mobile Home / Other | 23 | 1.4% |
| Total | 1,668 | 100.0% |
Housing Structures by Occupancy in Feather Sound
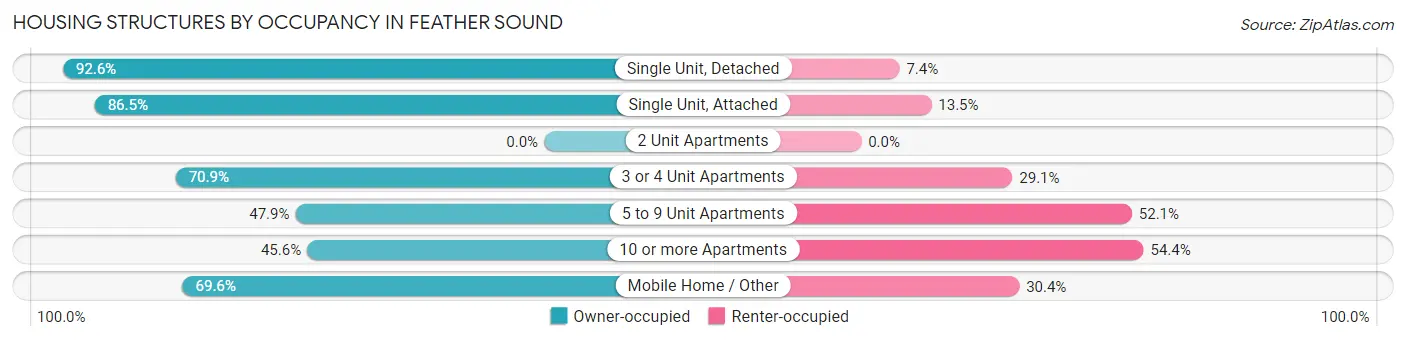
| Structure Type | Owner-occupied | Renter-occupied |
| Single Unit, Detached | 427 (92.6%) | 34 (7.4%) |
| Single Unit, Attached | 288 (86.5%) | 45 (13.5%) |
| 2 Unit Apartments | 0 (0.0%) | 0 (0.0%) |
| 3 or 4 Unit Apartments | 56 (70.9%) | 23 (29.1%) |
| 5 to 9 Unit Apartments | 79 (47.9%) | 86 (52.1%) |
| 10 or more Apartments | 277 (45.6%) | 330 (54.4%) |
| Mobile Home / Other | 16 (69.6%) | 7 (30.4%) |
| Total | 1,143 (68.5%) | 525 (31.5%) |
Housing Structures by Number of Rooms in Feather Sound
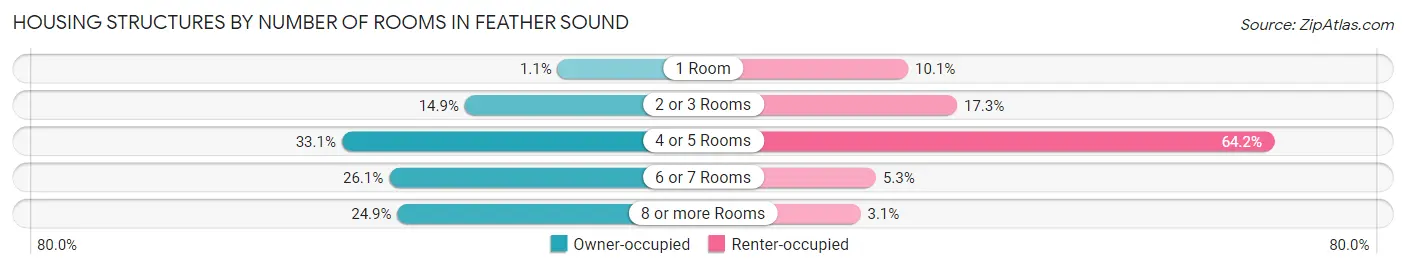
| Number of Rooms | Owner-occupied | Renter-occupied |
| 1 Room | 13 (1.1%) | 53 (10.1%) |
| 2 or 3 Rooms | 170 (14.9%) | 91 (17.3%) |
| 4 or 5 Rooms | 378 (33.1%) | 337 (64.2%) |
| 6 or 7 Rooms | 298 (26.1%) | 28 (5.3%) |
| 8 or more Rooms | 284 (24.8%) | 16 (3.0%) |
| Total | 1,143 (100.0%) | 525 (100.0%) |
Housing Structure by Heating Type in Feather Sound
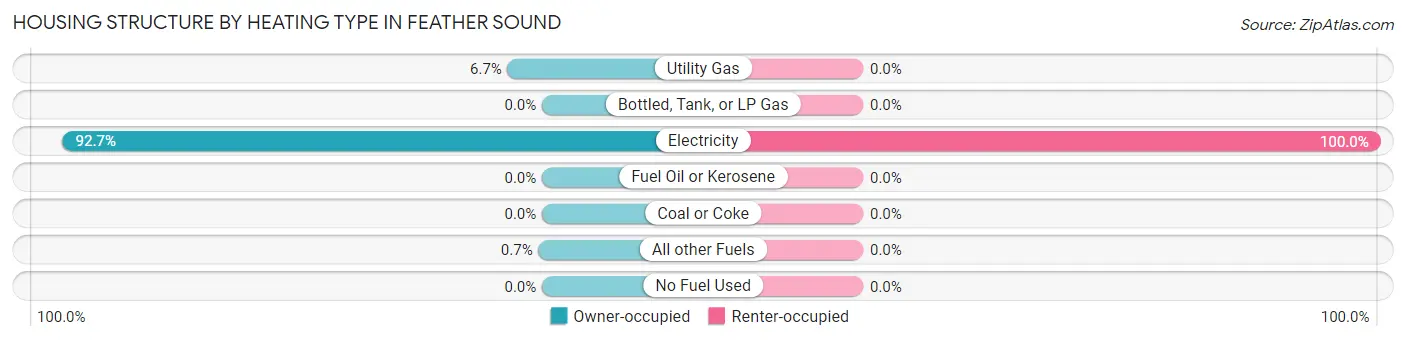
| Heating Type | Owner-occupied | Renter-occupied |
| Utility Gas | 76 (6.7%) | 0 (0.0%) |
| Bottled, Tank, or LP Gas | 0 (0.0%) | 0 (0.0%) |
| Electricity | 1,059 (92.6%) | 525 (100.0%) |
| Fuel Oil or Kerosene | 0 (0.0%) | 0 (0.0%) |
| Coal or Coke | 0 (0.0%) | 0 (0.0%) |
| All other Fuels | 8 (0.7%) | 0 (0.0%) |
| No Fuel Used | 0 (0.0%) | 0 (0.0%) |
| Total | 1,143 (100.0%) | 525 (100.0%) |
Household Vehicle Usage in Feather Sound
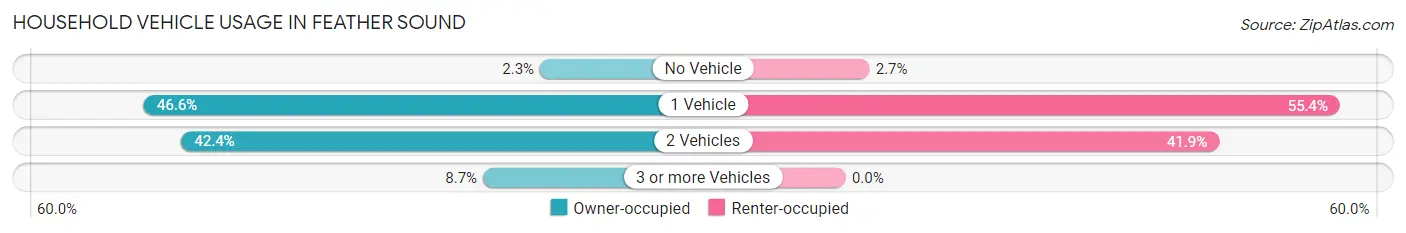
| Vehicles per Household | Owner-occupied | Renter-occupied |
| No Vehicle | 26 (2.3%) | 14 (2.7%) |
| 1 Vehicle | 533 (46.6%) | 291 (55.4%) |
| 2 Vehicles | 485 (42.4%) | 220 (41.9%) |
| 3 or more Vehicles | 99 (8.7%) | 0 (0.0%) |
| Total | 1,143 (100.0%) | 525 (100.0%) |
Real Estate & Mortgages in Feather Sound
Real Estate and Mortgage Overview in Feather Sound
| Characteristic | Without Mortgage | With Mortgage |
| Housing Units | 507 | 636 |
| Median Property Value | $347,000 | $370,400 |
| Median Household Income | $82,292 | $237 |
| Monthly Housing Costs | $806 | $162 |
| Real Estate Taxes | $2,551 | $0 |
Property Value by Mortgage Status in Feather Sound
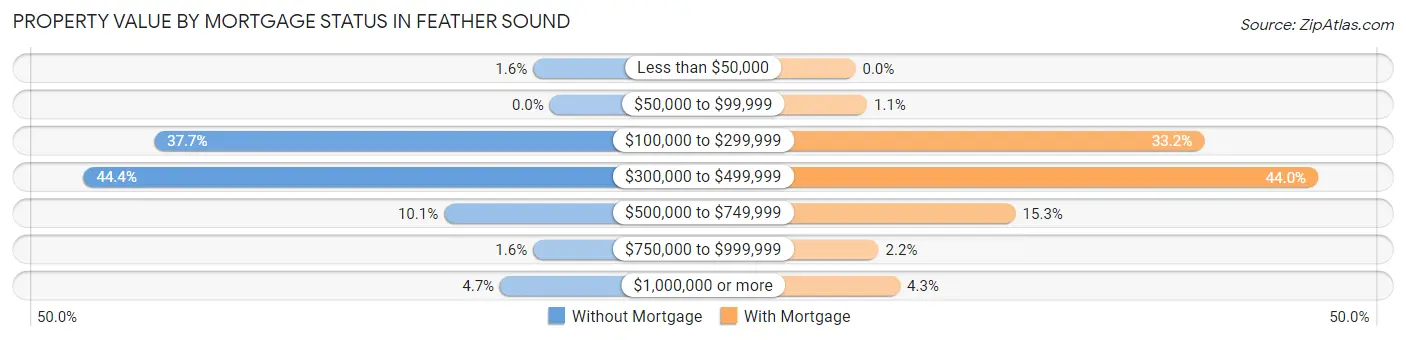
| Property Value | Without Mortgage | With Mortgage |
| Less than $50,000 | 8 (1.6%) | 0 (0.0%) |
| $50,000 to $99,999 | 0 (0.0%) | 7 (1.1%) |
| $100,000 to $299,999 | 191 (37.7%) | 211 (33.2%) |
| $300,000 to $499,999 | 225 (44.4%) | 280 (44.0%) |
| $500,000 to $749,999 | 51 (10.1%) | 97 (15.2%) |
| $750,000 to $999,999 | 8 (1.6%) | 14 (2.2%) |
| $1,000,000 or more | 24 (4.7%) | 27 (4.3%) |
| Total | 507 (100.0%) | 636 (100.0%) |
Household Income by Mortgage Status in Feather Sound
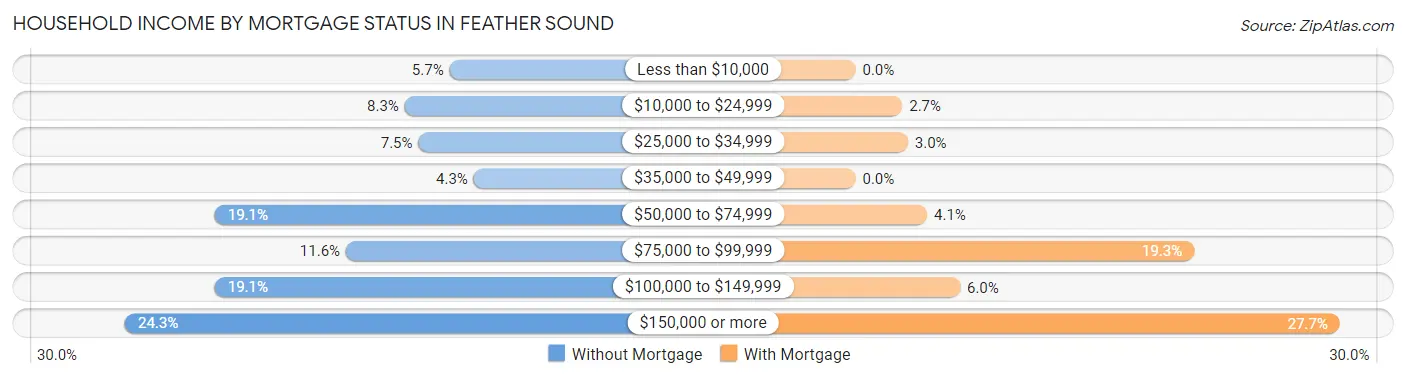
| Household Income | Without Mortgage | With Mortgage |
| Less than $10,000 | 29 (5.7%) | 0 (0.0%) |
| $10,000 to $24,999 | 42 (8.3%) | 17 (2.7%) |
| $25,000 to $34,999 | 38 (7.5%) | 19 (3.0%) |
| $35,000 to $49,999 | 22 (4.3%) | 0 (0.0%) |
| $50,000 to $74,999 | 97 (19.1%) | 26 (4.1%) |
| $75,000 to $99,999 | 59 (11.6%) | 123 (19.3%) |
| $100,000 to $149,999 | 97 (19.1%) | 38 (6.0%) |
| $150,000 or more | 123 (24.3%) | 176 (27.7%) |
| Total | 507 (100.0%) | 636 (100.0%) |
Property Value to Household Income Ratio in Feather Sound
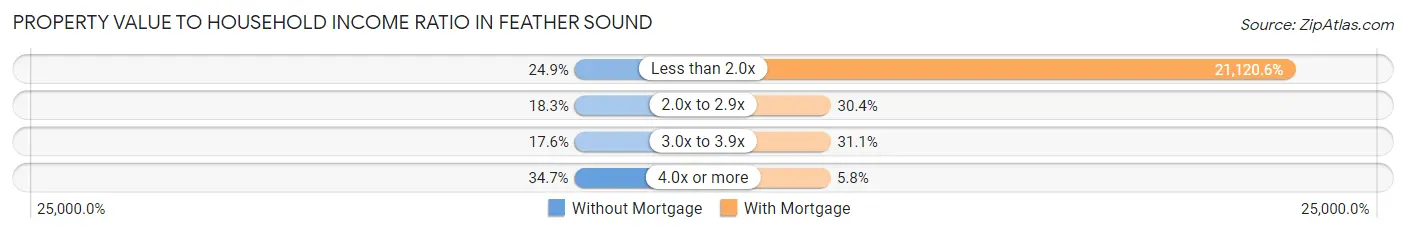
| Value-to-Income Ratio | Without Mortgage | With Mortgage |
| Less than 2.0x | 126 (24.8%) | 134,327 (21,120.6%) |
| 2.0x to 2.9x | 93 (18.3%) | 193 (30.3%) |
| 3.0x to 3.9x | 89 (17.5%) | 198 (31.1%) |
| 4.0x or more | 176 (34.7%) | 37 (5.8%) |
| Total | 507 (100.0%) | 636 (100.0%) |
Real Estate Taxes by Mortgage Status in Feather Sound
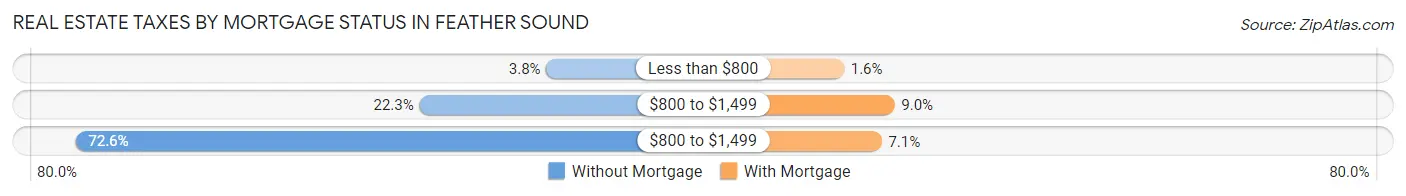
| Property Taxes | Without Mortgage | With Mortgage |
| Less than $800 | 19 (3.7%) | 10 (1.6%) |
| $800 to $1,499 | 113 (22.3%) | 57 (9.0%) |
| $800 to $1,499 | 368 (72.6%) | 45 (7.1%) |
| Total | 507 (100.0%) | 636 (100.0%) |
Health & Disability in Feather Sound
Health Insurance Coverage by Age in Feather Sound
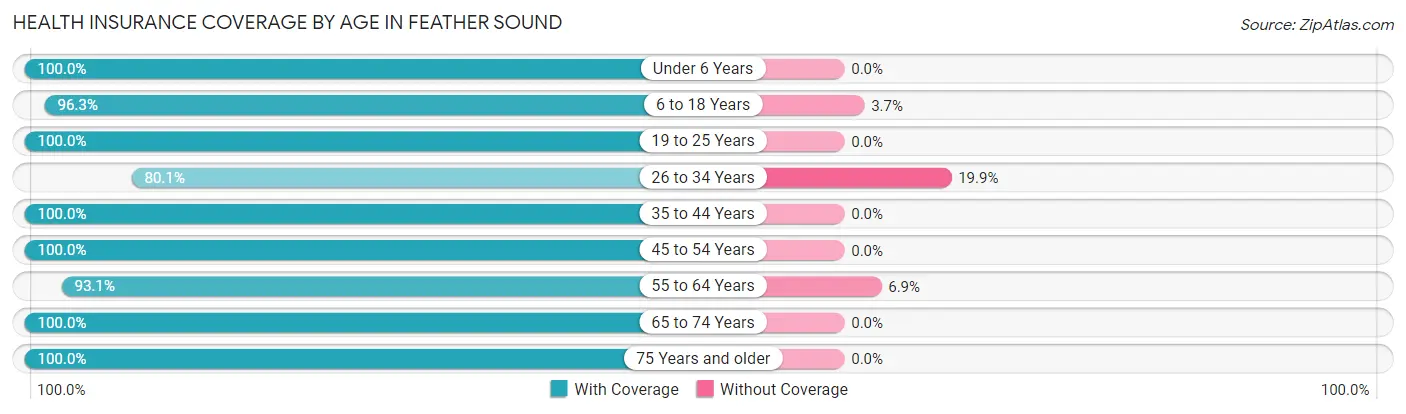
| Age Bracket | With Coverage | Without Coverage |
| Under 6 Years | 104 (100.0%) | 0 (0.0%) |
| 6 to 18 Years | 285 (96.3%) | 11 (3.7%) |
| 19 to 25 Years | 195 (100.0%) | 0 (0.0%) |
| 26 to 34 Years | 273 (80.1%) | 68 (19.9%) |
| 35 to 44 Years | 532 (100.0%) | 0 (0.0%) |
| 45 to 54 Years | 432 (100.0%) | 0 (0.0%) |
| 55 to 64 Years | 621 (93.1%) | 46 (6.9%) |
| 65 to 74 Years | 407 (100.0%) | 0 (0.0%) |
| 75 Years and older | 315 (100.0%) | 0 (0.0%) |
| Total | 3,164 (96.2%) | 125 (3.8%) |
Health Insurance Coverage by Citizenship Status in Feather Sound
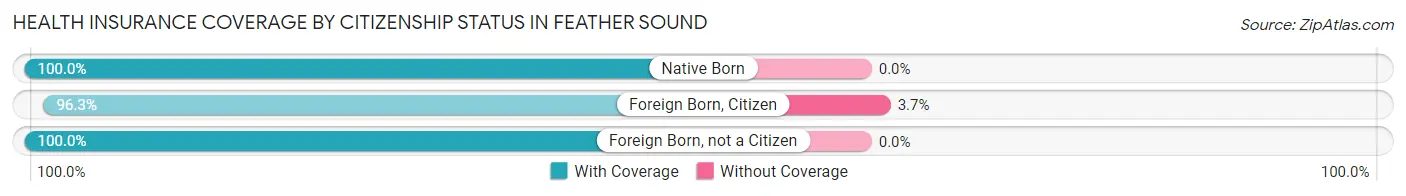
| Citizenship Status | With Coverage | Without Coverage |
| Native Born | 104 (100.0%) | 0 (0.0%) |
| Foreign Born, Citizen | 285 (96.3%) | 11 (3.7%) |
| Foreign Born, not a Citizen | 195 (100.0%) | 0 (0.0%) |
Health Insurance Coverage by Household Income in Feather Sound
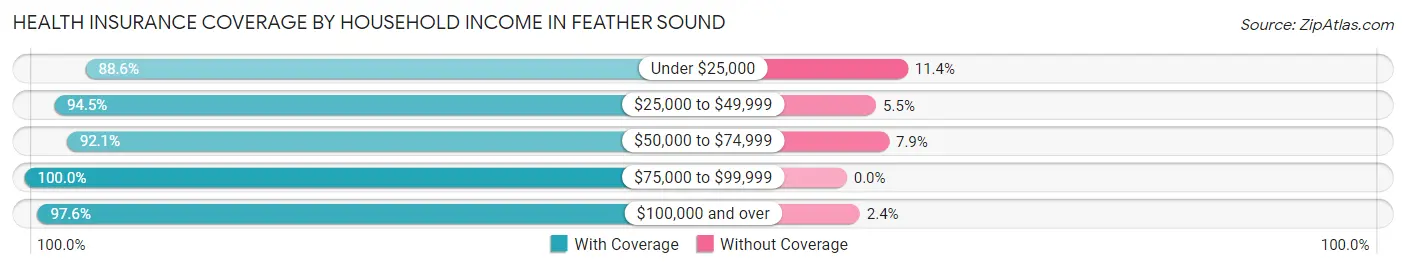
| Household Income | With Coverage | Without Coverage |
| Under $25,000 | 155 (88.6%) | 20 (11.4%) |
| $25,000 to $49,999 | 292 (94.5%) | 17 (5.5%) |
| $50,000 to $74,999 | 559 (92.1%) | 48 (7.9%) |
| $75,000 to $99,999 | 560 (100.0%) | 0 (0.0%) |
| $100,000 and over | 1,598 (97.6%) | 40 (2.4%) |
Public vs Private Health Insurance Coverage by Age in Feather Sound
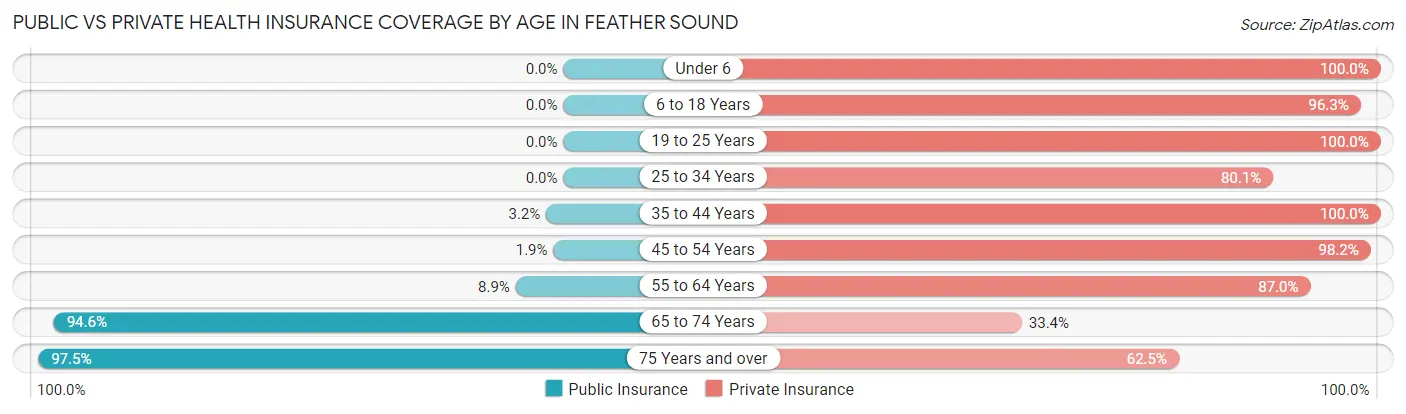
| Age Bracket | Public Insurance | Private Insurance |
| Under 6 | 0 (0.0%) | 104 (100.0%) |
| 6 to 18 Years | 0 (0.0%) | 285 (96.3%) |
| 19 to 25 Years | 0 (0.0%) | 195 (100.0%) |
| 25 to 34 Years | 0 (0.0%) | 273 (80.1%) |
| 35 to 44 Years | 17 (3.2%) | 532 (100.0%) |
| 45 to 54 Years | 8 (1.8%) | 424 (98.2%) |
| 55 to 64 Years | 59 (8.8%) | 580 (87.0%) |
| 65 to 74 Years | 385 (94.6%) | 136 (33.4%) |
| 75 Years and over | 307 (97.5%) | 197 (62.5%) |
| Total | 776 (23.6%) | 2,726 (82.9%) |
Disability Status by Sex by Age in Feather Sound
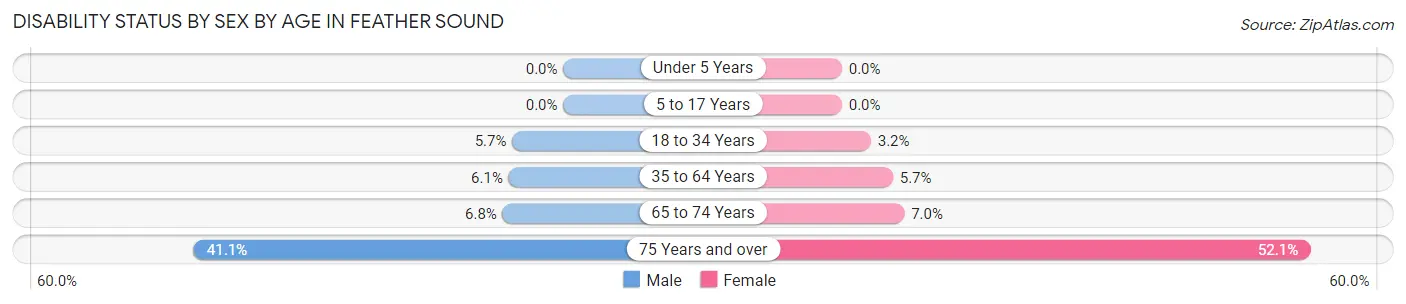
| Age Bracket | Male | Female |
| Under 5 Years | 0 (0.0%) | 0 (0.0%) |
| 5 to 17 Years | 0 (0.0%) | 0 (0.0%) |
| 18 to 34 Years | 17 (5.7%) | 8 (3.2%) |
| 35 to 64 Years | 51 (6.1%) | 45 (5.7%) |
| 65 to 74 Years | 10 (6.8%) | 18 (7.0%) |
| 75 Years and over | 72 (41.1%) | 73 (52.1%) |
Disability Class by Sex by Age in Feather Sound
Disability Class: Hearing Difficulty
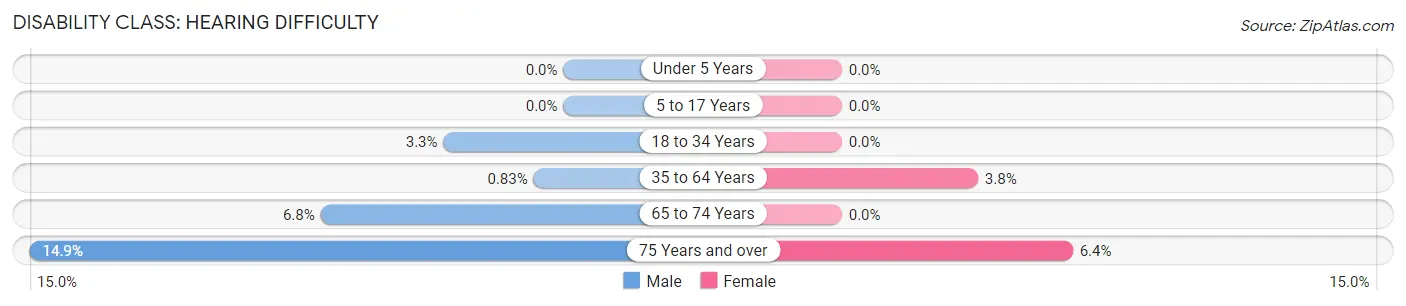
| Age Bracket | Male | Female |
| Under 5 Years | 0 (0.0%) | 0 (0.0%) |
| 5 to 17 Years | 0 (0.0%) | 0 (0.0%) |
| 18 to 34 Years | 10 (3.3%) | 0 (0.0%) |
| 35 to 64 Years | 7 (0.8%) | 30 (3.8%) |
| 65 to 74 Years | 10 (6.8%) | 0 (0.0%) |
| 75 Years and over | 26 (14.9%) | 9 (6.4%) |
Disability Class: Vision Difficulty
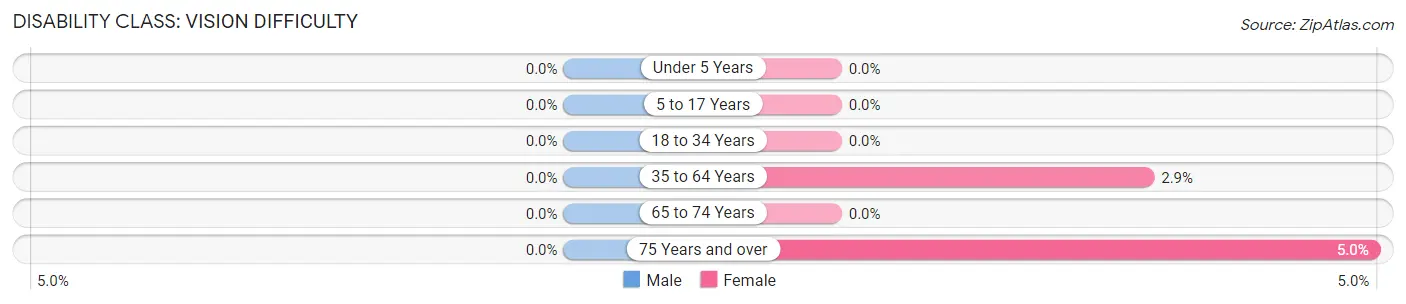
| Age Bracket | Male | Female |
| Under 5 Years | 0 (0.0%) | 0 (0.0%) |
| 5 to 17 Years | 0 (0.0%) | 0 (0.0%) |
| 18 to 34 Years | 0 (0.0%) | 0 (0.0%) |
| 35 to 64 Years | 0 (0.0%) | 23 (2.9%) |
| 65 to 74 Years | 0 (0.0%) | 0 (0.0%) |
| 75 Years and over | 0 (0.0%) | 7 (5.0%) |
Disability Class: Cognitive Difficulty
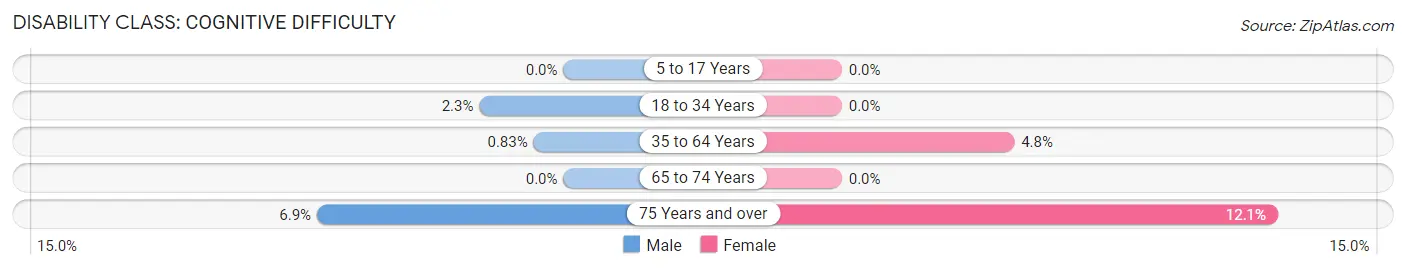
| Age Bracket | Male | Female |
| 5 to 17 Years | 0 (0.0%) | 0 (0.0%) |
| 18 to 34 Years | 7 (2.3%) | 0 (0.0%) |
| 35 to 64 Years | 7 (0.8%) | 38 (4.8%) |
| 65 to 74 Years | 0 (0.0%) | 0 (0.0%) |
| 75 Years and over | 12 (6.9%) | 17 (12.1%) |
Disability Class: Ambulatory Difficulty
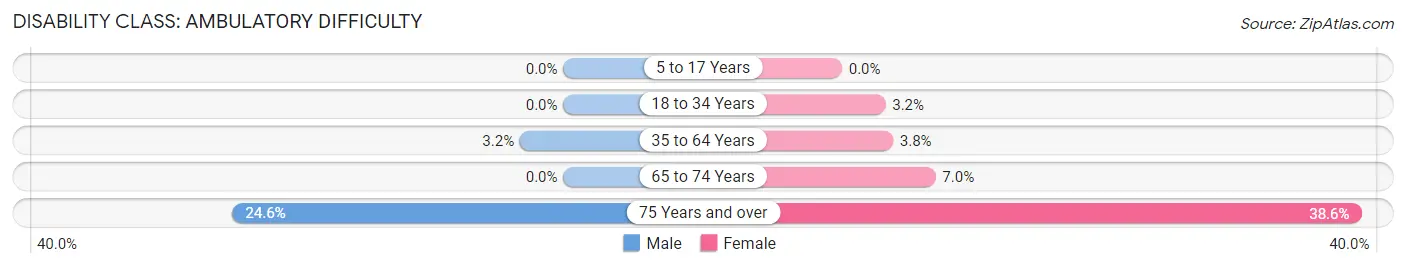
| Age Bracket | Male | Female |
| 5 to 17 Years | 0 (0.0%) | 0 (0.0%) |
| 18 to 34 Years | 0 (0.0%) | 8 (3.2%) |
| 35 to 64 Years | 27 (3.2%) | 30 (3.8%) |
| 65 to 74 Years | 0 (0.0%) | 18 (7.0%) |
| 75 Years and over | 43 (24.6%) | 54 (38.6%) |
Disability Class: Self-Care Difficulty
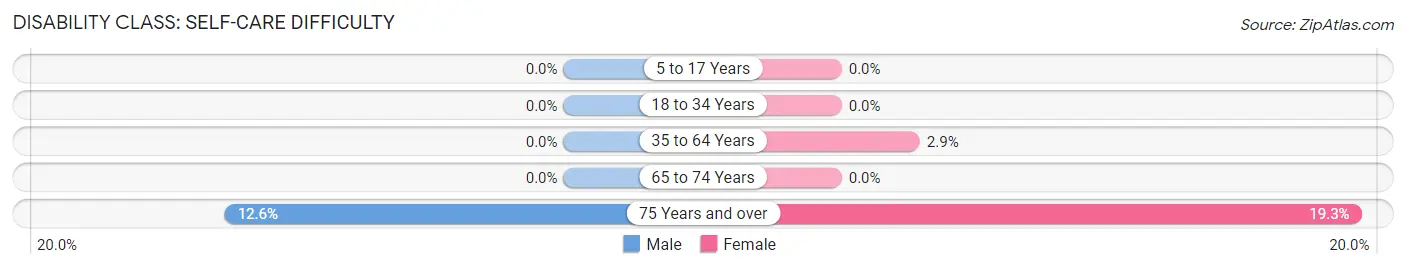
| Age Bracket | Male | Female |
| 5 to 17 Years | 0 (0.0%) | 0 (0.0%) |
| 18 to 34 Years | 0 (0.0%) | 0 (0.0%) |
| 35 to 64 Years | 0 (0.0%) | 23 (2.9%) |
| 65 to 74 Years | 0 (0.0%) | 0 (0.0%) |
| 75 Years and over | 22 (12.6%) | 27 (19.3%) |
Technology Access in Feather Sound
Computing Device Access in Feather Sound
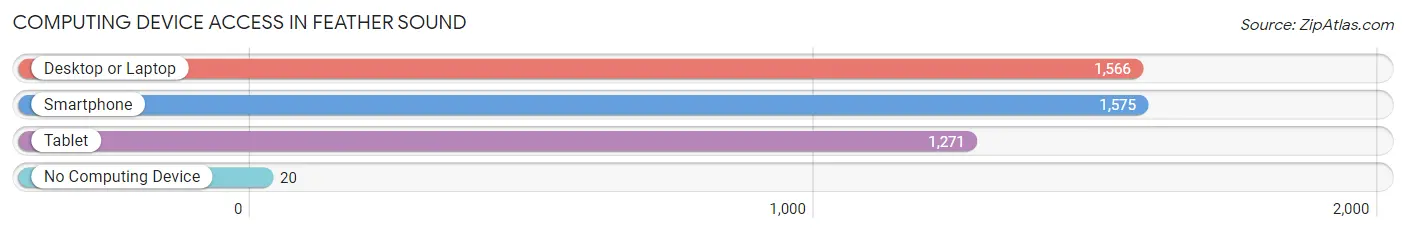
| Device Type | # Households | % Households |
| Desktop or Laptop | 1,566 | 93.9% |
| Smartphone | 1,575 | 94.4% |
| Tablet | 1,271 | 76.2% |
| No Computing Device | 20 | 1.2% |
| Total | 1,668 | 100.0% |
Internet Access in Feather Sound
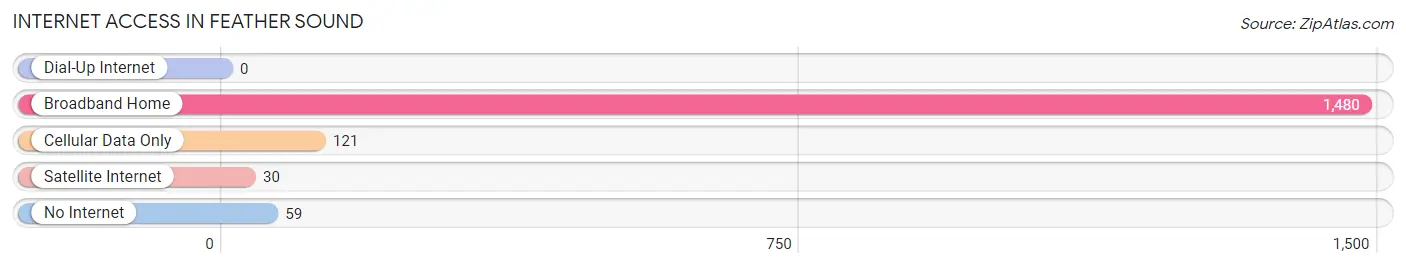
| Internet Type | # Households | % Households |
| Dial-Up Internet | 0 | 0.0% |
| Broadband Home | 1,480 | 88.7% |
| Cellular Data Only | 121 | 7.2% |
| Satellite Internet | 30 | 1.8% |
| No Internet | 59 | 3.5% |
| Total | 1,668 | 100.0% |
Feather Sound Summary
Feather Sound is an unincorporated community located in Pinellas County, Florida, United States. It is located just north of Clearwater and south of St. Petersburg. The community is part of the Tampa-St. Petersburg-Clearwater Metropolitan Statistical Area.
History
Feather Sound was originally part of the Pinellas Peninsula, which was inhabited by the Tocobaga people until the late 18th century. The area was then settled by European settlers in the early 19th century. The community was originally known as “Feathers” and was named after the abundance of feathers found in the area. The name was later changed to Feather Sound.
In the early 20th century, the area was used for farming and ranching. In the 1950s, the area began to be developed for residential use. The first homes were built in the area in the 1960s.
Geography
Feather Sound is located in Pinellas County, Florida, just north of Clearwater and south of St. Petersburg. The community is located on the west side of Tampa Bay. The area is mostly flat and is located at an elevation of 10 feet above sea level.
The climate in Feather Sound is classified as humid subtropical, with hot and humid summers and mild winters. The average temperature in the summer is around 90°F and the average temperature in the winter is around 60°F.
Economy
Feather Sound is primarily a residential community, but it is also home to several businesses. The area is home to a number of corporate offices, including those of Raymond James Financial, Jabil Circuit, and Tech Data Corporation. The area is also home to a number of restaurants, retail stores, and other businesses.
Demographics
As of the 2010 census, the population of Feather Sound was 8,945. The racial makeup of the community was 79.3% White, 8.2% African American, 0.3% Native American, 5.2% Asian, and 6.9% from other races. The median household income was $63,945 and the median family income was $71,945.
Conclusion
Feather Sound is an unincorporated community located in Pinellas County, Florida. The area was originally inhabited by the Tocobaga people and was later settled by European settlers in the early 19th century. The area is mostly flat and is located at an elevation of 10 feet above sea level. The climate in Feather Sound is classified as humid subtropical, with hot and humid summers and mild winters. The area is primarily a residential community, but it is also home to several businesses. As of the 2010 census, the population of Feather Sound was 8,945. The racial makeup of the community was 79.3% White, 8.2% African American, 0.3% Native American, 5.2% Asian, and 6.9% from other races. The median household income was $63,945 and the median family income was $71,945.
Common Questions
What is Per Capita Income in Feather Sound?
Per Capita income in Feather Sound is $67,296.
What is the Median Family Income in Feather Sound?
Median Family Income in Feather Sound is $113,523.
What is the Median Household income in Feather Sound?
Median Household Income in Feather Sound is $93,273.
What is Income or Wage Gap in Feather Sound?
Income or Wage Gap in Feather Sound is 9.1%.
Women in Feather Sound earn 90.9 cents for every dollar earned by a man.
What is Family Income Deficit in Feather Sound?
Family Income Deficit in Feather Sound is $8,215.
Families that are below poverty line in Feather Sound earn $8,215 less on average than the poverty threshold level.
What is Inequality or Gini Index in Feather Sound?
Inequality or Gini Index in Feather Sound is 0.46.
What is the Total Population of Feather Sound?
Total Population of Feather Sound is 3,289.
What is the Total Male Population of Feather Sound?
Total Male Population of Feather Sound is 1,733.
What is the Total Female Population of Feather Sound?
Total Female Population of Feather Sound is 1,556.
What is the Ratio of Males per 100 Females in Feather Sound?
There are 111.38 Males per 100 Females in Feather Sound.
What is the Ratio of Females per 100 Males in Feather Sound?
There are 89.79 Females per 100 Males in Feather Sound.
What is the Median Population Age in Feather Sound?
Median Population Age in Feather Sound is 48.5 Years.
What is the Average Family Size in Feather Sound
Average Family Size in Feather Sound is 2.5 People.
What is the Average Household Size in Feather Sound
Average Household Size in Feather Sound is 2.0 People.
How Large is the Labor Force in Feather Sound?
There are 2,126 People in the Labor Forcein in Feather Sound.
What is the Percentage of People in the Labor Force in Feather Sound?
71.5% of People are in the Labor Force in Feather Sound.
What is the Unemployment Rate in Feather Sound?
Unemployment Rate in Feather Sound is 4.1%.