Holley, FL Map & Demographics
Holley Map
Holley Overview
$42,277
PER CAPITA INCOME
$116,318
AVG FAMILY INCOME
$98,125
AVG HOUSEHOLD INCOME
41.3%
WAGE / INCOME GAP [ % ]
58.7¢/ $1
WAGE / INCOME GAP [ $ ]
0.44
INEQUALITY / GINI INDEX
2,455
TOTAL POPULATION
1,209
MALE POPULATION
1,246
FEMALE POPULATION
97.03
MALES / 100 FEMALES
103.06
FEMALES / 100 MALES
36.5
MEDIAN AGE
3.3
AVG FAMILY SIZE
2.8
AVG HOUSEHOLD SIZE
1,151
LABOR FORCE [ PEOPLE ]
63.8%
PERCENT IN LABOR FORCE
5.0%
UNEMPLOYMENT RATE
Income in Holley
Income Overview in Holley
Per Capita Income in Holley is $42,277, while median incomes of families and households are $116,318 and $98,125 respectively.
| Characteristic | Number | Measure |
| Per Capita Income | 2,455 | $42,277 |
| Median Family Income | 661 | $116,318 |
| Mean Family Income | 661 | $144,070 |
| Median Household Income | 892 | $98,125 |
| Mean Household Income | 892 | $114,746 |
| Income Deficit | 661 | $0 |
| Wage / Income Gap (%) | 2,455 | 41.34% |
| Wage / Income Gap ($) | 2,455 | 58.66¢ per $1 |
| Gini / Inequality Index | 2,455 | 0.44 |
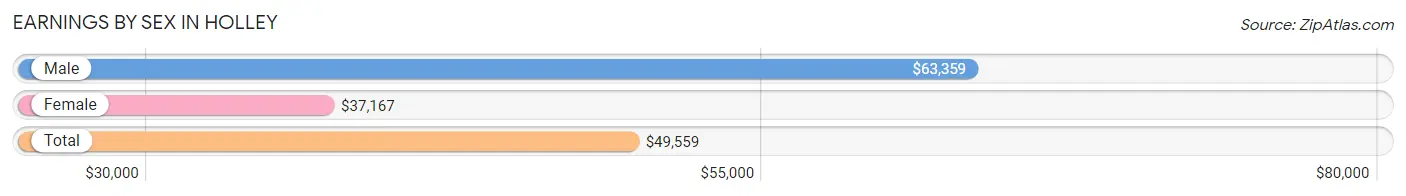
Earnings by Sex in Holley
Average Earnings in Holley are $49,559, $63,359 for men and $37,167 for women, a difference of 41.3%.
| Sex | Number | Average Earnings |
| Male | 670 (54.0%) | $63,359 |
| Female | 570 (46.0%) | $37,167 |
| Total | 1,240 (100.0%) | $49,559 |
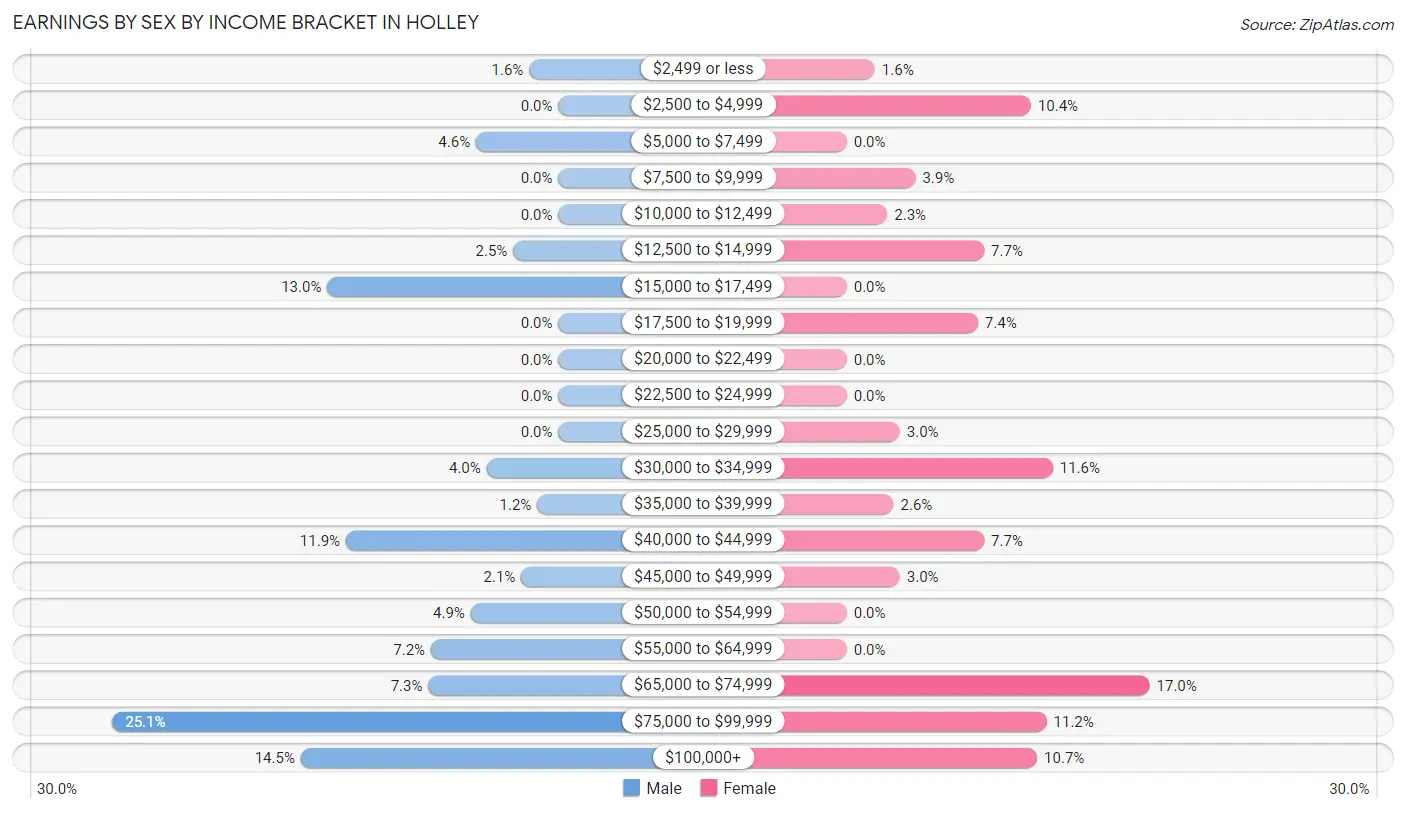
Earnings by Sex by Income Bracket in Holley
The most common earnings brackets in Holley are $75,000 to $99,999 for men (168 | 25.1%) and $65,000 to $74,999 for women (97 | 17.0%).
| Income | Male | Female |
| $2,499 or less | 11 (1.6%) | 9 (1.6%) |
| $2,500 to $4,999 | 0 (0.0%) | 59 (10.3%) |
| $5,000 to $7,499 | 31 (4.6%) | 0 (0.0%) |
| $7,500 to $9,999 | 0 (0.0%) | 22 (3.9%) |
| $10,000 to $12,499 | 0 (0.0%) | 13 (2.3%) |
| $12,500 to $14,999 | 17 (2.5%) | 44 (7.7%) |
| $15,000 to $17,499 | 87 (13.0%) | 0 (0.0%) |
| $17,500 to $19,999 | 0 (0.0%) | 42 (7.4%) |
| $20,000 to $22,499 | 0 (0.0%) | 0 (0.0%) |
| $22,500 to $24,999 | 0 (0.0%) | 0 (0.0%) |
| $25,000 to $29,999 | 0 (0.0%) | 17 (3.0%) |
| $30,000 to $34,999 | 27 (4.0%) | 66 (11.6%) |
| $35,000 to $39,999 | 8 (1.2%) | 15 (2.6%) |
| $40,000 to $44,999 | 80 (11.9%) | 44 (7.7%) |
| $45,000 to $49,999 | 14 (2.1%) | 17 (3.0%) |
| $50,000 to $54,999 | 33 (4.9%) | 0 (0.0%) |
| $55,000 to $64,999 | 48 (7.2%) | 0 (0.0%) |
| $65,000 to $74,999 | 49 (7.3%) | 97 (17.0%) |
| $75,000 to $99,999 | 168 (25.1%) | 64 (11.2%) |
| $100,000+ | 97 (14.5%) | 61 (10.7%) |
| Total | 670 (100.0%) | 570 (100.0%) |
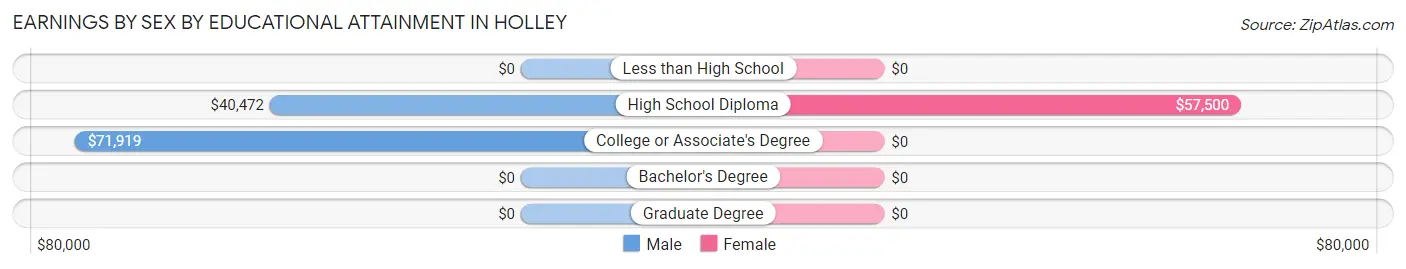
Earnings by Sex by Educational Attainment in Holley
Average earnings in Holley are $70,058 for men and $40,664 for women, a difference of 42.0%. Men with an educational attainment of college or associate's degree enjoy the highest average annual earnings of $71,919, while those with high school diploma education earn the least with $40,472. Women with an educational attainment of high school diploma earn the most with the average annual earnings of $57,500, while those with high school diploma education have the smallest earnings of $57,500.
| Educational Attainment | Male Income | Female Income |
| Less than High School | - | - |
| High School Diploma | $40,472 | $57,500 |
| College or Associate's Degree | $71,919 | $0 |
| Bachelor's Degree | - | - |
| Graduate Degree | - | - |
| Total | $70,058 | $40,664 |
Family Income in Holley
Family Income Brackets in Holley
According to the Holley family income data, there are 204 families falling into the $200,000+ income range, which is the most common income bracket and makes up 30.9% of all families.
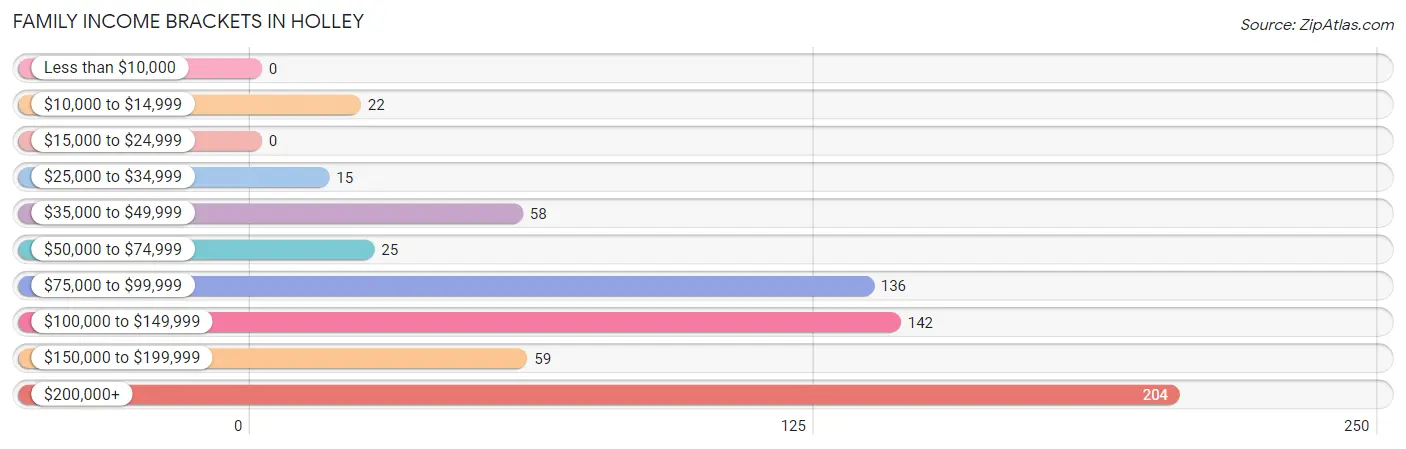
| Income Bracket | # Families | % Families |
| Less than $10,000 | 0 | 0.0% |
| $10,000 to $14,999 | 22 | 3.3% |
| $15,000 to $24,999 | 0 | 0.0% |
| $25,000 to $34,999 | 15 | 2.3% |
| $35,000 to $49,999 | 58 | 8.8% |
| $50,000 to $74,999 | 25 | 3.8% |
| $75,000 to $99,999 | 136 | 20.6% |
| $100,000 to $149,999 | 142 | 21.5% |
| $150,000 to $199,999 | 59 | 8.9% |
| $200,000+ | 204 | 30.9% |
Family Income by Famaliy Size in Holley
5-person families (125 | 18.9%) account for the highest median family income in Holley with $184,199 per family, while 2-person families (242 | 36.6%) have the highest median income of $49,102 per family member.
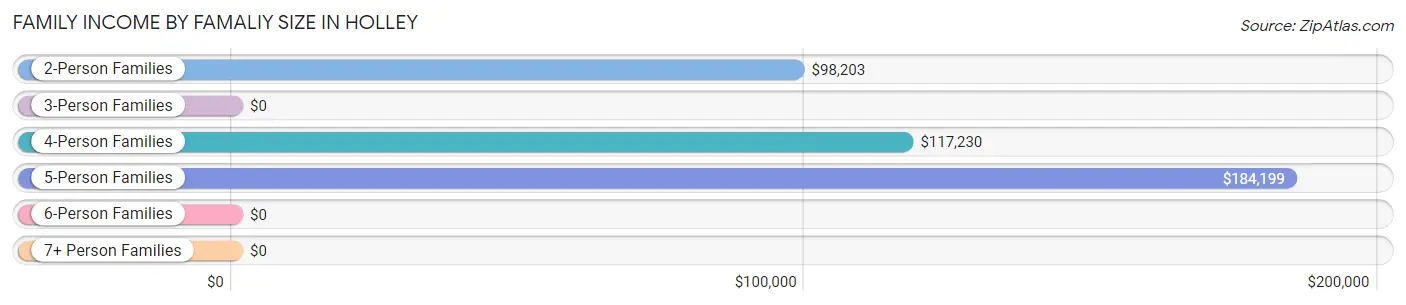
| Income Bracket | # Families | Median Income |
| 2-Person Families | 242 (36.6%) | $98,203 |
| 3-Person Families | 148 (22.4%) | $0 |
| 4-Person Families | 108 (16.3%) | $117,230 |
| 5-Person Families | 125 (18.9%) | $184,199 |
| 6-Person Families | 38 (5.8%) | $0 |
| 7+ Person Families | 0 (0.0%) | $0 |
| Total | 661 (100.0%) | $116,318 |
Family Income by Number of Earners in Holley
The median family income in Holley is $116,318, with families comprising 3+ earners (54) having the highest median family income of $245,676, while families with 1 earner (104) have the lowest median family income of $78,750, accounting for 8.2% and 15.7% of families, respectively.
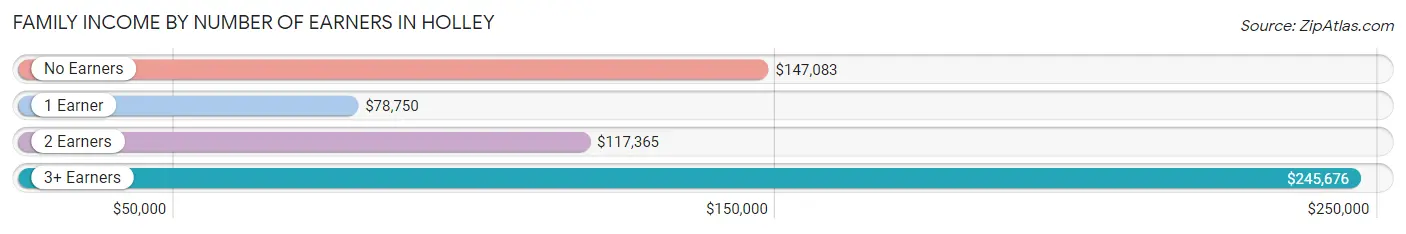
| Number of Earners | # Families | Median Income |
| No Earners | 91 (13.8%) | $147,083 |
| 1 Earner | 104 (15.7%) | $78,750 |
| 2 Earners | 412 (62.3%) | $117,365 |
| 3+ Earners | 54 (8.2%) | $245,676 |
| Total | 661 (100.0%) | $116,318 |
Household Income in Holley
Household Income Brackets in Holley
With 204 households falling in the category, the $200,000+ income range is the most frequent in Holley, accounting for 22.9% of all households. In contrast, only 17 households (1.9%) fall into the $10,000 to $14,999 income bracket, making it the least populous group.
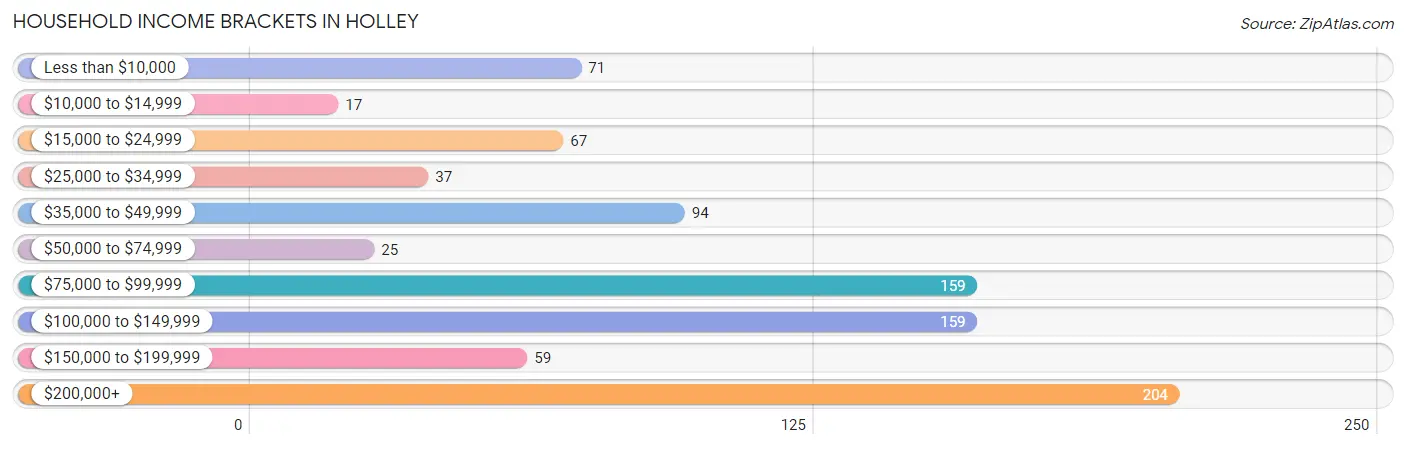
| Income Bracket | # Households | % Households |
| Less than $10,000 | 71 | 8.0% |
| $10,000 to $14,999 | 17 | 1.9% |
| $15,000 to $24,999 | 67 | 7.5% |
| $25,000 to $34,999 | 37 | 4.1% |
| $35,000 to $49,999 | 94 | 10.5% |
| $50,000 to $74,999 | 25 | 2.8% |
| $75,000 to $99,999 | 159 | 17.8% |
| $100,000 to $149,999 | 159 | 17.8% |
| $150,000 to $199,999 | 59 | 6.6% |
| $200,000+ | 204 | 22.9% |
Household Income by Householder Age in Holley
The median household income in Holley is $98,125, with the highest median household income of $116,723 found in the 25 to 44 years age bracket for the primary householder. A total of 357 households (40.0%) fall into this category. Meanwhile, the 15 to 24 years age bracket for the primary householder has the lowest median household income of $0, with 9 households (1.0%) in this group.
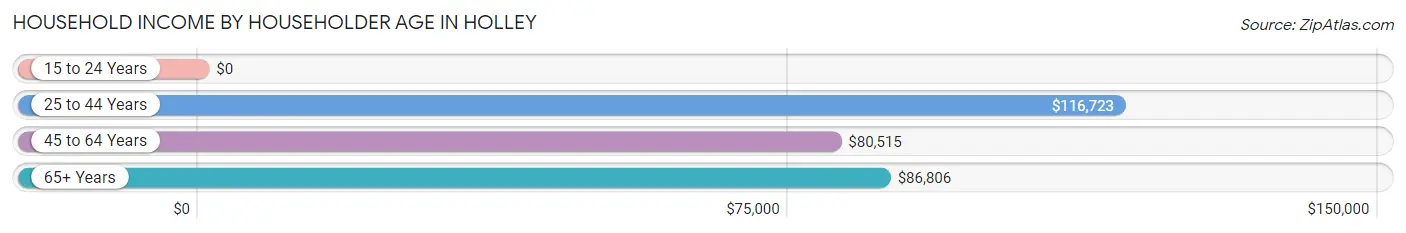
| Income Bracket | # Households | Median Income |
| 15 to 24 Years | 9 (1.0%) | $0 |
| 25 to 44 Years | 357 (40.0%) | $116,723 |
| 45 to 64 Years | 315 (35.3%) | $80,515 |
| 65+ Years | 211 (23.6%) | $86,806 |
| Total | 892 (100.0%) | $98,125 |
Poverty in Holley
Income Below Poverty by Sex and Age in Holley
With 8.3% poverty level for males and 8.1% for females among the residents of Holley, 65 to 74 year old males and 16 and 17 year old females are the most vulnerable to poverty, with 51 males (24.1%) and 21 females (75.0%) in their respective age groups living below the poverty level.
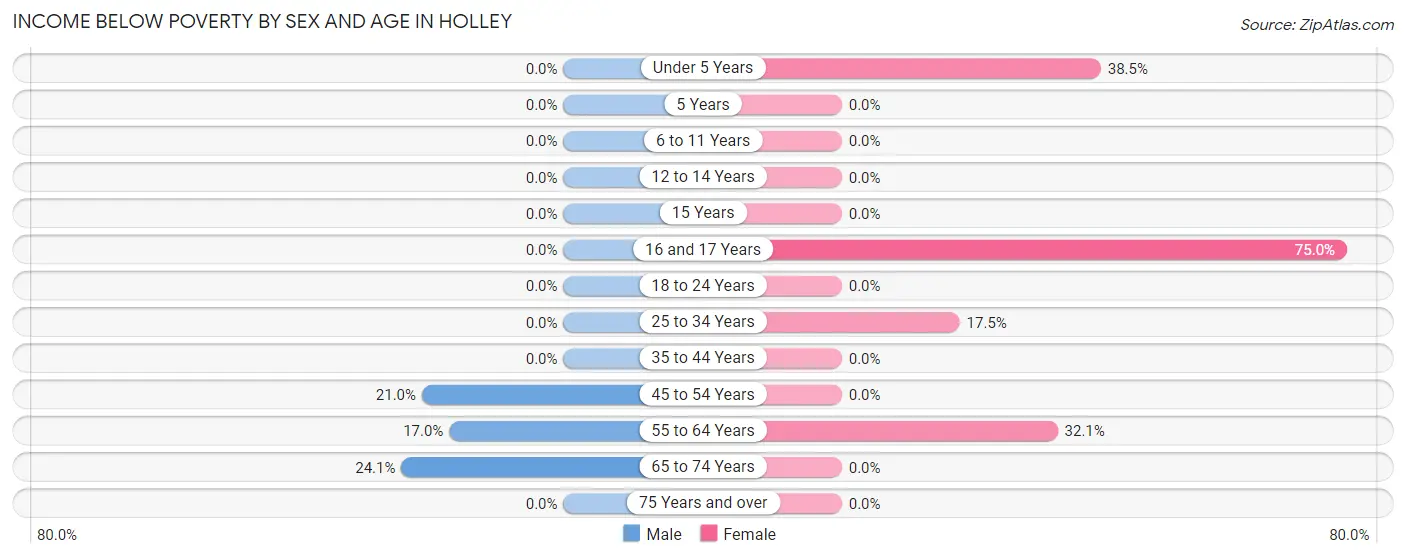
| Age Bracket | Male | Female |
| Under 5 Years | 0 (0.0%) | 20 (38.5%) |
| 5 Years | 0 (0.0%) | 0 (0.0%) |
| 6 to 11 Years | 0 (0.0%) | 0 (0.0%) |
| 12 to 14 Years | 0 (0.0%) | 0 (0.0%) |
| 15 Years | 0 (0.0%) | 0 (0.0%) |
| 16 and 17 Years | 0 (0.0%) | 21 (75.0%) |
| 18 to 24 Years | 0 (0.0%) | 0 (0.0%) |
| 25 to 34 Years | 0 (0.0%) | 35 (17.5%) |
| 35 to 44 Years | 0 (0.0%) | 0 (0.0%) |
| 45 to 54 Years | 29 (21.0%) | 0 (0.0%) |
| 55 to 64 Years | 20 (17.0%) | 25 (32.1%) |
| 65 to 74 Years | 51 (24.1%) | 0 (0.0%) |
| 75 Years and over | 0 (0.0%) | 0 (0.0%) |
| Total | 100 (8.3%) | 101 (8.1%) |
Income Above Poverty by Sex and Age in Holley
According to the poverty statistics in Holley, males aged under 5 years and females aged 5 years are the age groups that are most secure financially, with 100.0% of males and 100.0% of females in these age groups living above the poverty line.
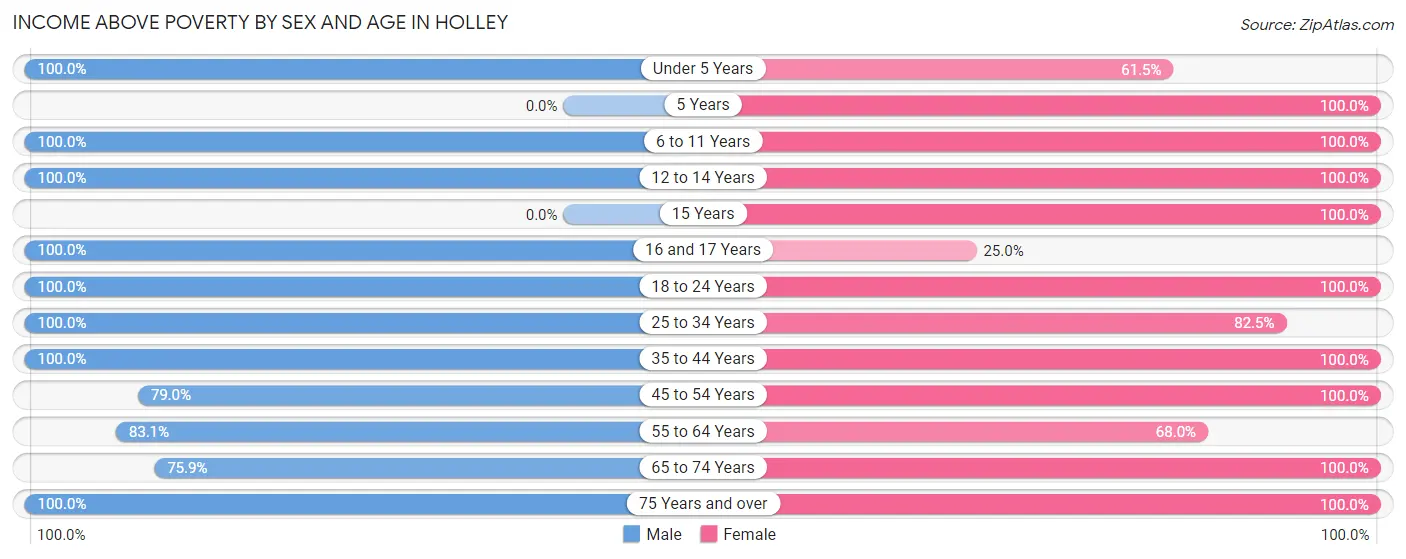
| Age Bracket | Male | Female |
| Under 5 Years | 90 (100.0%) | 32 (61.5%) |
| 5 Years | 0 (0.0%) | 30 (100.0%) |
| 6 to 11 Years | 123 (100.0%) | 228 (100.0%) |
| 12 to 14 Years | 30 (100.0%) | 91 (100.0%) |
| 15 Years | 0 (0.0%) | 7 (100.0%) |
| 16 and 17 Years | 32 (100.0%) | 7 (25.0%) |
| 18 to 24 Years | 24 (100.0%) | 21 (100.0%) |
| 25 to 34 Years | 156 (100.0%) | 165 (82.5%) |
| 35 to 44 Years | 231 (100.0%) | 114 (100.0%) |
| 45 to 54 Years | 109 (79.0%) | 174 (100.0%) |
| 55 to 64 Years | 98 (83.1%) | 53 (67.9%) |
| 65 to 74 Years | 161 (75.9%) | 153 (100.0%) |
| 75 Years and over | 55 (100.0%) | 70 (100.0%) |
| Total | 1,109 (91.7%) | 1,145 (91.9%) |
Income Below Poverty Among Married-Couple Families in Holley
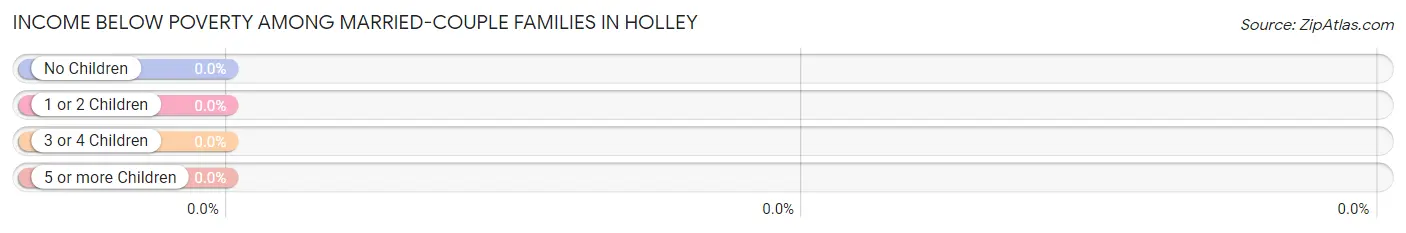
| Children | Above Poverty | Below Poverty |
| No Children | 268 (100.0%) | 0 (0.0%) |
| 1 or 2 Children | 191 (100.0%) | 0 (0.0%) |
| 3 or 4 Children | 125 (100.0%) | 0 (0.0%) |
| 5 or more Children | 0 (0.0%) | 0 (0.0%) |
| Total | 584 (100.0%) | 0 (0.0%) |
Income Below Poverty Among Single-Parent Households in Holley
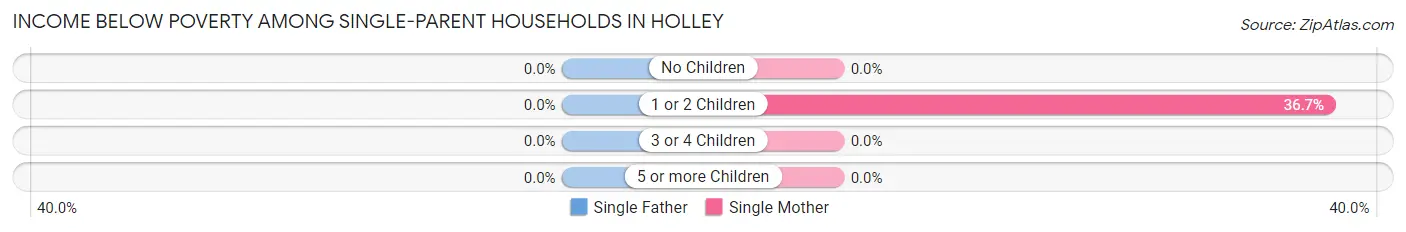
| Children | Single Father | Single Mother |
| No Children | 0 (0.0%) | 0 (0.0%) |
| 1 or 2 Children | 0 (0.0%) | 22 (36.7%) |
| 3 or 4 Children | 0 (0.0%) | 0 (0.0%) |
| 5 or more Children | 0 (0.0%) | 0 (0.0%) |
| Total | 0 (0.0%) | 22 (31.9%) |
Income Below Poverty Among Married-Couple vs Single-Parent Households in Holley
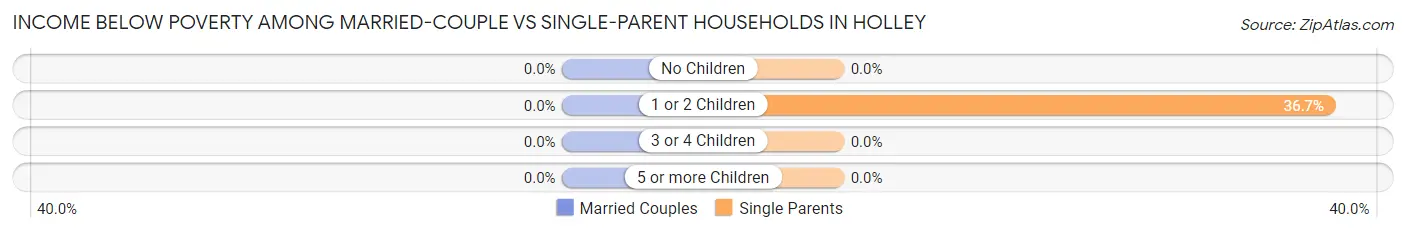
| Children | Married-Couple Families | Single-Parent Households |
| No Children | 0 (0.0%) | 0 (0.0%) |
| 1 or 2 Children | 0 (0.0%) | 22 (36.7%) |
| 3 or 4 Children | 0 (0.0%) | 0 (0.0%) |
| 5 or more Children | 0 (0.0%) | 0 (0.0%) |
| Total | 0 (0.0%) | 22 (28.6%) |
Race in Holley
The most populous races in Holley are White / Caucasian (1,966 | 80.1%), Black / African American (344 | 14.0%), and Two or more Races (136 | 5.5%).
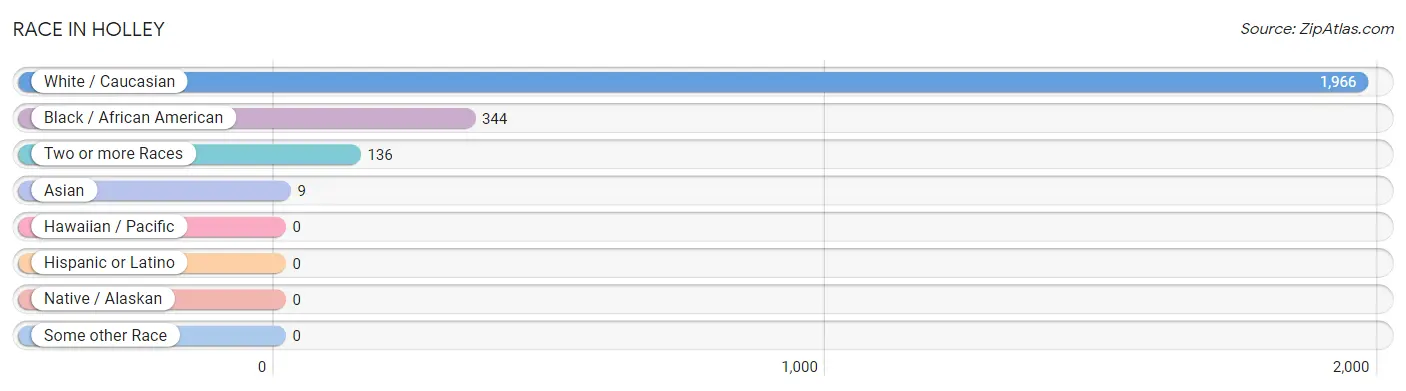
| Race | # Population | % Population |
| Asian | 9 | 0.4% |
| Black / African American | 344 | 14.0% |
| Hawaiian / Pacific | 0 | 0.0% |
| Hispanic or Latino | 0 | 0.0% |
| Native / Alaskan | 0 | 0.0% |
| White / Caucasian | 1,966 | 80.1% |
| Two or more Races | 136 | 5.5% |
| Some other Race | 0 | 0.0% |
| Total | 2,455 | 100.0% |
Ancestry in Holley
The most populous ancestries reported in Holley are Irish (504 | 20.5%), American (390 | 15.9%), German (269 | 11.0%), English (228 | 9.3%), and Korean (101 | 4.1%), together accounting for 60.8% of all Holley residents.
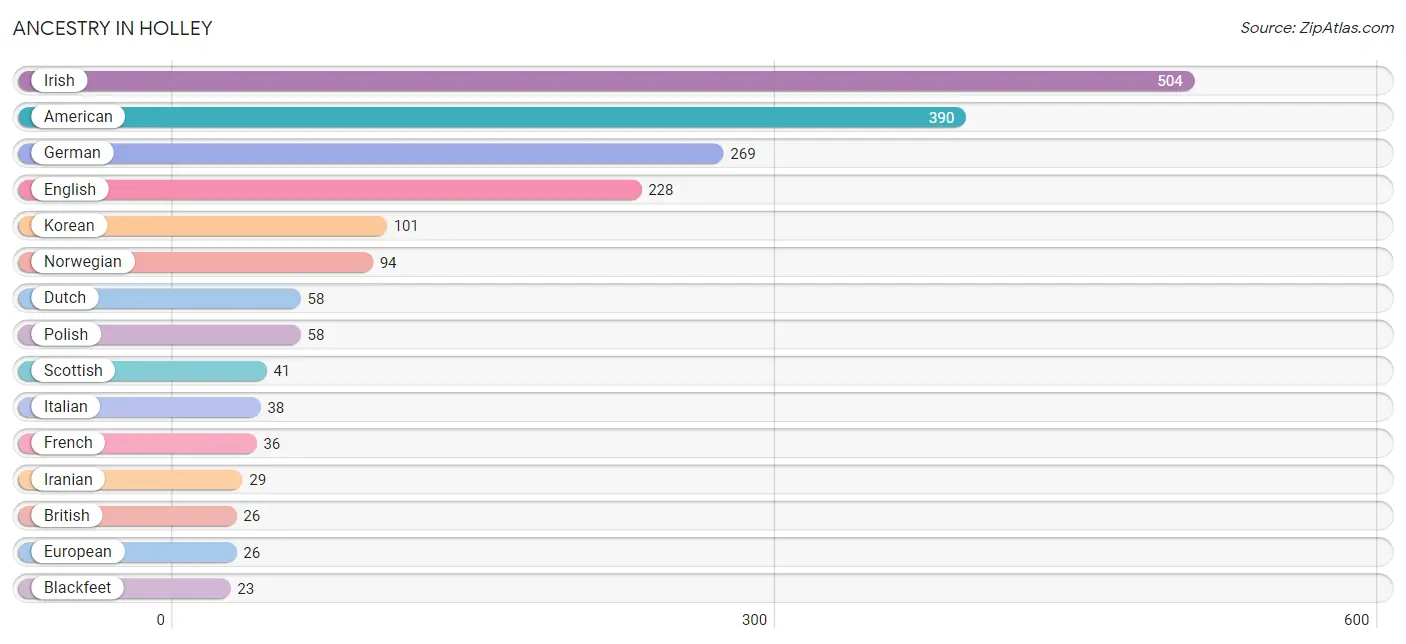
| Ancestry | # Population | % Population |
| American | 390 | 15.9% |
| Arab | 17 | 0.7% |
| Blackfeet | 23 | 0.9% |
| British | 26 | 1.1% |
| Danish | 13 | 0.5% |
| Dutch | 58 | 2.4% |
| English | 228 | 9.3% |
| European | 26 | 1.1% |
| French | 36 | 1.5% |
| German | 269 | 11.0% |
| Iranian | 29 | 1.2% |
| Irish | 504 | 20.5% |
| Italian | 38 | 1.5% |
| Korean | 101 | 4.1% |
| Lebanese | 17 | 0.7% |
| Norwegian | 94 | 3.8% |
| Polish | 58 | 2.4% |
| Scotch-Irish | 7 | 0.3% |
| Scottish | 41 | 1.7% |
| Swedish | 17 | 0.7% |
| Welsh | 8 | 0.3% | View All 21 Rows |
Immigrants in Holley
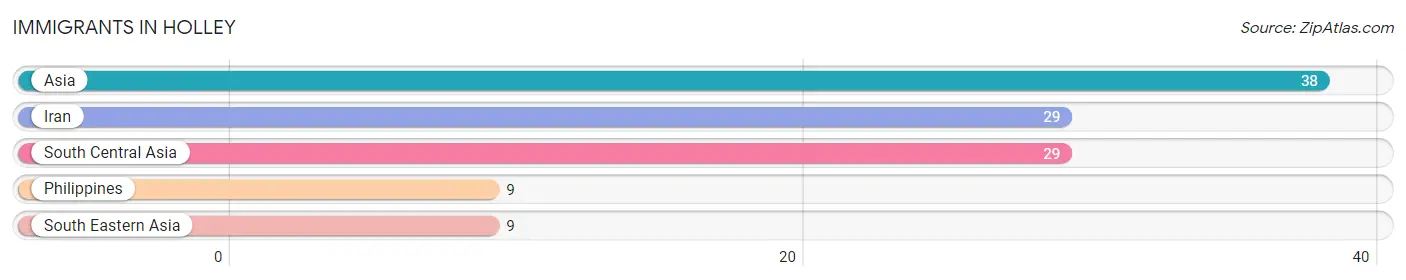
The most numerous immigrant groups reported in Holley came from Asia (38 | 1.5%), Iran (29 | 1.2%), South Central Asia (29 | 1.2%), Philippines (9 | 0.4%), and South Eastern Asia (9 | 0.4%), together accounting for 4.6% of all Holley residents.
| Immigration Origin | # Population | % Population |
| Asia | 38 | 1.5% |
| Iran | 29 | 1.2% |
| Philippines | 9 | 0.4% |
| South Central Asia | 29 | 1.2% |
| South Eastern Asia | 9 | 0.4% | View All 5 Rows |
Sex and Age in Holley
Sex and Age in Holley
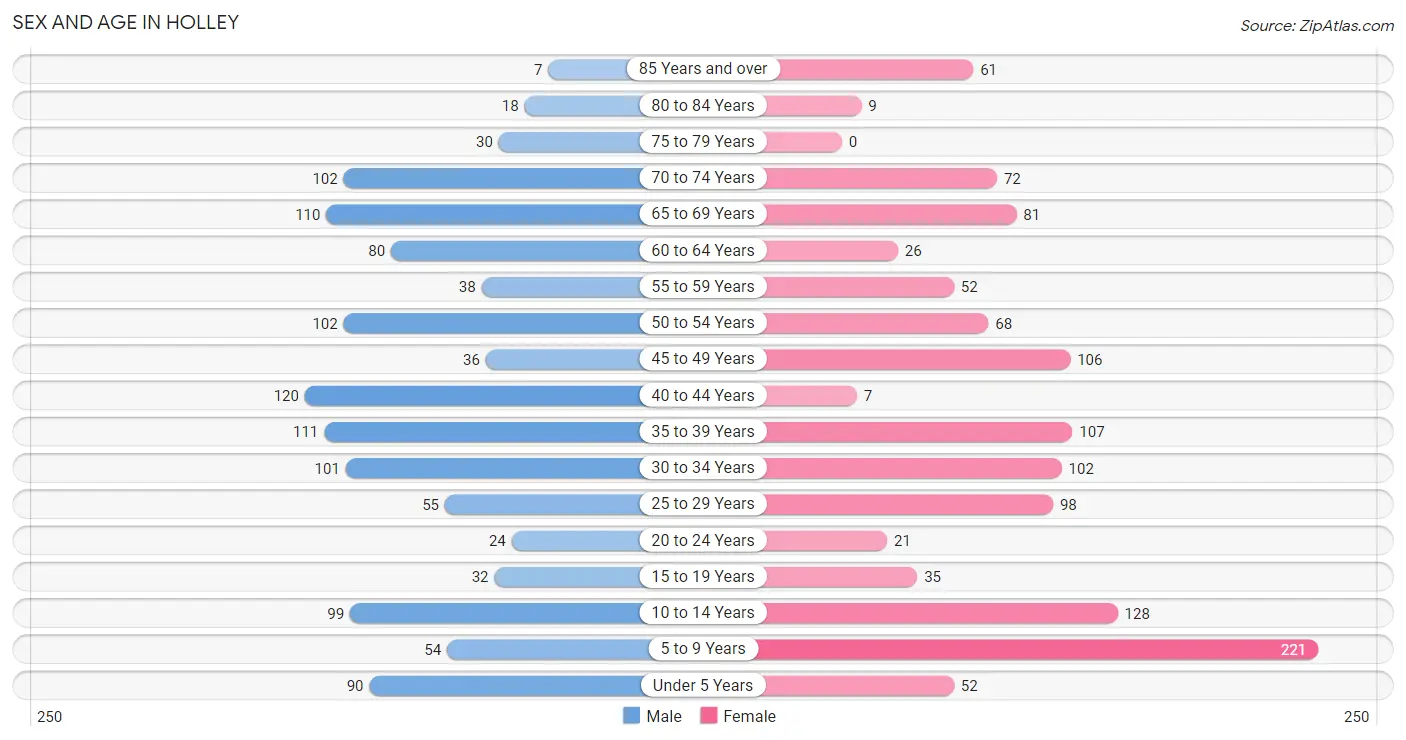
The most populous age groups in Holley are 40 to 44 Years (120 | 9.9%) for men and 5 to 9 Years (221 | 17.7%) for women.
| Age Bracket | Male | Female |
| Under 5 Years | 90 (7.4%) | 52 (4.2%) |
| 5 to 9 Years | 54 (4.5%) | 221 (17.7%) |
| 10 to 14 Years | 99 (8.2%) | 128 (10.3%) |
| 15 to 19 Years | 32 (2.6%) | 35 (2.8%) |
| 20 to 24 Years | 24 (2.0%) | 21 (1.7%) |
| 25 to 29 Years | 55 (4.5%) | 98 (7.9%) |
| 30 to 34 Years | 101 (8.4%) | 102 (8.2%) |
| 35 to 39 Years | 111 (9.2%) | 107 (8.6%) |
| 40 to 44 Years | 120 (9.9%) | 7 (0.6%) |
| 45 to 49 Years | 36 (3.0%) | 106 (8.5%) |
| 50 to 54 Years | 102 (8.4%) | 68 (5.5%) |
| 55 to 59 Years | 38 (3.1%) | 52 (4.2%) |
| 60 to 64 Years | 80 (6.6%) | 26 (2.1%) |
| 65 to 69 Years | 110 (9.1%) | 81 (6.5%) |
| 70 to 74 Years | 102 (8.4%) | 72 (5.8%) |
| 75 to 79 Years | 30 (2.5%) | 0 (0.0%) |
| 80 to 84 Years | 18 (1.5%) | 9 (0.7%) |
| 85 Years and over | 7 (0.6%) | 61 (4.9%) |
| Total | 1,209 (100.0%) | 1,246 (100.0%) |
Families and Households in Holley
Median Family Size in Holley
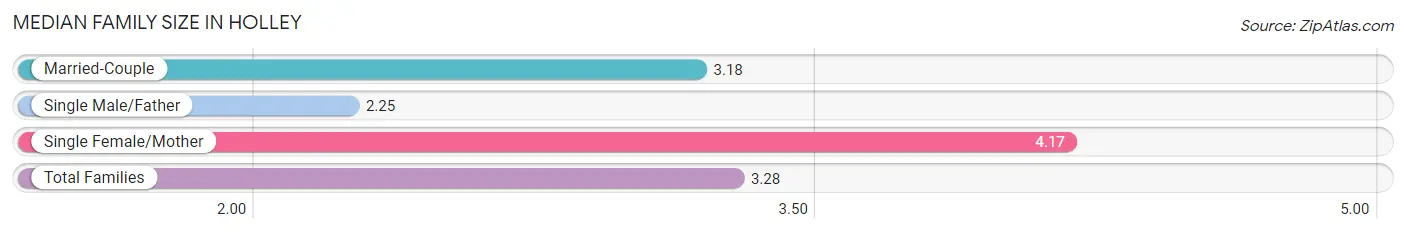
The median family size in Holley is 3.28 persons per family, with single female/mother families (69 | 10.4%) accounting for the largest median family size of 4.17 persons per family. On the other hand, single male/father families (8 | 1.2%) represent the smallest median family size with 2.25 persons per family.
| Family Type | # Families | Family Size |
| Married-Couple | 584 (88.3%) | 3.18 |
| Single Male/Father | 8 (1.2%) | 2.25 |
| Single Female/Mother | 69 (10.4%) | 4.17 |
| Total Families | 661 (100.0%) | 3.28 |
Median Household Size in Holley
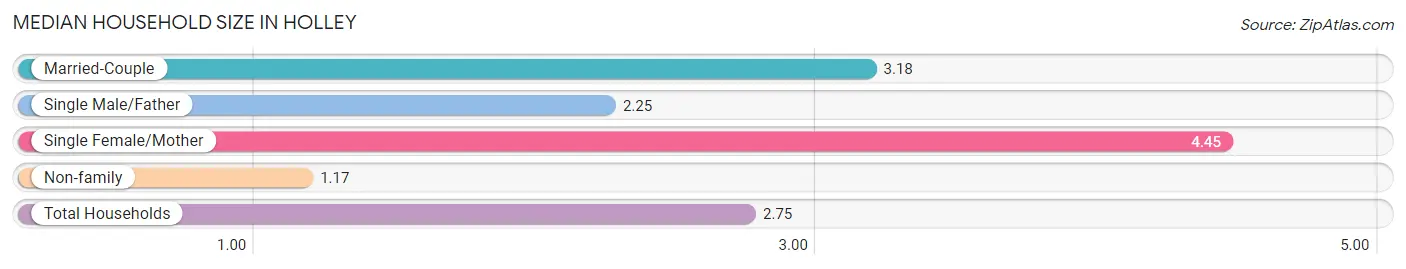
The median household size in Holley is 2.75 persons per household, with single female/mother households (69 | 7.7%) accounting for the largest median household size of 4.45 persons per household. non-family households (231 | 25.9%) represent the smallest median household size with 1.17 persons per household.
| Household Type | # Households | Household Size |
| Married-Couple | 584 (65.5%) | 3.18 |
| Single Male/Father | 8 (0.9%) | 2.25 |
| Single Female/Mother | 69 (7.7%) | 4.45 |
| Non-family | 231 (25.9%) | 1.17 |
| Total Households | 892 (100.0%) | 2.75 |
Household Size by Marriage Status in Holley
Out of a total of 892 households in Holley, 661 (74.1%) are family households, while 231 (25.9%) are nonfamily households. The most numerous type of family households are 2-person households, comprising 242, and the most common type of nonfamily households are 1-person households, comprising 205.
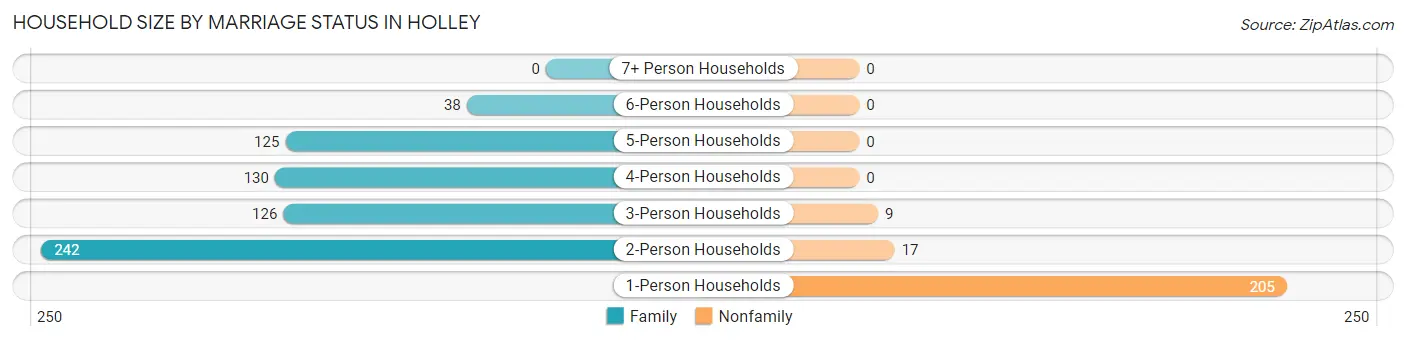
| Household Size | Family Households | Nonfamily Households |
| 1-Person Households | - | 205 (23.0%) |
| 2-Person Households | 242 (27.1%) | 17 (1.9%) |
| 3-Person Households | 126 (14.1%) | 9 (1.0%) |
| 4-Person Households | 130 (14.6%) | 0 (0.0%) |
| 5-Person Households | 125 (14.0%) | 0 (0.0%) |
| 6-Person Households | 38 (4.3%) | 0 (0.0%) |
| 7+ Person Households | 0 (0.0%) | 0 (0.0%) |
| Total | 661 (74.1%) | 231 (25.9%) |
Female Fertility in Holley
Fertility by Age in Holley
Average fertility rate in Holley is 149.0 births per 1,000 women. Women in the age bracket of 20 to 34 years have the highest fertility rate with 321.0 births per 1,000 women. Women in the age bracket of 20 to 34 years acount for 100.0% of all women with births.
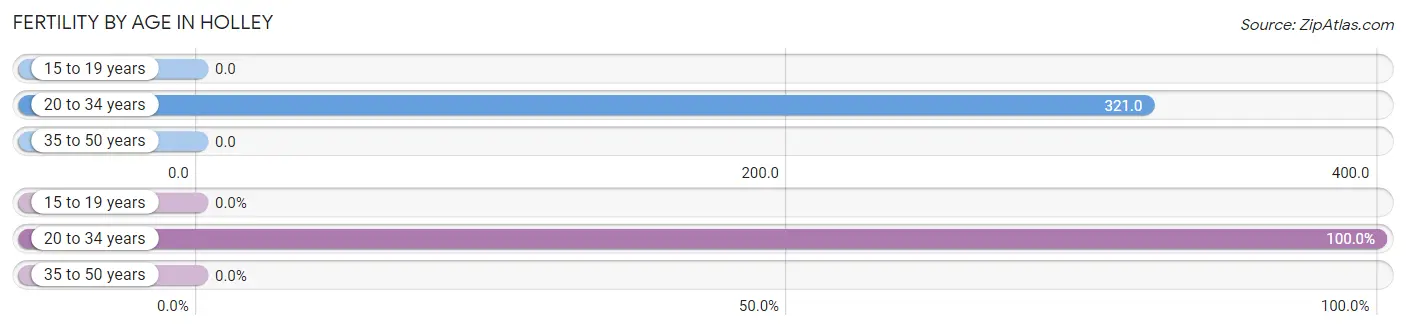
| Age Bracket | Women with Births | Births / 1,000 Women |
| 15 to 19 years | 0 (0.0%) | 0.0 |
| 20 to 34 years | 71 (100.0%) | 321.0 |
| 35 to 50 years | 0 (0.0%) | 0.0 |
| Total | 71 (100.0%) | 149.0 |
Fertility by Age by Marriage Status in Holley
69.0% of women with births (71) in Holley are married. The highest percentage of unmarried women with births falls into 20 to 34 years age bracket with 31.0% of them unmarried at the time of birth, while the lowest percentage of unmarried women with births belong to 20 to 34 years age bracket with 31.0% of them unmarried.
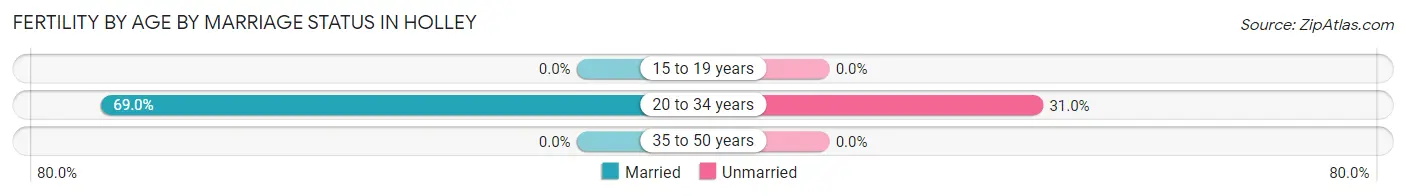
| Age Bracket | Married | Unmarried |
| 15 to 19 years | 0 (0.0%) | 0 (0.0%) |
| 20 to 34 years | 49 (69.0%) | 22 (31.0%) |
| 35 to 50 years | 0 (0.0%) | 0 (0.0%) |
| Total | 49 (69.0%) | 22 (31.0%) |
Fertility by Education in Holley
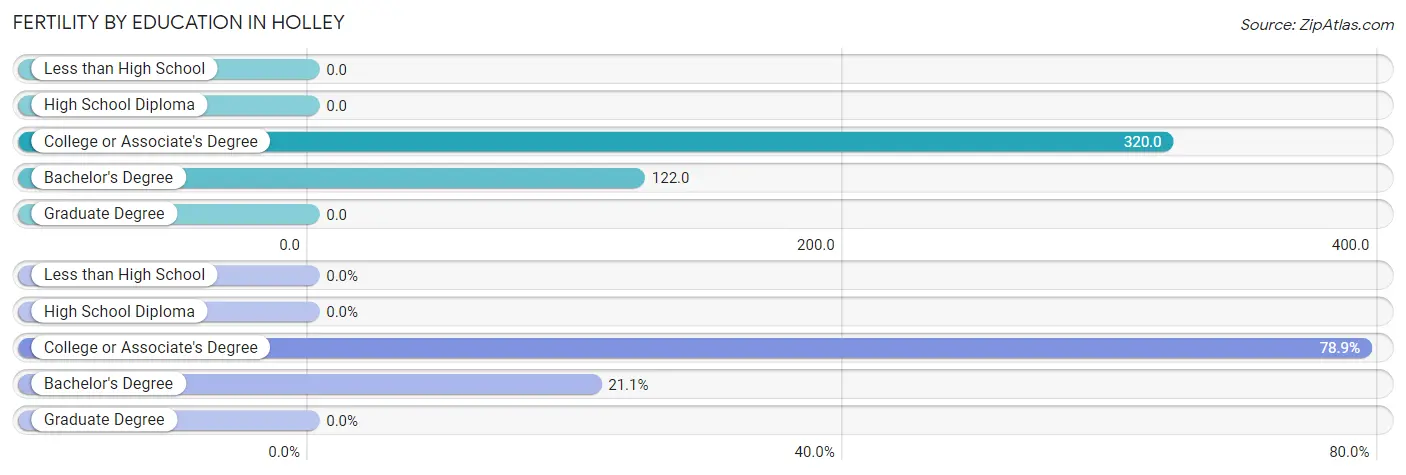
| Educational Attainment | Women with Births | Births / 1,000 Women |
| Less than High School | 0 (0.0%) | 0.0 |
| High School Diploma | 0 (0.0%) | 0.0 |
| College or Associate's Degree | 56 (78.9%) | 320.0 |
| Bachelor's Degree | 15 (21.1%) | 122.0 |
| Graduate Degree | 0 (0.0%) | 0.0 |
| Total | 71 (100.0%) | 149.0 |
Fertility by Education by Marriage Status in Holley
31.0% of women with births in Holley are unmarried. Women with the educational attainment of bachelor's degree are most likely to be married with 100.0% of them married at childbirth, while women with the educational attainment of college or associate's degree are least likely to be married with 39.3% of them unmarried at childbirth.
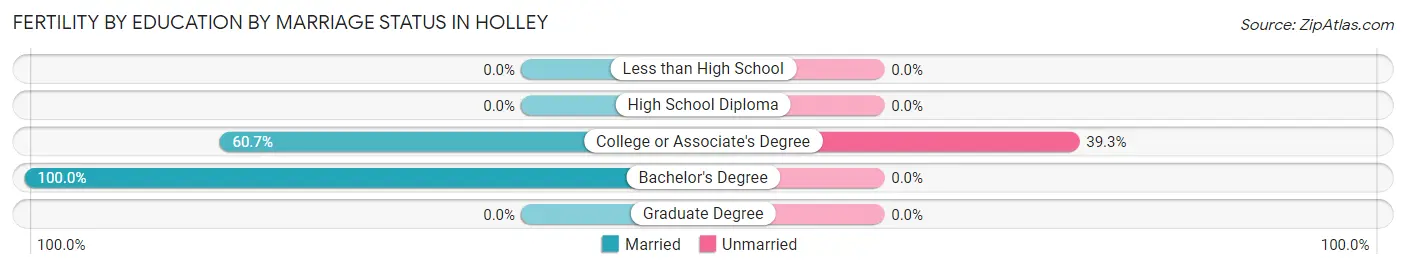
| Educational Attainment | Married | Unmarried |
| Less than High School | 0 (0.0%) | 0 (0.0%) |
| High School Diploma | 0 (0.0%) | 0 (0.0%) |
| College or Associate's Degree | 34 (60.7%) | 22 (39.3%) |
| Bachelor's Degree | 15 (100.0%) | 0 (0.0%) |
| Graduate Degree | 0 (0.0%) | 0 (0.0%) |
| Total | 49 (69.0%) | 22 (31.0%) |
Employment Characteristics in Holley
Employment by Class of Employer in Holley
Among the 1,074 employed individuals in Holley, private company employees (438 | 40.8%), federal government employees (317 | 29.5%), and local government employees (194 | 18.1%) make up the most common classes of employment.
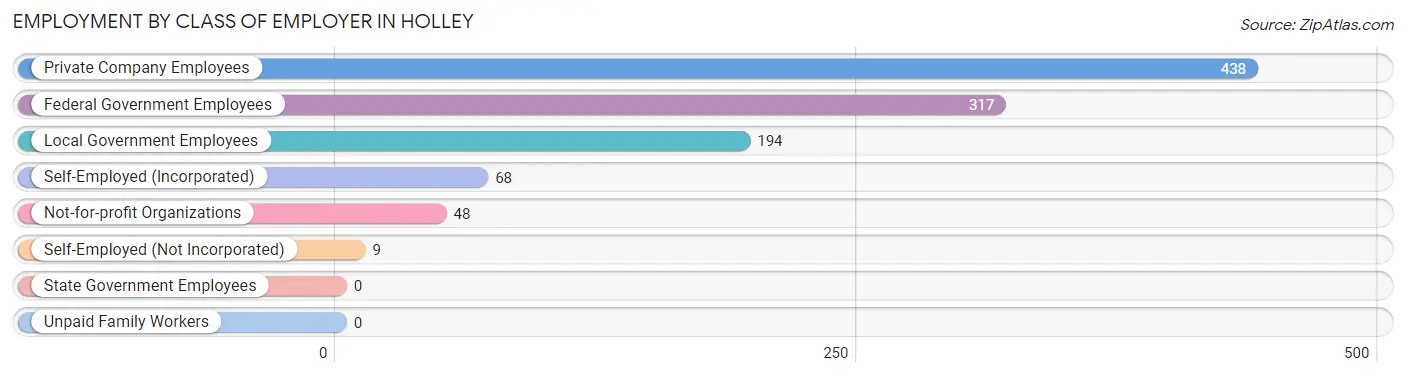
| Employer Class | # Employees | % Employees |
| Private Company Employees | 438 | 40.8% |
| Self-Employed (Incorporated) | 68 | 6.3% |
| Self-Employed (Not Incorporated) | 9 | 0.8% |
| Not-for-profit Organizations | 48 | 4.5% |
| Local Government Employees | 194 | 18.1% |
| State Government Employees | 0 | 0.0% |
| Federal Government Employees | 317 | 29.5% |
| Unpaid Family Workers | 0 | 0.0% |
| Total | 1,074 | 100.0% |
Employment Status by Age in Holley
According to the labor force statistics for Holley, out of the total population over 16 years of age (1,804), 63.8% or 1,151 individuals are in the labor force, with 5.0% or 58 of them unemployed. The age group with the highest labor force participation rate is 25 to 29 years, with 100.0% or 153 individuals in the labor force. Within the labor force, the 45 to 54 years age range has the highest percentage of unemployed individuals, with 17.5% or 47 of them being unemployed.
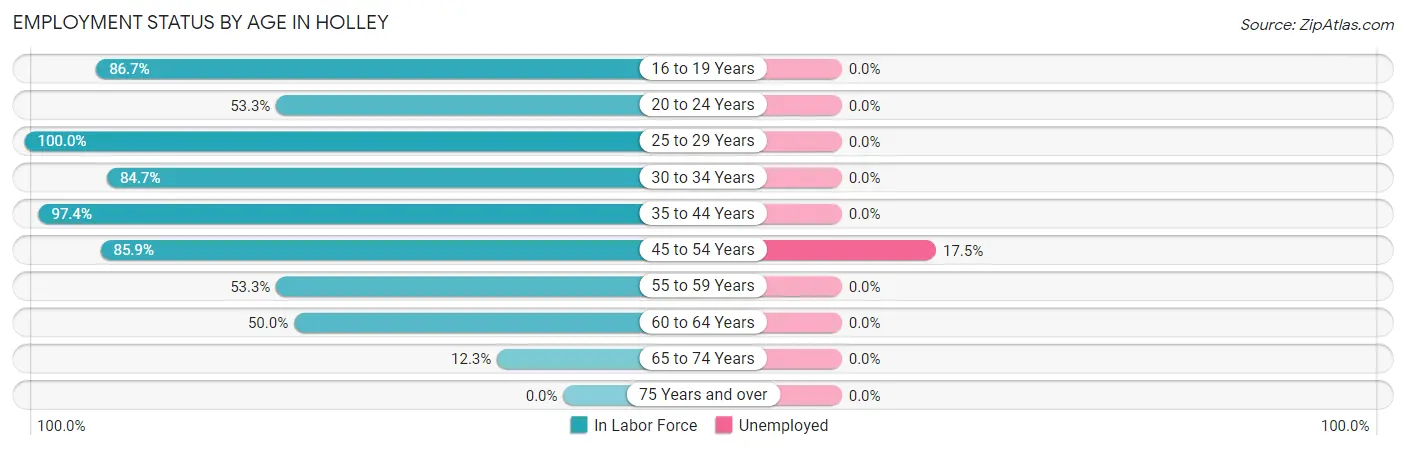
| Age Bracket | In Labor Force | Unemployed |
| 16 to 19 Years | 52 (86.7%) | 0 (0.0%) |
| 20 to 24 Years | 24 (53.3%) | 0 (0.0%) |
| 25 to 29 Years | 153 (100.0%) | 0 (0.0%) |
| 30 to 34 Years | 172 (84.7%) | 0 (0.0%) |
| 35 to 44 Years | 336 (97.4%) | 0 (0.0%) |
| 45 to 54 Years | 268 (85.9%) | 47 (17.5%) |
| 55 to 59 Years | 48 (53.3%) | 0 (0.0%) |
| 60 to 64 Years | 53 (50.0%) | 0 (0.0%) |
| 65 to 74 Years | 45 (12.3%) | 0 (0.0%) |
| 75 Years and over | 0 (0.0%) | 0 (0.0%) |
| Total | 1,151 (63.8%) | 58 (5.0%) |
Employment Status by Educational Attainment in Holley
According to labor force statistics for Holley, 85.2% of individuals (1,030) out of the total population between 25 and 64 years of age (1,209) are in the labor force, with 5.7% or 59 of them being unemployed. The group with the highest labor force participation rate are those with the educational attainment of high school diploma, with 91.4% or 299 individuals in the labor force. Within the labor force, individuals with bachelor's degree or higher education have the highest percentage of unemployment, with 12.2% or 39 of them being unemployed.
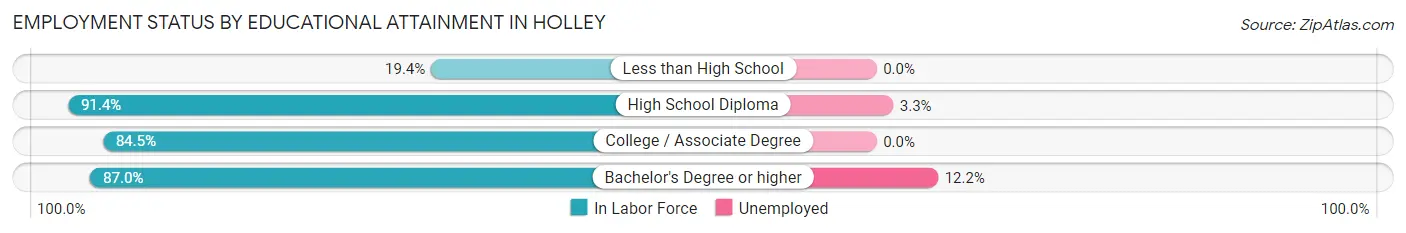
| Educational Attainment | In Labor Force | Unemployed |
| Less than High School | 7 (19.4%) | 0 (0.0%) |
| High School Diploma | 299 (91.4%) | 11 (3.3%) |
| College / Associate Degree | 403 (84.5%) | 0 (0.0%) |
| Bachelor's Degree or higher | 321 (87.0%) | 45 (12.2%) |
| Total | 1,030 (85.2%) | 69 (5.7%) |
Employment Occupations by Sex in Holley
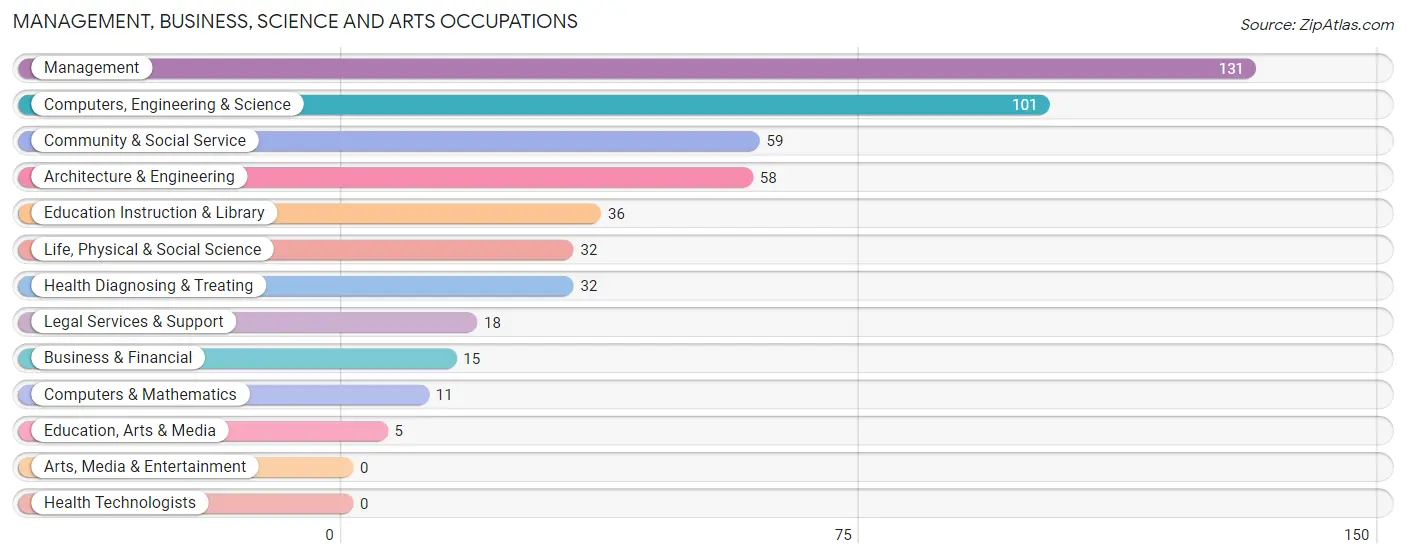
Management, Business, Science and Arts Occupations
The most common Management, Business, Science and Arts occupations in Holley are Management (131 | 14.6%), Computers, Engineering & Science (101 | 11.3%), Community & Social Service (59 | 6.6%), Architecture & Engineering (58 | 6.5%), and Education Instruction & Library (36 | 4.0%).
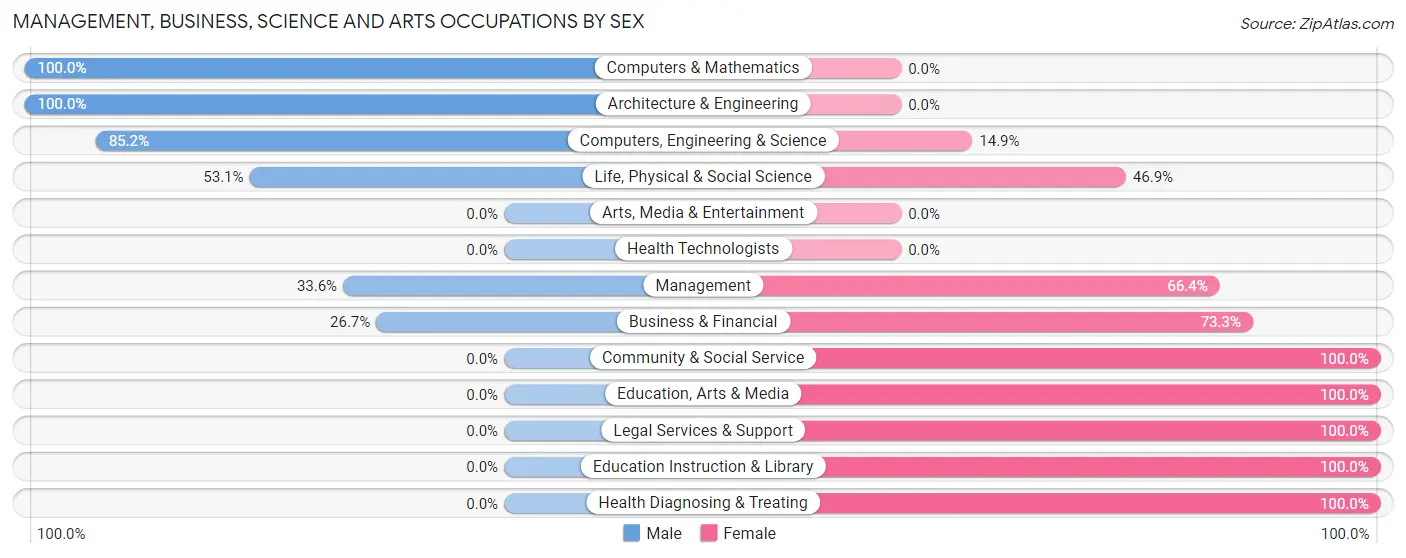
Management, Business, Science and Arts Occupations by Sex
Within the Management, Business, Science and Arts occupations in Holley, the most male-oriented occupations are Computers & Mathematics (100.0%), Architecture & Engineering (100.0%), and Computers, Engineering & Science (85.2%), while the most female-oriented occupations are Community & Social Service (100.0%), Education, Arts & Media (100.0%), and Legal Services & Support (100.0%).
| Occupation | Male | Female |
| Management | 44 (33.6%) | 87 (66.4%) |
| Business & Financial | 4 (26.7%) | 11 (73.3%) |
| Computers, Engineering & Science | 86 (85.2%) | 15 (14.8%) |
| Computers & Mathematics | 11 (100.0%) | 0 (0.0%) |
| Architecture & Engineering | 58 (100.0%) | 0 (0.0%) |
| Life, Physical & Social Science | 17 (53.1%) | 15 (46.9%) |
| Community & Social Service | 0 (0.0%) | 59 (100.0%) |
| Education, Arts & Media | 0 (0.0%) | 5 (100.0%) |
| Legal Services & Support | 0 (0.0%) | 18 (100.0%) |
| Education Instruction & Library | 0 (0.0%) | 36 (100.0%) |
| Arts, Media & Entertainment | 0 (0.0%) | 0 (0.0%) |
| Health Diagnosing & Treating | 0 (0.0%) | 32 (100.0%) |
| Health Technologists | 0 (0.0%) | 0 (0.0%) |
| Total (Category) | 134 (39.6%) | 204 (60.4%) |
| Total (Overall) | 453 (50.5%) | 444 (49.5%) |
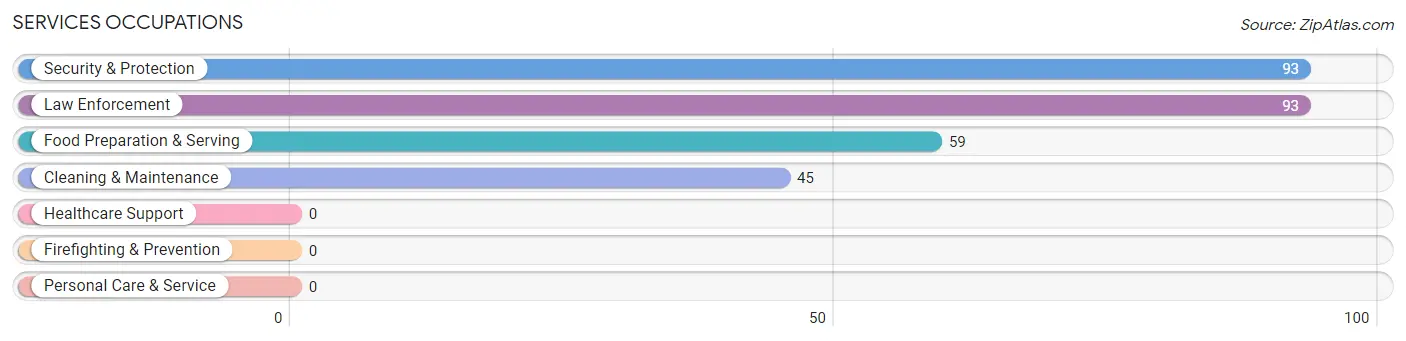
Services Occupations
The most common Services occupations in Holley are Security & Protection (93 | 10.4%), Law Enforcement (93 | 10.4%), Food Preparation & Serving (59 | 6.6%), and Cleaning & Maintenance (45 | 5.0%).
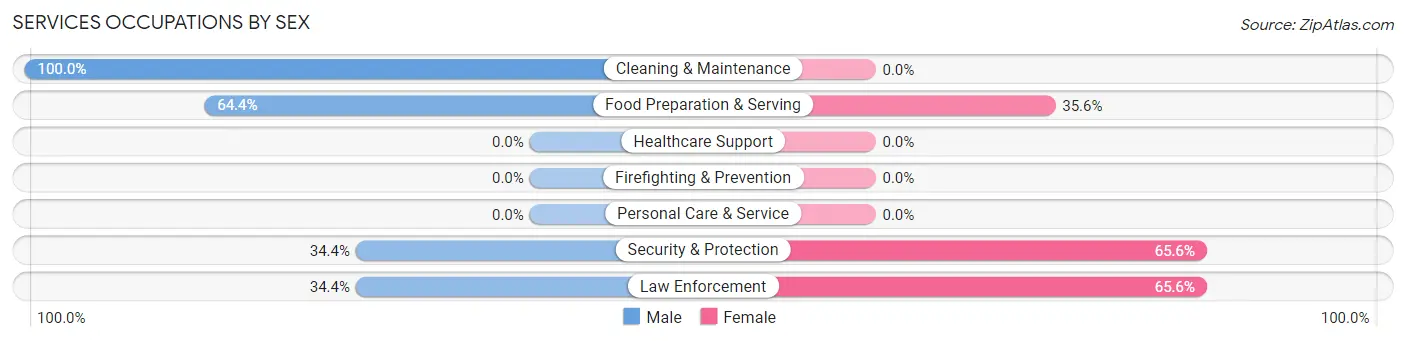
Services Occupations by Sex
Within the Services occupations in Holley, the most male-oriented occupations are Cleaning & Maintenance (100.0%), Food Preparation & Serving (64.4%), and Security & Protection (34.4%), while the most female-oriented occupations are Security & Protection (65.6%), Law Enforcement (65.6%), and Food Preparation & Serving (35.6%).
| Occupation | Male | Female |
| Healthcare Support | 0 (0.0%) | 0 (0.0%) |
| Security & Protection | 32 (34.4%) | 61 (65.6%) |
| Firefighting & Prevention | 0 (0.0%) | 0 (0.0%) |
| Law Enforcement | 32 (34.4%) | 61 (65.6%) |
| Food Preparation & Serving | 38 (64.4%) | 21 (35.6%) |
| Cleaning & Maintenance | 45 (100.0%) | 0 (0.0%) |
| Personal Care & Service | 0 (0.0%) | 0 (0.0%) |
| Total (Category) | 115 (58.4%) | 82 (41.6%) |
| Total (Overall) | 453 (50.5%) | 444 (49.5%) |
Sales and Office Occupations
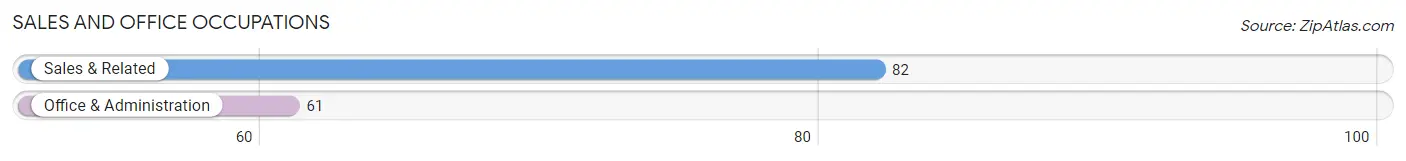
The most common Sales and Office occupations in Holley are Sales & Related (82 | 9.1%), and Office & Administration (61 | 6.8%).
Sales and Office Occupations by Sex
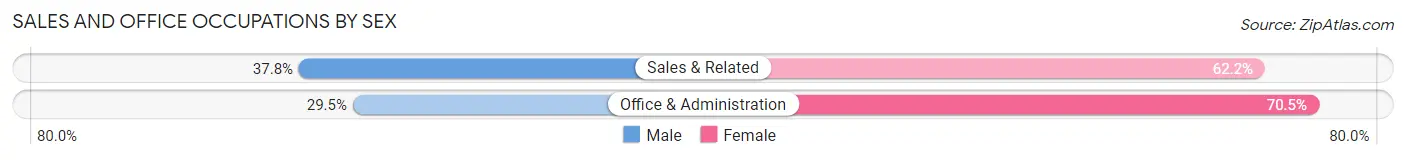
| Occupation | Male | Female |
| Sales & Related | 31 (37.8%) | 51 (62.2%) |
| Office & Administration | 18 (29.5%) | 43 (70.5%) |
| Total (Category) | 49 (34.3%) | 94 (65.7%) |
| Total (Overall) | 453 (50.5%) | 444 (49.5%) |
Natural Resources, Construction and Maintenance Occupations
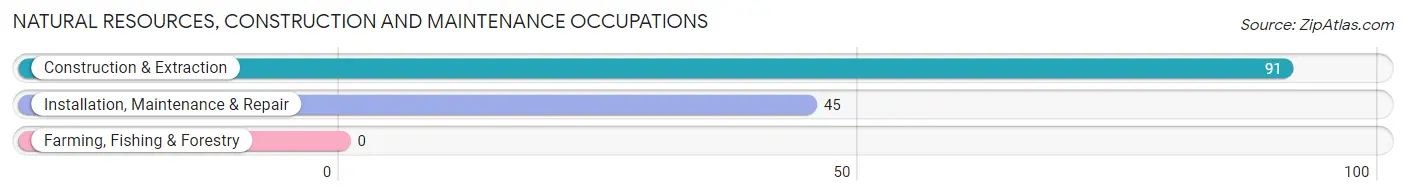
The most common Natural Resources, Construction and Maintenance occupations in Holley are Construction & Extraction (91 | 10.1%), and Installation, Maintenance & Repair (45 | 5.0%).
Natural Resources, Construction and Maintenance Occupations by Sex
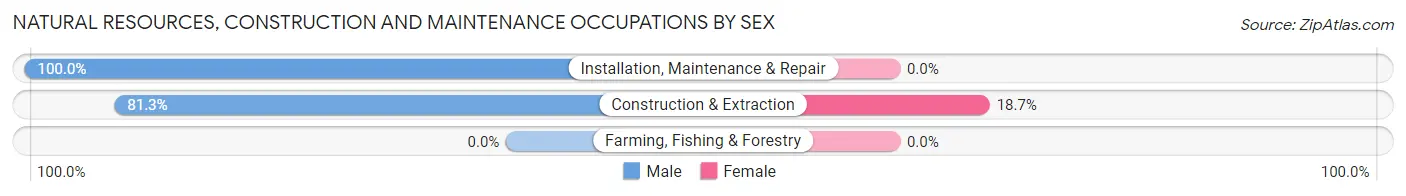
| Occupation | Male | Female |
| Farming, Fishing & Forestry | 0 (0.0%) | 0 (0.0%) |
| Construction & Extraction | 74 (81.3%) | 17 (18.7%) |
| Installation, Maintenance & Repair | 45 (100.0%) | 0 (0.0%) |
| Total (Category) | 119 (87.5%) | 17 (12.5%) |
| Total (Overall) | 453 (50.5%) | 444 (49.5%) |
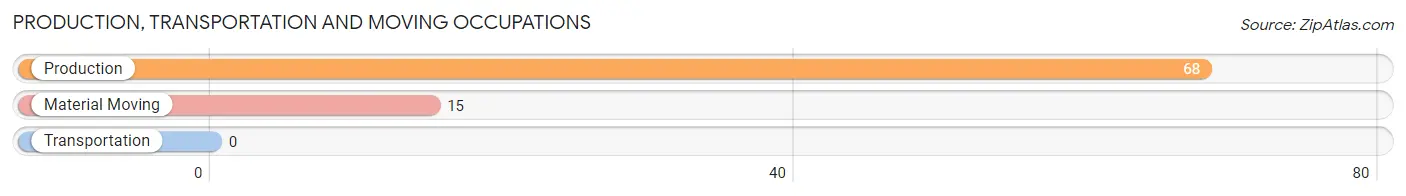
Production, Transportation and Moving Occupations
The most common Production, Transportation and Moving occupations in Holley are Production (68 | 7.6%), and Material Moving (15 | 1.7%).
Production, Transportation and Moving Occupations by Sex
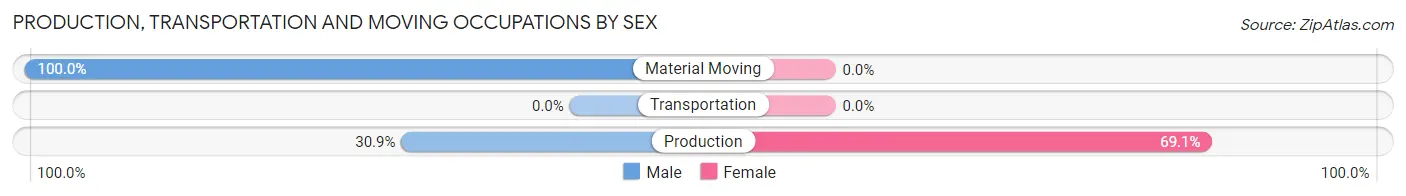
| Occupation | Male | Female |
| Production | 21 (30.9%) | 47 (69.1%) |
| Transportation | 0 (0.0%) | 0 (0.0%) |
| Material Moving | 15 (100.0%) | 0 (0.0%) |
| Total (Category) | 36 (43.4%) | 47 (56.6%) |
| Total (Overall) | 453 (50.5%) | 444 (49.5%) |
Employment Industries by Sex in Holley
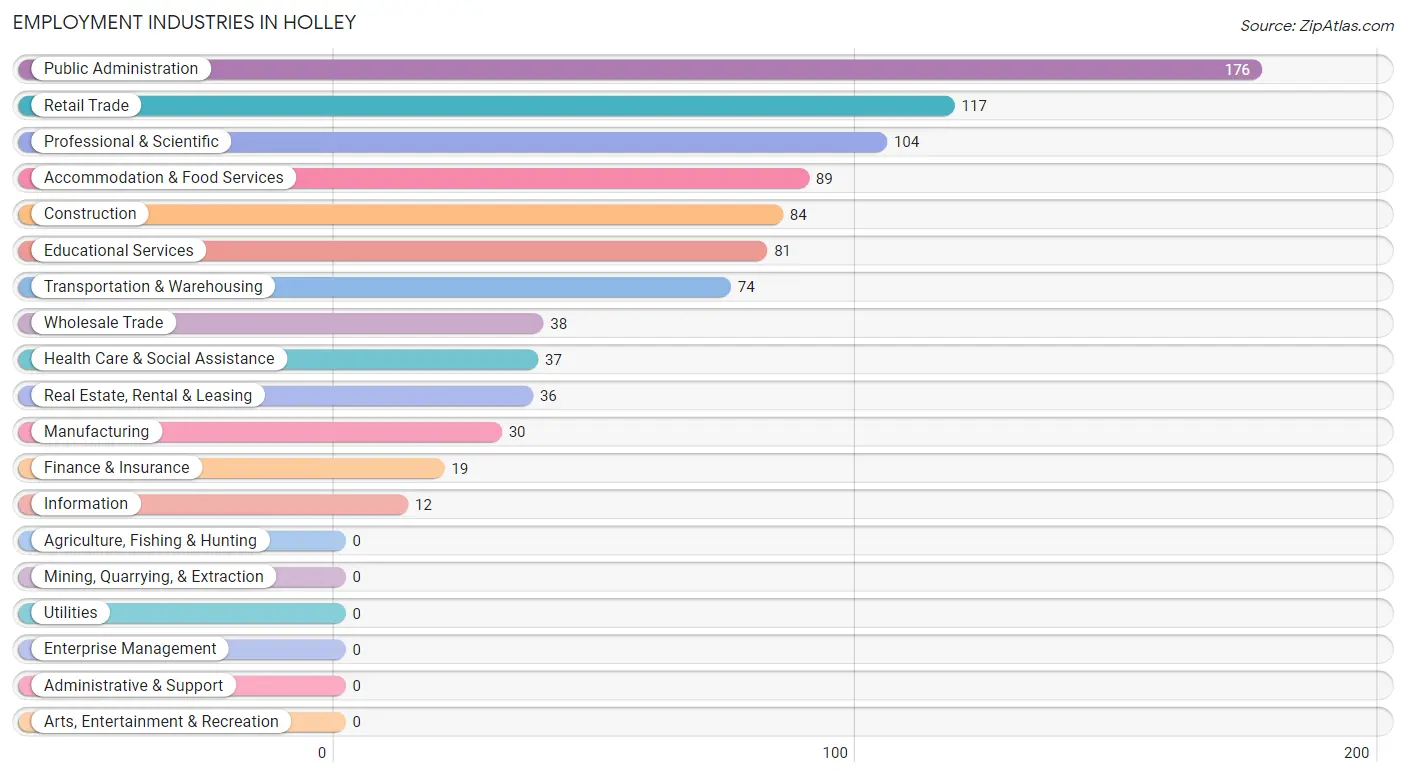
Employment Industries in Holley
The major employment industries in Holley include Public Administration (176 | 19.6%), Retail Trade (117 | 13.0%), Professional & Scientific (104 | 11.6%), Accommodation & Food Services (89 | 9.9%), and Construction (84 | 9.4%).
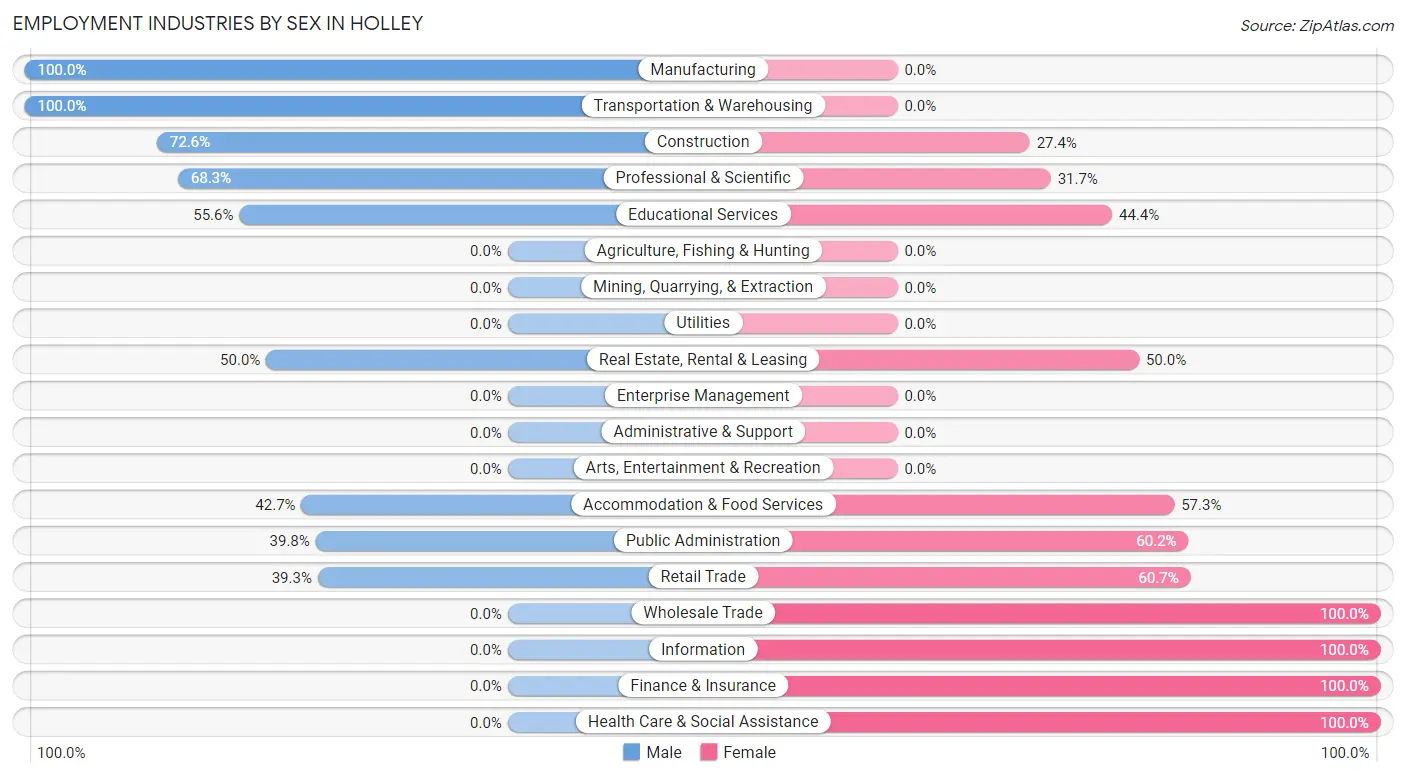
Employment Industries by Sex in Holley
The Holley industries that see more men than women are Manufacturing (100.0%), Transportation & Warehousing (100.0%), and Construction (72.6%), whereas the industries that tend to have a higher number of women are Wholesale Trade (100.0%), Information (100.0%), and Finance & Insurance (100.0%).
| Industry | Male | Female |
| Agriculture, Fishing & Hunting | 0 (0.0%) | 0 (0.0%) |
| Mining, Quarrying, & Extraction | 0 (0.0%) | 0 (0.0%) |
| Construction | 61 (72.6%) | 23 (27.4%) |
| Manufacturing | 30 (100.0%) | 0 (0.0%) |
| Wholesale Trade | 0 (0.0%) | 38 (100.0%) |
| Retail Trade | 46 (39.3%) | 71 (60.7%) |
| Transportation & Warehousing | 74 (100.0%) | 0 (0.0%) |
| Utilities | 0 (0.0%) | 0 (0.0%) |
| Information | 0 (0.0%) | 12 (100.0%) |
| Finance & Insurance | 0 (0.0%) | 19 (100.0%) |
| Real Estate, Rental & Leasing | 18 (50.0%) | 18 (50.0%) |
| Professional & Scientific | 71 (68.3%) | 33 (31.7%) |
| Enterprise Management | 0 (0.0%) | 0 (0.0%) |
| Administrative & Support | 0 (0.0%) | 0 (0.0%) |
| Educational Services | 45 (55.6%) | 36 (44.4%) |
| Health Care & Social Assistance | 0 (0.0%) | 37 (100.0%) |
| Arts, Entertainment & Recreation | 0 (0.0%) | 0 (0.0%) |
| Accommodation & Food Services | 38 (42.7%) | 51 (57.3%) |
| Public Administration | 70 (39.8%) | 106 (60.2%) |
| Total | 453 (50.5%) | 444 (49.5%) |
Education in Holley
School Enrollment in Holley
The most common levels of schooling among the 807 students in Holley are elementary school (220 | 27.3%), college / undergraduate (194 | 24.0%), and high school (158 | 19.6%).
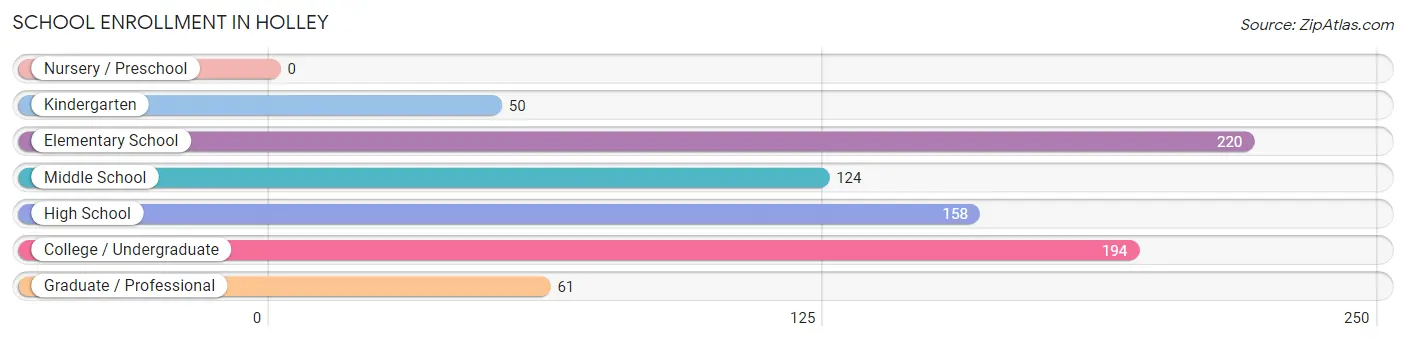
| School Level | # Students | % Students |
| Nursery / Preschool | 0 | 0.0% |
| Kindergarten | 50 | 6.2% |
| Elementary School | 220 | 27.3% |
| Middle School | 124 | 15.4% |
| High School | 158 | 19.6% |
| College / Undergraduate | 194 | 24.0% |
| Graduate / Professional | 61 | 7.6% |
| Total | 807 | 100.0% |
School Enrollment by Age by Funding Source in Holley
Out of a total of 807 students who are enrolled in schools in Holley, 137 (17.0%) attend a private institution, while the remaining 670 (83.0%) are enrolled in public schools. The age group of 35 years and over has the highest likelihood of being enrolled in private schools, with 75 (74.3% in the age bracket) enrolled. Conversely, the age group of 15 to 17 year olds has the lowest likelihood of being enrolled in a private school, with 67 (100.0% in the age bracket) attending a public institution.
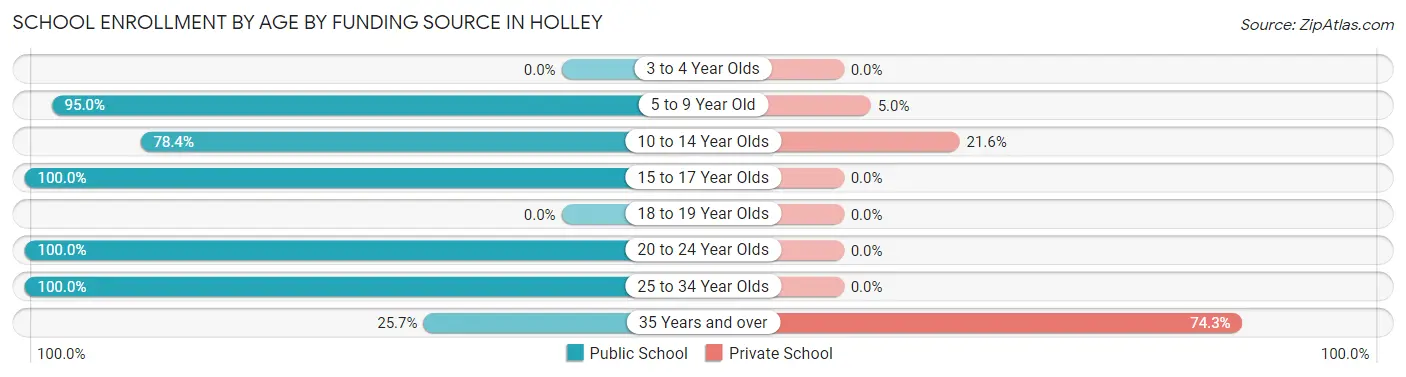
| Age Bracket | Public School | Private School |
| 3 to 4 Year Olds | 0 (0.0%) | 0 (0.0%) |
| 5 to 9 Year Old | 245 (95.0%) | 13 (5.0%) |
| 10 to 14 Year Olds | 178 (78.4%) | 49 (21.6%) |
| 15 to 17 Year Olds | 67 (100.0%) | 0 (0.0%) |
| 18 to 19 Year Olds | 0 (0.0%) | 0 (0.0%) |
| 20 to 24 Year Olds | 15 (100.0%) | 0 (0.0%) |
| 25 to 34 Year Olds | 139 (100.0%) | 0 (0.0%) |
| 35 Years and over | 26 (25.7%) | 75 (74.3%) |
| Total | 670 (83.0%) | 137 (17.0%) |
Educational Attainment by Field of Study in Holley
Business (136 | 24.9%), science & technology (112 | 20.5%), arts & humanities (77 | 14.1%), education (72 | 13.2%), and bio, nature & agricultural (41 | 7.5%) are the most common fields of study among 545 individuals in Holley who have obtained a bachelor's degree or higher.
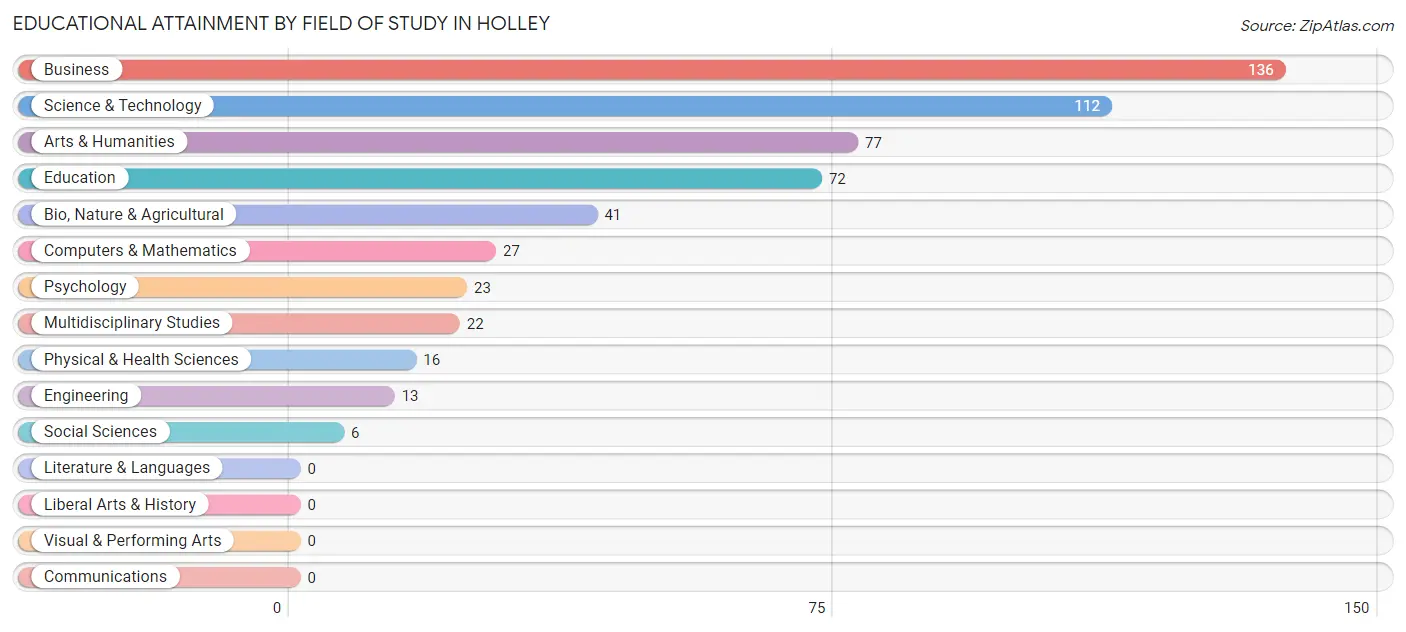
| Field of Study | # Graduates | % Graduates |
| Computers & Mathematics | 27 | 5.0% |
| Bio, Nature & Agricultural | 41 | 7.5% |
| Physical & Health Sciences | 16 | 2.9% |
| Psychology | 23 | 4.2% |
| Social Sciences | 6 | 1.1% |
| Engineering | 13 | 2.4% |
| Multidisciplinary Studies | 22 | 4.0% |
| Science & Technology | 112 | 20.5% |
| Business | 136 | 24.9% |
| Education | 72 | 13.2% |
| Literature & Languages | 0 | 0.0% |
| Liberal Arts & History | 0 | 0.0% |
| Visual & Performing Arts | 0 | 0.0% |
| Communications | 0 | 0.0% |
| Arts & Humanities | 77 | 14.1% |
| Total | 545 | 100.0% |
Transportation & Commute in Holley
Vehicle Availability by Sex in Holley
The most prevalent vehicle ownership categories in Holley are males with 2 vehicles (377, accounting for 58.7%) and females with 2 vehicles (304, making up 87.3%).
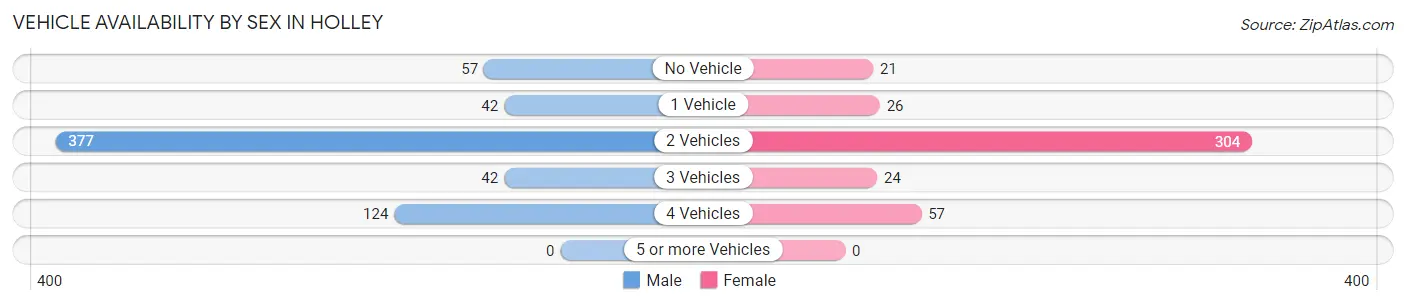
| Vehicles Available | Male | Female |
| No Vehicle | 57 (8.9%) | 21 (4.9%) |
| 1 Vehicle | 42 (6.5%) | 26 (6.0%) |
| 2 Vehicles | 377 (58.7%) | 304 (70.4%) |
| 3 Vehicles | 42 (6.5%) | 24 (5.6%) |
| 4 Vehicles | 124 (19.3%) | 57 (13.2%) |
| 5 or more Vehicles | 0 (0.0%) | 0 (0.0%) |
| Total | 642 (100.0%) | 432 (100.0%) |
Commute Time in Holley
The most frequently occuring commute durations in Holley are 30 to 34 minutes (258 commuters, 26.9%), 45 to 59 minutes (258 commuters, 26.9%), and 15 to 19 minutes (148 commuters, 15.4%).
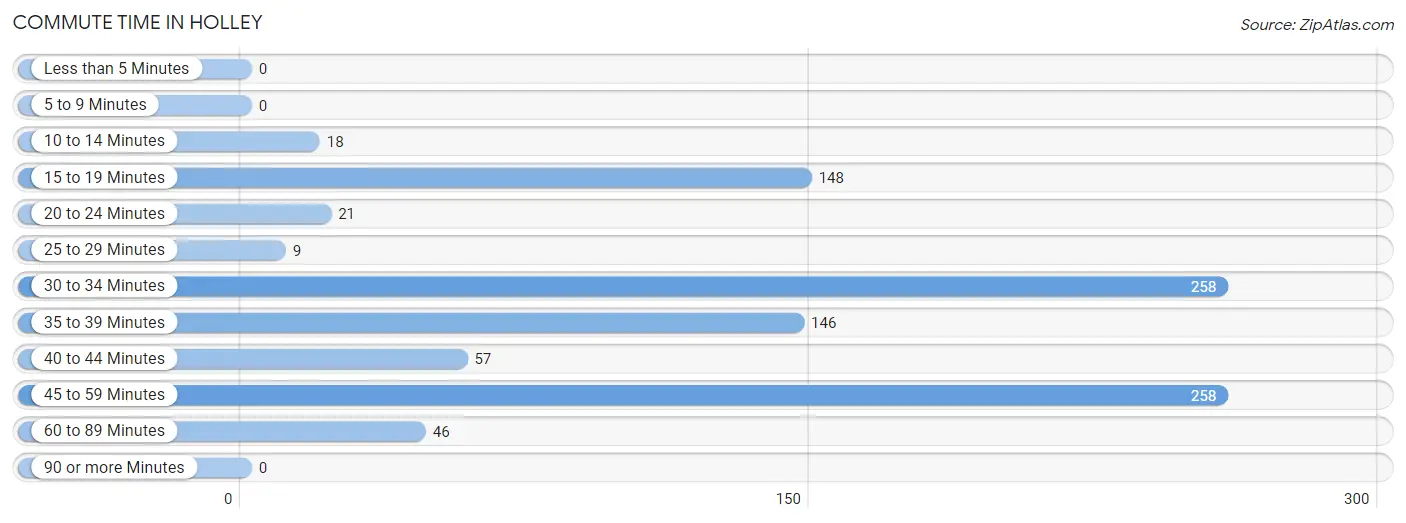
| Commute Time | # Commuters | % Commuters |
| Less than 5 Minutes | 0 | 0.0% |
| 5 to 9 Minutes | 0 | 0.0% |
| 10 to 14 Minutes | 18 | 1.9% |
| 15 to 19 Minutes | 148 | 15.4% |
| 20 to 24 Minutes | 21 | 2.2% |
| 25 to 29 Minutes | 9 | 0.9% |
| 30 to 34 Minutes | 258 | 26.9% |
| 35 to 39 Minutes | 146 | 15.2% |
| 40 to 44 Minutes | 57 | 5.9% |
| 45 to 59 Minutes | 258 | 26.9% |
| 60 to 89 Minutes | 46 | 4.8% |
| 90 or more Minutes | 0 | 0.0% |
Commute Time by Sex in Holley
The most common commute times in Holley are 45 to 59 minutes (212 commuters, 33.0%) for males and 35 to 39 minutes (80 commuters, 25.1%) for females.
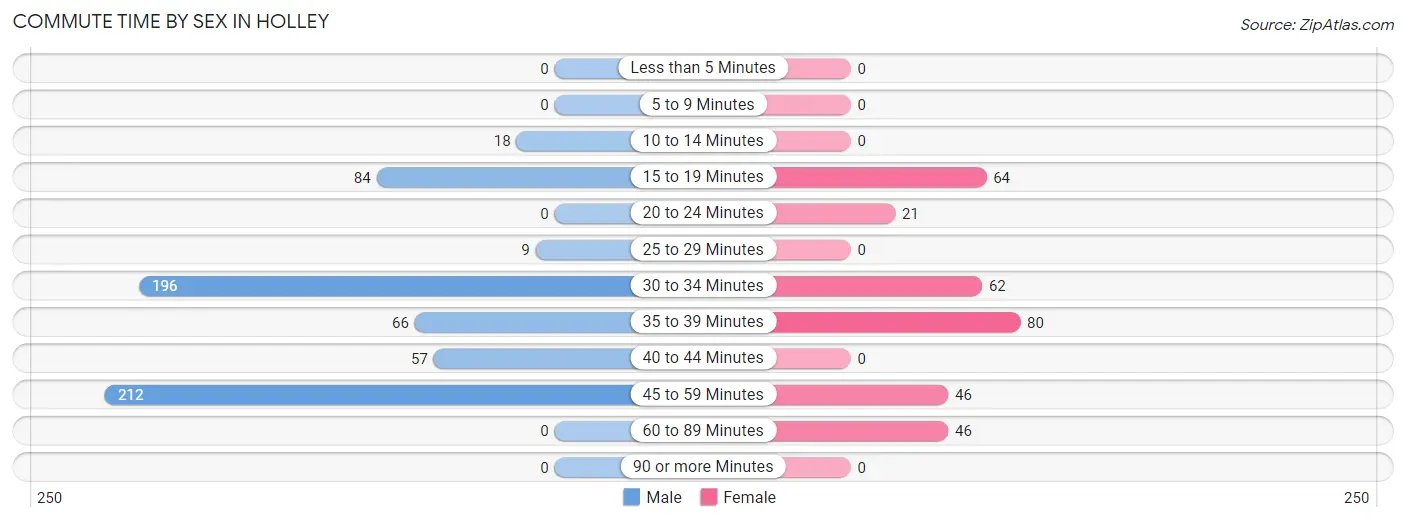
| Commute Time | Male | Female |
| Less than 5 Minutes | 0 (0.0%) | 0 (0.0%) |
| 5 to 9 Minutes | 0 (0.0%) | 0 (0.0%) |
| 10 to 14 Minutes | 18 (2.8%) | 0 (0.0%) |
| 15 to 19 Minutes | 84 (13.1%) | 64 (20.1%) |
| 20 to 24 Minutes | 0 (0.0%) | 21 (6.6%) |
| 25 to 29 Minutes | 9 (1.4%) | 0 (0.0%) |
| 30 to 34 Minutes | 196 (30.5%) | 62 (19.4%) |
| 35 to 39 Minutes | 66 (10.3%) | 80 (25.1%) |
| 40 to 44 Minutes | 57 (8.9%) | 0 (0.0%) |
| 45 to 59 Minutes | 212 (33.0%) | 46 (14.4%) |
| 60 to 89 Minutes | 0 (0.0%) | 46 (14.4%) |
| 90 or more Minutes | 0 (0.0%) | 0 (0.0%) |
Time of Departure to Work by Sex in Holley
The most frequent times of departure to work in Holley are 7:00 AM to 7:29 AM (132, 20.6%) for males and 7:30 AM to 7:59 AM (123, 38.6%) for females.
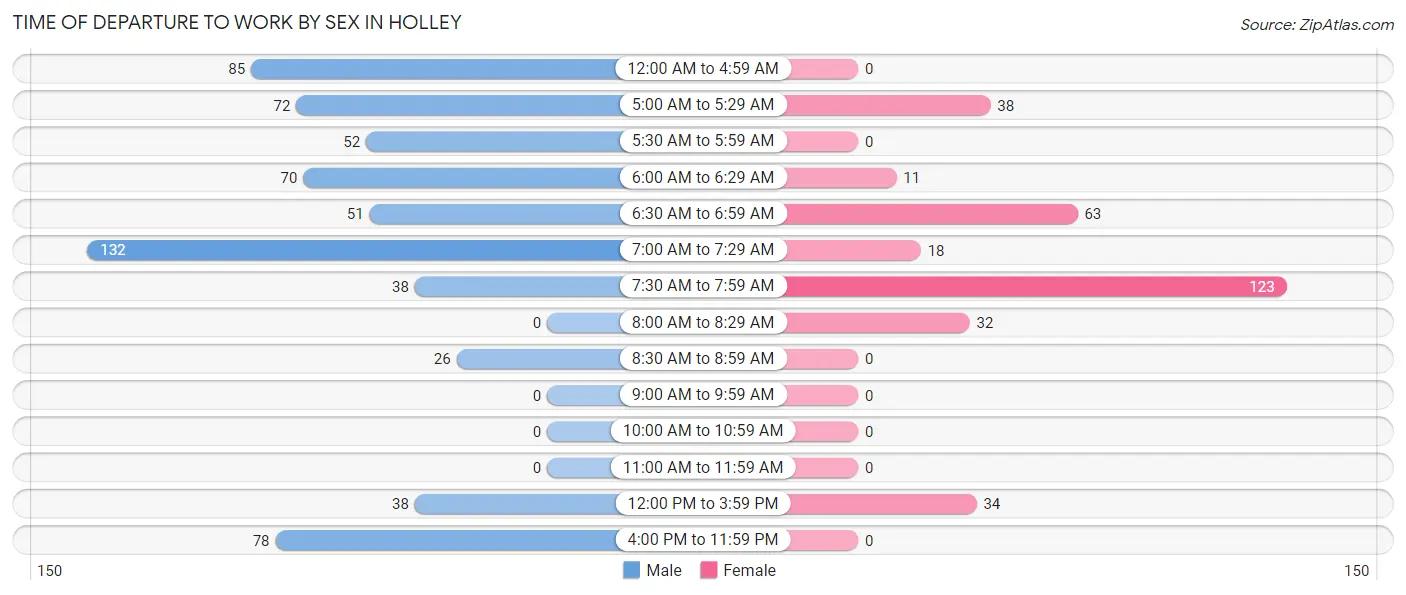
| Time of Departure | Male | Female |
| 12:00 AM to 4:59 AM | 85 (13.2%) | 0 (0.0%) |
| 5:00 AM to 5:29 AM | 72 (11.2%) | 38 (11.9%) |
| 5:30 AM to 5:59 AM | 52 (8.1%) | 0 (0.0%) |
| 6:00 AM to 6:29 AM | 70 (10.9%) | 11 (3.5%) |
| 6:30 AM to 6:59 AM | 51 (7.9%) | 63 (19.8%) |
| 7:00 AM to 7:29 AM | 132 (20.6%) | 18 (5.6%) |
| 7:30 AM to 7:59 AM | 38 (5.9%) | 123 (38.6%) |
| 8:00 AM to 8:29 AM | 0 (0.0%) | 32 (10.0%) |
| 8:30 AM to 8:59 AM | 26 (4.1%) | 0 (0.0%) |
| 9:00 AM to 9:59 AM | 0 (0.0%) | 0 (0.0%) |
| 10:00 AM to 10:59 AM | 0 (0.0%) | 0 (0.0%) |
| 11:00 AM to 11:59 AM | 0 (0.0%) | 0 (0.0%) |
| 12:00 PM to 3:59 PM | 38 (5.9%) | 34 (10.7%) |
| 4:00 PM to 11:59 PM | 78 (12.1%) | 0 (0.0%) |
| Total | 642 (100.0%) | 319 (100.0%) |
Housing Occupancy in Holley
Occupancy by Ownership in Holley
Of the total 892 dwellings in Holley, owner-occupied units account for 696 (78.0%), while renter-occupied units make up 196 (22.0%).
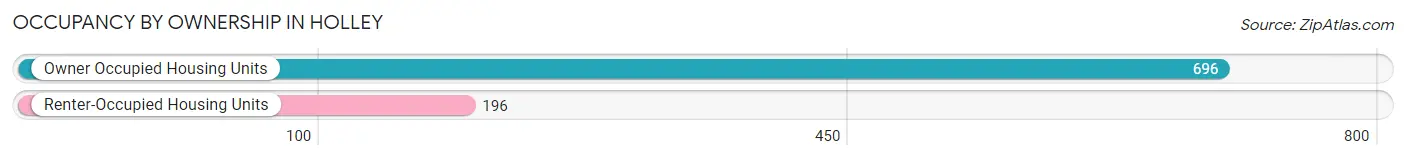
| Occupancy | # Housing Units | % Housing Units |
| Owner Occupied Housing Units | 696 | 78.0% |
| Renter-Occupied Housing Units | 196 | 22.0% |
| Total Occupied Housing Units | 892 | 100.0% |
Occupancy by Household Size in Holley
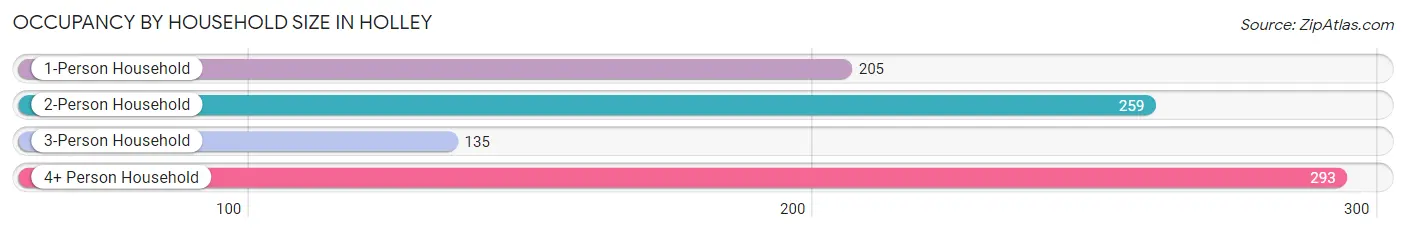
| Household Size | # Housing Units | % Housing Units |
| 1-Person Household | 205 | 23.0% |
| 2-Person Household | 259 | 29.0% |
| 3-Person Household | 135 | 15.1% |
| 4+ Person Household | 293 | 32.9% |
| Total Housing Units | 892 | 100.0% |
Occupancy by Ownership by Household Size in Holley
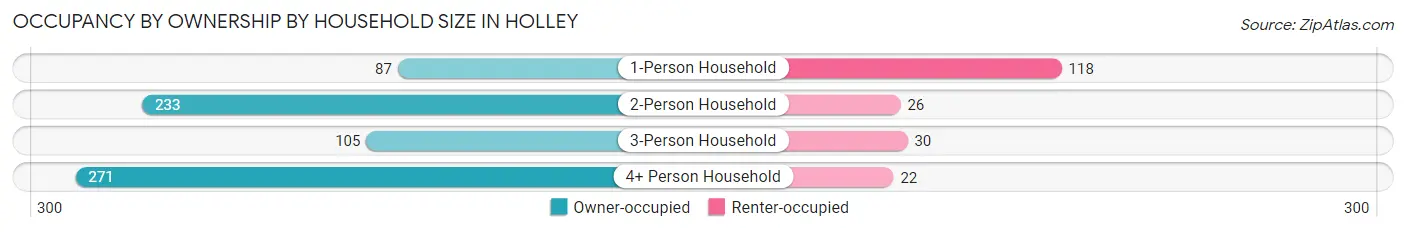
| Household Size | Owner-occupied | Renter-occupied |
| 1-Person Household | 87 (42.4%) | 118 (57.6%) |
| 2-Person Household | 233 (90.0%) | 26 (10.0%) |
| 3-Person Household | 105 (77.8%) | 30 (22.2%) |
| 4+ Person Household | 271 (92.5%) | 22 (7.5%) |
| Total Housing Units | 696 (78.0%) | 196 (22.0%) |
Occupancy by Educational Attainment in Holley
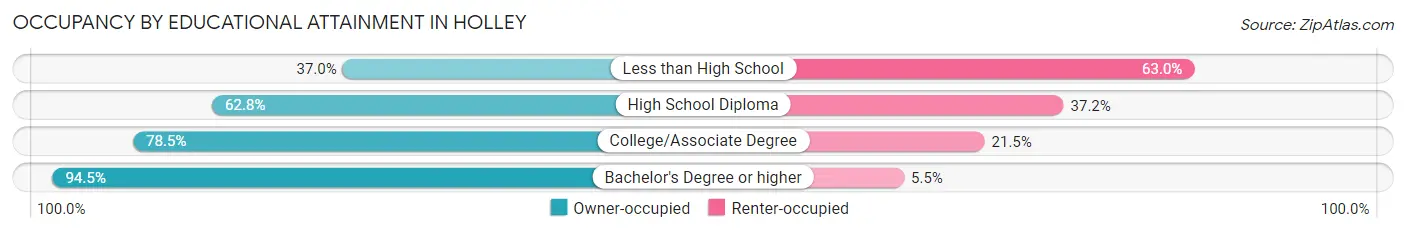
| Household Size | Owner-occupied | Renter-occupied |
| Less than High School | 17 (37.0%) | 29 (63.0%) |
| High School Diploma | 137 (62.8%) | 81 (37.2%) |
| College/Associate Degree | 252 (78.5%) | 69 (21.5%) |
| Bachelor's Degree or higher | 290 (94.5%) | 17 (5.5%) |
Occupancy by Age of Householder in Holley
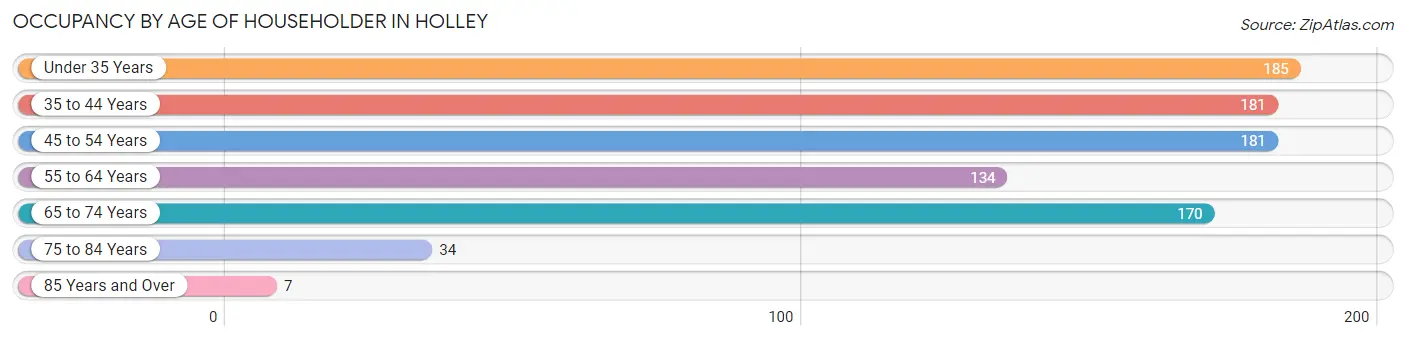
| Age Bracket | # Households | % Households |
| Under 35 Years | 185 | 20.7% |
| 35 to 44 Years | 181 | 20.3% |
| 45 to 54 Years | 181 | 20.3% |
| 55 to 64 Years | 134 | 15.0% |
| 65 to 74 Years | 170 | 19.1% |
| 75 to 84 Years | 34 | 3.8% |
| 85 Years and Over | 7 | 0.8% |
| Total | 892 | 100.0% |
Housing Finances in Holley
Median Income by Occupancy in Holley
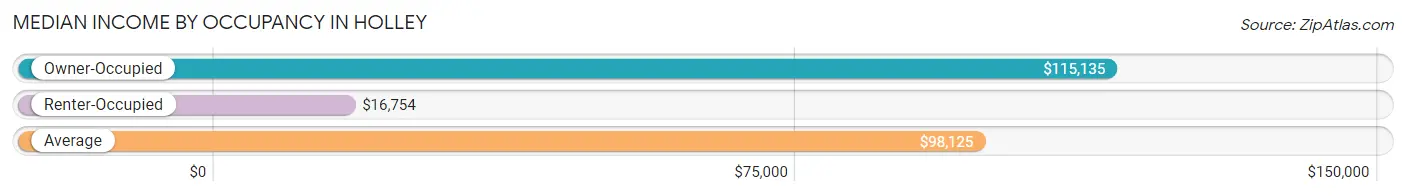
| Occupancy Type | # Households | Median Income |
| Owner-Occupied | 696 (78.0%) | $115,135 |
| Renter-Occupied | 196 (22.0%) | $16,754 |
| Average | 892 (100.0%) | $98,125 |
Occupancy by Householder Income Bracket in Holley
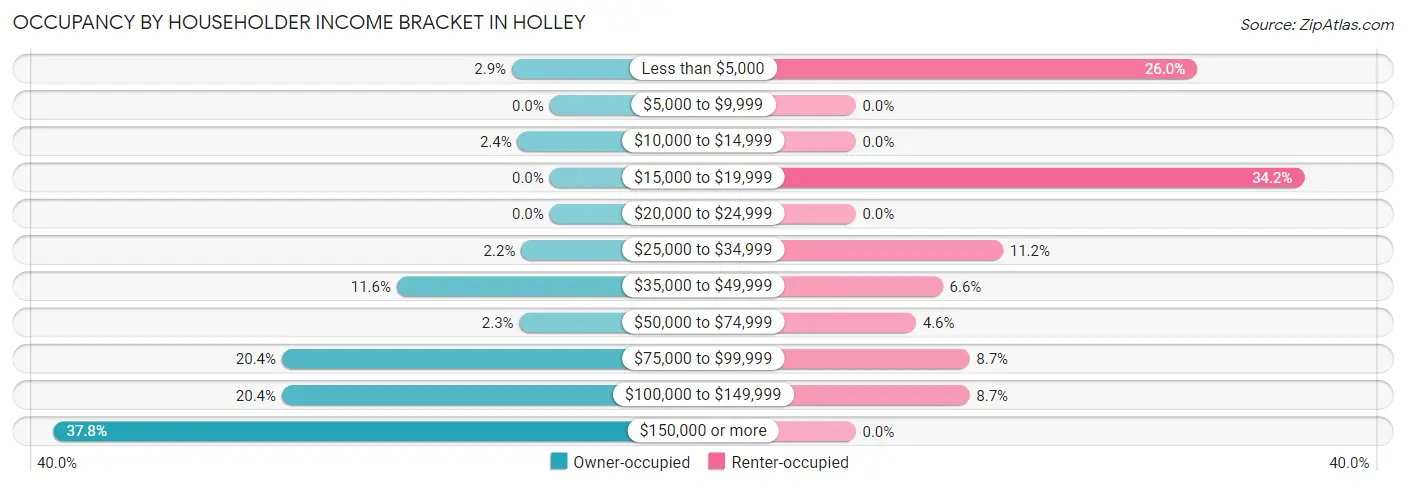
| Income Bracket | Owner-occupied | Renter-occupied |
| Less than $5,000 | 20 (2.9%) | 51 (26.0%) |
| $5,000 to $9,999 | 0 (0.0%) | 0 (0.0%) |
| $10,000 to $14,999 | 17 (2.4%) | 0 (0.0%) |
| $15,000 to $19,999 | 0 (0.0%) | 67 (34.2%) |
| $20,000 to $24,999 | 0 (0.0%) | 0 (0.0%) |
| $25,000 to $34,999 | 15 (2.2%) | 22 (11.2%) |
| $35,000 to $49,999 | 81 (11.6%) | 13 (6.6%) |
| $50,000 to $74,999 | 16 (2.3%) | 9 (4.6%) |
| $75,000 to $99,999 | 142 (20.4%) | 17 (8.7%) |
| $100,000 to $149,999 | 142 (20.4%) | 17 (8.7%) |
| $150,000 or more | 263 (37.8%) | 0 (0.0%) |
| Total | 696 (100.0%) | 196 (100.0%) |
Monthly Housing Cost Tiers in Holley
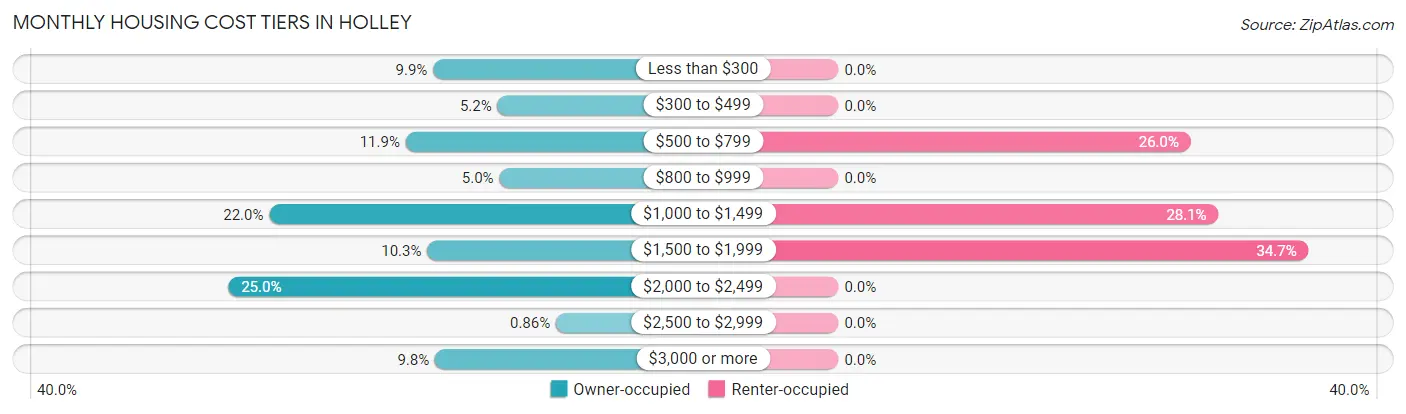
| Monthly Cost | Owner-occupied | Renter-occupied |
| Less than $300 | 69 (9.9%) | 0 (0.0%) |
| $300 to $499 | 36 (5.2%) | 0 (0.0%) |
| $500 to $799 | 83 (11.9%) | 51 (26.0%) |
| $800 to $999 | 35 (5.0%) | 0 (0.0%) |
| $1,000 to $1,499 | 153 (22.0%) | 55 (28.1%) |
| $1,500 to $1,999 | 72 (10.3%) | 68 (34.7%) |
| $2,000 to $2,499 | 174 (25.0%) | 0 (0.0%) |
| $2,500 to $2,999 | 6 (0.9%) | 0 (0.0%) |
| $3,000 or more | 68 (9.8%) | 0 (0.0%) |
| Total | 696 (100.0%) | 196 (100.0%) |
Physical Housing Characteristics in Holley
Housing Structures in Holley
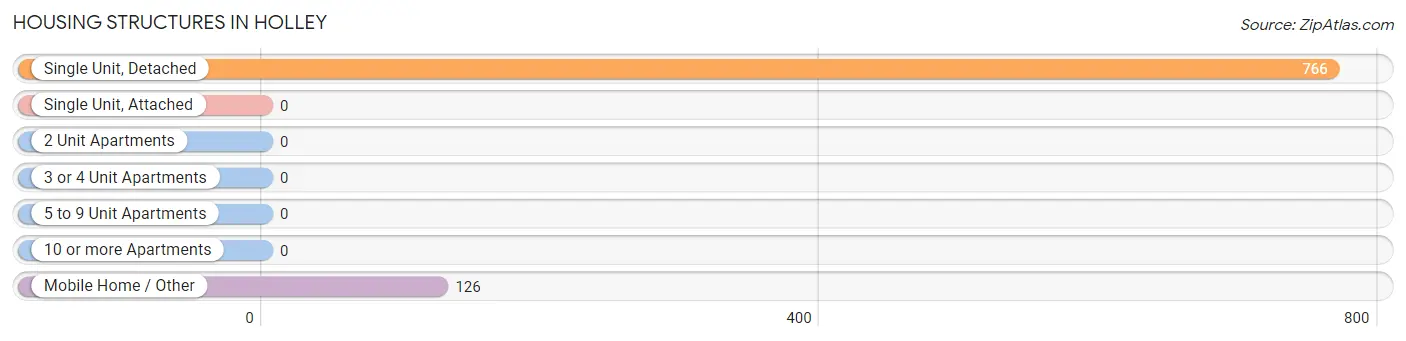
| Structure Type | # Housing Units | % Housing Units |
| Single Unit, Detached | 766 | 85.9% |
| Single Unit, Attached | 0 | 0.0% |
| 2 Unit Apartments | 0 | 0.0% |
| 3 or 4 Unit Apartments | 0 | 0.0% |
| 5 to 9 Unit Apartments | 0 | 0.0% |
| 10 or more Apartments | 0 | 0.0% |
| Mobile Home / Other | 126 | 14.1% |
| Total | 892 | 100.0% |
Housing Structures by Occupancy in Holley
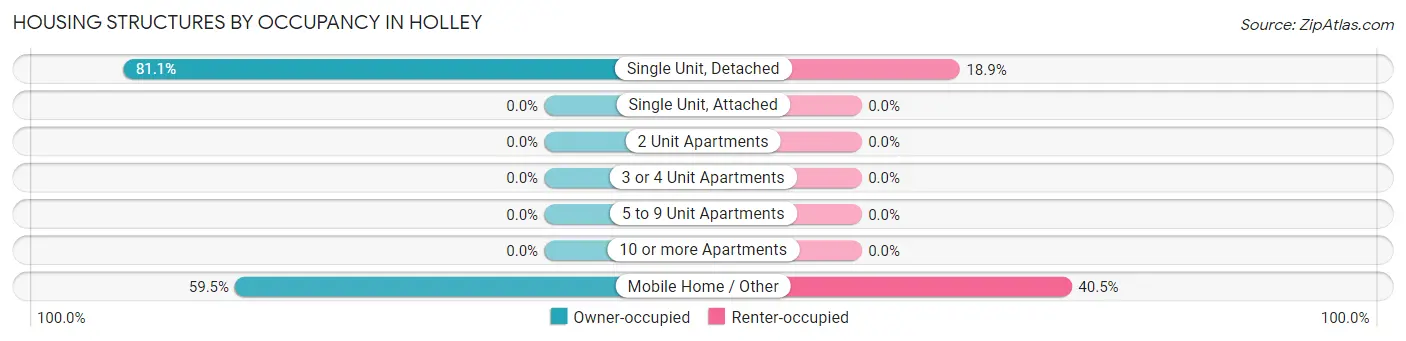
| Structure Type | Owner-occupied | Renter-occupied |
| Single Unit, Detached | 621 (81.1%) | 145 (18.9%) |
| Single Unit, Attached | 0 (0.0%) | 0 (0.0%) |
| 2 Unit Apartments | 0 (0.0%) | 0 (0.0%) |
| 3 or 4 Unit Apartments | 0 (0.0%) | 0 (0.0%) |
| 5 to 9 Unit Apartments | 0 (0.0%) | 0 (0.0%) |
| 10 or more Apartments | 0 (0.0%) | 0 (0.0%) |
| Mobile Home / Other | 75 (59.5%) | 51 (40.5%) |
| Total | 696 (78.0%) | 196 (22.0%) |
Housing Structures by Number of Rooms in Holley
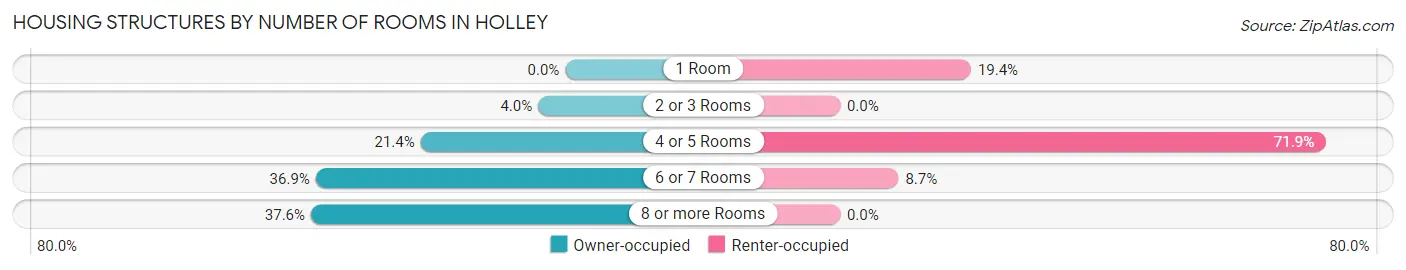
| Number of Rooms | Owner-occupied | Renter-occupied |
| 1 Room | 0 (0.0%) | 38 (19.4%) |
| 2 or 3 Rooms | 28 (4.0%) | 0 (0.0%) |
| 4 or 5 Rooms | 149 (21.4%) | 141 (71.9%) |
| 6 or 7 Rooms | 257 (36.9%) | 17 (8.7%) |
| 8 or more Rooms | 262 (37.6%) | 0 (0.0%) |
| Total | 696 (100.0%) | 196 (100.0%) |
Housing Structure by Heating Type in Holley
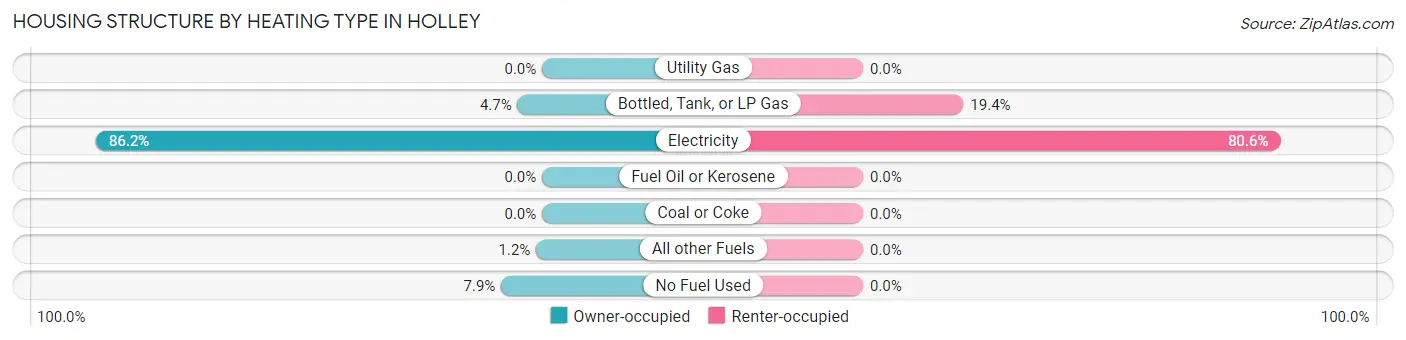
| Heating Type | Owner-occupied | Renter-occupied |
| Utility Gas | 0 (0.0%) | 0 (0.0%) |
| Bottled, Tank, or LP Gas | 33 (4.7%) | 38 (19.4%) |
| Electricity | 600 (86.2%) | 158 (80.6%) |
| Fuel Oil or Kerosene | 0 (0.0%) | 0 (0.0%) |
| Coal or Coke | 0 (0.0%) | 0 (0.0%) |
| All other Fuels | 8 (1.1%) | 0 (0.0%) |
| No Fuel Used | 55 (7.9%) | 0 (0.0%) |
| Total | 696 (100.0%) | 196 (100.0%) |
Household Vehicle Usage in Holley
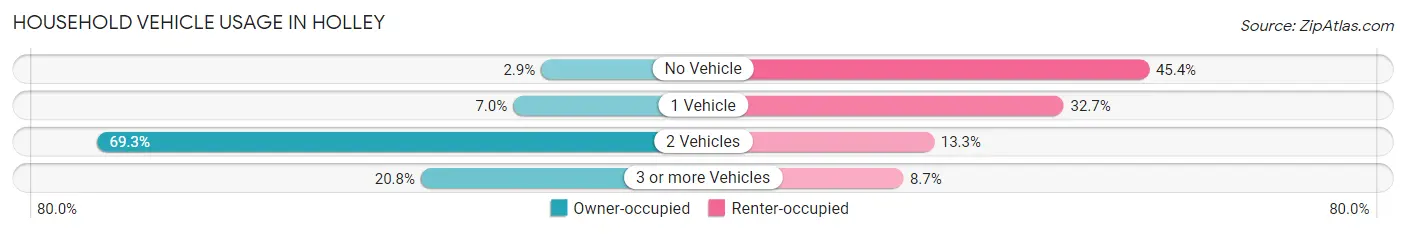
| Vehicles per Household | Owner-occupied | Renter-occupied |
| No Vehicle | 20 (2.9%) | 89 (45.4%) |
| 1 Vehicle | 49 (7.0%) | 64 (32.7%) |
| 2 Vehicles | 482 (69.3%) | 26 (13.3%) |
| 3 or more Vehicles | 145 (20.8%) | 17 (8.7%) |
| Total | 696 (100.0%) | 196 (100.0%) |
Real Estate & Mortgages in Holley
Real Estate and Mortgage Overview in Holley
| Characteristic | Without Mortgage | With Mortgage |
| Housing Units | 226 | 470 |
| Median Property Value | - | - |
| Median Household Income | $81,912 | $215 |
| Monthly Housing Costs | $573 | $68 |
| Real Estate Taxes | - | - |
Property Value by Mortgage Status in Holley
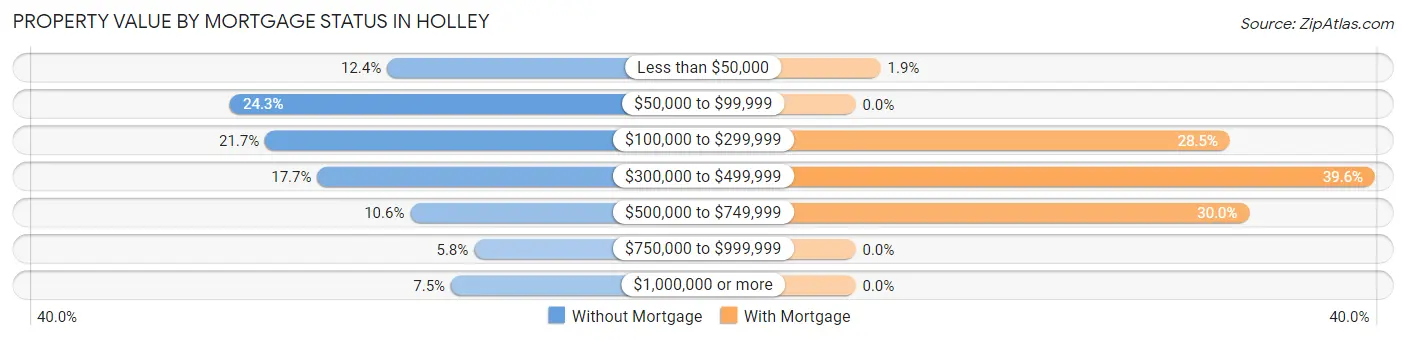
| Property Value | Without Mortgage | With Mortgage |
| Less than $50,000 | 28 (12.4%) | 9 (1.9%) |
| $50,000 to $99,999 | 55 (24.3%) | 0 (0.0%) |
| $100,000 to $299,999 | 49 (21.7%) | 134 (28.5%) |
| $300,000 to $499,999 | 40 (17.7%) | 186 (39.6%) |
| $500,000 to $749,999 | 24 (10.6%) | 141 (30.0%) |
| $750,000 to $999,999 | 13 (5.8%) | 0 (0.0%) |
| $1,000,000 or more | 17 (7.5%) | 0 (0.0%) |
| Total | 226 (100.0%) | 470 (100.0%) |
Household Income by Mortgage Status in Holley
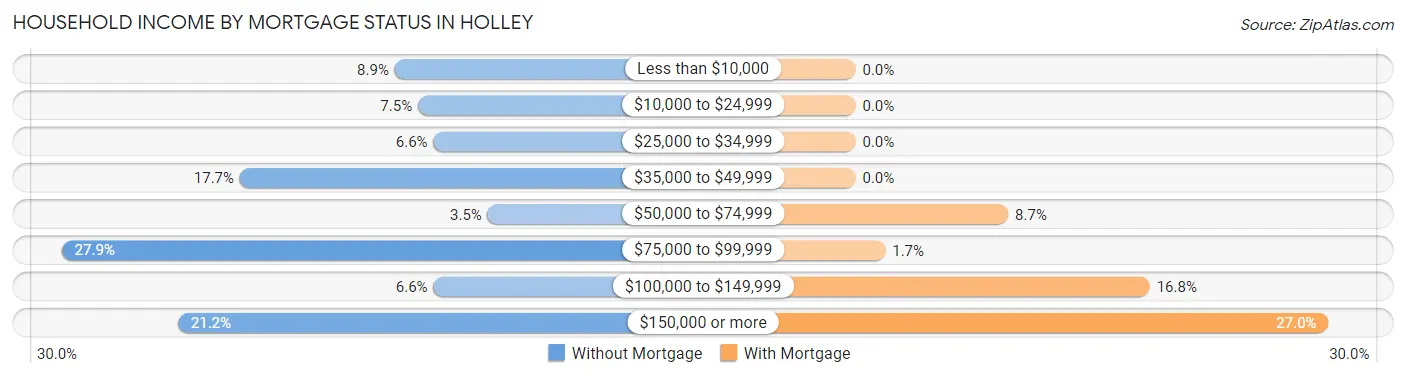
| Household Income | Without Mortgage | With Mortgage |
| Less than $10,000 | 20 (8.8%) | 0 (0.0%) |
| $10,000 to $24,999 | 17 (7.5%) | 0 (0.0%) |
| $25,000 to $34,999 | 15 (6.6%) | 0 (0.0%) |
| $35,000 to $49,999 | 40 (17.7%) | 0 (0.0%) |
| $50,000 to $74,999 | 8 (3.5%) | 41 (8.7%) |
| $75,000 to $99,999 | 63 (27.9%) | 8 (1.7%) |
| $100,000 to $149,999 | 15 (6.6%) | 79 (16.8%) |
| $150,000 or more | 48 (21.2%) | 127 (27.0%) |
| Total | 226 (100.0%) | 470 (100.0%) |
Property Value to Household Income Ratio in Holley
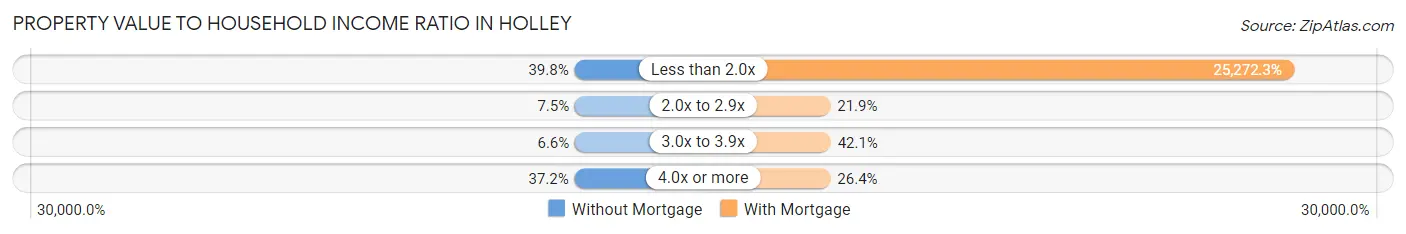
| Value-to-Income Ratio | Without Mortgage | With Mortgage |
| Less than 2.0x | 90 (39.8%) | 118,780 (25,272.3%) |
| 2.0x to 2.9x | 17 (7.5%) | 103 (21.9%) |
| 3.0x to 3.9x | 15 (6.6%) | 198 (42.1%) |
| 4.0x or more | 84 (37.2%) | 124 (26.4%) |
| Total | 226 (100.0%) | 470 (100.0%) |
Real Estate Taxes by Mortgage Status in Holley
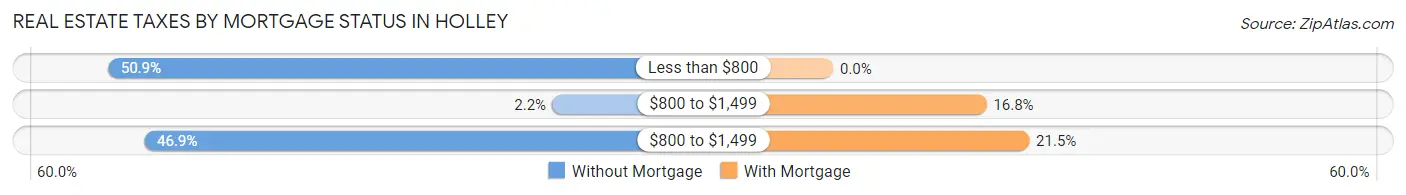
| Property Taxes | Without Mortgage | With Mortgage |
| Less than $800 | 115 (50.9%) | 0 (0.0%) |
| $800 to $1,499 | 5 (2.2%) | 79 (16.8%) |
| $800 to $1,499 | 106 (46.9%) | 101 (21.5%) |
| Total | 226 (100.0%) | 470 (100.0%) |
Health & Disability in Holley
Health Insurance Coverage by Age in Holley
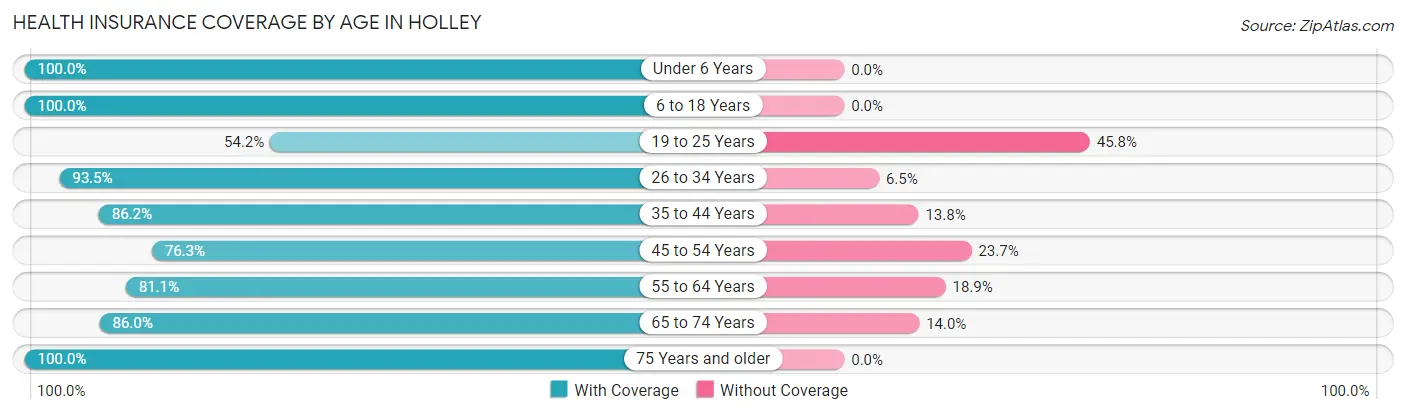
| Age Bracket | With Coverage | Without Coverage |
| Under 6 Years | 172 (100.0%) | 0 (0.0%) |
| 6 to 18 Years | 539 (100.0%) | 0 (0.0%) |
| 19 to 25 Years | 45 (54.2%) | 38 (45.8%) |
| 26 to 34 Years | 217 (93.5%) | 15 (6.5%) |
| 35 to 44 Years | 193 (86.2%) | 31 (13.8%) |
| 45 to 54 Years | 238 (76.3%) | 74 (23.7%) |
| 55 to 64 Years | 159 (81.1%) | 37 (18.9%) |
| 65 to 74 Years | 314 (86.0%) | 51 (14.0%) |
| 75 Years and older | 125 (100.0%) | 0 (0.0%) |
| Total | 2,002 (89.1%) | 246 (10.9%) |
Health Insurance Coverage by Citizenship Status in Holley
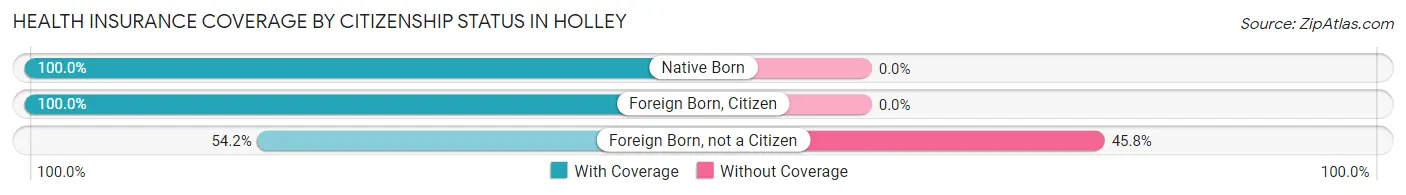
| Citizenship Status | With Coverage | Without Coverage |
| Native Born | 172 (100.0%) | 0 (0.0%) |
| Foreign Born, Citizen | 539 (100.0%) | 0 (0.0%) |
| Foreign Born, not a Citizen | 45 (54.2%) | 38 (45.8%) |
Health Insurance Coverage by Household Income in Holley
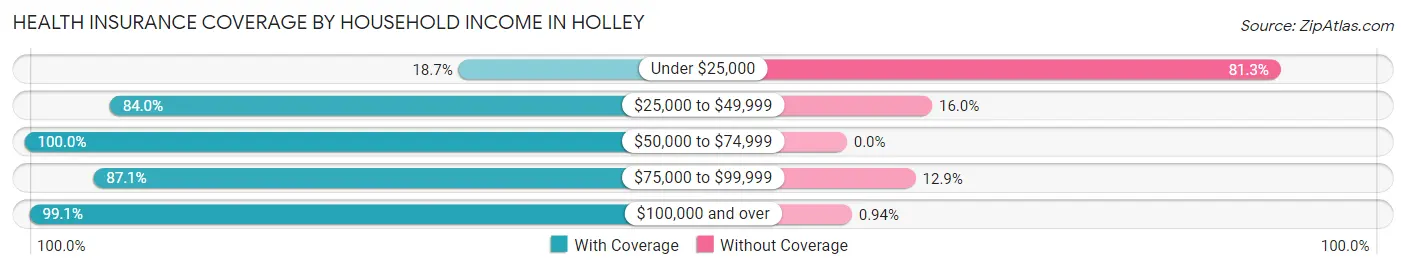
| Household Income | With Coverage | Without Coverage |
| Under $25,000 | 29 (18.7%) | 126 (81.3%) |
| $25,000 to $49,999 | 242 (84.0%) | 46 (16.0%) |
| $50,000 to $74,999 | 50 (100.0%) | 0 (0.0%) |
| $75,000 to $99,999 | 419 (87.1%) | 62 (12.9%) |
| $100,000 and over | 1,262 (99.1%) | 12 (0.9%) |
Public vs Private Health Insurance Coverage by Age in Holley
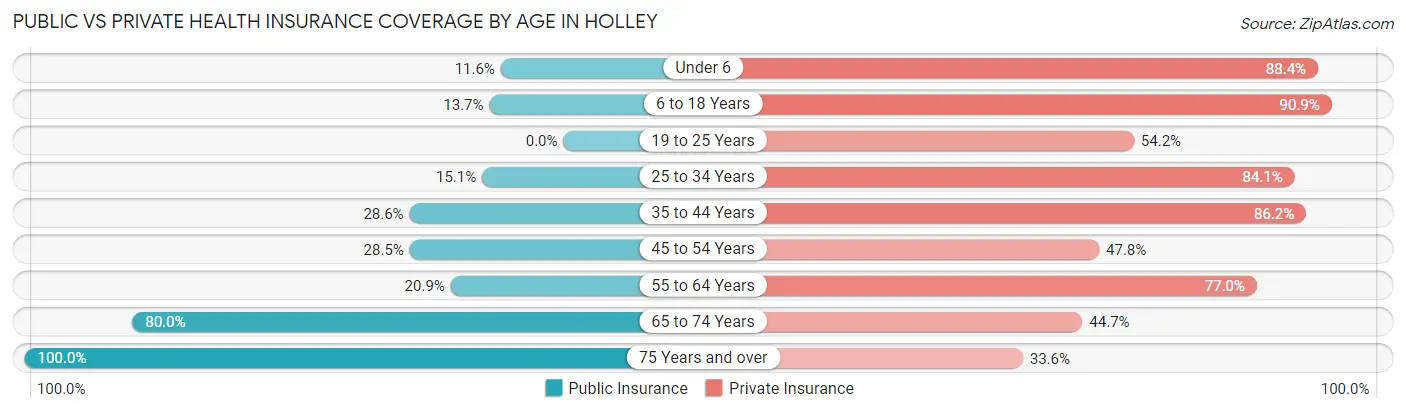
| Age Bracket | Public Insurance | Private Insurance |
| Under 6 | 20 (11.6%) | 152 (88.4%) |
| 6 to 18 Years | 74 (13.7%) | 490 (90.9%) |
| 19 to 25 Years | 0 (0.0%) | 45 (54.2%) |
| 25 to 34 Years | 35 (15.1%) | 195 (84.1%) |
| 35 to 44 Years | 64 (28.6%) | 193 (86.2%) |
| 45 to 54 Years | 89 (28.5%) | 149 (47.8%) |
| 55 to 64 Years | 41 (20.9%) | 151 (77.0%) |
| 65 to 74 Years | 292 (80.0%) | 163 (44.7%) |
| 75 Years and over | 125 (100.0%) | 42 (33.6%) |
| Total | 740 (32.9%) | 1,580 (70.3%) |
Disability Status by Sex by Age in Holley
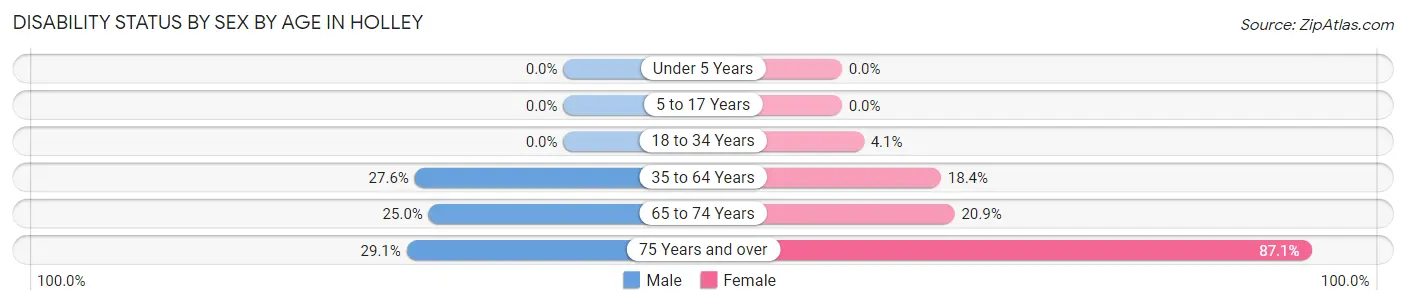
| Age Bracket | Male | Female |
| Under 5 Years | 0 (0.0%) | 0 (0.0%) |
| 5 to 17 Years | 0 (0.0%) | 0 (0.0%) |
| 18 to 34 Years | 0 (0.0%) | 9 (4.1%) |
| 35 to 64 Years | 106 (27.6%) | 64 (18.4%) |
| 65 to 74 Years | 53 (25.0%) | 32 (20.9%) |
| 75 Years and over | 16 (29.1%) | 61 (87.1%) |
Disability Class by Sex by Age in Holley
Disability Class: Hearing Difficulty
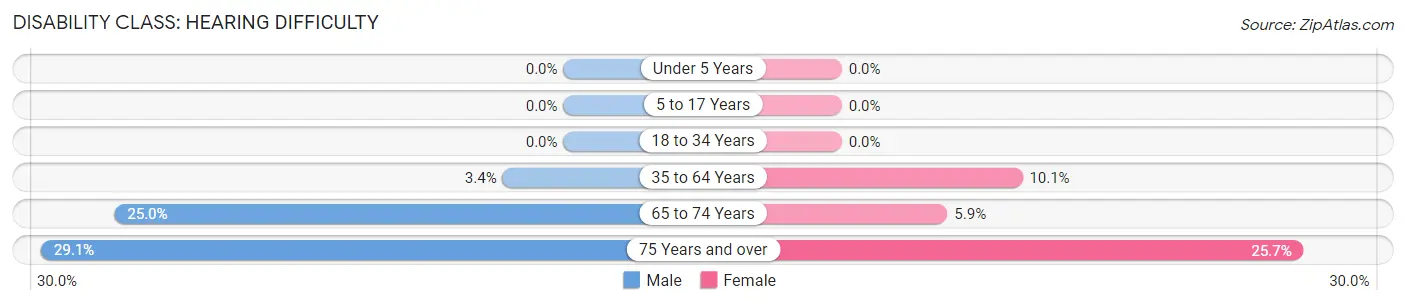
| Age Bracket | Male | Female |
| Under 5 Years | 0 (0.0%) | 0 (0.0%) |
| 5 to 17 Years | 0 (0.0%) | 0 (0.0%) |
| 18 to 34 Years | 0 (0.0%) | 0 (0.0%) |
| 35 to 64 Years | 13 (3.4%) | 35 (10.1%) |
| 65 to 74 Years | 53 (25.0%) | 9 (5.9%) |
| 75 Years and over | 16 (29.1%) | 18 (25.7%) |
Disability Class: Vision Difficulty
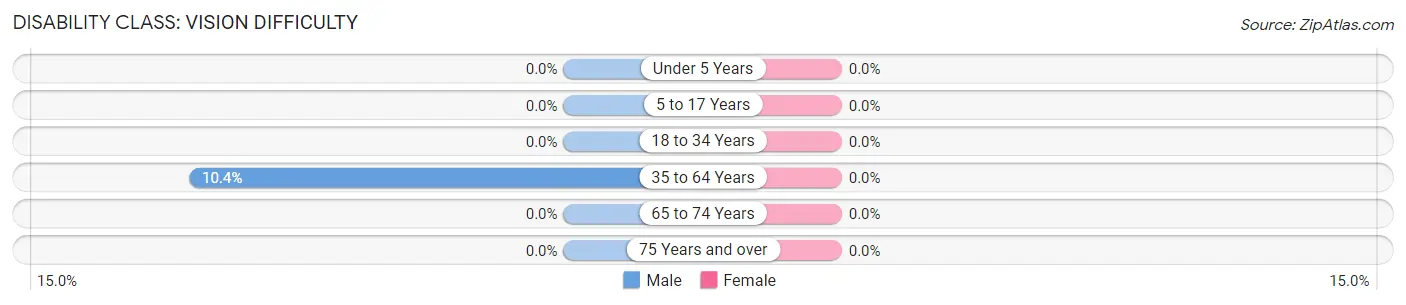
| Age Bracket | Male | Female |
| Under 5 Years | 0 (0.0%) | 0 (0.0%) |
| 5 to 17 Years | 0 (0.0%) | 0 (0.0%) |
| 18 to 34 Years | 0 (0.0%) | 0 (0.0%) |
| 35 to 64 Years | 40 (10.4%) | 0 (0.0%) |
| 65 to 74 Years | 0 (0.0%) | 0 (0.0%) |
| 75 Years and over | 0 (0.0%) | 0 (0.0%) |
Disability Class: Cognitive Difficulty
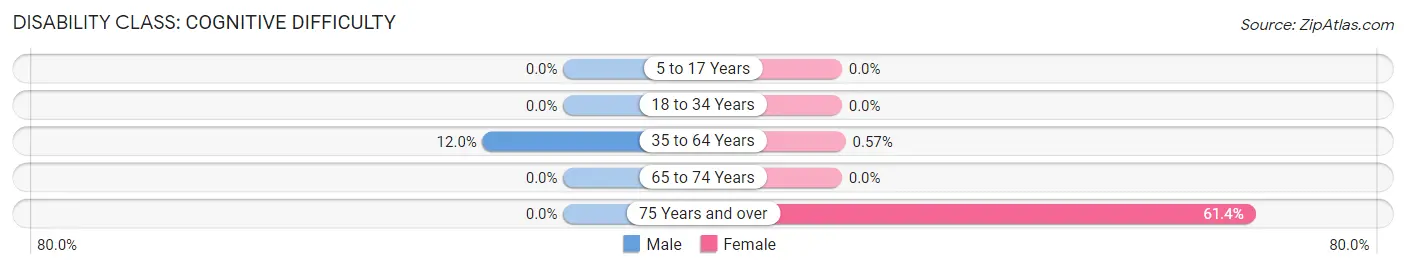
| Age Bracket | Male | Female |
| 5 to 17 Years | 0 (0.0%) | 0 (0.0%) |
| 18 to 34 Years | 0 (0.0%) | 0 (0.0%) |
| 35 to 64 Years | 46 (12.0%) | 2 (0.6%) |
| 65 to 74 Years | 0 (0.0%) | 0 (0.0%) |
| 75 Years and over | 0 (0.0%) | 43 (61.4%) |
Disability Class: Ambulatory Difficulty
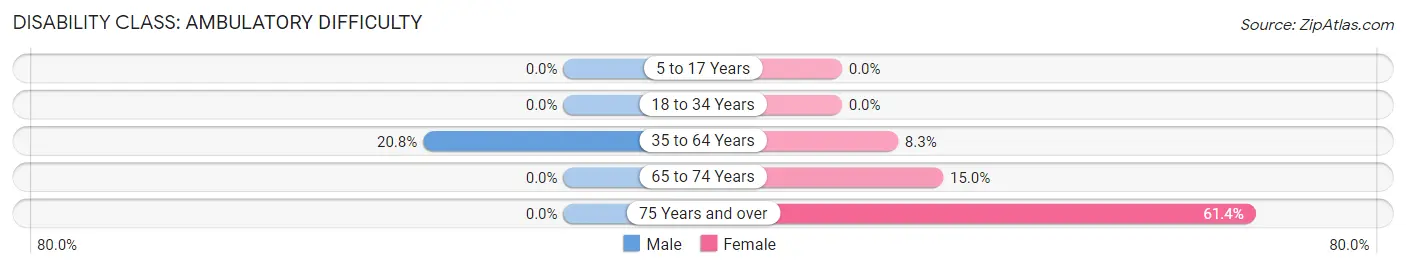
| Age Bracket | Male | Female |
| 5 to 17 Years | 0 (0.0%) | 0 (0.0%) |
| 18 to 34 Years | 0 (0.0%) | 0 (0.0%) |
| 35 to 64 Years | 80 (20.8%) | 29 (8.3%) |
| 65 to 74 Years | 0 (0.0%) | 23 (15.0%) |
| 75 Years and over | 0 (0.0%) | 43 (61.4%) |
Disability Class: Self-Care Difficulty
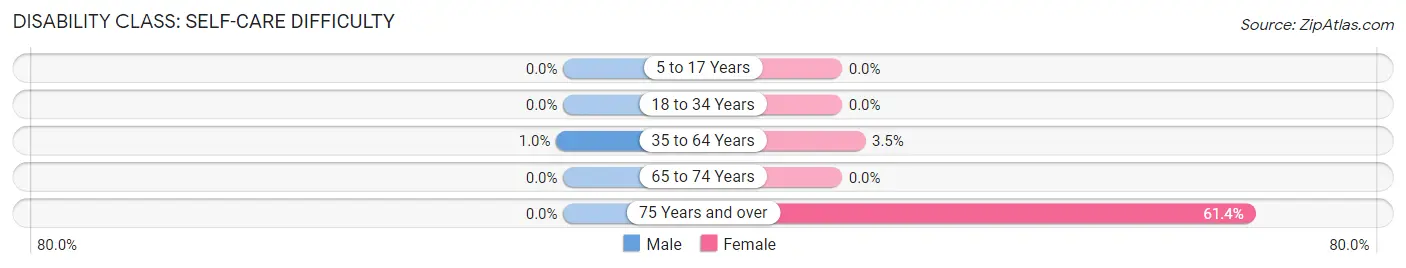
| Age Bracket | Male | Female |
| 5 to 17 Years | 0 (0.0%) | 0 (0.0%) |
| 18 to 34 Years | 0 (0.0%) | 0 (0.0%) |
| 35 to 64 Years | 4 (1.0%) | 12 (3.5%) |
| 65 to 74 Years | 0 (0.0%) | 0 (0.0%) |
| 75 Years and over | 0 (0.0%) | 43 (61.4%) |
Technology Access in Holley
Computing Device Access in Holley
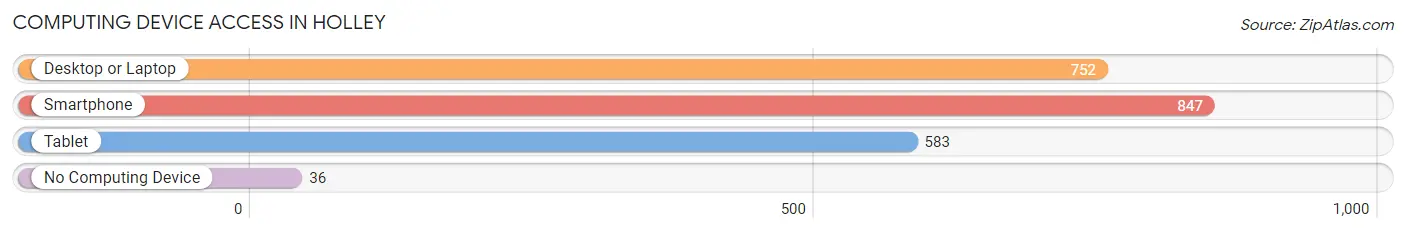
| Device Type | # Households | % Households |
| Desktop or Laptop | 752 | 84.3% |
| Smartphone | 847 | 95.0% |
| Tablet | 583 | 65.4% |
| No Computing Device | 36 | 4.0% |
| Total | 892 | 100.0% |
Internet Access in Holley
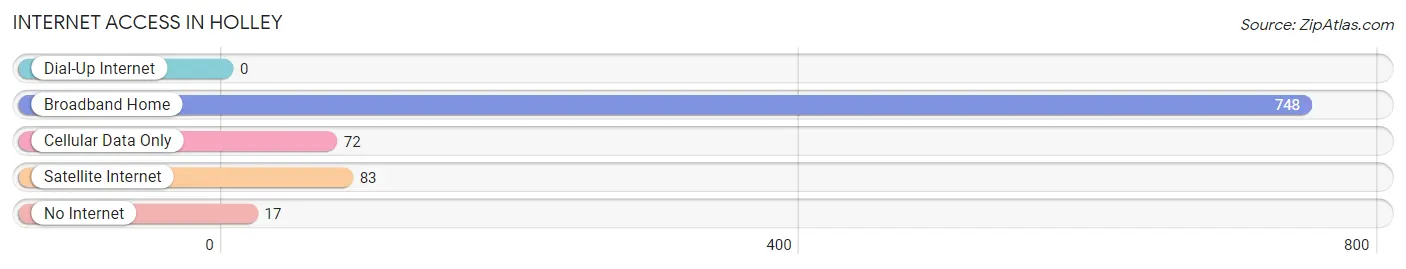
| Internet Type | # Households | % Households |
| Dial-Up Internet | 0 | 0.0% |
| Broadband Home | 748 | 83.9% |
| Cellular Data Only | 72 | 8.1% |
| Satellite Internet | 83 | 9.3% |
| No Internet | 17 | 1.9% |
| Total | 892 | 100.0% |
Holley Summary
Holley is a small unincorporated community located in Santa Rosa County, Florida. It is situated on the northern shore of the Blackwater River, approximately 20 miles east of Pensacola. The community is home to a population of approximately 1,000 people, and is known for its rural charm and small-town atmosphere.
History
Holley was first settled in the early 1800s by a group of settlers from Georgia. The settlement was originally known as “Holly”, after the holly trees that grew in the area. The name was later changed to “Holley”, after a local family.
In 1821, the area was officially incorporated as the Town of Holley. The town was home to a variety of businesses, including a sawmill, a gristmill, a cotton gin, and a general store. The town also had a post office, which opened in 1822.
In the late 1800s, the town began to decline in population as many of the residents moved away in search of better economic opportunities. By the early 1900s, the population had dropped to just over 200 people.
Geography
Holley is located in the northern part of Santa Rosa County, Florida. It is situated on the northern shore of the Blackwater River, approximately 20 miles east of Pensacola. The town is surrounded by a variety of natural features, including the Blackwater River, the Escambia River, and the Perdido Bay.
The town is located in a humid subtropical climate zone, with hot, humid summers and mild winters. The average annual temperature is around 70 degrees Fahrenheit, with an average annual rainfall of around 60 inches.
Economy
The economy of Holley is largely based on agriculture and tourism. The town is home to a variety of farms, including cattle, poultry, and vegetable farms. The town is also home to a number of small businesses, including restaurants, convenience stores, and gas stations.
The town is also home to a number of tourist attractions, including the Blackwater River State Park, the Holley-Navarre Beach, and the Holley-Navarre Wildlife Management Area. These attractions draw visitors from all over the region, providing a boost to the local economy.
Demographics
As of the 2010 census, the population of Holley was 1,000 people. The racial makeup of the town was 94.2% White, 2.2% African American, 0.7% Native American, 0.7% Asian, 0.3% from other races, and 2.1% from two or more races. Hispanic or Latino of any race were 2.3% of the population.
The median household income in Holley was $37,500, and the median family income was $45,000. The per capita income for the town was $19,000. About 11.2% of families and 14.2% of the population were below the poverty line, including 18.2% of those under age 18 and 8.3% of those age 65 or over.
Overall, Holley is a small, rural community with a strong sense of community and a rich history. The town is home to a variety of businesses and attractions, providing a boost to the local economy. The town is also home to a diverse population, with a variety of racial and ethnic backgrounds.
Common Questions
What is Per Capita Income in Holley?
Per Capita income in Holley is $42,277.
What is the Median Family Income in Holley?
Median Family Income in Holley is $116,318.
What is the Median Household income in Holley?
Median Household Income in Holley is $98,125.
What is Income or Wage Gap in Holley?
Income or Wage Gap in Holley is 41.3%.
Women in Holley earn 58.7 cents for every dollar earned by a man.
What is Inequality or Gini Index in Holley?
Inequality or Gini Index in Holley is 0.44.
What is the Total Population of Holley?
Total Population of Holley is 2,455.
What is the Total Male Population of Holley?
Total Male Population of Holley is 1,209.
What is the Total Female Population of Holley?
Total Female Population of Holley is 1,246.
What is the Ratio of Males per 100 Females in Holley?
There are 97.03 Males per 100 Females in Holley.
What is the Ratio of Females per 100 Males in Holley?
There are 103.06 Females per 100 Males in Holley.
What is the Median Population Age in Holley?
Median Population Age in Holley is 36.5 Years.
What is the Average Family Size in Holley
Average Family Size in Holley is 3.3 People.
What is the Average Household Size in Holley
Average Household Size in Holley is 2.8 People.
How Large is the Labor Force in Holley?
There are 1,151 People in the Labor Forcein in Holley.
What is the Percentage of People in the Labor Force in Holley?
63.8% of People are in the Labor Force in Holley.
What is the Unemployment Rate in Holley?
Unemployment Rate in Holley is 5.0%.