Union Park, FL Map & Demographics
Union Park Map
Union Park Overview
$30,163
PER CAPITA INCOME
$90,929
AVG FAMILY INCOME
$79,970
AVG HOUSEHOLD INCOME
0.9%
WAGE / INCOME GAP [ % ]
99.1¢/ $1
WAGE / INCOME GAP [ $ ]
0.36
INEQUALITY / GINI INDEX
10,821
TOTAL POPULATION
5,478
MALE POPULATION
5,343
FEMALE POPULATION
102.53
MALES / 100 FEMALES
97.54
FEMALES / 100 MALES
37.6
MEDIAN AGE
3.5
AVG FAMILY SIZE
3.1
AVG HOUSEHOLD SIZE
6,510
LABOR FORCE [ PEOPLE ]
71.3%
PERCENT IN LABOR FORCE
3.4%
UNEMPLOYMENT RATE
Union Park Area Codes
Income in Union Park
Income Overview in Union Park
Per Capita Income in Union Park is $30,163, while median incomes of families and households are $90,929 and $79,970 respectively.
| Characteristic | Number | Measure |
| Per Capita Income | 10,821 | $30,163 |
| Median Family Income | 2,570 | $90,929 |
| Mean Family Income | 2,570 | $92,473 |
| Median Household Income | 3,433 | $79,970 |
| Mean Household Income | 3,433 | $86,865 |
| Income Deficit | 2,570 | $0 |
| Wage / Income Gap (%) | 10,821 | 0.88% |
| Wage / Income Gap ($) | 10,821 | 99.12¢ per $1 |
| Gini / Inequality Index | 10,821 | 0.36 |
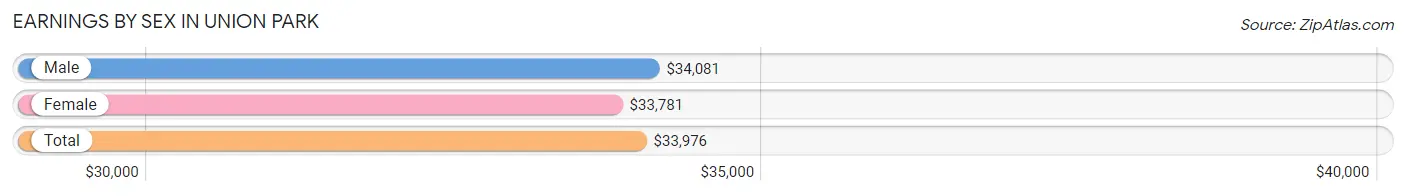
Earnings by Sex in Union Park
Average Earnings in Union Park are $33,976, $34,081 for men and $33,781 for women, a difference of 0.9%.
| Sex | Number | Average Earnings |
| Male | 3,445 (53.0%) | $34,081 |
| Female | 3,051 (47.0%) | $33,781 |
| Total | 6,496 (100.0%) | $33,976 |
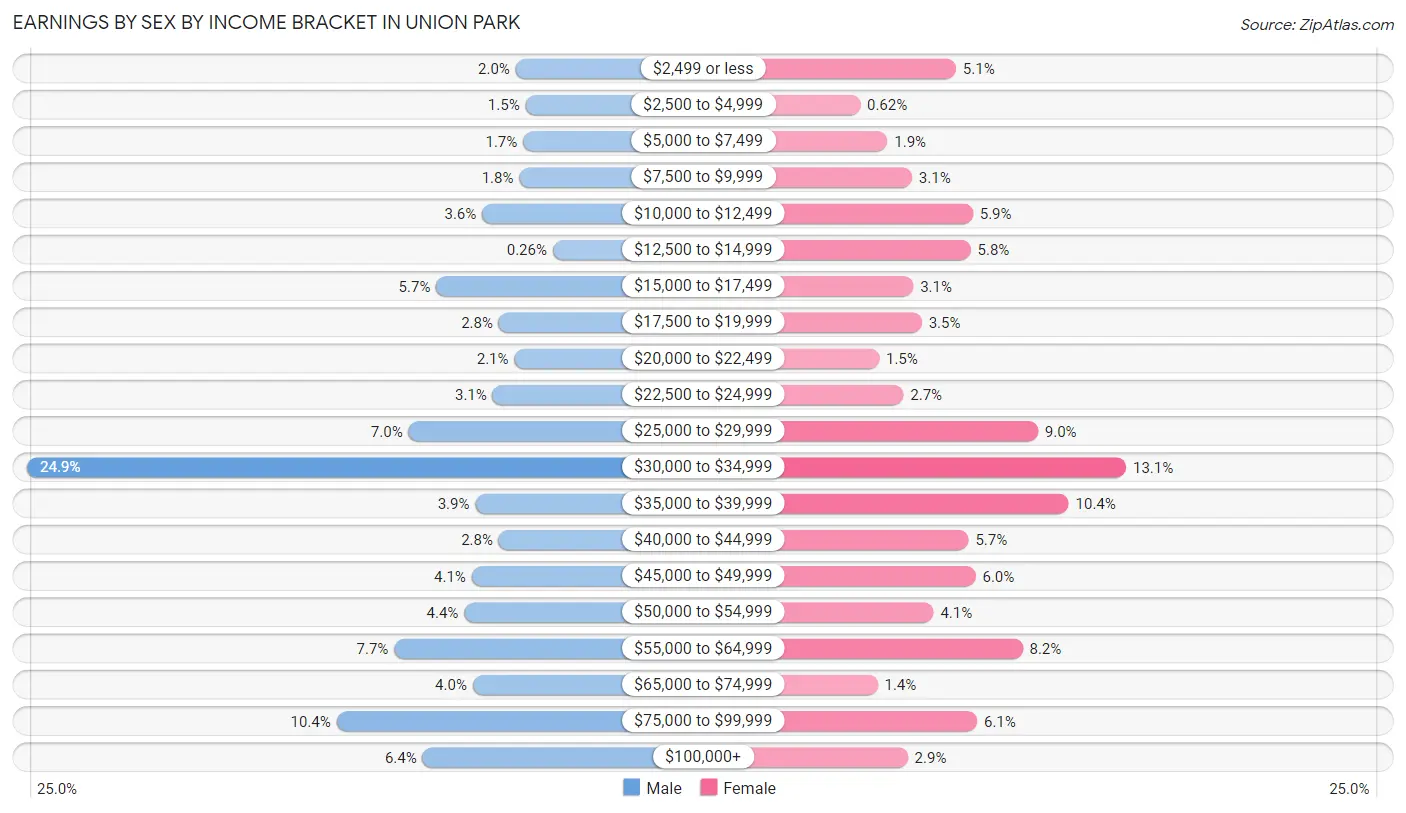
Earnings by Sex by Income Bracket in Union Park
The most common earnings brackets in Union Park are $30,000 to $34,999 for men (857 | 24.9%) and $30,000 to $34,999 for women (399 | 13.1%).
| Income | Male | Female |
| $2,499 or less | 69 (2.0%) | 156 (5.1%) |
| $2,500 to $4,999 | 53 (1.5%) | 19 (0.6%) |
| $5,000 to $7,499 | 57 (1.7%) | 58 (1.9%) |
| $7,500 to $9,999 | 63 (1.8%) | 93 (3.0%) |
| $10,000 to $12,499 | 123 (3.6%) | 180 (5.9%) |
| $12,500 to $14,999 | 9 (0.3%) | 177 (5.8%) |
| $15,000 to $17,499 | 197 (5.7%) | 95 (3.1%) |
| $17,500 to $19,999 | 96 (2.8%) | 107 (3.5%) |
| $20,000 to $22,499 | 71 (2.1%) | 46 (1.5%) |
| $22,500 to $24,999 | 106 (3.1%) | 81 (2.6%) |
| $25,000 to $29,999 | 242 (7.0%) | 273 (8.9%) |
| $30,000 to $34,999 | 857 (24.9%) | 399 (13.1%) |
| $35,000 to $39,999 | 134 (3.9%) | 317 (10.4%) |
| $40,000 to $44,999 | 96 (2.8%) | 174 (5.7%) |
| $45,000 to $49,999 | 140 (4.1%) | 184 (6.0%) |
| $50,000 to $54,999 | 152 (4.4%) | 124 (4.1%) |
| $55,000 to $64,999 | 265 (7.7%) | 251 (8.2%) |
| $65,000 to $74,999 | 138 (4.0%) | 44 (1.4%) |
| $75,000 to $99,999 | 358 (10.4%) | 186 (6.1%) |
| $100,000+ | 219 (6.4%) | 87 (2.9%) |
| Total | 3,445 (100.0%) | 3,051 (100.0%) |
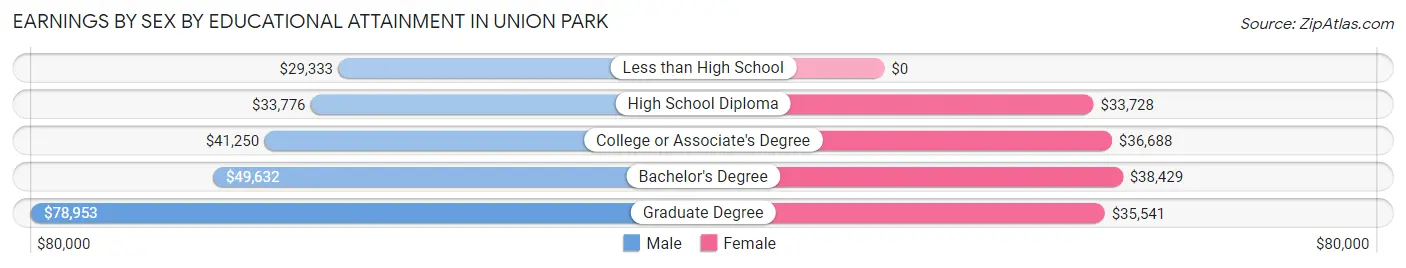
Earnings by Sex by Educational Attainment in Union Park
Average earnings in Union Park are $34,878 for men and $35,378 for women, a difference of 1.4%. Men with an educational attainment of graduate degree enjoy the highest average annual earnings of $78,953, while those with less than high school education earn the least with $29,333. Women with an educational attainment of bachelor's degree earn the most with the average annual earnings of $38,429, while those with high school diploma education have the smallest earnings of $33,728.
| Educational Attainment | Male Income | Female Income |
| Less than High School | $29,333 | $0 |
| High School Diploma | $33,776 | $33,728 |
| College or Associate's Degree | $41,250 | $36,688 |
| Bachelor's Degree | $49,632 | $38,429 |
| Graduate Degree | $78,953 | $35,541 |
| Total | $34,878 | $35,378 |
Family Income in Union Park
Family Income Brackets in Union Park
According to the Union Park family income data, there are 792 families falling into the $100,000 to $149,999 income range, which is the most common income bracket and makes up 30.8% of all families. Conversely, the $10,000 to $14,999 income bracket is the least frequent group with only 8 families (0.3%) belonging to this category.
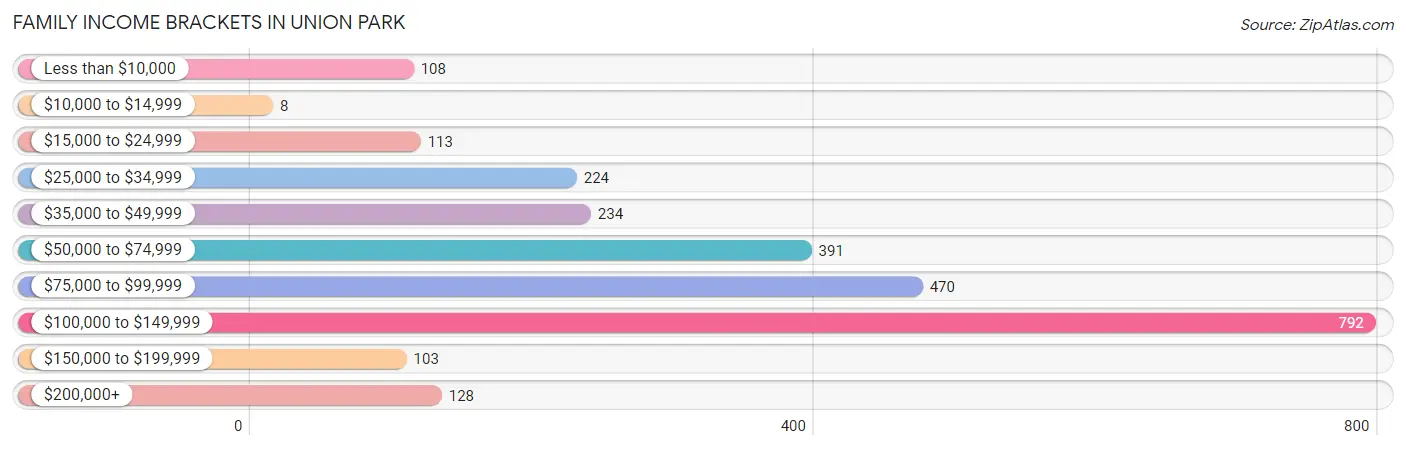
| Income Bracket | # Families | % Families |
| Less than $10,000 | 108 | 4.2% |
| $10,000 to $14,999 | 8 | 0.3% |
| $15,000 to $24,999 | 113 | 4.4% |
| $25,000 to $34,999 | 224 | 8.7% |
| $35,000 to $49,999 | 234 | 9.1% |
| $50,000 to $74,999 | 391 | 15.2% |
| $75,000 to $99,999 | 470 | 18.3% |
| $100,000 to $149,999 | 792 | 30.8% |
| $150,000 to $199,999 | 103 | 4.0% |
| $200,000+ | 128 | 5.0% |
Family Income by Famaliy Size in Union Park
4-person families (520 | 20.2%) account for the highest median family income in Union Park with $105,298 per family, while 2-person families (969 | 37.7%) have the highest median income of $37,533 per family member.
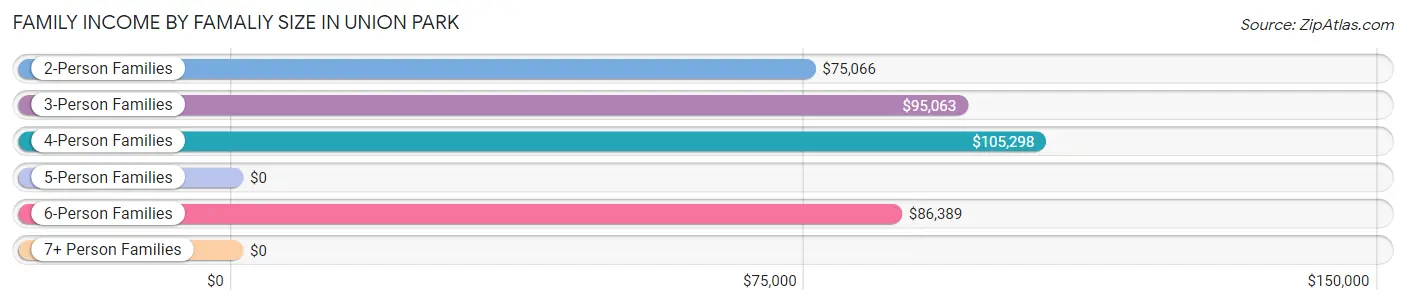
| Income Bracket | # Families | Median Income |
| 2-Person Families | 969 (37.7%) | $75,066 |
| 3-Person Families | 749 (29.1%) | $95,063 |
| 4-Person Families | 520 (20.2%) | $105,298 |
| 5-Person Families | 207 (8.1%) | $0 |
| 6-Person Families | 118 (4.6%) | $86,389 |
| 7+ Person Families | 7 (0.3%) | $0 |
| Total | 2,570 (100.0%) | $90,929 |
Family Income by Number of Earners in Union Park
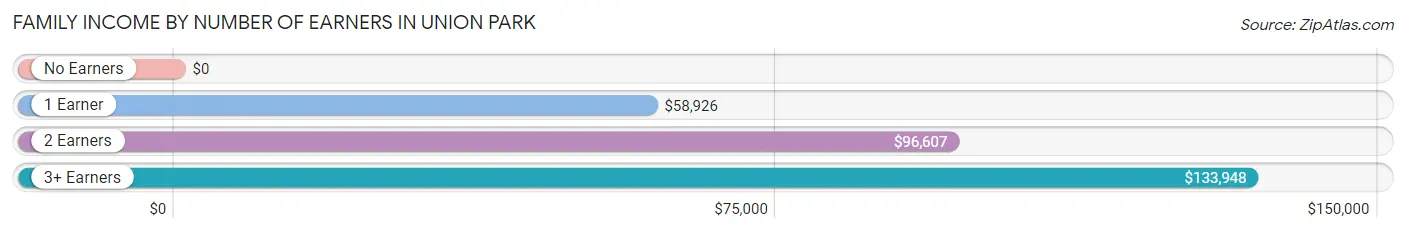
| Number of Earners | # Families | Median Income |
| No Earners | 317 (12.3%) | $0 |
| 1 Earner | 798 (31.0%) | $58,926 |
| 2 Earners | 860 (33.5%) | $96,607 |
| 3+ Earners | 595 (23.2%) | $133,948 |
| Total | 2,570 (100.0%) | $90,929 |
Household Income in Union Park
Household Income Brackets in Union Park
With 906 households falling in the category, the $100,000 to $149,999 income range is the most frequent in Union Park, accounting for 26.4% of all households. In contrast, only 21 households (0.6%) fall into the $10,000 to $14,999 income bracket, making it the least populous group.
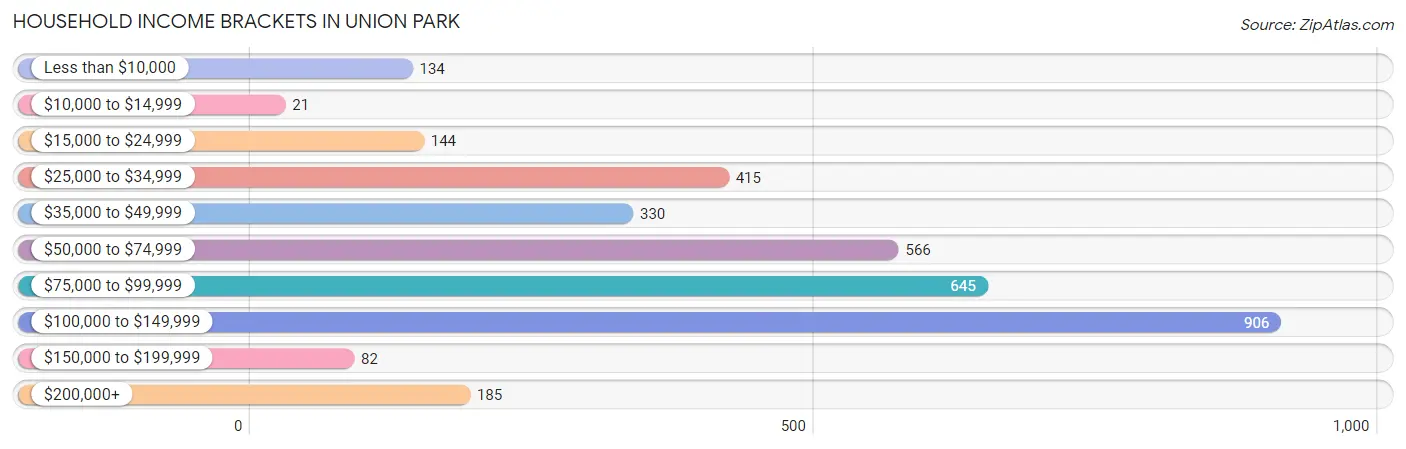
| Income Bracket | # Households | % Households |
| Less than $10,000 | 134 | 3.9% |
| $10,000 to $14,999 | 21 | 0.6% |
| $15,000 to $24,999 | 144 | 4.2% |
| $25,000 to $34,999 | 415 | 12.1% |
| $35,000 to $49,999 | 330 | 9.6% |
| $50,000 to $74,999 | 566 | 16.5% |
| $75,000 to $99,999 | 645 | 18.8% |
| $100,000 to $149,999 | 906 | 26.4% |
| $150,000 to $199,999 | 82 | 2.4% |
| $200,000+ | 185 | 5.4% |
Household Income by Householder Age in Union Park
The median household income in Union Park is $79,970, with the highest median household income of $97,268 found in the 45 to 64 years age bracket for the primary householder. A total of 1,513 households (44.1%) fall into this category. Meanwhile, the 15 to 24 years age bracket for the primary householder has the lowest median household income of $40,375, with 233 households (6.8%) in this group.
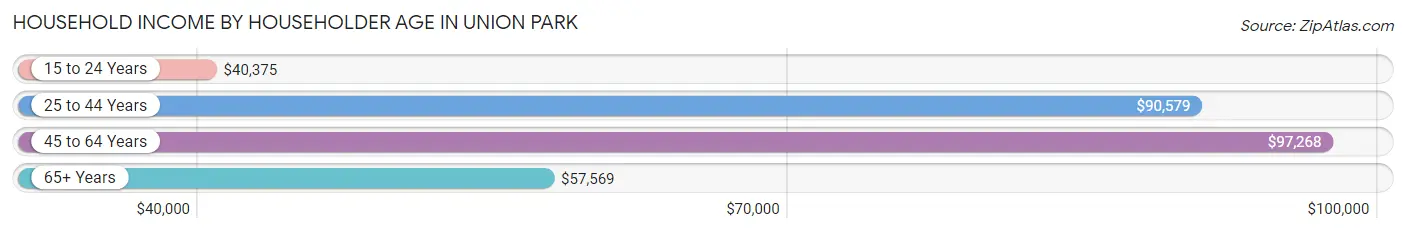
| Income Bracket | # Households | Median Income |
| 15 to 24 Years | 233 (6.8%) | $40,375 |
| 25 to 44 Years | 1,065 (31.0%) | $90,579 |
| 45 to 64 Years | 1,513 (44.1%) | $97,268 |
| 65+ Years | 622 (18.1%) | $57,569 |
| Total | 3,433 (100.0%) | $79,970 |
Poverty in Union Park
Income Below Poverty by Sex and Age in Union Park
With 13.2% poverty level for males and 16.6% for females among the residents of Union Park, under 5 year old males and 16 and 17 year old females are the most vulnerable to poverty, with 161 males (48.8%) and 44 females (56.4%) in their respective age groups living below the poverty level.
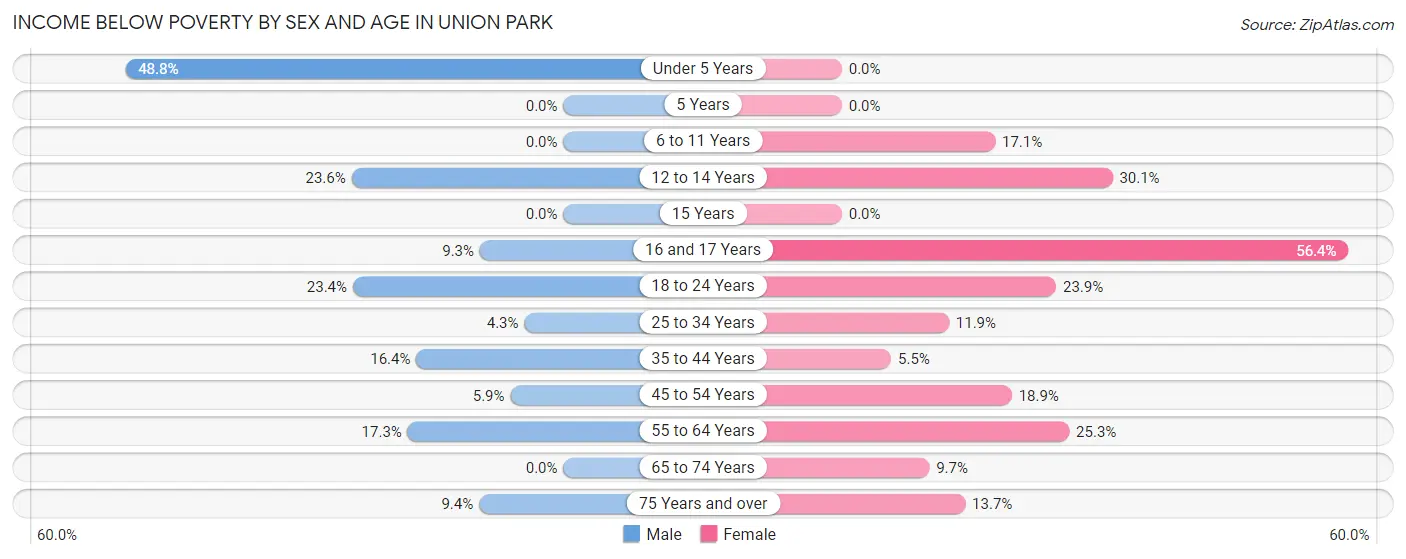
| Age Bracket | Male | Female |
| Under 5 Years | 161 (48.8%) | 0 (0.0%) |
| 5 Years | 0 (0.0%) | 0 (0.0%) |
| 6 to 11 Years | 0 (0.0%) | 56 (17.1%) |
| 12 to 14 Years | 46 (23.6%) | 66 (30.1%) |
| 15 Years | 0 (0.0%) | 0 (0.0%) |
| 16 and 17 Years | 12 (9.3%) | 44 (56.4%) |
| 18 to 24 Years | 158 (23.4%) | 157 (23.9%) |
| 25 to 34 Years | 50 (4.3%) | 88 (11.9%) |
| 35 to 44 Years | 106 (16.4%) | 35 (5.5%) |
| 45 to 54 Years | 39 (5.9%) | 157 (18.9%) |
| 55 to 64 Years | 129 (17.3%) | 196 (25.3%) |
| 65 to 74 Years | 0 (0.0%) | 49 (9.7%) |
| 75 Years and over | 20 (9.4%) | 36 (13.7%) |
| Total | 721 (13.2%) | 884 (16.6%) |
Income Above Poverty by Sex and Age in Union Park
According to the poverty statistics in Union Park, males aged 5 years and females aged under 5 years are the age groups that are most secure financially, with 100.0% of males and 100.0% of females in these age groups living above the poverty line.
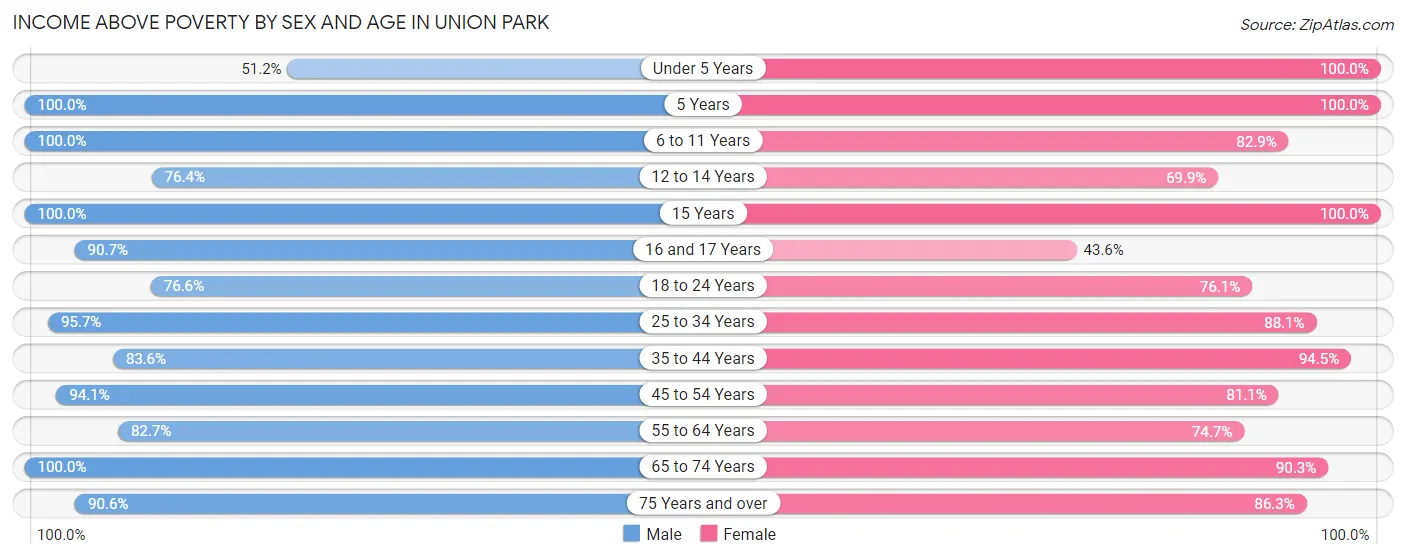
| Age Bracket | Male | Female |
| Under 5 Years | 169 (51.2%) | 162 (100.0%) |
| 5 Years | 60 (100.0%) | 54 (100.0%) |
| 6 to 11 Years | 210 (100.0%) | 272 (82.9%) |
| 12 to 14 Years | 149 (76.4%) | 153 (69.9%) |
| 15 Years | 30 (100.0%) | 90 (100.0%) |
| 16 and 17 Years | 117 (90.7%) | 34 (43.6%) |
| 18 to 24 Years | 516 (76.6%) | 501 (76.1%) |
| 25 to 34 Years | 1,101 (95.7%) | 650 (88.1%) |
| 35 to 44 Years | 541 (83.6%) | 602 (94.5%) |
| 45 to 54 Years | 622 (94.1%) | 673 (81.1%) |
| 55 to 64 Years | 615 (82.7%) | 578 (74.7%) |
| 65 to 74 Years | 425 (100.0%) | 454 (90.3%) |
| 75 Years and over | 193 (90.6%) | 226 (86.3%) |
| Total | 4,748 (86.8%) | 4,449 (83.4%) |
Income Below Poverty Among Married-Couple Families in Union Park
The poverty statistics for married-couple families in Union Park show that 3.0% or 55 of the total 1,848 families live below the poverty line. Families with 1 or 2 children have the highest poverty rate of 8.1%, comprising of 55 families. On the other hand, families with no children have the lowest poverty rate of 0.0%, which includes 0 families.
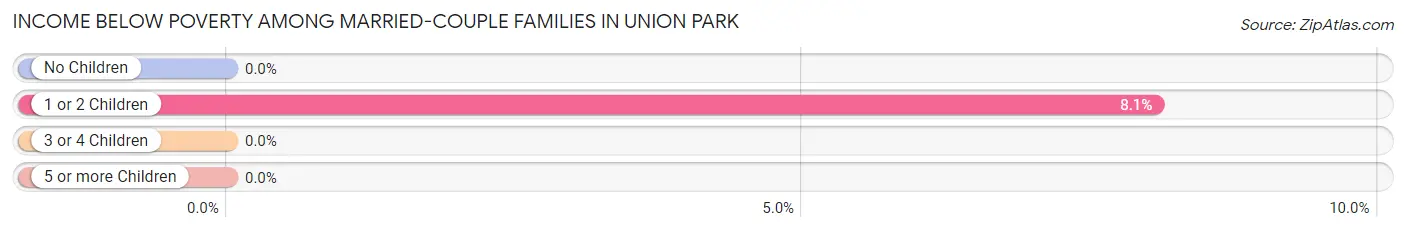
| Children | Above Poverty | Below Poverty |
| No Children | 1,124 (100.0%) | 0 (0.0%) |
| 1 or 2 Children | 627 (91.9%) | 55 (8.1%) |
| 3 or 4 Children | 42 (100.0%) | 0 (0.0%) |
| 5 or more Children | 0 (0.0%) | 0 (0.0%) |
| Total | 1,793 (97.0%) | 55 (3.0%) |
Income Below Poverty Among Single-Parent Households in Union Park
According to the poverty data in Union Park, 23.0% or 64 single-father households and 27.7% or 123 single-mother households are living below the poverty line. Among single-father households, those with 1 or 2 children have the highest poverty rate, with 64 households (51.2%) experiencing poverty. Likewise, among single-mother households, those with 3 or 4 children have the highest poverty rate, with 22 households (100.0%) falling below the poverty line.
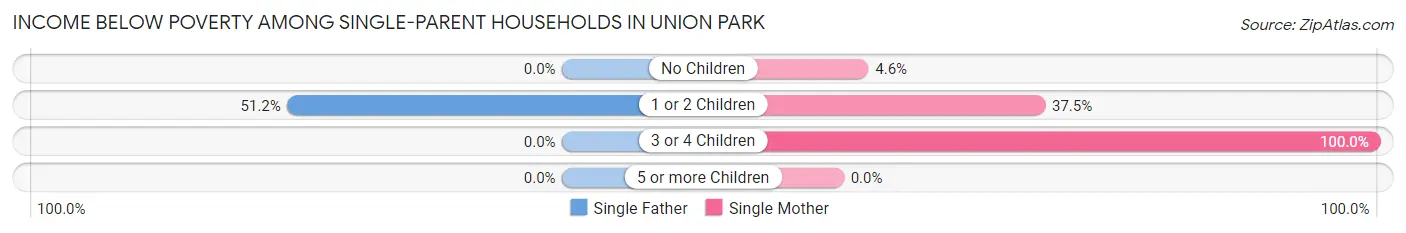
| Children | Single Father | Single Mother |
| No Children | 0 (0.0%) | 8 (4.6%) |
| 1 or 2 Children | 64 (51.2%) | 93 (37.5%) |
| 3 or 4 Children | 0 (0.0%) | 22 (100.0%) |
| 5 or more Children | 0 (0.0%) | 0 (0.0%) |
| Total | 64 (23.0%) | 123 (27.7%) |
Income Below Poverty Among Married-Couple vs Single-Parent Households in Union Park
The poverty data for Union Park shows that 55 of the married-couple family households (3.0%) and 187 of the single-parent households (25.9%) are living below the poverty level. Within the married-couple family households, those with 1 or 2 children have the highest poverty rate, with 55 households (8.1%) falling below the poverty line. Among the single-parent households, those with 3 or 4 children have the highest poverty rate, with 22 household (100.0%) living below poverty.
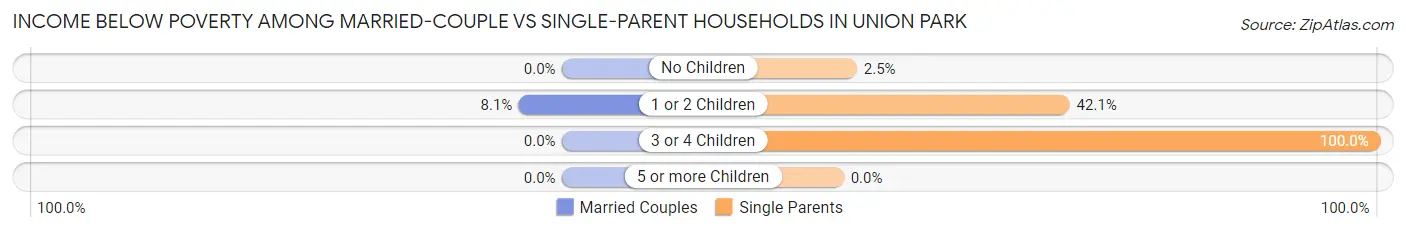
| Children | Married-Couple Families | Single-Parent Households |
| No Children | 0 (0.0%) | 8 (2.5%) |
| 1 or 2 Children | 55 (8.1%) | 157 (42.1%) |
| 3 or 4 Children | 0 (0.0%) | 22 (100.0%) |
| 5 or more Children | 0 (0.0%) | 0 (0.0%) |
| Total | 55 (3.0%) | 187 (25.9%) |
Race in Union Park
The most populous races in Union Park are White / Caucasian (6,324 | 58.4%), Hispanic or Latino (4,838 | 44.7%), and Two or more Races (1,772 | 16.4%).
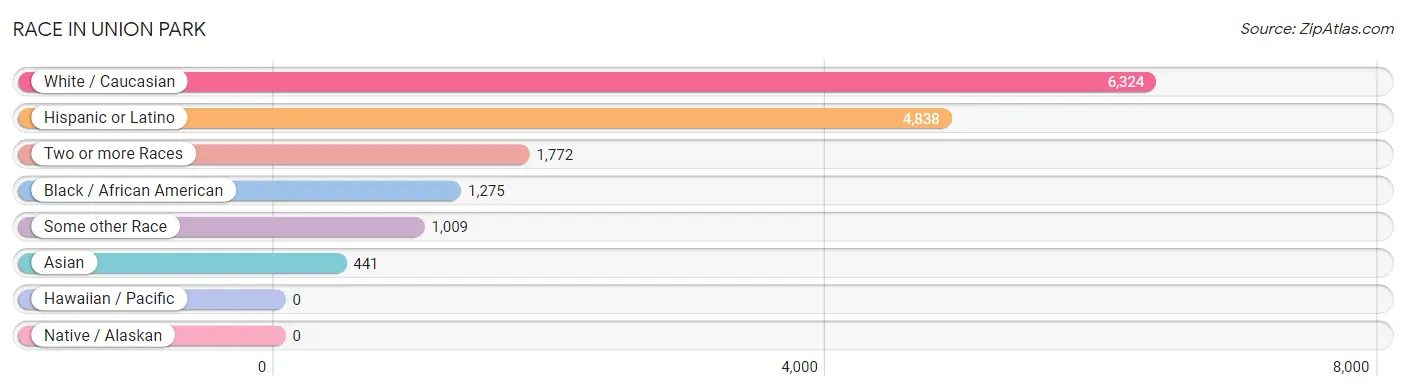
| Race | # Population | % Population |
| Asian | 441 | 4.1% |
| Black / African American | 1,275 | 11.8% |
| Hawaiian / Pacific | 0 | 0.0% |
| Hispanic or Latino | 4,838 | 44.7% |
| Native / Alaskan | 0 | 0.0% |
| White / Caucasian | 6,324 | 58.4% |
| Two or more Races | 1,772 | 16.4% |
| Some other Race | 1,009 | 9.3% |
| Total | 10,821 | 100.0% |
Ancestry in Union Park
The most populous ancestries reported in Union Park are Puerto Rican (3,150 | 29.1%), American (1,164 | 10.8%), German (752 | 7.0%), Irish (600 | 5.5%), and Cuban (491 | 4.5%), together accounting for 56.9% of all Union Park residents.
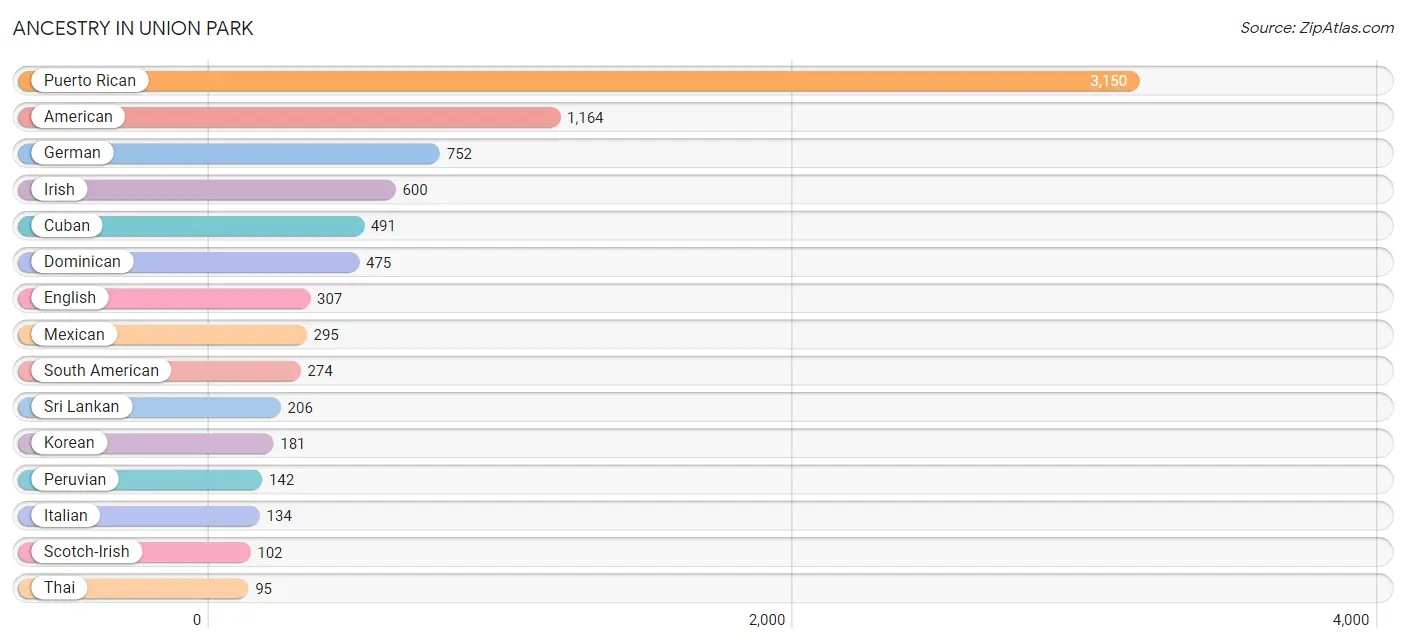
| Ancestry | # Population | % Population |
| African | 46 | 0.4% |
| American | 1,164 | 10.8% |
| Arab | 47 | 0.4% |
| Basque | 16 | 0.2% |
| Belgian | 8 | 0.1% |
| Bhutanese | 15 | 0.1% |
| Brazilian | 11 | 0.1% |
| British | 6 | 0.1% |
| British West Indian | 63 | 0.6% |
| Carpatho Rusyn | 12 | 0.1% |
| Central American | 9 | 0.1% |
| Central American Indian | 85 | 0.8% |
| Cherokee | 5 | 0.1% |
| Chilean | 12 | 0.1% |
| Chippewa | 23 | 0.2% |
| Colombian | 35 | 0.3% |
| Croatian | 7 | 0.1% |
| Cuban | 491 | 4.5% |
| Czech | 7 | 0.1% |
| Czechoslovakian | 17 | 0.2% |
| Dominican | 475 | 4.4% |
| Dutch | 36 | 0.3% |
| English | 307 | 2.8% |
| European | 94 | 0.9% |
| French | 94 | 0.9% |
| French Canadian | 8 | 0.1% |
| German | 752 | 7.0% |
| Greek | 6 | 0.1% |
| Guatemalan | 1 | 0.0% |
| Guyanese | 20 | 0.2% |
| Haitian | 47 | 0.4% |
| Honduran | 8 | 0.1% |
| Hungarian | 23 | 0.2% |
| Indian (Asian) | 93 | 0.9% |
| Iranian | 33 | 0.3% |
| Irish | 600 | 5.5% |
| Israeli | 9 | 0.1% |
| Italian | 134 | 1.2% |
| Jamaican | 1 | 0.0% |
| Korean | 181 | 1.7% |
| Laotian | 56 | 0.5% |
| Lebanese | 47 | 0.4% |
| Mexican | 295 | 2.7% |
| Nigerian | 11 | 0.1% |
| Peruvian | 142 | 1.3% |
| Polish | 79 | 0.7% |
| Puerto Rican | 3,150 | 29.1% |
| Russian | 22 | 0.2% |
| Scandinavian | 70 | 0.6% |
| Scotch-Irish | 102 | 0.9% |
| Scottish | 32 | 0.3% |
| Seminole | 2 | 0.0% |
| Slovak | 16 | 0.2% |
| South American | 274 | 2.5% |
| South American Indian | 71 | 0.7% |
| Spaniard | 28 | 0.3% |
| Spanish | 45 | 0.4% |
| Sri Lankan | 206 | 1.9% |
| Subsaharan African | 57 | 0.5% |
| Swedish | 24 | 0.2% |
| Swiss | 65 | 0.6% |
| Thai | 95 | 0.9% |
| Trinidadian and Tobagonian | 71 | 0.7% |
| Ukrainian | 29 | 0.3% |
| Venezuelan | 85 | 0.8% |
| Welsh | 33 | 0.3% |
| West Indian | 19 | 0.2% | View All 67 Rows |
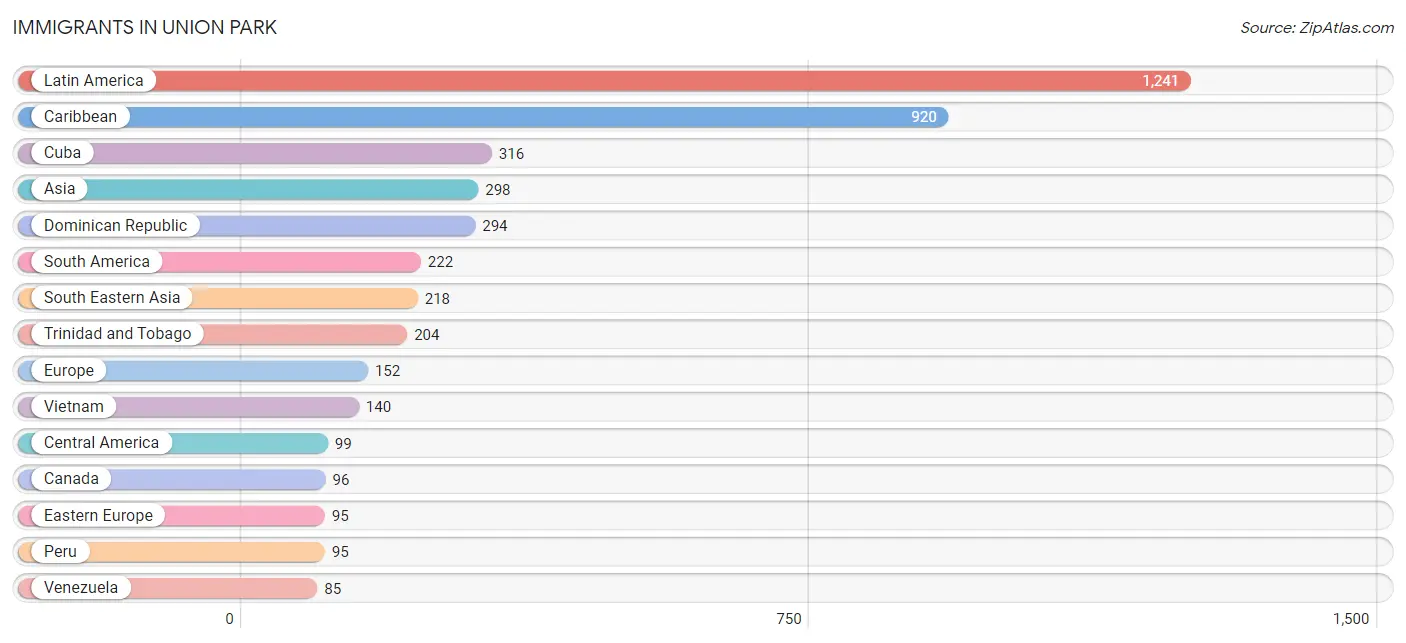
Immigrants in Union Park
The most numerous immigrant groups reported in Union Park came from Latin America (1,241 | 11.5%), Caribbean (920 | 8.5%), Cuba (316 | 2.9%), Asia (298 | 2.8%), and Dominican Republic (294 | 2.7%), together accounting for 28.4% of all Union Park residents.
| Immigration Origin | # Population | % Population |
| Africa | 70 | 0.6% |
| Asia | 298 | 2.8% |
| Bosnia and Herzegovina | 33 | 0.3% |
| Brazil | 11 | 0.1% |
| Canada | 96 | 0.9% |
| Caribbean | 920 | 8.5% |
| Central America | 99 | 0.9% |
| China | 26 | 0.2% |
| Colombia | 11 | 0.1% |
| Costa Rica | 19 | 0.2% |
| Croatia | 7 | 0.1% |
| Cuba | 316 | 2.9% |
| Czechoslovakia | 8 | 0.1% |
| Dominican Republic | 294 | 2.7% |
| Eastern Africa | 49 | 0.4% |
| Eastern Asia | 26 | 0.2% |
| Eastern Europe | 95 | 0.9% |
| Eritrea | 49 | 0.4% |
| Europe | 152 | 1.4% |
| Germany | 29 | 0.3% |
| Guatemala | 1 | 0.0% |
| Guyana | 20 | 0.2% |
| Haiti | 69 | 0.6% |
| Hungary | 23 | 0.2% |
| India | 14 | 0.1% |
| Indonesia | 22 | 0.2% |
| Iran | 33 | 0.3% |
| Kazakhstan | 7 | 0.1% |
| Latin America | 1,241 | 11.5% |
| Mexico | 79 | 0.7% |
| Nigeria | 21 | 0.2% |
| Peru | 95 | 0.9% |
| Philippines | 56 | 0.5% |
| Russia | 15 | 0.1% |
| South America | 222 | 2.1% |
| South Central Asia | 54 | 0.5% |
| South Eastern Asia | 218 | 2.0% |
| Southern Europe | 28 | 0.3% |
| Spain | 28 | 0.3% |
| Trinidad and Tobago | 204 | 1.9% |
| Ukraine | 9 | 0.1% |
| Venezuela | 85 | 0.8% |
| Vietnam | 140 | 1.3% |
| Western Africa | 21 | 0.2% |
| Western Europe | 29 | 0.3% | View All 45 Rows |
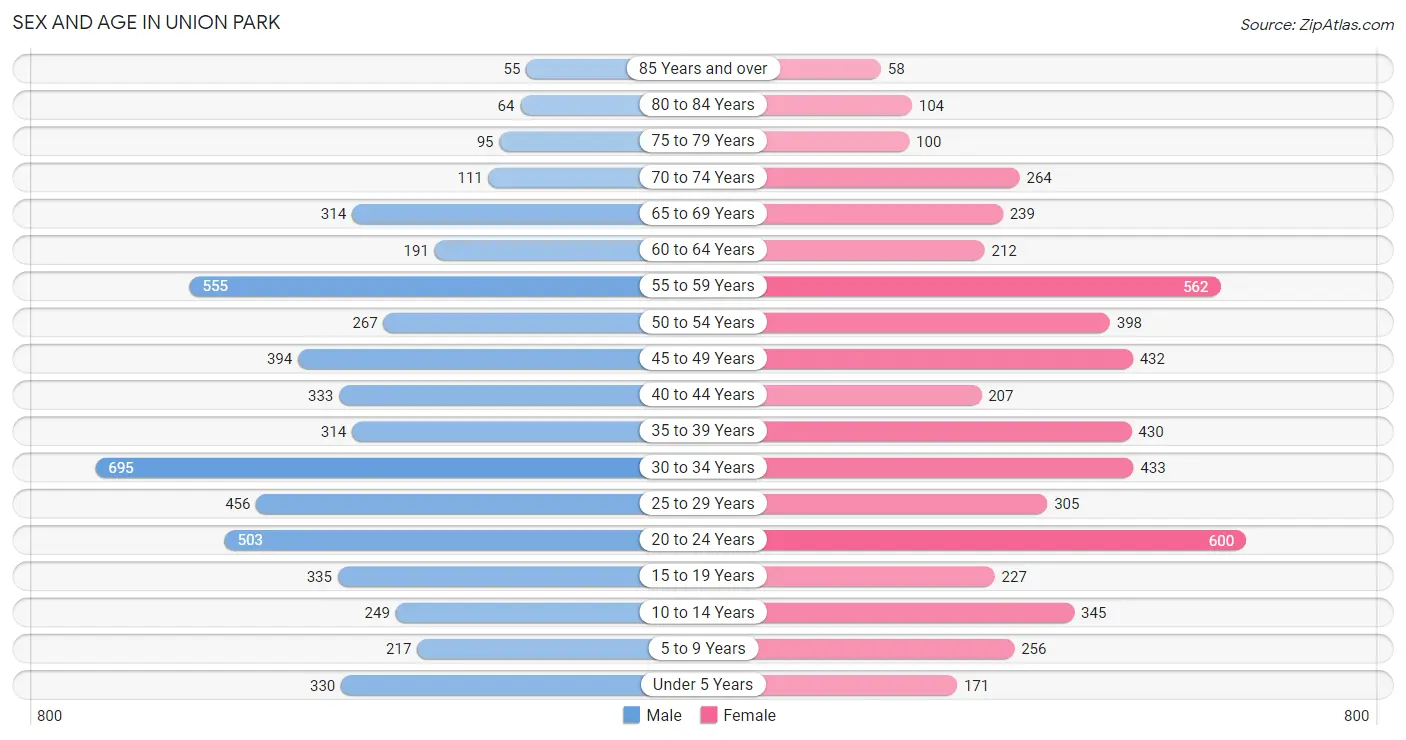
Sex and Age in Union Park
Sex and Age in Union Park
The most populous age groups in Union Park are 30 to 34 Years (695 | 12.7%) for men and 20 to 24 Years (600 | 11.2%) for women.
| Age Bracket | Male | Female |
| Under 5 Years | 330 (6.0%) | 171 (3.2%) |
| 5 to 9 Years | 217 (4.0%) | 256 (4.8%) |
| 10 to 14 Years | 249 (4.5%) | 345 (6.5%) |
| 15 to 19 Years | 335 (6.1%) | 227 (4.3%) |
| 20 to 24 Years | 503 (9.2%) | 600 (11.2%) |
| 25 to 29 Years | 456 (8.3%) | 305 (5.7%) |
| 30 to 34 Years | 695 (12.7%) | 433 (8.1%) |
| 35 to 39 Years | 314 (5.7%) | 430 (8.1%) |
| 40 to 44 Years | 333 (6.1%) | 207 (3.9%) |
| 45 to 49 Years | 394 (7.2%) | 432 (8.1%) |
| 50 to 54 Years | 267 (4.9%) | 398 (7.4%) |
| 55 to 59 Years | 555 (10.1%) | 562 (10.5%) |
| 60 to 64 Years | 191 (3.5%) | 212 (4.0%) |
| 65 to 69 Years | 314 (5.7%) | 239 (4.5%) |
| 70 to 74 Years | 111 (2.0%) | 264 (4.9%) |
| 75 to 79 Years | 95 (1.7%) | 100 (1.9%) |
| 80 to 84 Years | 64 (1.2%) | 104 (1.9%) |
| 85 Years and over | 55 (1.0%) | 58 (1.1%) |
| Total | 5,478 (100.0%) | 5,343 (100.0%) |
Families and Households in Union Park
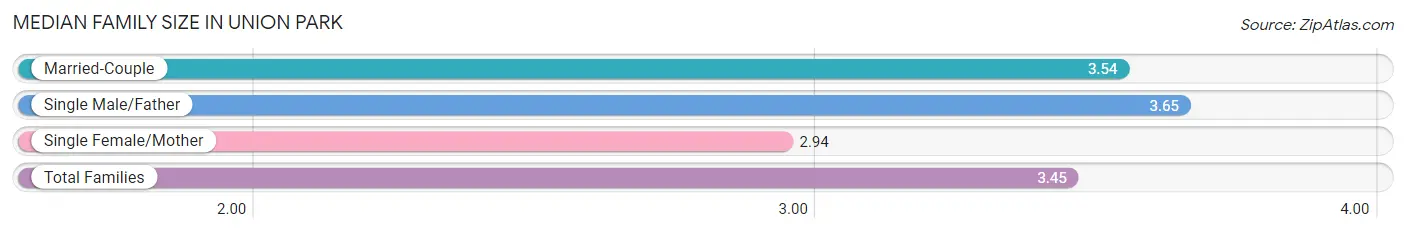
Median Family Size in Union Park
The median family size in Union Park is 3.45 persons per family, with single male/father families (278 | 10.8%) accounting for the largest median family size of 3.65 persons per family. On the other hand, single female/mother families (444 | 17.3%) represent the smallest median family size with 2.94 persons per family.
| Family Type | # Families | Family Size |
| Married-Couple | 1,848 (71.9%) | 3.54 |
| Single Male/Father | 278 (10.8%) | 3.65 |
| Single Female/Mother | 444 (17.3%) | 2.94 |
| Total Families | 2,570 (100.0%) | 3.45 |
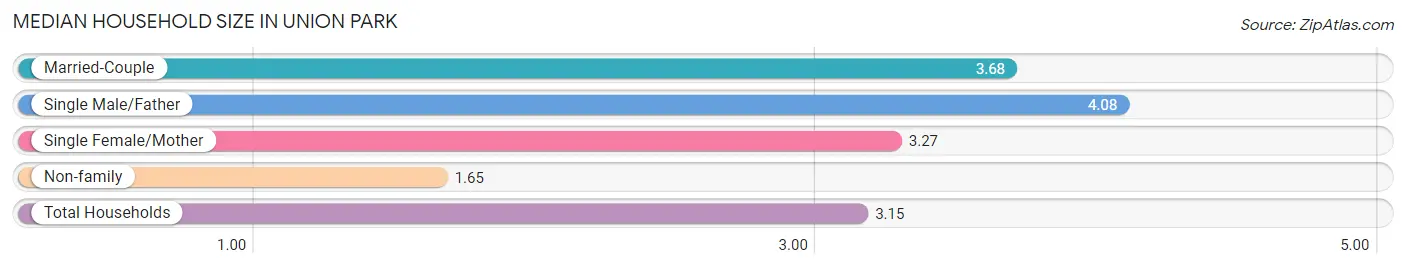
Median Household Size in Union Park
The median household size in Union Park is 3.15 persons per household, with single male/father households (278 | 8.1%) accounting for the largest median household size of 4.08 persons per household. non-family households (863 | 25.1%) represent the smallest median household size with 1.65 persons per household.
| Household Type | # Households | Household Size |
| Married-Couple | 1,848 (53.8%) | 3.68 |
| Single Male/Father | 278 (8.1%) | 4.08 |
| Single Female/Mother | 444 (12.9%) | 3.27 |
| Non-family | 863 (25.1%) | 1.65 |
| Total Households | 3,433 (100.0%) | 3.15 |
Household Size by Marriage Status in Union Park
Out of a total of 3,433 households in Union Park, 2,570 (74.9%) are family households, while 863 (25.1%) are nonfamily households. The most numerous type of family households are 2-person households, comprising 904, and the most common type of nonfamily households are 1-person households, comprising 531.
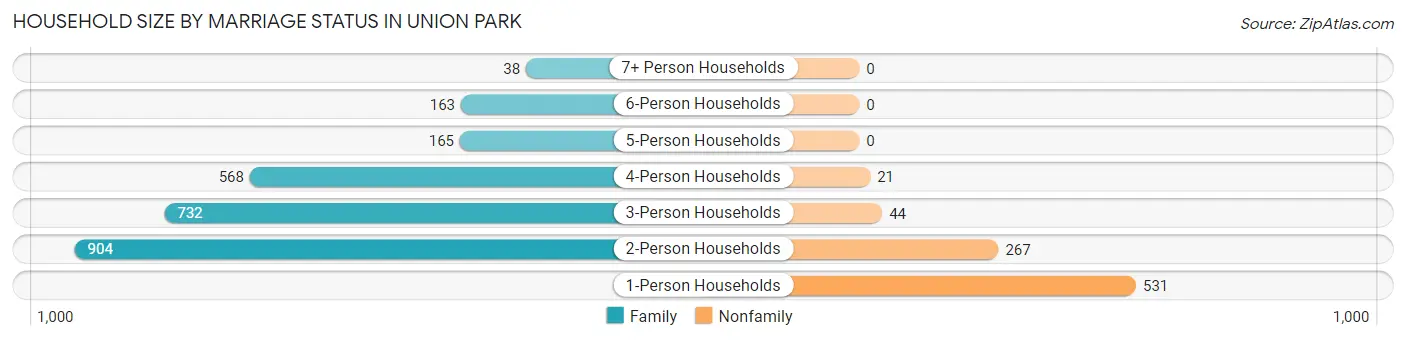
| Household Size | Family Households | Nonfamily Households |
| 1-Person Households | - | 531 (15.5%) |
| 2-Person Households | 904 (26.3%) | 267 (7.8%) |
| 3-Person Households | 732 (21.3%) | 44 (1.3%) |
| 4-Person Households | 568 (16.6%) | 21 (0.6%) |
| 5-Person Households | 165 (4.8%) | 0 (0.0%) |
| 6-Person Households | 163 (4.8%) | 0 (0.0%) |
| 7+ Person Households | 38 (1.1%) | 0 (0.0%) |
| Total | 2,570 (74.9%) | 863 (25.1%) |
Female Fertility in Union Park
Fertility by Age in Union Park
Average fertility rate in Union Park is 24.0 births per 1,000 women. Women in the age bracket of 15 to 19 years have the highest fertility rate with 137.0 births per 1,000 women. Women in the age bracket of 20 to 34 years acount for 53.7% of all women with births.
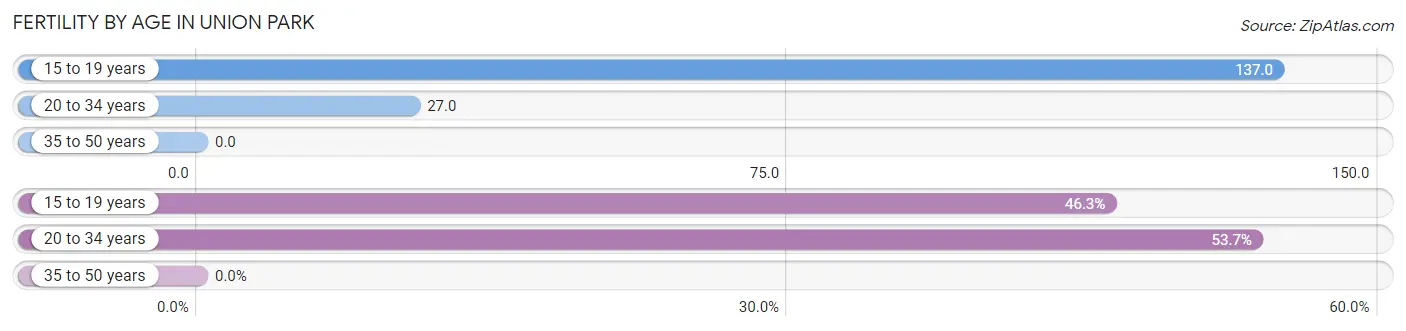
| Age Bracket | Women with Births | Births / 1,000 Women |
| 15 to 19 years | 31 (46.3%) | 137.0 |
| 20 to 34 years | 36 (53.7%) | 27.0 |
| 35 to 50 years | 0 (0.0%) | 0.0 |
| Total | 67 (100.0%) | 24.0 |
Fertility by Age by Marriage Status in Union Park
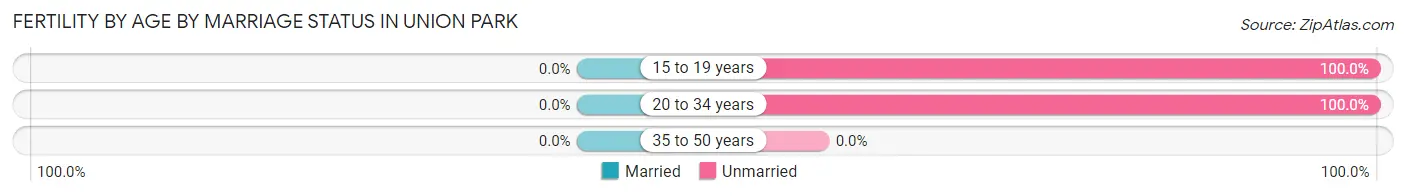
| Age Bracket | Married | Unmarried |
| 15 to 19 years | 0 (0.0%) | 31 (100.0%) |
| 20 to 34 years | 0 (0.0%) | 36 (100.0%) |
| 35 to 50 years | 0 (0.0%) | 0 (0.0%) |
| Total | 0 (0.0%) | 67 (100.0%) |
Fertility by Education in Union Park
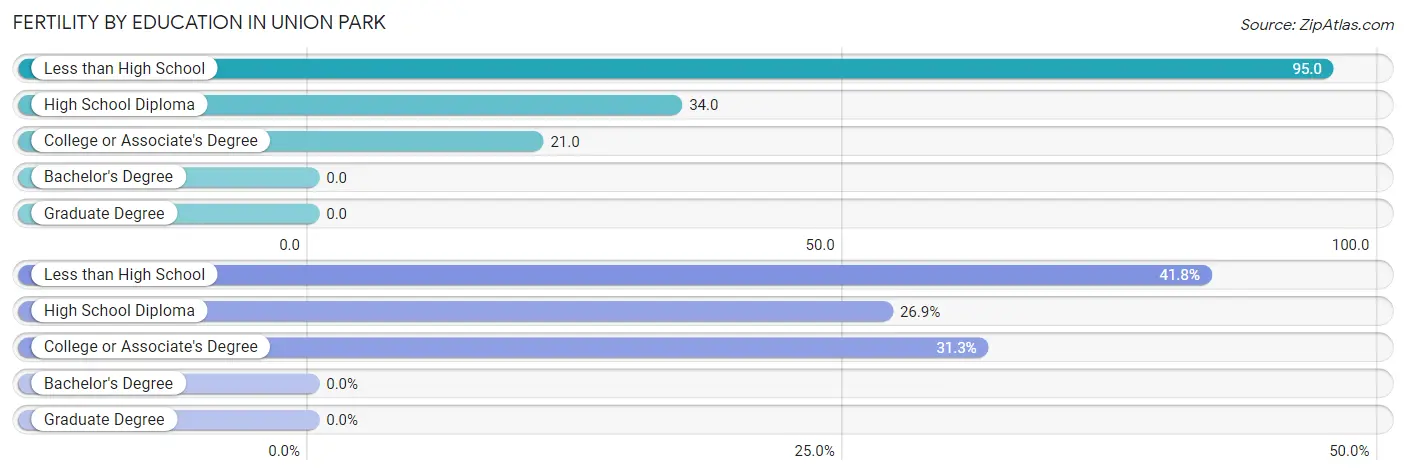
| Educational Attainment | Women with Births | Births / 1,000 Women |
| Less than High School | 28 (41.8%) | 95.0 |
| High School Diploma | 18 (26.9%) | 34.0 |
| College or Associate's Degree | 21 (31.3%) | 21.0 |
| Bachelor's Degree | 0 (0.0%) | 0.0 |
| Graduate Degree | 0 (0.0%) | 0.0 |
| Total | 67 (100.0%) | 24.0 |
Fertility by Education by Marriage Status in Union Park
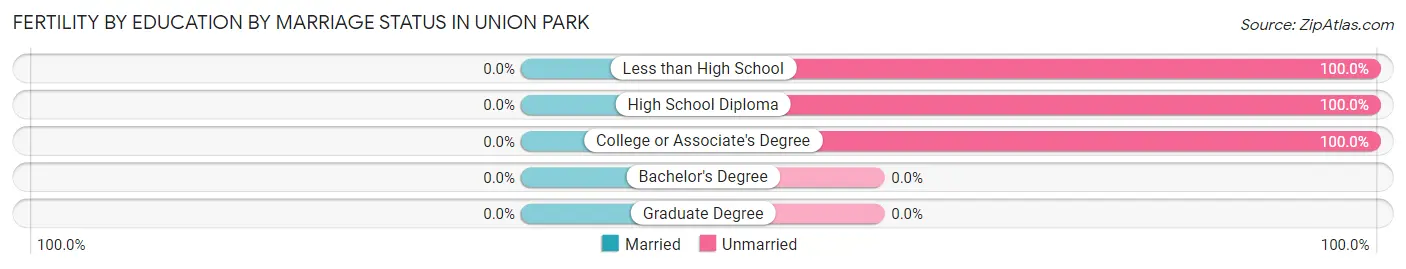
| Educational Attainment | Married | Unmarried |
| Less than High School | 0 (0.0%) | 28 (100.0%) |
| High School Diploma | 0 (0.0%) | 18 (100.0%) |
| College or Associate's Degree | 0 (0.0%) | 21 (100.0%) |
| Bachelor's Degree | 0 (0.0%) | 0 (0.0%) |
| Graduate Degree | 0 (0.0%) | 0 (0.0%) |
| Total | 0 (0.0%) | 67 (100.0%) |
Employment Characteristics in Union Park
Employment by Class of Employer in Union Park
Among the 6,176 employed individuals in Union Park, private company employees (4,486 | 72.6%), self-employed (not incorporated) (514 | 8.3%), and state government employees (325 | 5.3%) make up the most common classes of employment.
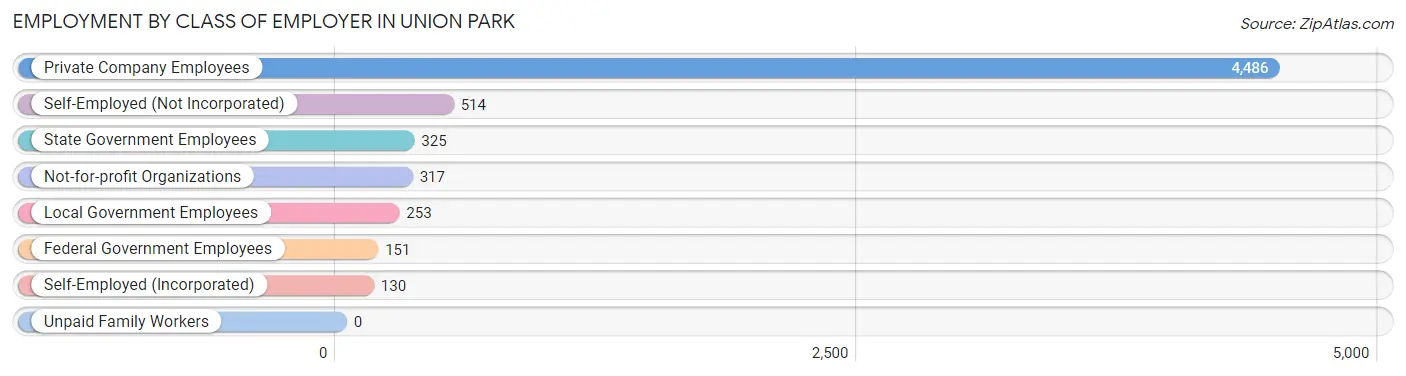
| Employer Class | # Employees | % Employees |
| Private Company Employees | 4,486 | 72.6% |
| Self-Employed (Incorporated) | 130 | 2.1% |
| Self-Employed (Not Incorporated) | 514 | 8.3% |
| Not-for-profit Organizations | 317 | 5.1% |
| Local Government Employees | 253 | 4.1% |
| State Government Employees | 325 | 5.3% |
| Federal Government Employees | 151 | 2.4% |
| Unpaid Family Workers | 0 | 0.0% |
| Total | 6,176 | 100.0% |
Employment Status by Age in Union Park
According to the labor force statistics for Union Park, out of the total population over 16 years of age (9,130), 71.3% or 6,510 individuals are in the labor force, with 3.4% or 221 of them unemployed. The age group with the highest labor force participation rate is 25 to 29 years, with 90.1% or 686 individuals in the labor force. Within the labor force, the 20 to 24 years age range has the highest percentage of unemployed individuals, with 10.7% or 101 of them being unemployed.
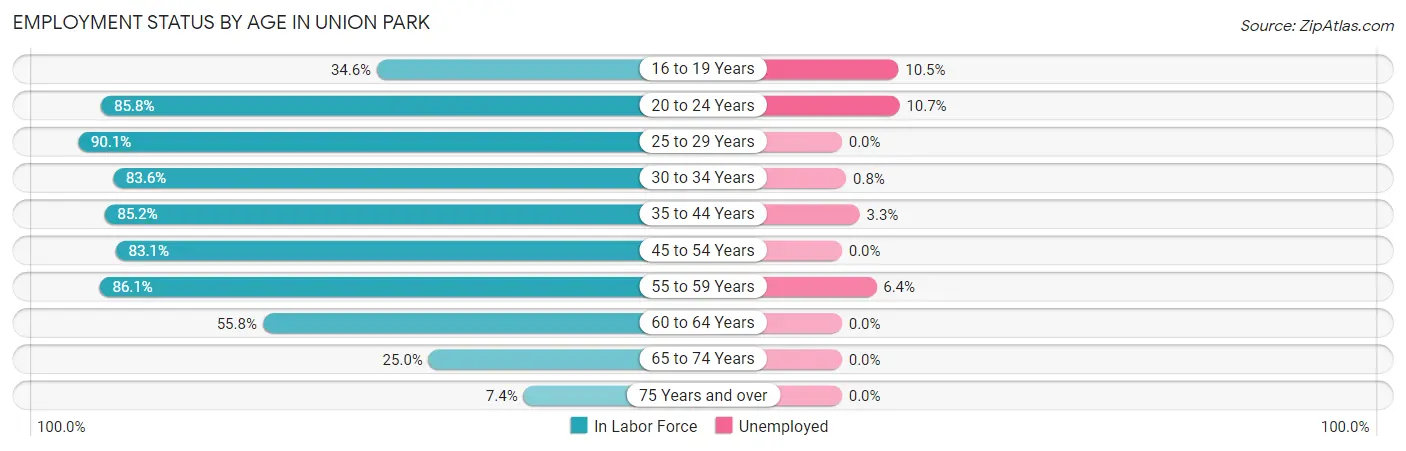
| Age Bracket | In Labor Force | Unemployed |
| 16 to 19 Years | 152 (34.6%) | 16 (10.5%) |
| 20 to 24 Years | 946 (85.8%) | 101 (10.7%) |
| 25 to 29 Years | 686 (90.1%) | 0 (0.0%) |
| 30 to 34 Years | 943 (83.6%) | 8 (0.8%) |
| 35 to 44 Years | 1,094 (85.2%) | 36 (3.3%) |
| 45 to 54 Years | 1,239 (83.1%) | 0 (0.0%) |
| 55 to 59 Years | 962 (86.1%) | 62 (6.4%) |
| 60 to 64 Years | 225 (55.8%) | 0 (0.0%) |
| 65 to 74 Years | 232 (25.0%) | 0 (0.0%) |
| 75 Years and over | 35 (7.4%) | 0 (0.0%) |
| Total | 6,510 (71.3%) | 221 (3.4%) |
Employment Status by Educational Attainment in Union Park
According to labor force statistics for Union Park, 83.3% of individuals (5,151) out of the total population between 25 and 64 years of age (6,184) are in the labor force, with 2.1% or 108 of them being unemployed. The group with the highest labor force participation rate are those with the educational attainment of bachelor's degree or higher, with 89.0% or 1,711 individuals in the labor force. Within the labor force, individuals with college / associate degree education have the highest percentage of unemployment, with 3.2% or 44 of them being unemployed.
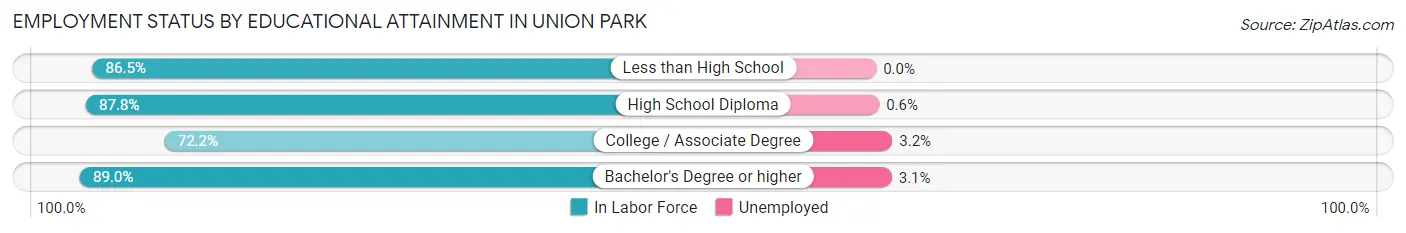
| Educational Attainment | In Labor Force | Unemployed |
| Less than High School | 422 (86.5%) | 0 (0.0%) |
| High School Diploma | 1,630 (87.8%) | 11 (0.6%) |
| College / Associate Degree | 1,384 (72.2%) | 61 (3.2%) |
| Bachelor's Degree or higher | 1,711 (89.0%) | 60 (3.1%) |
| Total | 5,151 (83.3%) | 130 (2.1%) |
Employment Occupations by Sex in Union Park
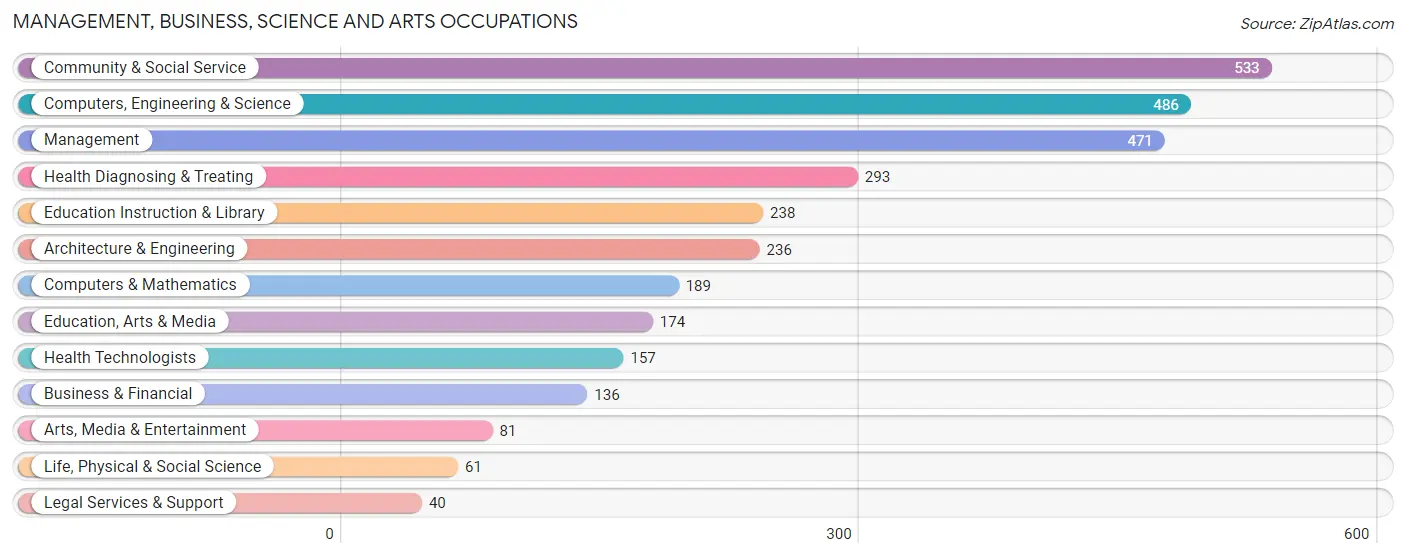
Management, Business, Science and Arts Occupations
The most common Management, Business, Science and Arts occupations in Union Park are Community & Social Service (533 | 8.5%), Computers, Engineering & Science (486 | 7.7%), Management (471 | 7.5%), Health Diagnosing & Treating (293 | 4.7%), and Education Instruction & Library (238 | 3.8%).
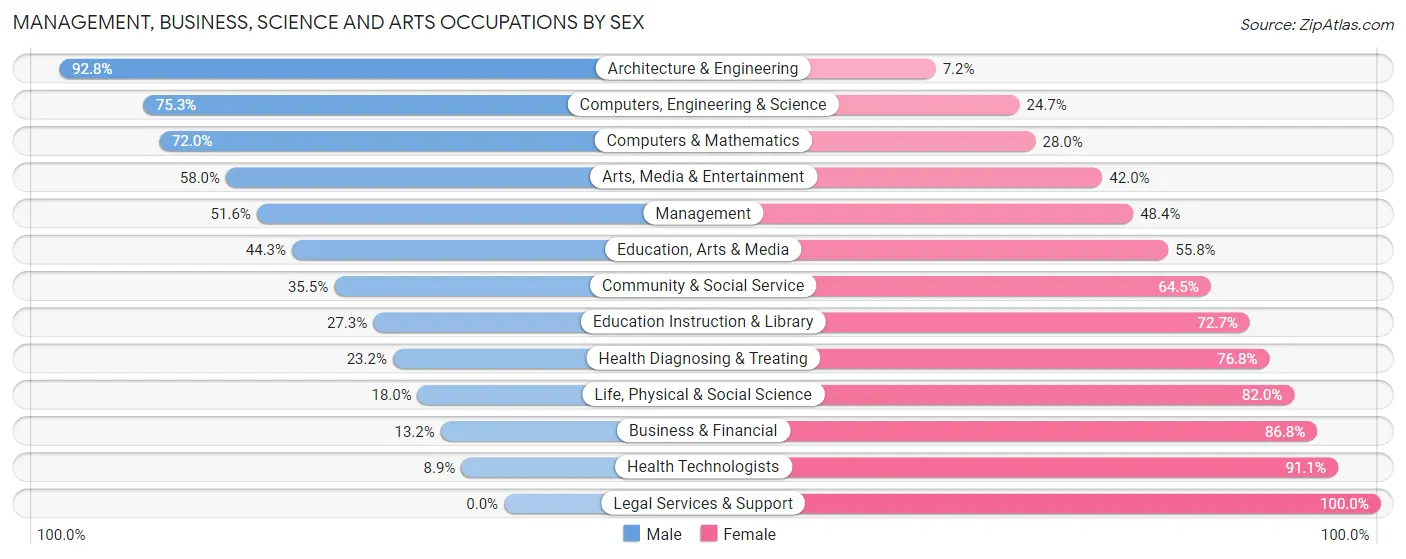
Management, Business, Science and Arts Occupations by Sex
Within the Management, Business, Science and Arts occupations in Union Park, the most male-oriented occupations are Architecture & Engineering (92.8%), Computers, Engineering & Science (75.3%), and Computers & Mathematics (72.0%), while the most female-oriented occupations are Legal Services & Support (100.0%), Health Technologists (91.1%), and Business & Financial (86.8%).
| Occupation | Male | Female |
| Management | 243 (51.6%) | 228 (48.4%) |
| Business & Financial | 18 (13.2%) | 118 (86.8%) |
| Computers, Engineering & Science | 366 (75.3%) | 120 (24.7%) |
| Computers & Mathematics | 136 (72.0%) | 53 (28.0%) |
| Architecture & Engineering | 219 (92.8%) | 17 (7.2%) |
| Life, Physical & Social Science | 11 (18.0%) | 50 (82.0%) |
| Community & Social Service | 189 (35.5%) | 344 (64.5%) |
| Education, Arts & Media | 77 (44.3%) | 97 (55.7%) |
| Legal Services & Support | 0 (0.0%) | 40 (100.0%) |
| Education Instruction & Library | 65 (27.3%) | 173 (72.7%) |
| Arts, Media & Entertainment | 47 (58.0%) | 34 (42.0%) |
| Health Diagnosing & Treating | 68 (23.2%) | 225 (76.8%) |
| Health Technologists | 14 (8.9%) | 143 (91.1%) |
| Total (Category) | 884 (46.1%) | 1,035 (53.9%) |
| Total (Overall) | 3,349 (53.2%) | 2,942 (46.8%) |
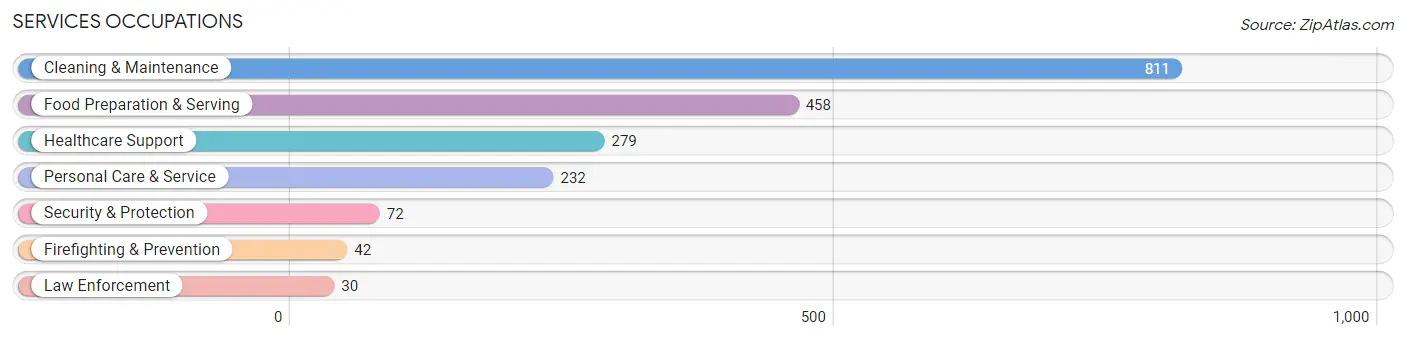
Services Occupations
The most common Services occupations in Union Park are Cleaning & Maintenance (811 | 12.9%), Food Preparation & Serving (458 | 7.3%), Healthcare Support (279 | 4.4%), Personal Care & Service (232 | 3.7%), and Security & Protection (72 | 1.1%).
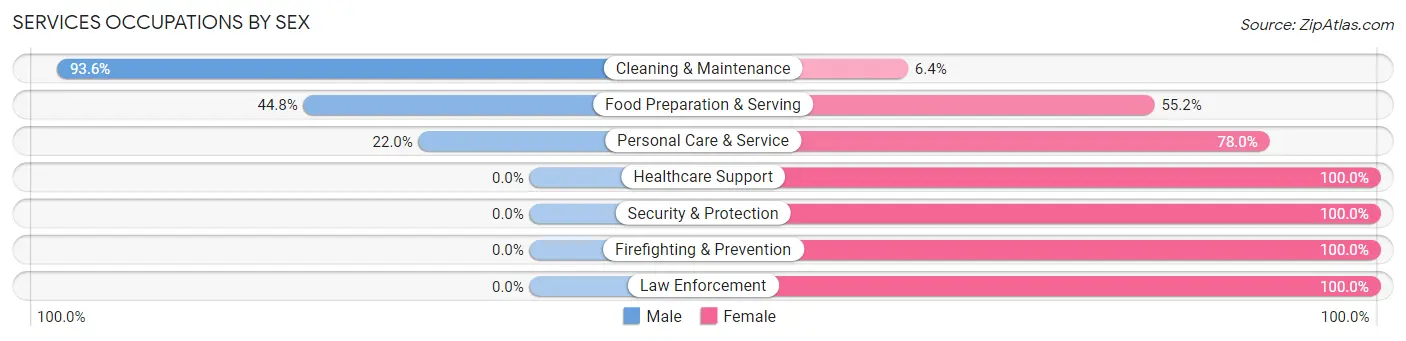
Services Occupations by Sex
Within the Services occupations in Union Park, the most male-oriented occupations are Cleaning & Maintenance (93.6%), Food Preparation & Serving (44.8%), and Personal Care & Service (22.0%), while the most female-oriented occupations are Healthcare Support (100.0%), Security & Protection (100.0%), and Firefighting & Prevention (100.0%).
| Occupation | Male | Female |
| Healthcare Support | 0 (0.0%) | 279 (100.0%) |
| Security & Protection | 0 (0.0%) | 72 (100.0%) |
| Firefighting & Prevention | 0 (0.0%) | 42 (100.0%) |
| Law Enforcement | 0 (0.0%) | 30 (100.0%) |
| Food Preparation & Serving | 205 (44.8%) | 253 (55.2%) |
| Cleaning & Maintenance | 759 (93.6%) | 52 (6.4%) |
| Personal Care & Service | 51 (22.0%) | 181 (78.0%) |
| Total (Category) | 1,015 (54.8%) | 837 (45.2%) |
| Total (Overall) | 3,349 (53.2%) | 2,942 (46.8%) |
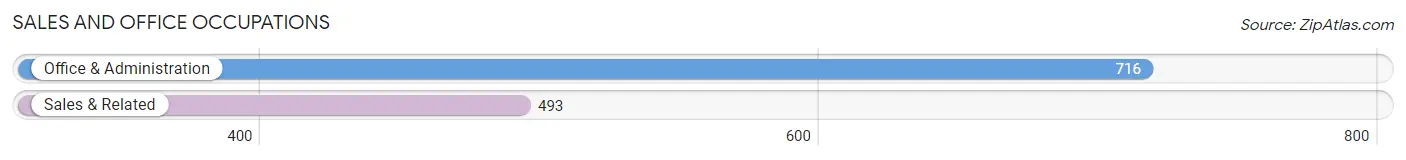
Sales and Office Occupations
The most common Sales and Office occupations in Union Park are Office & Administration (716 | 11.4%), and Sales & Related (493 | 7.8%).
Sales and Office Occupations by Sex
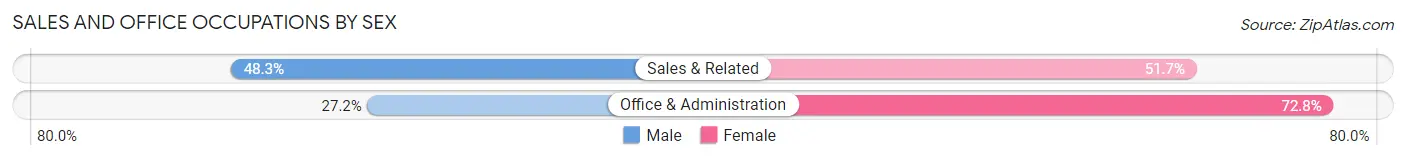
| Occupation | Male | Female |
| Sales & Related | 238 (48.3%) | 255 (51.7%) |
| Office & Administration | 195 (27.2%) | 521 (72.8%) |
| Total (Category) | 433 (35.8%) | 776 (64.2%) |
| Total (Overall) | 3,349 (53.2%) | 2,942 (46.8%) |
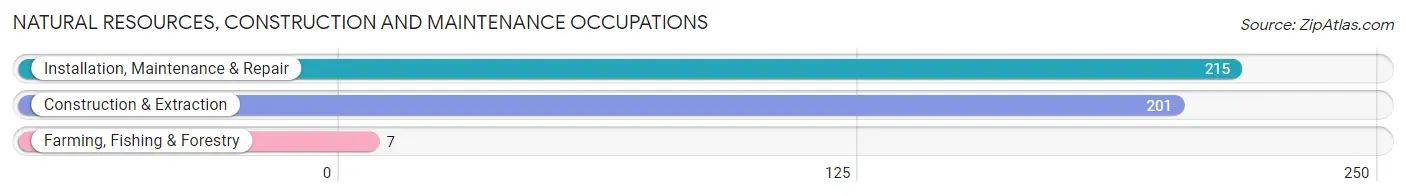
Natural Resources, Construction and Maintenance Occupations
The most common Natural Resources, Construction and Maintenance occupations in Union Park are Installation, Maintenance & Repair (215 | 3.4%), Construction & Extraction (201 | 3.2%), and Farming, Fishing & Forestry (7 | 0.1%).
Natural Resources, Construction and Maintenance Occupations by Sex
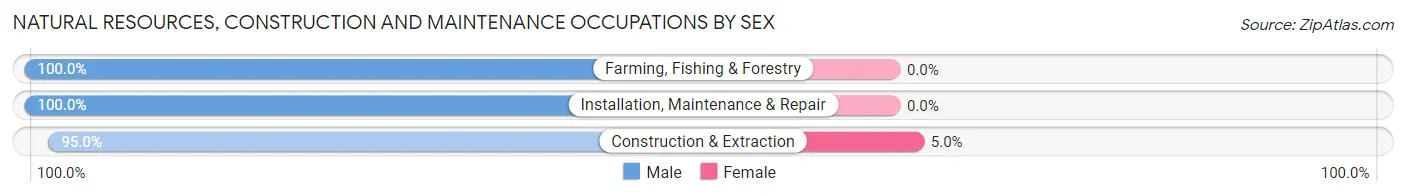
| Occupation | Male | Female |
| Farming, Fishing & Forestry | 7 (100.0%) | 0 (0.0%) |
| Construction & Extraction | 191 (95.0%) | 10 (5.0%) |
| Installation, Maintenance & Repair | 215 (100.0%) | 0 (0.0%) |
| Total (Category) | 413 (97.6%) | 10 (2.4%) |
| Total (Overall) | 3,349 (53.2%) | 2,942 (46.8%) |
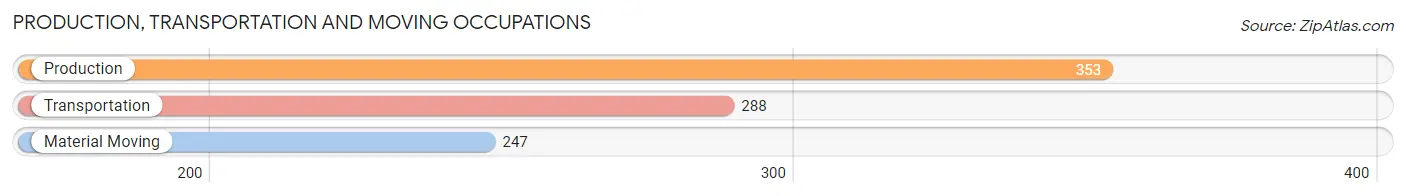
Production, Transportation and Moving Occupations
The most common Production, Transportation and Moving occupations in Union Park are Production (353 | 5.6%), Transportation (288 | 4.6%), and Material Moving (247 | 3.9%).
Production, Transportation and Moving Occupations by Sex
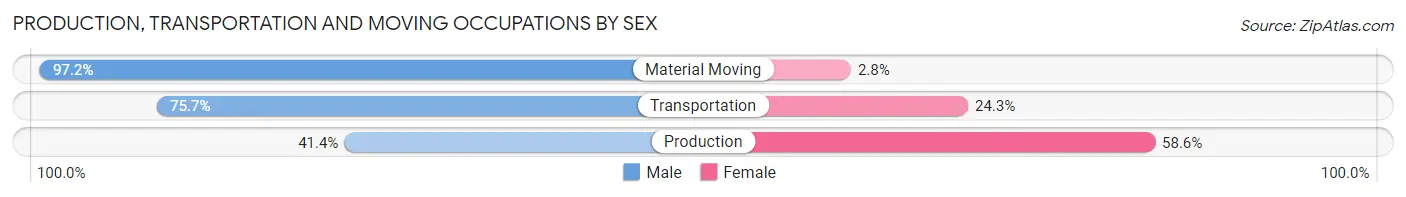
| Occupation | Male | Female |
| Production | 146 (41.4%) | 207 (58.6%) |
| Transportation | 218 (75.7%) | 70 (24.3%) |
| Material Moving | 240 (97.2%) | 7 (2.8%) |
| Total (Category) | 604 (68.0%) | 284 (32.0%) |
| Total (Overall) | 3,349 (53.2%) | 2,942 (46.8%) |
Employment Industries by Sex in Union Park
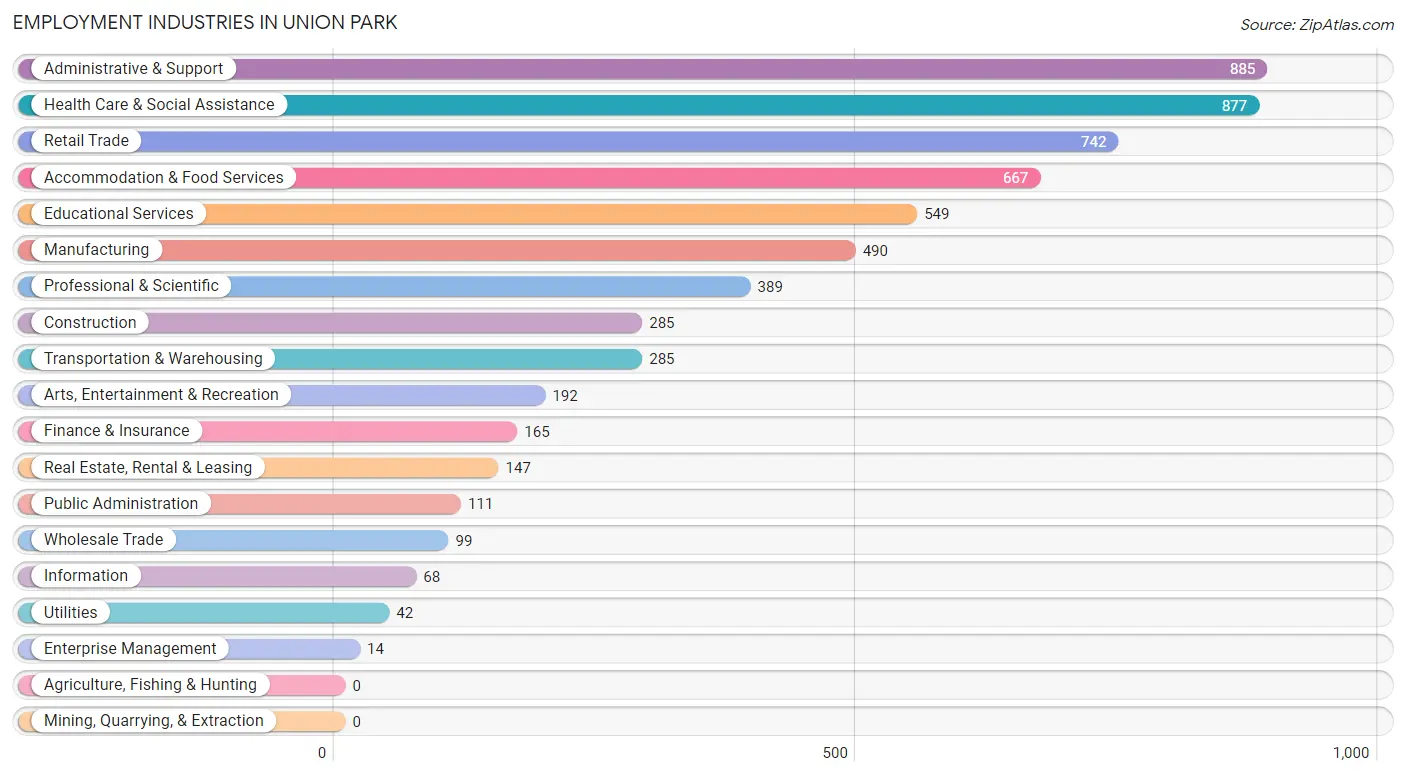
Employment Industries in Union Park
The major employment industries in Union Park include Administrative & Support (885 | 14.1%), Health Care & Social Assistance (877 | 13.9%), Retail Trade (742 | 11.8%), Accommodation & Food Services (667 | 10.6%), and Educational Services (549 | 8.7%).
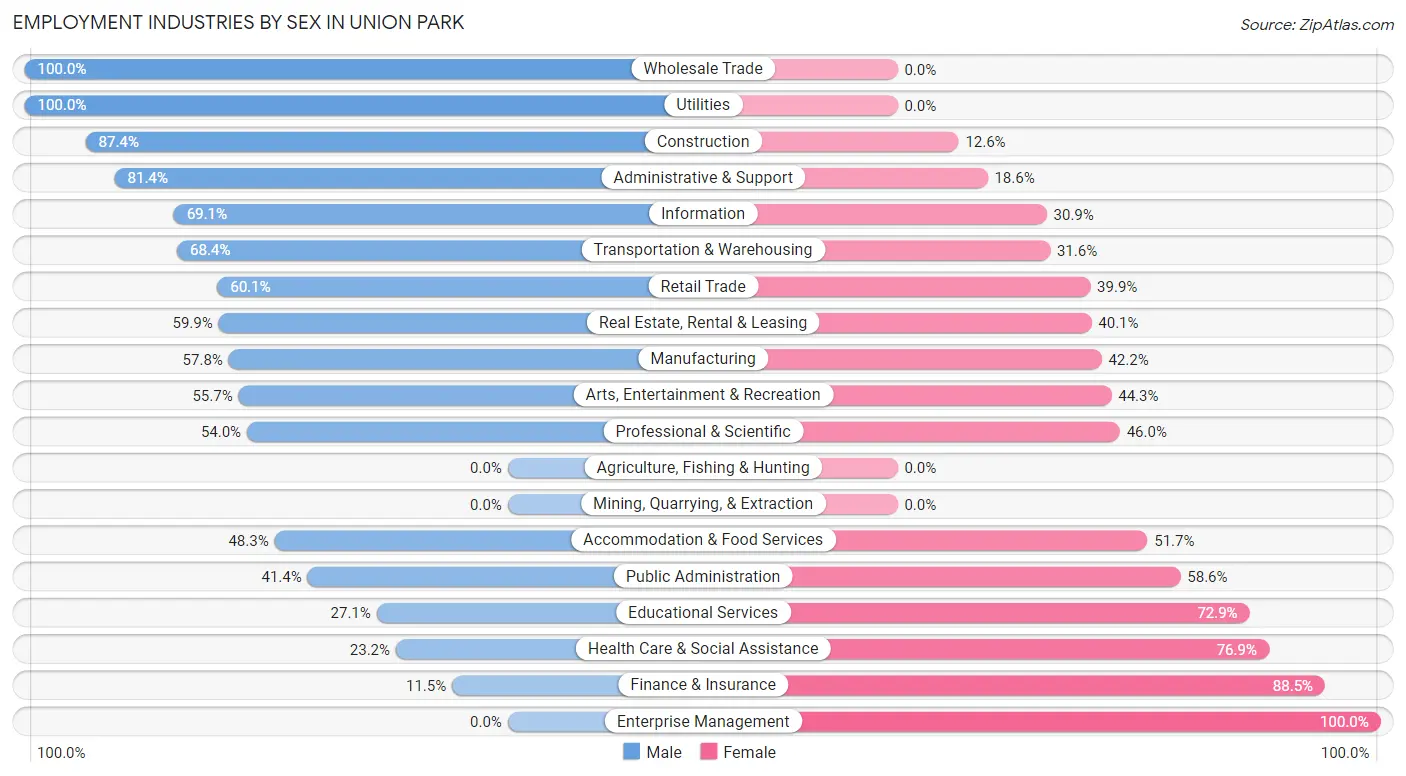
Employment Industries by Sex in Union Park
The Union Park industries that see more men than women are Wholesale Trade (100.0%), Utilities (100.0%), and Construction (87.4%), whereas the industries that tend to have a higher number of women are Enterprise Management (100.0%), Finance & Insurance (88.5%), and Health Care & Social Assistance (76.8%).
| Industry | Male | Female |
| Agriculture, Fishing & Hunting | 0 (0.0%) | 0 (0.0%) |
| Mining, Quarrying, & Extraction | 0 (0.0%) | 0 (0.0%) |
| Construction | 249 (87.4%) | 36 (12.6%) |
| Manufacturing | 283 (57.8%) | 207 (42.2%) |
| Wholesale Trade | 99 (100.0%) | 0 (0.0%) |
| Retail Trade | 446 (60.1%) | 296 (39.9%) |
| Transportation & Warehousing | 195 (68.4%) | 90 (31.6%) |
| Utilities | 42 (100.0%) | 0 (0.0%) |
| Information | 47 (69.1%) | 21 (30.9%) |
| Finance & Insurance | 19 (11.5%) | 146 (88.5%) |
| Real Estate, Rental & Leasing | 88 (59.9%) | 59 (40.1%) |
| Professional & Scientific | 210 (54.0%) | 179 (46.0%) |
| Enterprise Management | 0 (0.0%) | 14 (100.0%) |
| Administrative & Support | 720 (81.4%) | 165 (18.6%) |
| Educational Services | 149 (27.1%) | 400 (72.9%) |
| Health Care & Social Assistance | 203 (23.2%) | 674 (76.8%) |
| Arts, Entertainment & Recreation | 107 (55.7%) | 85 (44.3%) |
| Accommodation & Food Services | 322 (48.3%) | 345 (51.7%) |
| Public Administration | 46 (41.4%) | 65 (58.6%) |
| Total | 3,349 (53.2%) | 2,942 (46.8%) |
Education in Union Park
School Enrollment in Union Park
The most common levels of schooling among the 2,571 students in Union Park are college / undergraduate (948 | 36.9%), high school (539 | 21.0%), and middle school (477 | 18.5%).
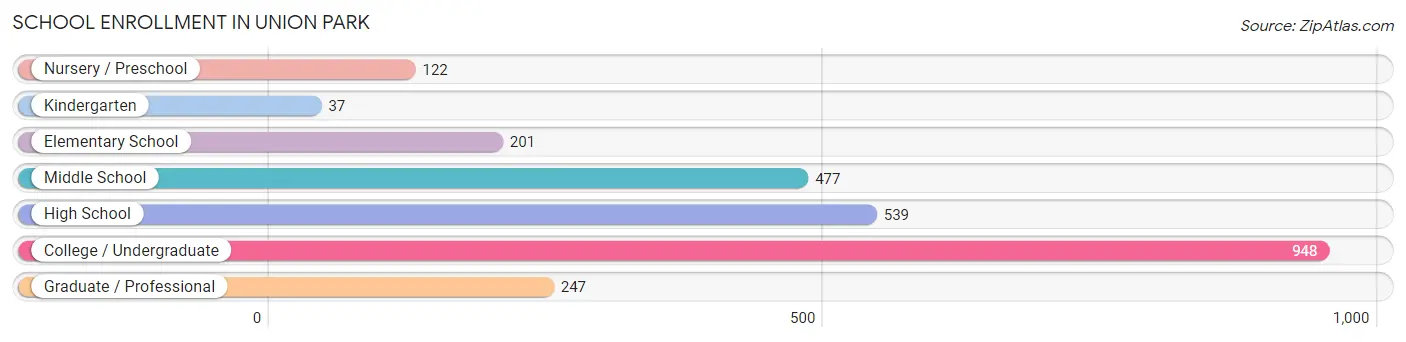
| School Level | # Students | % Students |
| Nursery / Preschool | 122 | 4.8% |
| Kindergarten | 37 | 1.4% |
| Elementary School | 201 | 7.8% |
| Middle School | 477 | 18.5% |
| High School | 539 | 21.0% |
| College / Undergraduate | 948 | 36.9% |
| Graduate / Professional | 247 | 9.6% |
| Total | 2,571 | 100.0% |
School Enrollment by Age by Funding Source in Union Park
Out of a total of 2,571 students who are enrolled in schools in Union Park, 437 (17.0%) attend a private institution, while the remaining 2,134 (83.0%) are enrolled in public schools. The age group of 35 years and over has the highest likelihood of being enrolled in private schools, with 109 (44.1% in the age bracket) enrolled. Conversely, the age group of 3 to 4 year olds has the lowest likelihood of being enrolled in a private school, with 48 (100.0% in the age bracket) attending a public institution.
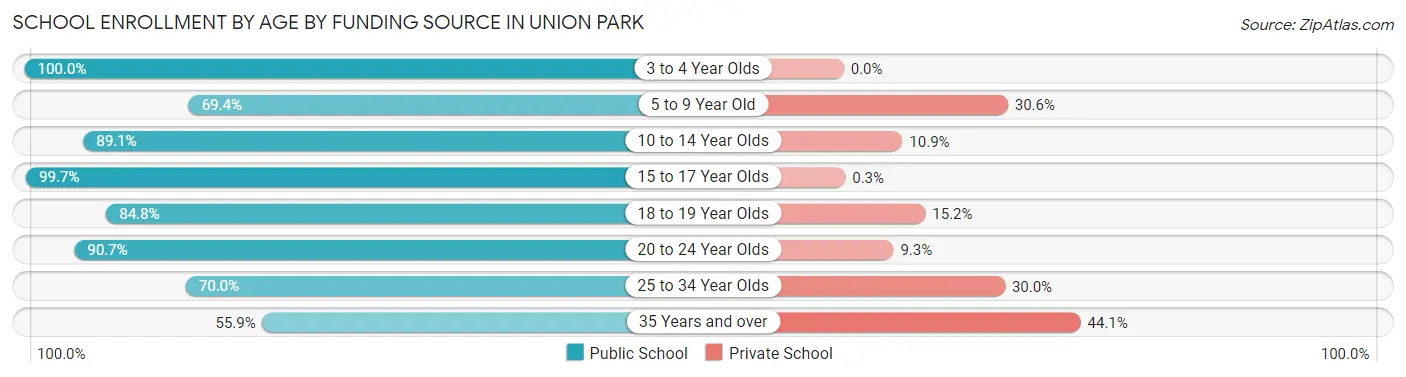
| Age Bracket | Public School | Private School |
| 3 to 4 Year Olds | 48 (100.0%) | 0 (0.0%) |
| 5 to 9 Year Old | 243 (69.4%) | 107 (30.6%) |
| 10 to 14 Year Olds | 529 (89.1%) | 65 (10.9%) |
| 15 to 17 Year Olds | 332 (99.7%) | 1 (0.3%) |
| 18 to 19 Year Olds | 156 (84.8%) | 28 (15.2%) |
| 20 to 24 Year Olds | 519 (90.7%) | 53 (9.3%) |
| 25 to 34 Year Olds | 170 (70.0%) | 73 (30.0%) |
| 35 Years and over | 138 (55.9%) | 109 (44.1%) |
| Total | 2,134 (83.0%) | 437 (17.0%) |
Educational Attainment by Field of Study in Union Park
Business (455 | 20.1%), engineering (343 | 15.1%), education (330 | 14.5%), arts & humanities (216 | 9.5%), and liberal arts & history (139 | 6.1%) are the most common fields of study among 2,269 individuals in Union Park who have obtained a bachelor's degree or higher.
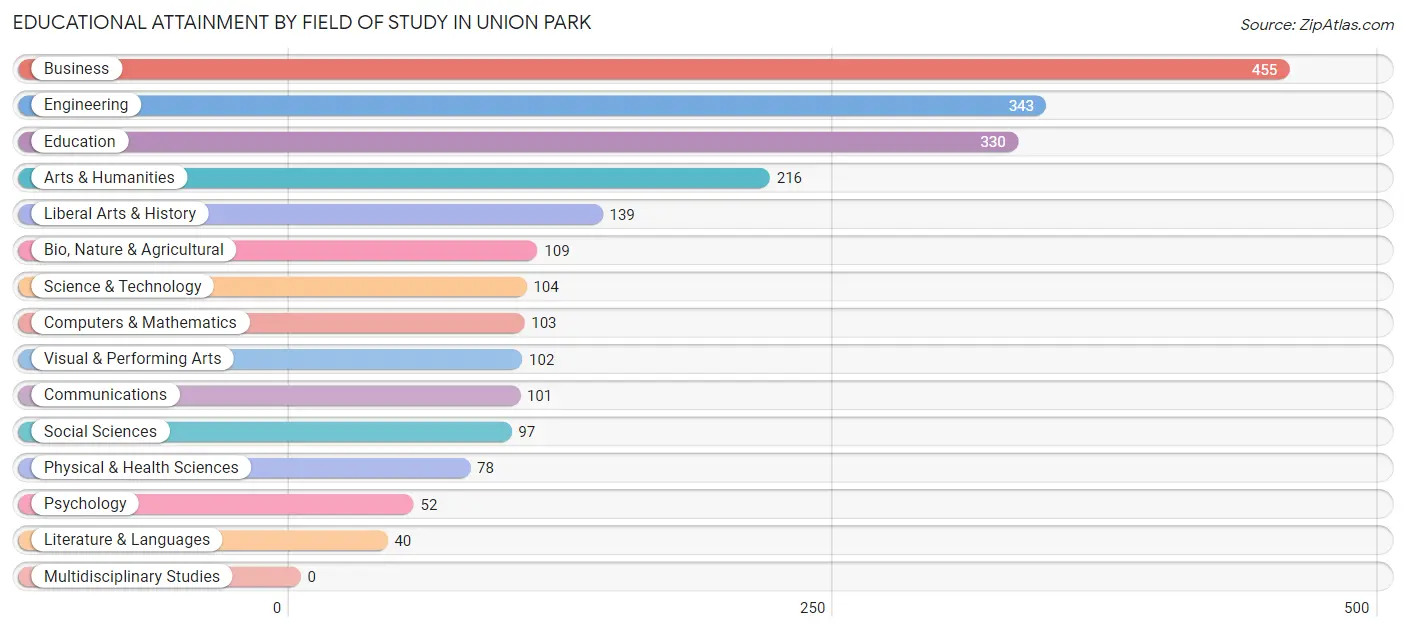
| Field of Study | # Graduates | % Graduates |
| Computers & Mathematics | 103 | 4.5% |
| Bio, Nature & Agricultural | 109 | 4.8% |
| Physical & Health Sciences | 78 | 3.4% |
| Psychology | 52 | 2.3% |
| Social Sciences | 97 | 4.3% |
| Engineering | 343 | 15.1% |
| Multidisciplinary Studies | 0 | 0.0% |
| Science & Technology | 104 | 4.6% |
| Business | 455 | 20.1% |
| Education | 330 | 14.5% |
| Literature & Languages | 40 | 1.8% |
| Liberal Arts & History | 139 | 6.1% |
| Visual & Performing Arts | 102 | 4.5% |
| Communications | 101 | 4.4% |
| Arts & Humanities | 216 | 9.5% |
| Total | 2,269 | 100.0% |
Transportation & Commute in Union Park
Vehicle Availability by Sex in Union Park
The most prevalent vehicle ownership categories in Union Park are males with 3 vehicles (1,186, accounting for 36.1%) and females with 3 vehicles (727, making up 41.0%).
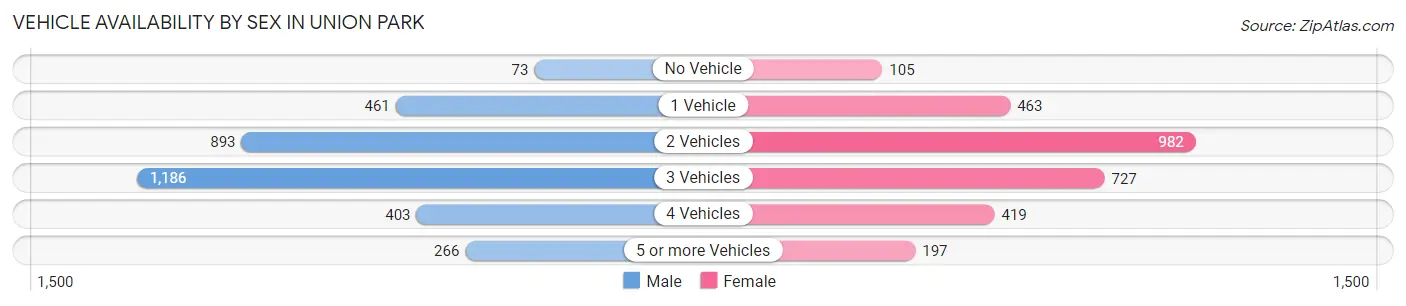
| Vehicles Available | Male | Female |
| No Vehicle | 73 (2.2%) | 105 (3.6%) |
| 1 Vehicle | 461 (14.1%) | 463 (16.0%) |
| 2 Vehicles | 893 (27.2%) | 982 (33.9%) |
| 3 Vehicles | 1,186 (36.1%) | 727 (25.1%) |
| 4 Vehicles | 403 (12.3%) | 419 (14.5%) |
| 5 or more Vehicles | 266 (8.1%) | 197 (6.8%) |
| Total | 3,282 (100.0%) | 2,893 (100.0%) |
Commute Time in Union Park
The most frequently occuring commute durations in Union Park are 30 to 34 minutes (1,475 commuters, 26.7%), 15 to 19 minutes (1,295 commuters, 23.4%), and 20 to 24 minutes (752 commuters, 13.6%).
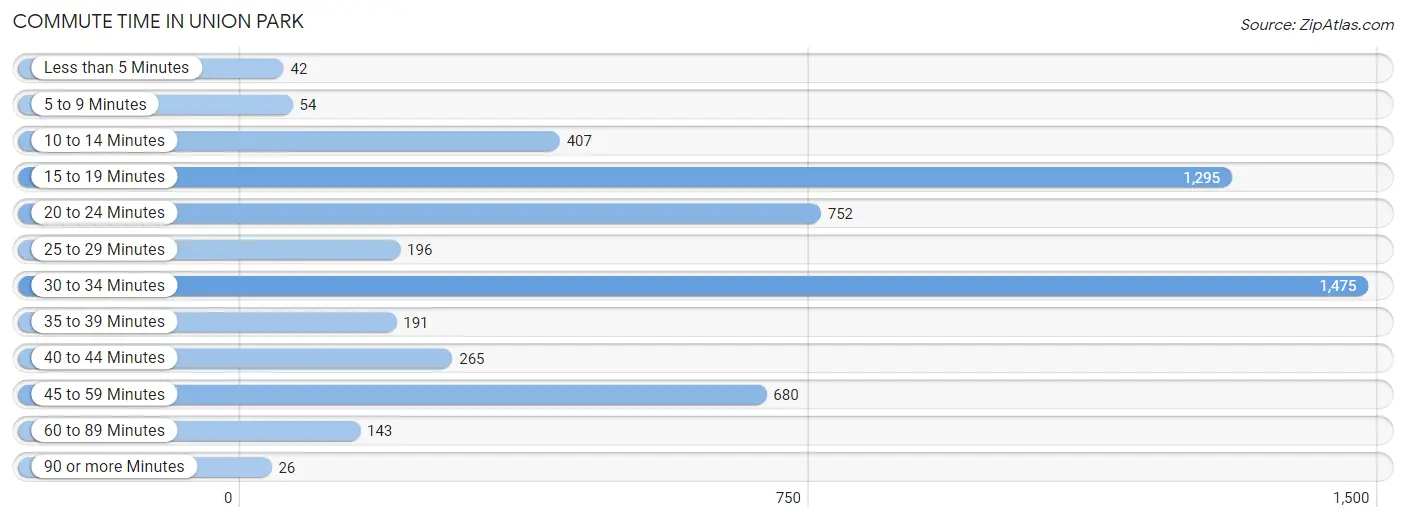
| Commute Time | # Commuters | % Commuters |
| Less than 5 Minutes | 42 | 0.8% |
| 5 to 9 Minutes | 54 | 1.0% |
| 10 to 14 Minutes | 407 | 7.4% |
| 15 to 19 Minutes | 1,295 | 23.4% |
| 20 to 24 Minutes | 752 | 13.6% |
| 25 to 29 Minutes | 196 | 3.5% |
| 30 to 34 Minutes | 1,475 | 26.7% |
| 35 to 39 Minutes | 191 | 3.5% |
| 40 to 44 Minutes | 265 | 4.8% |
| 45 to 59 Minutes | 680 | 12.3% |
| 60 to 89 Minutes | 143 | 2.6% |
| 90 or more Minutes | 26 | 0.5% |
Commute Time by Sex in Union Park
The most common commute times in Union Park are 30 to 34 minutes (996 commuters, 33.1%) for males and 15 to 19 minutes (650 commuters, 25.9%) for females.
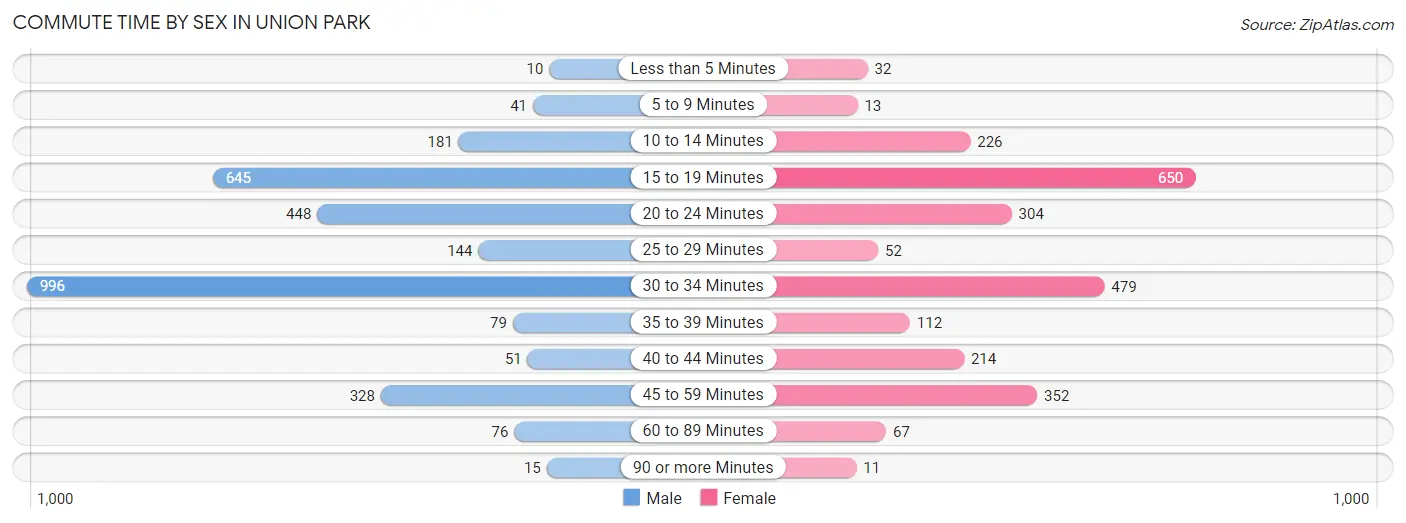
| Commute Time | Male | Female |
| Less than 5 Minutes | 10 (0.3%) | 32 (1.3%) |
| 5 to 9 Minutes | 41 (1.4%) | 13 (0.5%) |
| 10 to 14 Minutes | 181 (6.0%) | 226 (9.0%) |
| 15 to 19 Minutes | 645 (21.4%) | 650 (25.9%) |
| 20 to 24 Minutes | 448 (14.9%) | 304 (12.1%) |
| 25 to 29 Minutes | 144 (4.8%) | 52 (2.1%) |
| 30 to 34 Minutes | 996 (33.1%) | 479 (19.1%) |
| 35 to 39 Minutes | 79 (2.6%) | 112 (4.5%) |
| 40 to 44 Minutes | 51 (1.7%) | 214 (8.5%) |
| 45 to 59 Minutes | 328 (10.9%) | 352 (14.0%) |
| 60 to 89 Minutes | 76 (2.5%) | 67 (2.7%) |
| 90 or more Minutes | 15 (0.5%) | 11 (0.4%) |
Time of Departure to Work by Sex in Union Park
The most frequent times of departure to work in Union Park are 6:00 AM to 6:29 AM (884, 29.3%) for males and 8:00 AM to 8:29 AM (374, 14.9%) for females.
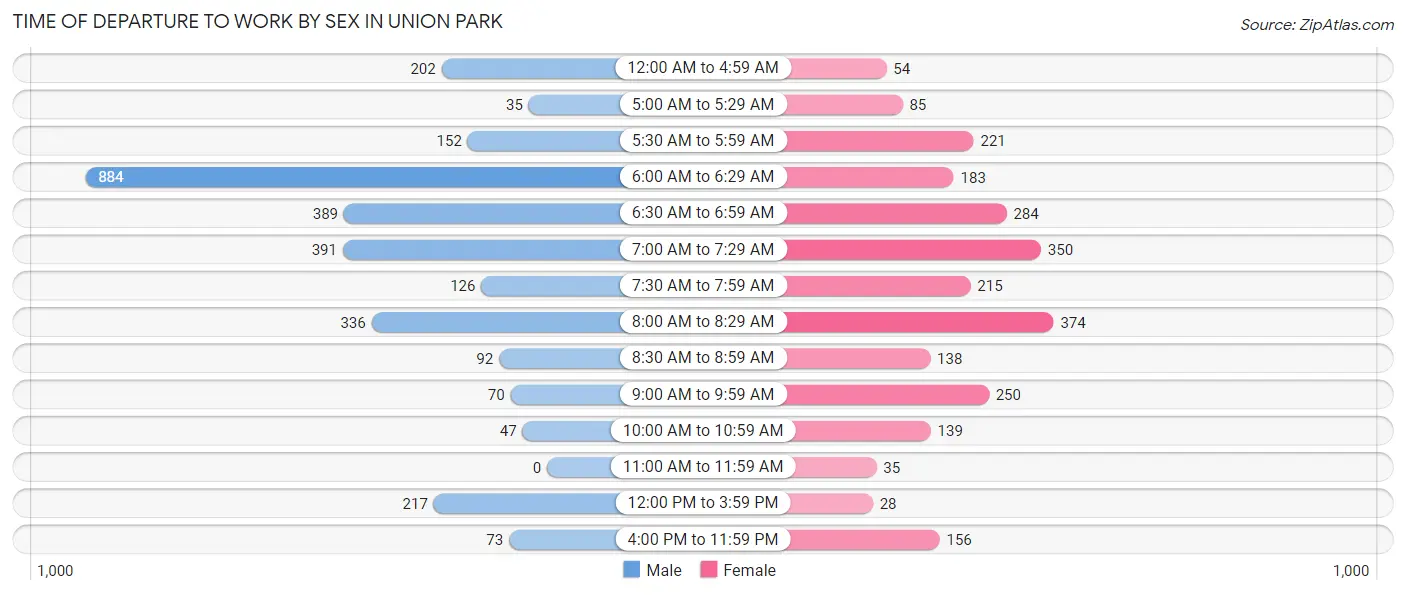
| Time of Departure | Male | Female |
| 12:00 AM to 4:59 AM | 202 (6.7%) | 54 (2.1%) |
| 5:00 AM to 5:29 AM | 35 (1.2%) | 85 (3.4%) |
| 5:30 AM to 5:59 AM | 152 (5.0%) | 221 (8.8%) |
| 6:00 AM to 6:29 AM | 884 (29.3%) | 183 (7.3%) |
| 6:30 AM to 6:59 AM | 389 (12.9%) | 284 (11.3%) |
| 7:00 AM to 7:29 AM | 391 (13.0%) | 350 (13.9%) |
| 7:30 AM to 7:59 AM | 126 (4.2%) | 215 (8.6%) |
| 8:00 AM to 8:29 AM | 336 (11.2%) | 374 (14.9%) |
| 8:30 AM to 8:59 AM | 92 (3.0%) | 138 (5.5%) |
| 9:00 AM to 9:59 AM | 70 (2.3%) | 250 (10.0%) |
| 10:00 AM to 10:59 AM | 47 (1.6%) | 139 (5.5%) |
| 11:00 AM to 11:59 AM | 0 (0.0%) | 35 (1.4%) |
| 12:00 PM to 3:59 PM | 217 (7.2%) | 28 (1.1%) |
| 4:00 PM to 11:59 PM | 73 (2.4%) | 156 (6.2%) |
| Total | 3,014 (100.0%) | 2,512 (100.0%) |
Housing Occupancy in Union Park
Occupancy by Ownership in Union Park
Of the total 3,433 dwellings in Union Park, owner-occupied units account for 2,088 (60.8%), while renter-occupied units make up 1,345 (39.2%).
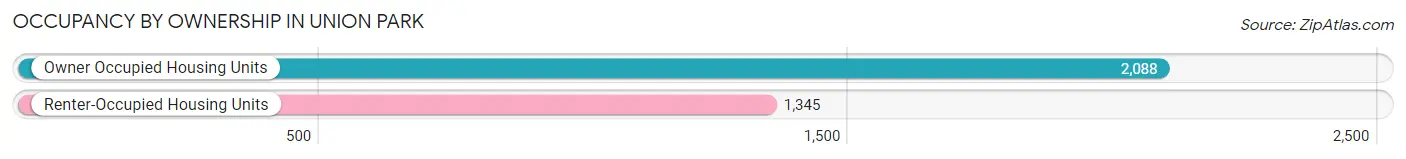
| Occupancy | # Housing Units | % Housing Units |
| Owner Occupied Housing Units | 2,088 | 60.8% |
| Renter-Occupied Housing Units | 1,345 | 39.2% |
| Total Occupied Housing Units | 3,433 | 100.0% |
Occupancy by Household Size in Union Park
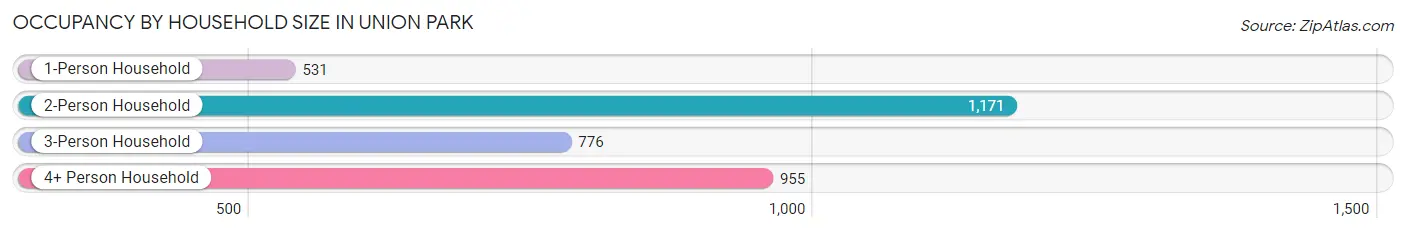
| Household Size | # Housing Units | % Housing Units |
| 1-Person Household | 531 | 15.5% |
| 2-Person Household | 1,171 | 34.1% |
| 3-Person Household | 776 | 22.6% |
| 4+ Person Household | 955 | 27.8% |
| Total Housing Units | 3,433 | 100.0% |
Occupancy by Ownership by Household Size in Union Park
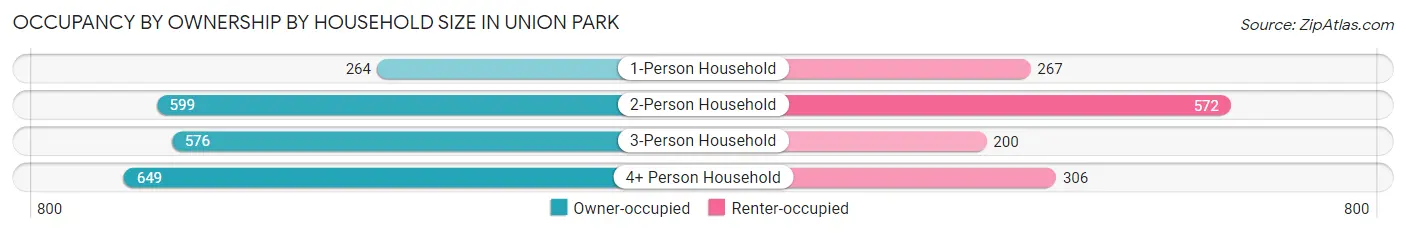
| Household Size | Owner-occupied | Renter-occupied |
| 1-Person Household | 264 (49.7%) | 267 (50.3%) |
| 2-Person Household | 599 (51.1%) | 572 (48.8%) |
| 3-Person Household | 576 (74.2%) | 200 (25.8%) |
| 4+ Person Household | 649 (68.0%) | 306 (32.0%) |
| Total Housing Units | 2,088 (60.8%) | 1,345 (39.2%) |
Occupancy by Educational Attainment in Union Park
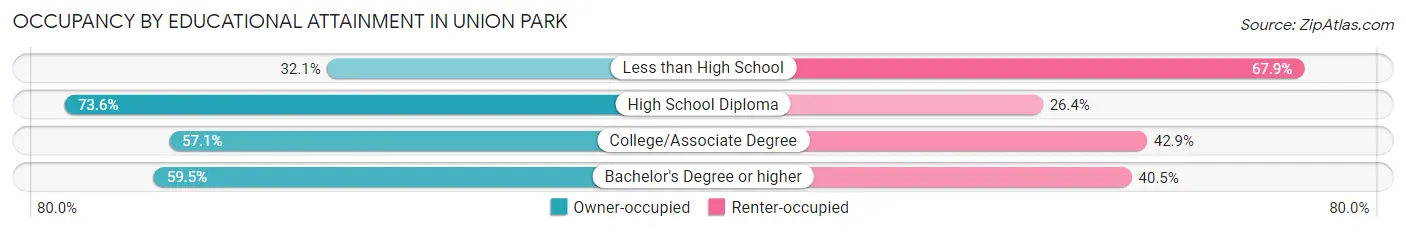
| Household Size | Owner-occupied | Renter-occupied |
| Less than High School | 62 (32.1%) | 131 (67.9%) |
| High School Diploma | 680 (73.6%) | 244 (26.4%) |
| College/Associate Degree | 751 (57.1%) | 565 (42.9%) |
| Bachelor's Degree or higher | 595 (59.5%) | 405 (40.5%) |
Occupancy by Age of Householder in Union Park
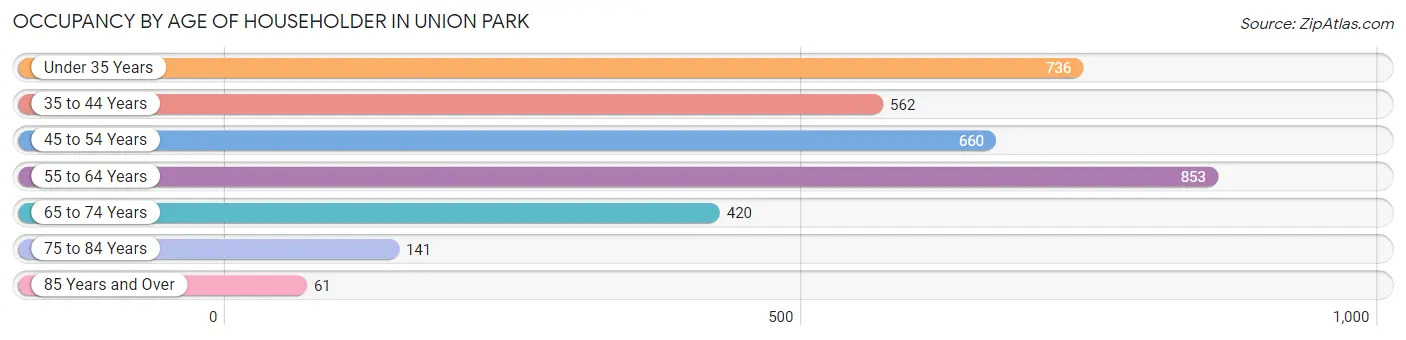
| Age Bracket | # Households | % Households |
| Under 35 Years | 736 | 21.4% |
| 35 to 44 Years | 562 | 16.4% |
| 45 to 54 Years | 660 | 19.2% |
| 55 to 64 Years | 853 | 24.8% |
| 65 to 74 Years | 420 | 12.2% |
| 75 to 84 Years | 141 | 4.1% |
| 85 Years and Over | 61 | 1.8% |
| Total | 3,433 | 100.0% |
Housing Finances in Union Park
Median Income by Occupancy in Union Park
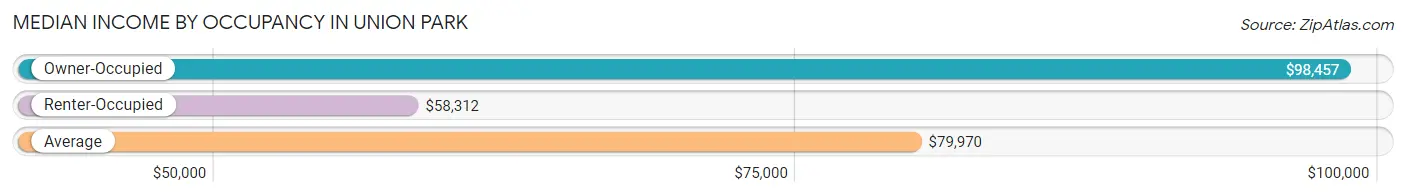
| Occupancy Type | # Households | Median Income |
| Owner-Occupied | 2,088 (60.8%) | $98,457 |
| Renter-Occupied | 1,345 (39.2%) | $58,312 |
| Average | 3,433 (100.0%) | $79,970 |
Occupancy by Householder Income Bracket in Union Park
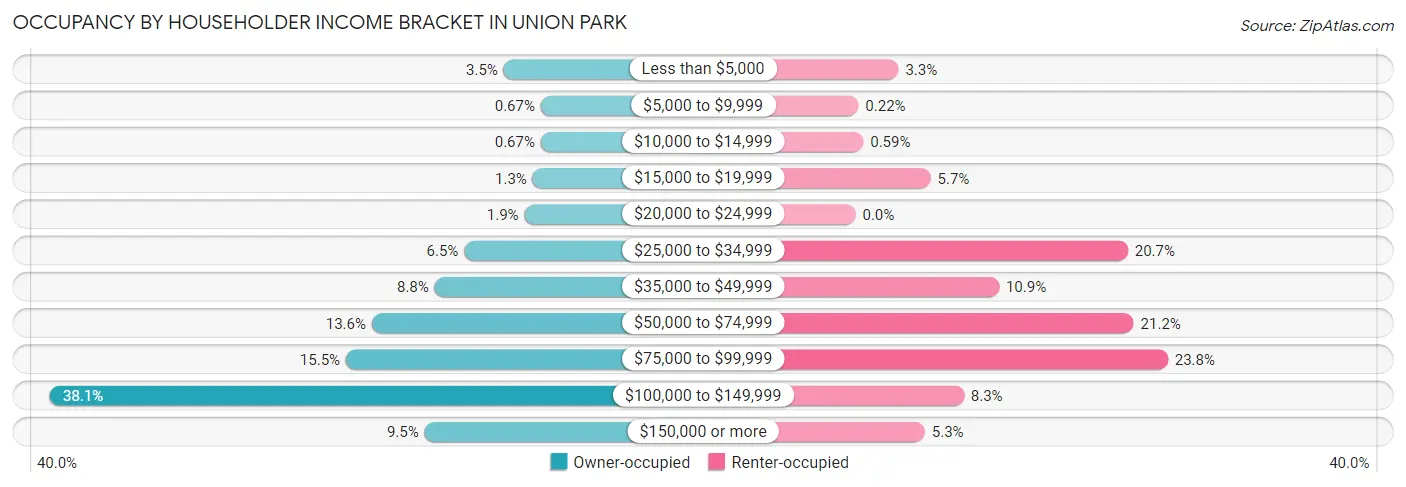
| Income Bracket | Owner-occupied | Renter-occupied |
| Less than $5,000 | 73 (3.5%) | 44 (3.3%) |
| $5,000 to $9,999 | 14 (0.7%) | 3 (0.2%) |
| $10,000 to $14,999 | 14 (0.7%) | 8 (0.6%) |
| $15,000 to $19,999 | 27 (1.3%) | 77 (5.7%) |
| $20,000 to $24,999 | 40 (1.9%) | 0 (0.0%) |
| $25,000 to $34,999 | 136 (6.5%) | 279 (20.7%) |
| $35,000 to $49,999 | 183 (8.8%) | 147 (10.9%) |
| $50,000 to $74,999 | 283 (13.6%) | 285 (21.2%) |
| $75,000 to $99,999 | 324 (15.5%) | 320 (23.8%) |
| $100,000 to $149,999 | 795 (38.1%) | 111 (8.3%) |
| $150,000 or more | 199 (9.5%) | 71 (5.3%) |
| Total | 2,088 (100.0%) | 1,345 (100.0%) |
Monthly Housing Cost Tiers in Union Park
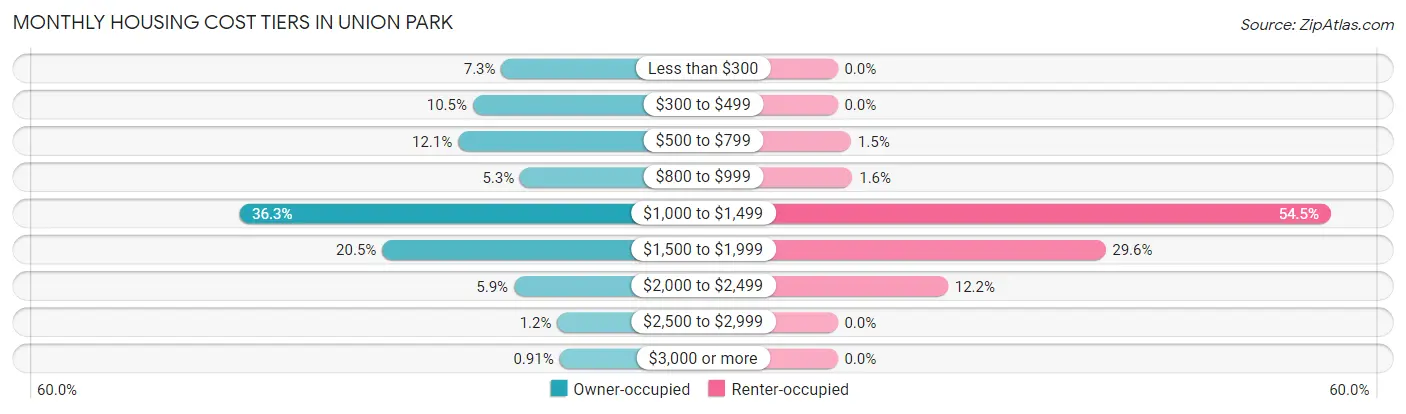
| Monthly Cost | Owner-occupied | Renter-occupied |
| Less than $300 | 153 (7.3%) | 0 (0.0%) |
| $300 to $499 | 219 (10.5%) | 0 (0.0%) |
| $500 to $799 | 253 (12.1%) | 20 (1.5%) |
| $800 to $999 | 110 (5.3%) | 22 (1.6%) |
| $1,000 to $1,499 | 758 (36.3%) | 733 (54.5%) |
| $1,500 to $1,999 | 428 (20.5%) | 398 (29.6%) |
| $2,000 to $2,499 | 124 (5.9%) | 164 (12.2%) |
| $2,500 to $2,999 | 24 (1.1%) | 0 (0.0%) |
| $3,000 or more | 19 (0.9%) | 0 (0.0%) |
| Total | 2,088 (100.0%) | 1,345 (100.0%) |
Physical Housing Characteristics in Union Park
Housing Structures in Union Park
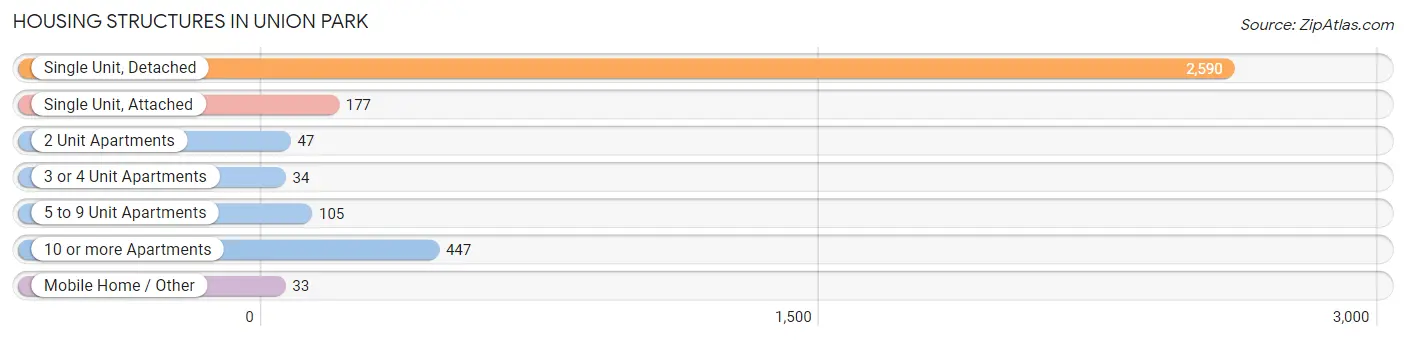
| Structure Type | # Housing Units | % Housing Units |
| Single Unit, Detached | 2,590 | 75.4% |
| Single Unit, Attached | 177 | 5.2% |
| 2 Unit Apartments | 47 | 1.4% |
| 3 or 4 Unit Apartments | 34 | 1.0% |
| 5 to 9 Unit Apartments | 105 | 3.1% |
| 10 or more Apartments | 447 | 13.0% |
| Mobile Home / Other | 33 | 1.0% |
| Total | 3,433 | 100.0% |
Housing Structures by Occupancy in Union Park
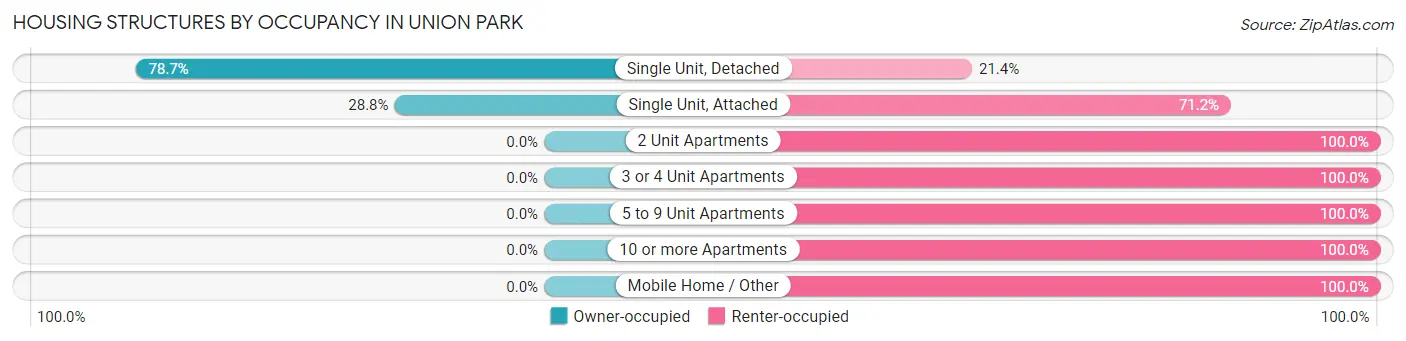
| Structure Type | Owner-occupied | Renter-occupied |
| Single Unit, Detached | 2,037 (78.6%) | 553 (21.3%) |
| Single Unit, Attached | 51 (28.8%) | 126 (71.2%) |
| 2 Unit Apartments | 0 (0.0%) | 47 (100.0%) |
| 3 or 4 Unit Apartments | 0 (0.0%) | 34 (100.0%) |
| 5 to 9 Unit Apartments | 0 (0.0%) | 105 (100.0%) |
| 10 or more Apartments | 0 (0.0%) | 447 (100.0%) |
| Mobile Home / Other | 0 (0.0%) | 33 (100.0%) |
| Total | 2,088 (60.8%) | 1,345 (39.2%) |
Housing Structures by Number of Rooms in Union Park
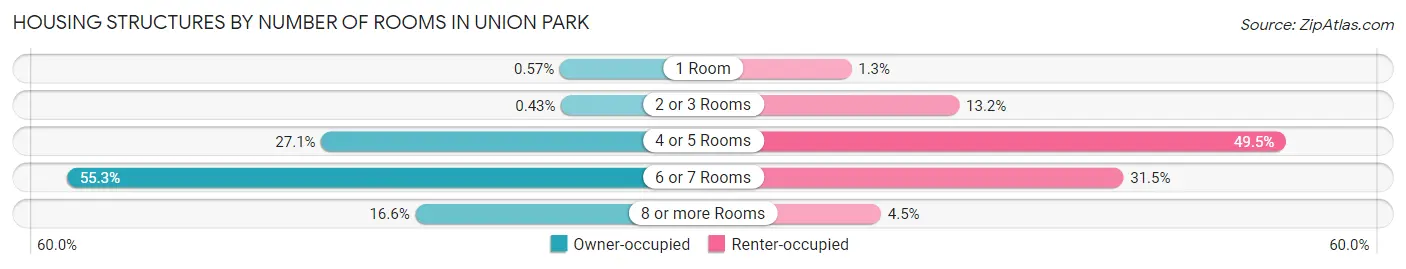
| Number of Rooms | Owner-occupied | Renter-occupied |
| 1 Room | 12 (0.6%) | 17 (1.3%) |
| 2 or 3 Rooms | 9 (0.4%) | 178 (13.2%) |
| 4 or 5 Rooms | 565 (27.1%) | 666 (49.5%) |
| 6 or 7 Rooms | 1,155 (55.3%) | 423 (31.5%) |
| 8 or more Rooms | 347 (16.6%) | 61 (4.5%) |
| Total | 2,088 (100.0%) | 1,345 (100.0%) |
Housing Structure by Heating Type in Union Park
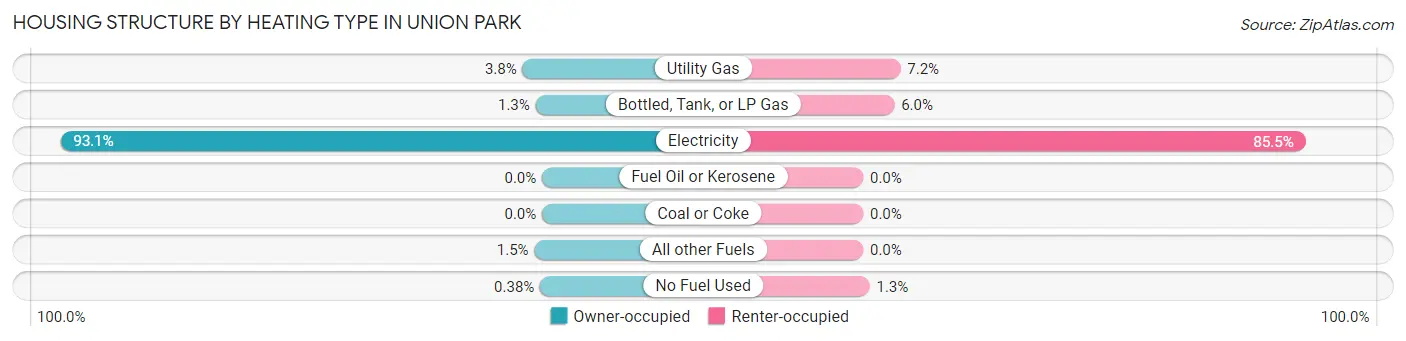
| Heating Type | Owner-occupied | Renter-occupied |
| Utility Gas | 79 (3.8%) | 97 (7.2%) |
| Bottled, Tank, or LP Gas | 26 (1.3%) | 81 (6.0%) |
| Electricity | 1,944 (93.1%) | 1,150 (85.5%) |
| Fuel Oil or Kerosene | 0 (0.0%) | 0 (0.0%) |
| Coal or Coke | 0 (0.0%) | 0 (0.0%) |
| All other Fuels | 31 (1.5%) | 0 (0.0%) |
| No Fuel Used | 8 (0.4%) | 17 (1.3%) |
| Total | 2,088 (100.0%) | 1,345 (100.0%) |
Household Vehicle Usage in Union Park
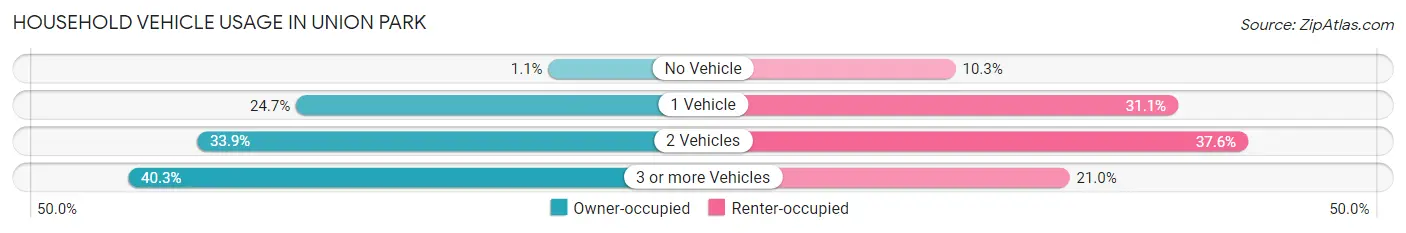
| Vehicles per Household | Owner-occupied | Renter-occupied |
| No Vehicle | 23 (1.1%) | 139 (10.3%) |
| 1 Vehicle | 515 (24.7%) | 418 (31.1%) |
| 2 Vehicles | 708 (33.9%) | 506 (37.6%) |
| 3 or more Vehicles | 842 (40.3%) | 282 (21.0%) |
| Total | 2,088 (100.0%) | 1,345 (100.0%) |
Real Estate & Mortgages in Union Park
Real Estate and Mortgage Overview in Union Park
| Characteristic | Without Mortgage | With Mortgage |
| Housing Units | 598 | 1,490 |
| Median Property Value | $251,800 | $246,600 |
| Median Household Income | $55,761 | $109 |
| Monthly Housing Costs | $445 | $19 |
| Real Estate Taxes | $1,617 | $77 |
Property Value by Mortgage Status in Union Park
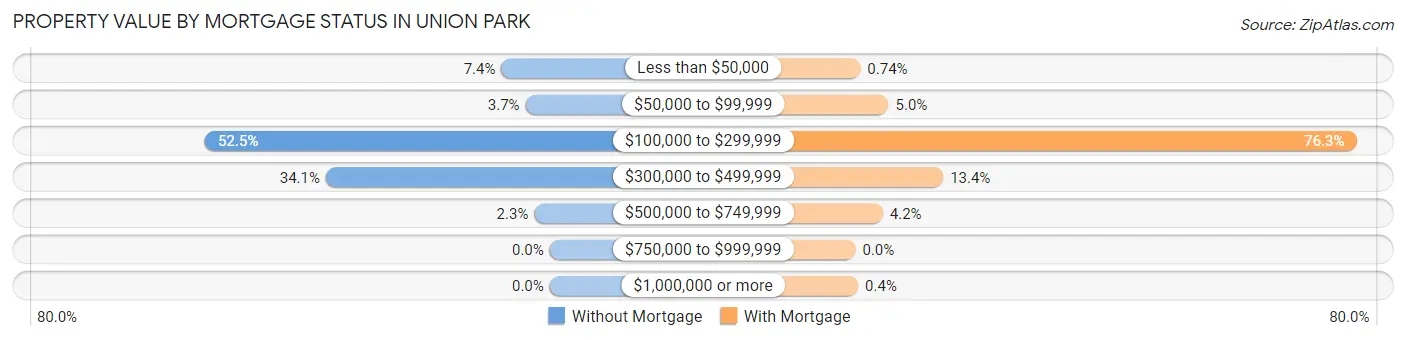
| Property Value | Without Mortgage | With Mortgage |
| Less than $50,000 | 44 (7.4%) | 11 (0.7%) |
| $50,000 to $99,999 | 22 (3.7%) | 75 (5.0%) |
| $100,000 to $299,999 | 314 (52.5%) | 1,137 (76.3%) |
| $300,000 to $499,999 | 204 (34.1%) | 199 (13.4%) |
| $500,000 to $749,999 | 14 (2.3%) | 62 (4.2%) |
| $750,000 to $999,999 | 0 (0.0%) | 0 (0.0%) |
| $1,000,000 or more | 0 (0.0%) | 6 (0.4%) |
| Total | 598 (100.0%) | 1,490 (100.0%) |
Household Income by Mortgage Status in Union Park
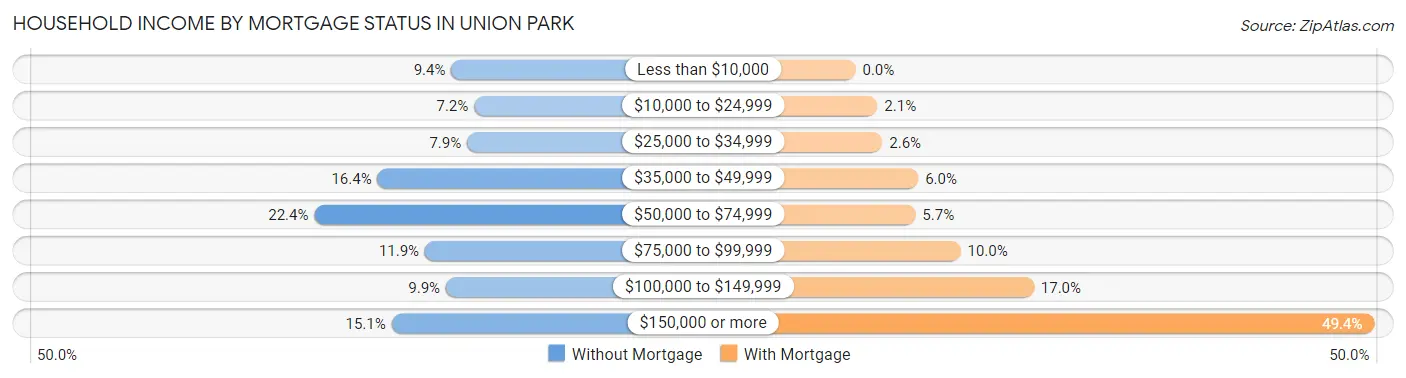
| Household Income | Without Mortgage | With Mortgage |
| Less than $10,000 | 56 (9.4%) | 0 (0.0%) |
| $10,000 to $24,999 | 43 (7.2%) | 31 (2.1%) |
| $25,000 to $34,999 | 47 (7.9%) | 38 (2.5%) |
| $35,000 to $49,999 | 98 (16.4%) | 89 (6.0%) |
| $50,000 to $74,999 | 134 (22.4%) | 85 (5.7%) |
| $75,000 to $99,999 | 71 (11.9%) | 149 (10.0%) |
| $100,000 to $149,999 | 59 (9.9%) | 253 (17.0%) |
| $150,000 or more | 90 (15.0%) | 736 (49.4%) |
| Total | 598 (100.0%) | 1,490 (100.0%) |
Property Value to Household Income Ratio in Union Park
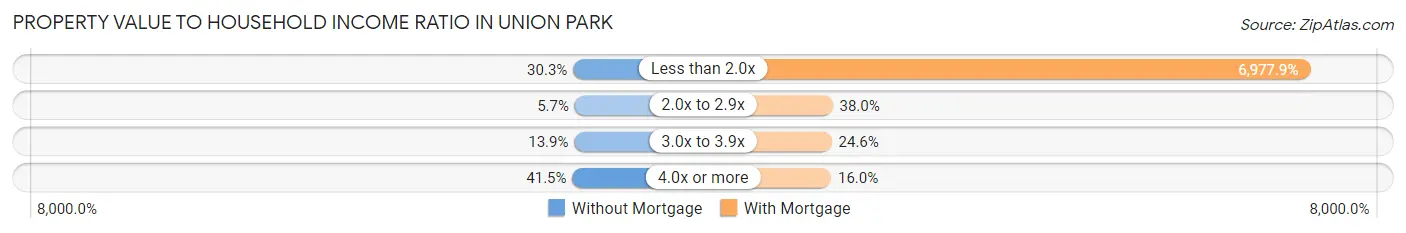
| Value-to-Income Ratio | Without Mortgage | With Mortgage |
| Less than 2.0x | 181 (30.3%) | 103,971 (6,977.9%) |
| 2.0x to 2.9x | 34 (5.7%) | 566 (38.0%) |
| 3.0x to 3.9x | 83 (13.9%) | 366 (24.6%) |
| 4.0x or more | 248 (41.5%) | 238 (16.0%) |
| Total | 598 (100.0%) | 1,490 (100.0%) |
Real Estate Taxes by Mortgage Status in Union Park
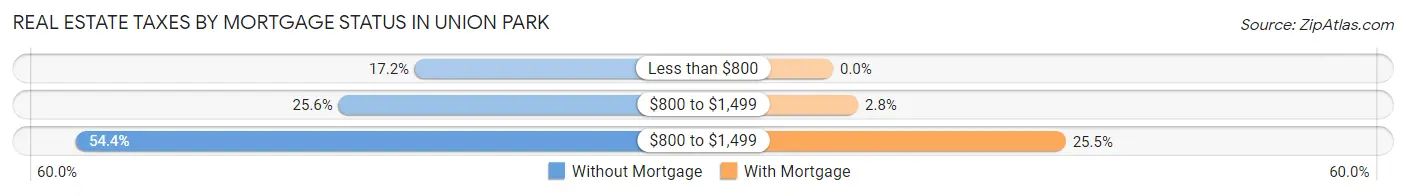
| Property Taxes | Without Mortgage | With Mortgage |
| Less than $800 | 103 (17.2%) | 0 (0.0%) |
| $800 to $1,499 | 153 (25.6%) | 41 (2.8%) |
| $800 to $1,499 | 325 (54.3%) | 380 (25.5%) |
| Total | 598 (100.0%) | 1,490 (100.0%) |
Health & Disability in Union Park
Health Insurance Coverage by Age in Union Park
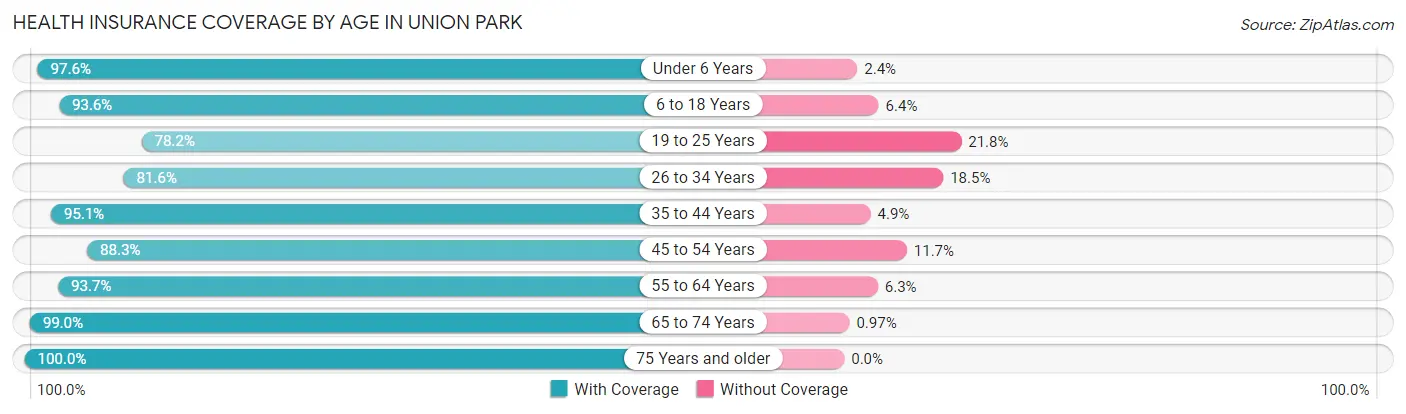
| Age Bracket | With Coverage | Without Coverage |
| Under 6 Years | 600 (97.6%) | 15 (2.4%) |
| 6 to 18 Years | 1,300 (93.6%) | 89 (6.4%) |
| 19 to 25 Years | 1,064 (78.2%) | 297 (21.8%) |
| 26 to 34 Years | 1,428 (81.6%) | 323 (18.4%) |
| 35 to 44 Years | 1,221 (95.1%) | 63 (4.9%) |
| 45 to 54 Years | 1,317 (88.3%) | 174 (11.7%) |
| 55 to 64 Years | 1,423 (93.7%) | 95 (6.3%) |
| 65 to 74 Years | 919 (99.0%) | 9 (1.0%) |
| 75 Years and older | 475 (100.0%) | 0 (0.0%) |
| Total | 9,747 (90.1%) | 1,065 (9.9%) |
Health Insurance Coverage by Citizenship Status in Union Park
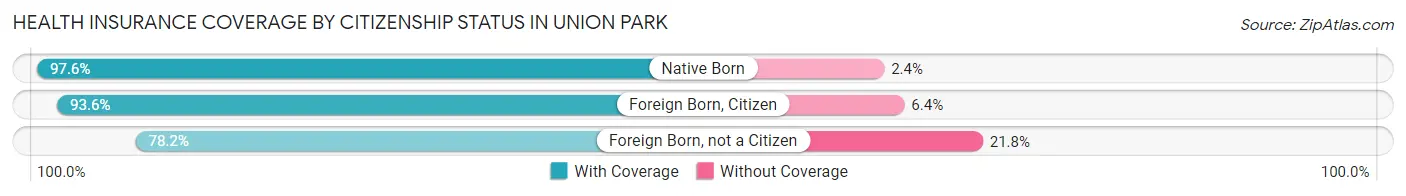
| Citizenship Status | With Coverage | Without Coverage |
| Native Born | 600 (97.6%) | 15 (2.4%) |
| Foreign Born, Citizen | 1,300 (93.6%) | 89 (6.4%) |
| Foreign Born, not a Citizen | 1,064 (78.2%) | 297 (21.8%) |
Health Insurance Coverage by Household Income in Union Park
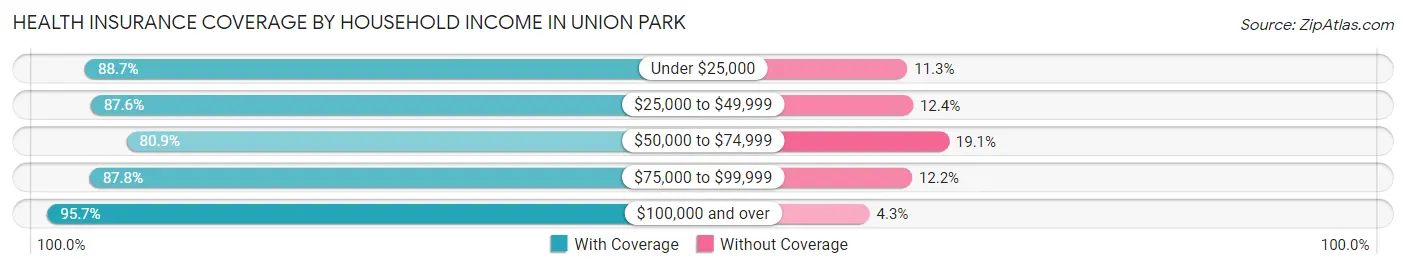
| Household Income | With Coverage | Without Coverage |
| Under $25,000 | 641 (88.7%) | 82 (11.3%) |
| $25,000 to $49,999 | 1,554 (87.6%) | 220 (12.4%) |
| $50,000 to $74,999 | 1,307 (80.9%) | 309 (19.1%) |
| $75,000 to $99,999 | 1,848 (87.8%) | 257 (12.2%) |
| $100,000 and over | 4,390 (95.7%) | 196 (4.3%) |
Public vs Private Health Insurance Coverage by Age in Union Park
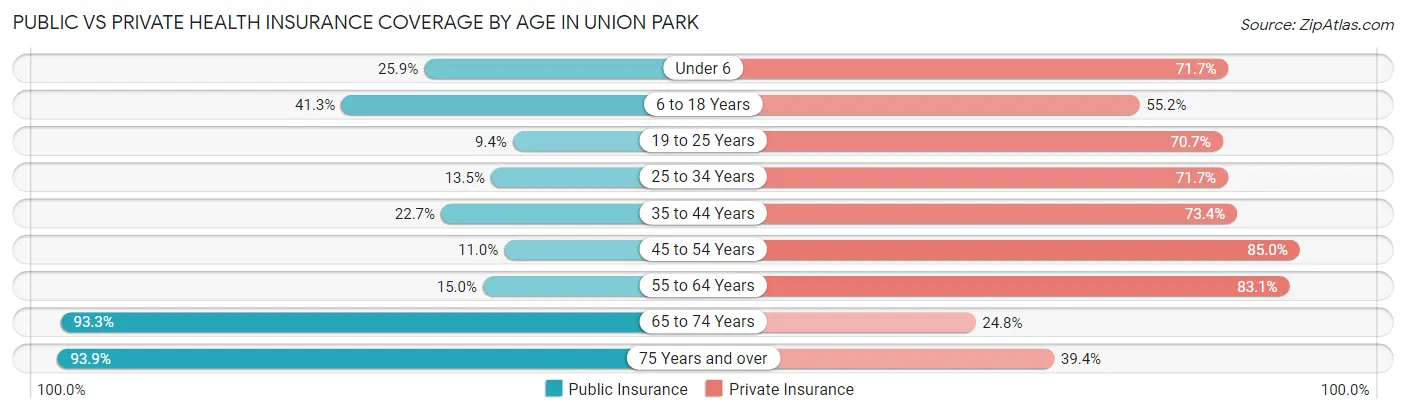
| Age Bracket | Public Insurance | Private Insurance |
| Under 6 | 159 (25.9%) | 441 (71.7%) |
| 6 to 18 Years | 573 (41.2%) | 767 (55.2%) |
| 19 to 25 Years | 128 (9.4%) | 962 (70.7%) |
| 25 to 34 Years | 236 (13.5%) | 1,255 (71.7%) |
| 35 to 44 Years | 292 (22.7%) | 942 (73.4%) |
| 45 to 54 Years | 164 (11.0%) | 1,267 (85.0%) |
| 55 to 64 Years | 227 (14.9%) | 1,261 (83.1%) |
| 65 to 74 Years | 866 (93.3%) | 230 (24.8%) |
| 75 Years and over | 446 (93.9%) | 187 (39.4%) |
| Total | 3,091 (28.6%) | 7,312 (67.6%) |
Disability Status by Sex by Age in Union Park
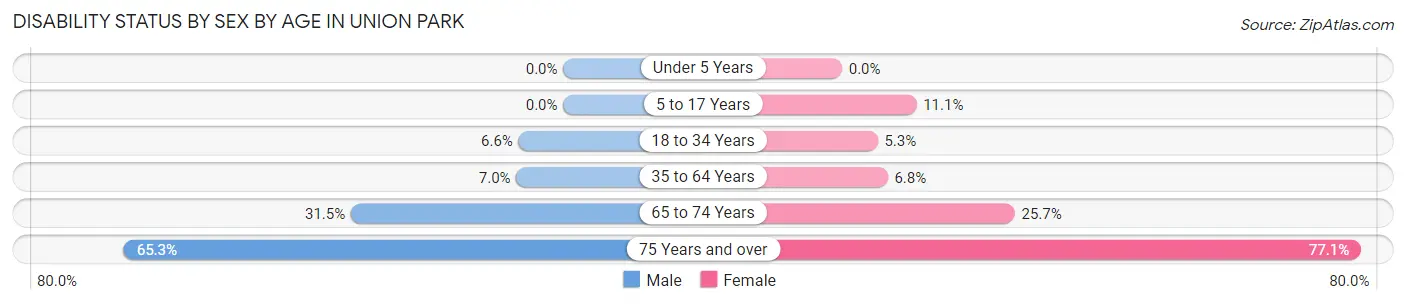
| Age Bracket | Male | Female |
| Under 5 Years | 0 (0.0%) | 0 (0.0%) |
| 5 to 17 Years | 0 (0.0%) | 85 (11.1%) |
| 18 to 34 Years | 121 (6.6%) | 74 (5.3%) |
| 35 to 64 Years | 143 (7.0%) | 152 (6.8%) |
| 65 to 74 Years | 134 (31.5%) | 129 (25.7%) |
| 75 Years and over | 139 (65.3%) | 202 (77.1%) |
Disability Class by Sex by Age in Union Park
Disability Class: Hearing Difficulty
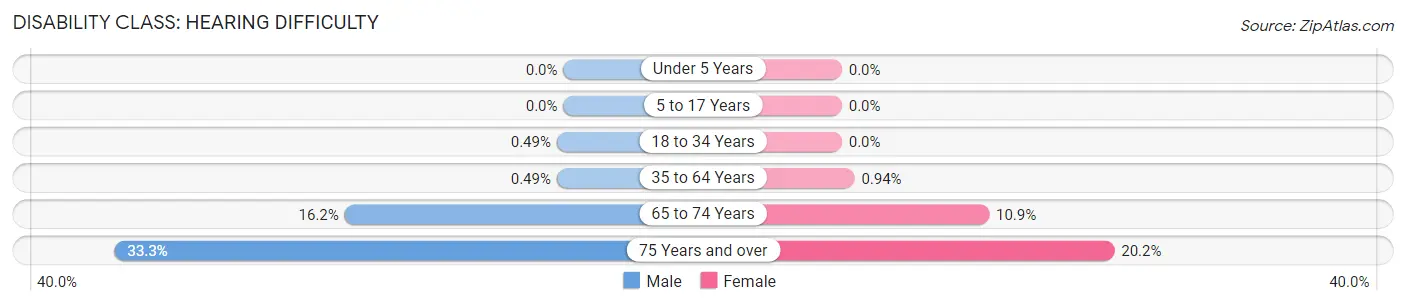
| Age Bracket | Male | Female |
| Under 5 Years | 0 (0.0%) | 0 (0.0%) |
| 5 to 17 Years | 0 (0.0%) | 0 (0.0%) |
| 18 to 34 Years | 9 (0.5%) | 0 (0.0%) |
| 35 to 64 Years | 10 (0.5%) | 21 (0.9%) |
| 65 to 74 Years | 69 (16.2%) | 55 (10.9%) |
| 75 Years and over | 71 (33.3%) | 53 (20.2%) |
Disability Class: Vision Difficulty
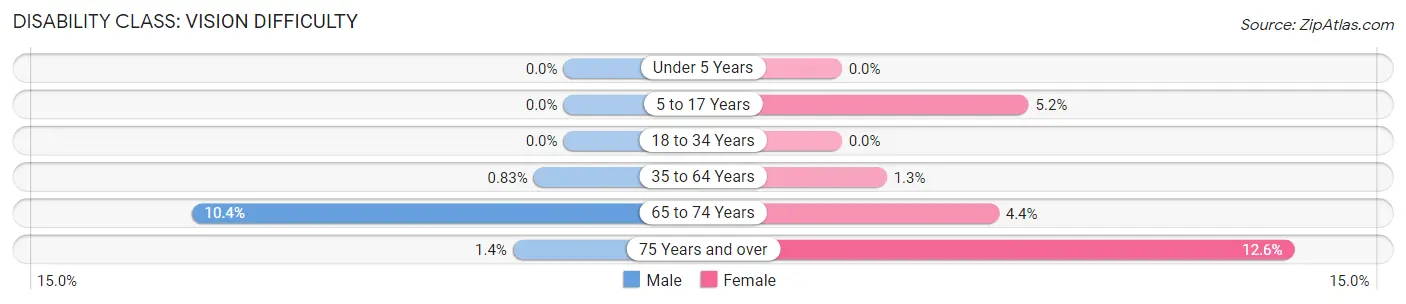
| Age Bracket | Male | Female |
| Under 5 Years | 0 (0.0%) | 0 (0.0%) |
| 5 to 17 Years | 0 (0.0%) | 40 (5.2%) |
| 18 to 34 Years | 0 (0.0%) | 0 (0.0%) |
| 35 to 64 Years | 17 (0.8%) | 28 (1.3%) |
| 65 to 74 Years | 44 (10.3%) | 22 (4.4%) |
| 75 Years and over | 3 (1.4%) | 33 (12.6%) |
Disability Class: Cognitive Difficulty
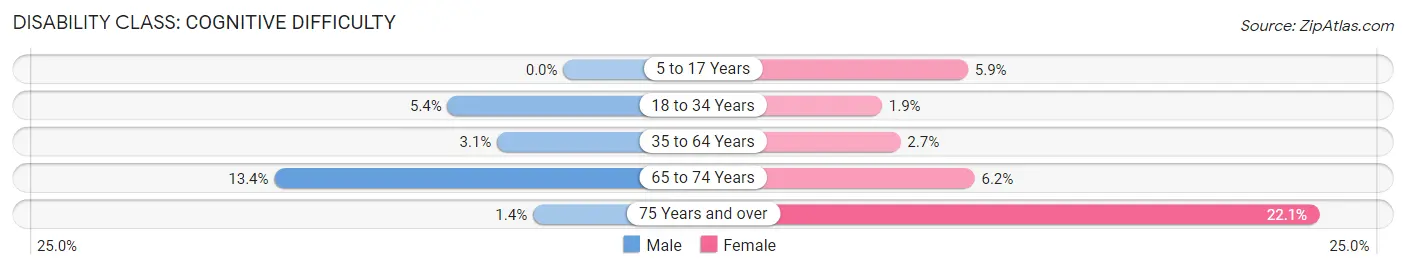
| Age Bracket | Male | Female |
| 5 to 17 Years | 0 (0.0%) | 45 (5.9%) |
| 18 to 34 Years | 98 (5.4%) | 26 (1.9%) |
| 35 to 64 Years | 63 (3.1%) | 61 (2.7%) |
| 65 to 74 Years | 57 (13.4%) | 31 (6.2%) |
| 75 Years and over | 3 (1.4%) | 58 (22.1%) |
Disability Class: Ambulatory Difficulty
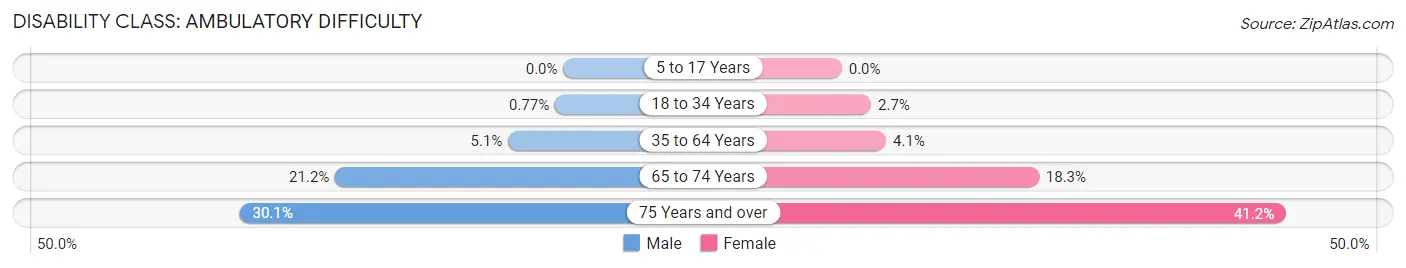
| Age Bracket | Male | Female |
| 5 to 17 Years | 0 (0.0%) | 0 (0.0%) |
| 18 to 34 Years | 14 (0.8%) | 38 (2.7%) |
| 35 to 64 Years | 105 (5.1%) | 92 (4.1%) |
| 65 to 74 Years | 90 (21.2%) | 92 (18.3%) |
| 75 Years and over | 64 (30.0%) | 108 (41.2%) |
Disability Class: Self-Care Difficulty
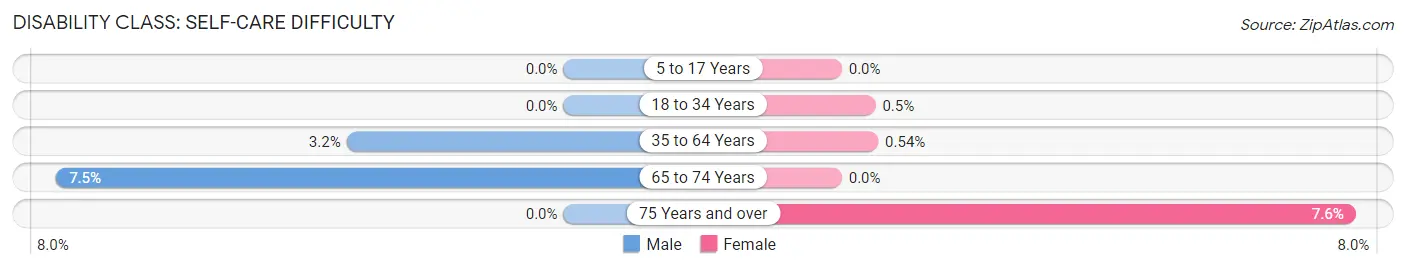
| Age Bracket | Male | Female |
| 5 to 17 Years | 0 (0.0%) | 0 (0.0%) |
| 18 to 34 Years | 0 (0.0%) | 7 (0.5%) |
| 35 to 64 Years | 66 (3.2%) | 12 (0.5%) |
| 65 to 74 Years | 32 (7.5%) | 0 (0.0%) |
| 75 Years and over | 0 (0.0%) | 20 (7.6%) |
Technology Access in Union Park
Computing Device Access in Union Park
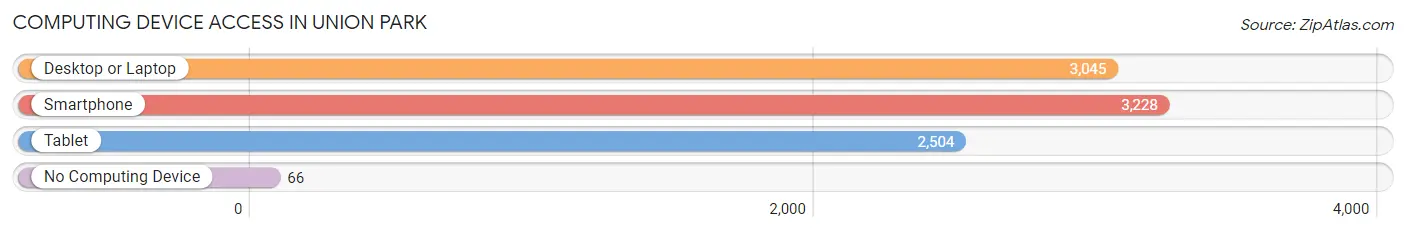
| Device Type | # Households | % Households |
| Desktop or Laptop | 3,045 | 88.7% |
| Smartphone | 3,228 | 94.0% |
| Tablet | 2,504 | 72.9% |
| No Computing Device | 66 | 1.9% |
| Total | 3,433 | 100.0% |
Internet Access in Union Park
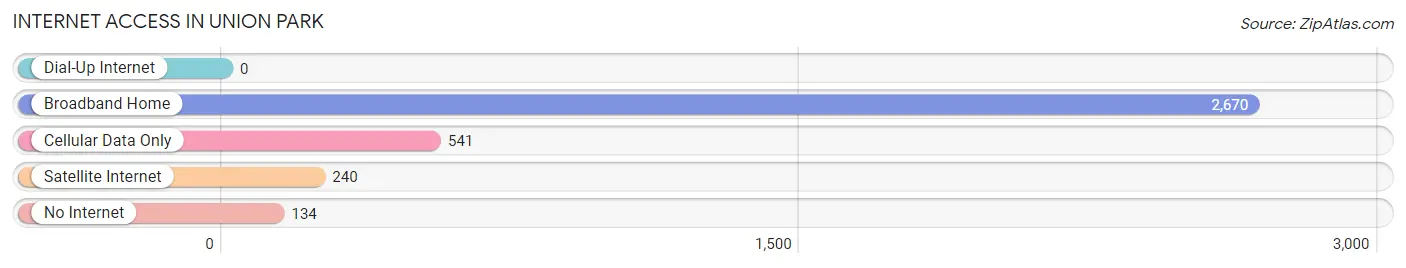
| Internet Type | # Households | % Households |
| Dial-Up Internet | 0 | 0.0% |
| Broadband Home | 2,670 | 77.8% |
| Cellular Data Only | 541 | 15.8% |
| Satellite Internet | 240 | 7.0% |
| No Internet | 134 | 3.9% |
| Total | 3,433 | 100.0% |
Union Park Summary
Introduction
Union Park is an unincorporated community located in Orange County, Florida. It is located in the eastern part of the county, just south of the city of Orlando. The community is bordered by the cities of Orlando, Winter Park, and Maitland. Union Park is a small, residential community with a population of approximately 4,000 people. The community is known for its quiet, suburban atmosphere and its close proximity to downtown Orlando.
History
Union Park was originally part of the large tract of land known as the “Union Park Grant”, which was granted to the Union Park Land Company in 1883. The Union Park Land Company was formed by a group of investors from the North, who were looking to invest in Florida real estate. The company purchased the land from the State of Florida and began to develop the area.
The first development in Union Park was a small residential subdivision known as “Union Park Estates”. This subdivision was developed in the late 1880s and early 1890s. The development included a number of small homes, as well as a few larger homes. The development was successful and the area began to grow.
In the early 1900s, Union Park began to attract more businesses and industries. The area became home to a number of factories, including a cigar factory, a furniture factory, and a canning factory. The area also became home to a number of small businesses, such as grocery stores, restaurants, and other retail establishments.
In the 1950s, Union Park began to experience a period of rapid growth. The area became home to a number of new subdivisions, as well as a number of new businesses. The area also became home to a number of new schools, churches, and other community organizations.
Geography
Union Park is located in the eastern part of Orange County, Florida. It is bordered by the cities of Orlando, Winter Park, and Maitland. The community is located just south of the city of Orlando, and is approximately 10 miles from downtown Orlando.
The community is located in a flat, low-lying area. The terrain is mostly flat, with some rolling hills. The area is mostly residential, with some commercial and industrial areas. The area is also home to a number of parks and recreational areas, including Lake Fairview Park and the Union Park Golf Course.
Economy
Union Park is a primarily residential community, with a small commercial and industrial sector. The area is home to a number of small businesses, including restaurants, grocery stores, and other retail establishments. The area is also home to a number of professional offices, such as doctors, lawyers, and other professionals.
The area is also home to a number of industrial and manufacturing businesses. The area is home to a number of factories, including a cigar factory, a furniture factory, and a canning factory. The area is also home to a number of warehouses and distribution centers.
Demographics
As of the 2010 census, the population of Union Park was 4,000 people. The population is primarily white (83.3%), with a small percentage of African Americans (7.3%), Hispanics (4.3%), and Asians (2.3%). The median household income in Union Park is $50,000, and the median home value is $150,000.
Conclusion
Union Park is a small, residential community located in Orange County, Florida. The community is known for its quiet, suburban atmosphere and its close proximity to downtown Orlando. The area is home to a number of small businesses, factories, and other commercial and industrial establishments. The population of Union Park is primarily white, with a small percentage of African Americans, Hispanics, and Asians. The median household income in Union Park is $50,000, and the median home value is $150,000.
Common Questions
What is Per Capita Income in Union Park?
Per Capita income in Union Park is $30,163.
What is the Median Family Income in Union Park?
Median Family Income in Union Park is $90,929.
What is the Median Household income in Union Park?
Median Household Income in Union Park is $79,970.
What is Income or Wage Gap in Union Park?
Income or Wage Gap in Union Park is 0.9%.
Women in Union Park earn 99.1 cents for every dollar earned by a man.
What is Inequality or Gini Index in Union Park?
Inequality or Gini Index in Union Park is 0.36.
What is the Total Population of Union Park?
Total Population of Union Park is 10,821.
What is the Total Male Population of Union Park?
Total Male Population of Union Park is 5,478.
What is the Total Female Population of Union Park?
Total Female Population of Union Park is 5,343.
What is the Ratio of Males per 100 Females in Union Park?
There are 102.53 Males per 100 Females in Union Park.
What is the Ratio of Females per 100 Males in Union Park?
There are 97.54 Females per 100 Males in Union Park.
What is the Median Population Age in Union Park?
Median Population Age in Union Park is 37.6 Years.
What is the Average Family Size in Union Park
Average Family Size in Union Park is 3.5 People.
What is the Average Household Size in Union Park
Average Household Size in Union Park is 3.1 People.
How Large is the Labor Force in Union Park?
There are 6,510 People in the Labor Forcein in Union Park.
What is the Percentage of People in the Labor Force in Union Park?
71.3% of People are in the Labor Force in Union Park.
What is the Unemployment Rate in Union Park?
Unemployment Rate in Union Park is 3.4%.