Lake Lorraine, FL Map & Demographics
Lake Lorraine Map
Lake Lorraine Overview
$47,312
PER CAPITA INCOME
$102,719
AVG FAMILY INCOME
$85,313
AVG HOUSEHOLD INCOME
24.3%
WAGE / INCOME GAP [ % ]
75.7¢/ $1
WAGE / INCOME GAP [ $ ]
$9,069
FAMILY INCOME DEFICIT
0.43
INEQUALITY / GINI INDEX
7,164
TOTAL POPULATION
3,586
MALE POPULATION
3,578
FEMALE POPULATION
100.22
MALES / 100 FEMALES
99.78
FEMALES / 100 MALES
40.4
MEDIAN AGE
2.9
AVG FAMILY SIZE
2.5
AVG HOUSEHOLD SIZE
3,836
LABOR FORCE [ PEOPLE ]
65.9%
PERCENT IN LABOR FORCE
1.7%
UNEMPLOYMENT RATE
Income in Lake Lorraine
Income Overview in Lake Lorraine
Per Capita Income in Lake Lorraine is $47,312, while median incomes of families and households are $102,719 and $85,313 respectively.
| Characteristic | Number | Measure |
| Per Capita Income | 7,164 | $47,312 |
| Median Family Income | 2,013 | $102,719 |
| Mean Family Income | 2,013 | $135,904 |
| Median Household Income | 2,890 | $85,313 |
| Mean Household Income | 2,890 | $117,372 |
| Income Deficit | 2,013 | $9,069 |
| Wage / Income Gap (%) | 7,164 | 24.34% |
| Wage / Income Gap ($) | 7,164 | 75.66¢ per $1 |
| Gini / Inequality Index | 7,164 | 0.43 |
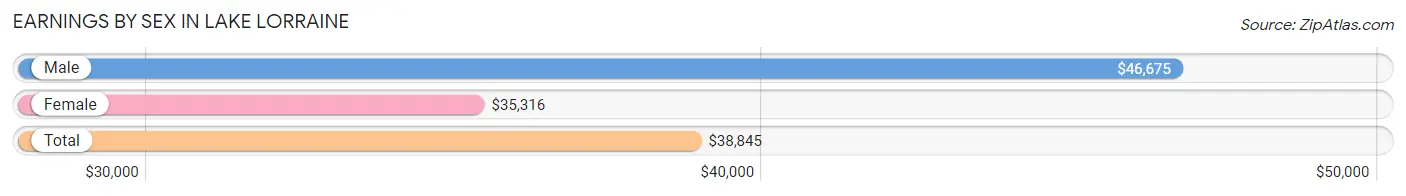
Earnings by Sex in Lake Lorraine
Average Earnings in Lake Lorraine are $38,845, $46,675 for men and $35,316 for women, a difference of 24.3%.
| Sex | Number | Average Earnings |
| Male | 2,153 (52.2%) | $46,675 |
| Female | 1,971 (47.8%) | $35,316 |
| Total | 4,124 (100.0%) | $38,845 |
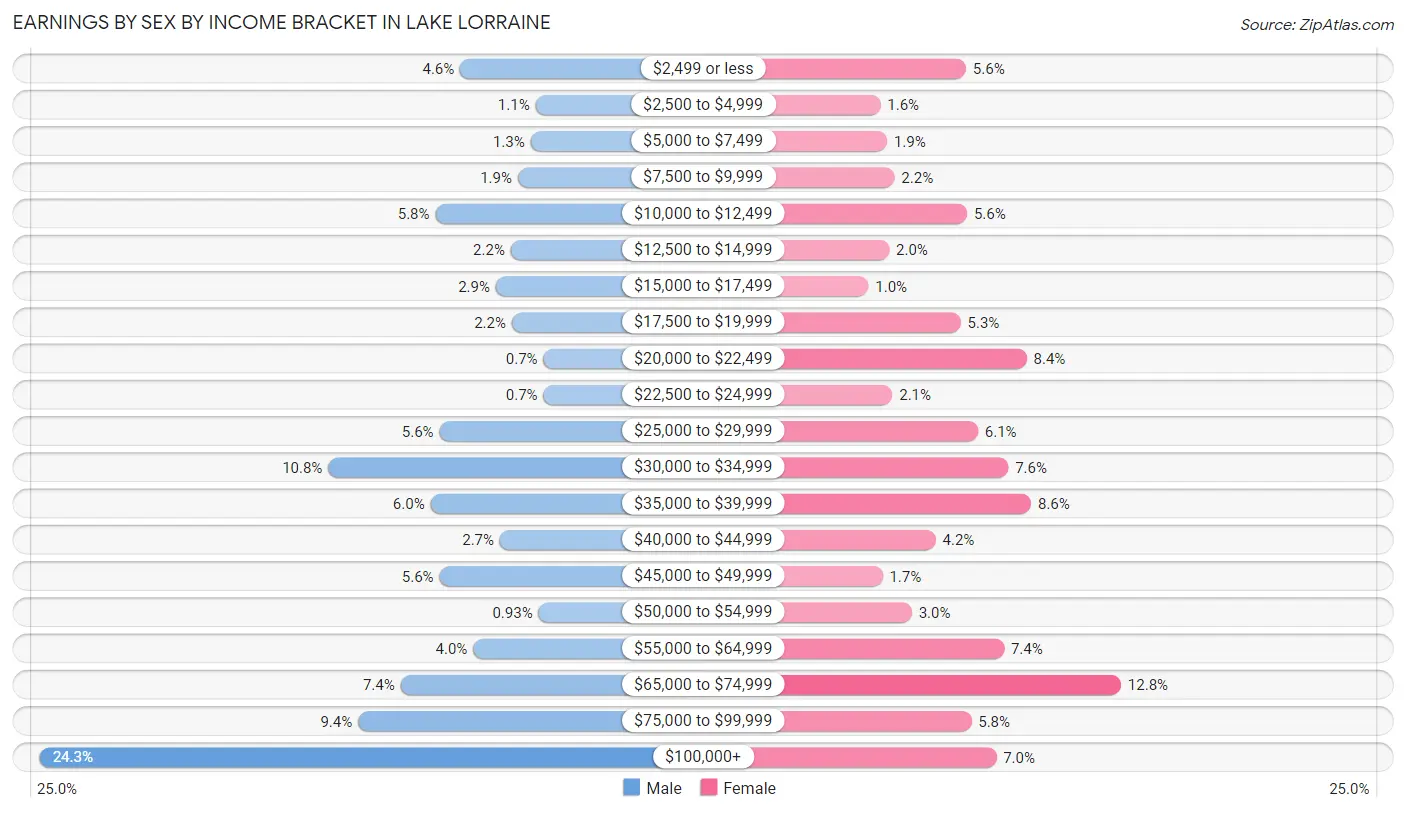
Earnings by Sex by Income Bracket in Lake Lorraine
The most common earnings brackets in Lake Lorraine are $100,000+ for men (523 | 24.3%) and $65,000 to $74,999 for women (253 | 12.8%).
| Income | Male | Female |
| $2,499 or less | 99 (4.6%) | 110 (5.6%) |
| $2,500 to $4,999 | 23 (1.1%) | 31 (1.6%) |
| $5,000 to $7,499 | 28 (1.3%) | 37 (1.9%) |
| $7,500 to $9,999 | 41 (1.9%) | 44 (2.2%) |
| $10,000 to $12,499 | 124 (5.8%) | 111 (5.6%) |
| $12,500 to $14,999 | 48 (2.2%) | 39 (2.0%) |
| $15,000 to $17,499 | 63 (2.9%) | 20 (1.0%) |
| $17,500 to $19,999 | 47 (2.2%) | 105 (5.3%) |
| $20,000 to $22,499 | 15 (0.7%) | 166 (8.4%) |
| $22,500 to $24,999 | 15 (0.7%) | 42 (2.1%) |
| $25,000 to $29,999 | 120 (5.6%) | 121 (6.1%) |
| $30,000 to $34,999 | 232 (10.8%) | 149 (7.6%) |
| $35,000 to $39,999 | 129 (6.0%) | 170 (8.6%) |
| $40,000 to $44,999 | 59 (2.7%) | 82 (4.2%) |
| $45,000 to $49,999 | 120 (5.6%) | 33 (1.7%) |
| $50,000 to $54,999 | 20 (0.9%) | 60 (3.0%) |
| $55,000 to $64,999 | 86 (4.0%) | 145 (7.4%) |
| $65,000 to $74,999 | 159 (7.4%) | 253 (12.8%) |
| $75,000 to $99,999 | 202 (9.4%) | 115 (5.8%) |
| $100,000+ | 523 (24.3%) | 138 (7.0%) |
| Total | 2,153 (100.0%) | 1,971 (100.0%) |
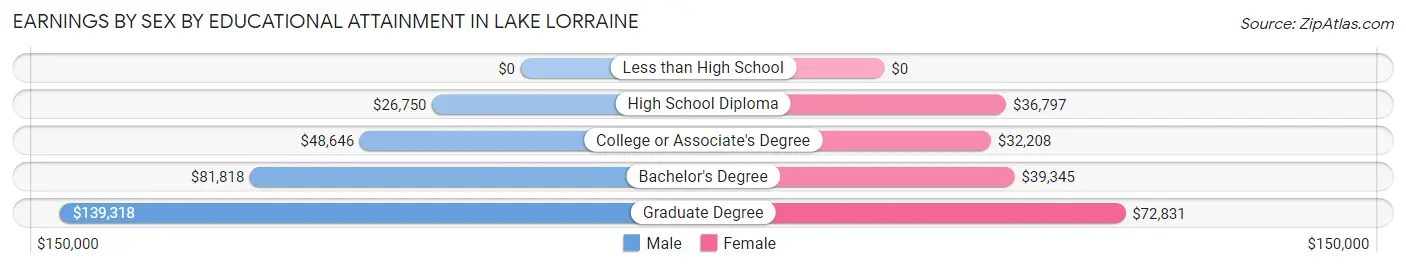
Earnings by Sex by Educational Attainment in Lake Lorraine
Average earnings in Lake Lorraine are $59,841 for men and $40,071 for women, a difference of 33.0%. Men with an educational attainment of graduate degree enjoy the highest average annual earnings of $139,318, while those with high school diploma education earn the least with $26,750. Women with an educational attainment of graduate degree earn the most with the average annual earnings of $72,831, while those with college or associate's degree education have the smallest earnings of $32,208.
| Educational Attainment | Male Income | Female Income |
| Less than High School | - | - |
| High School Diploma | $26,750 | $36,797 |
| College or Associate's Degree | $48,646 | $32,208 |
| Bachelor's Degree | $81,818 | $39,345 |
| Graduate Degree | $139,318 | $72,831 |
| Total | $59,841 | $40,071 |
Family Income in Lake Lorraine
Family Income Brackets in Lake Lorraine
According to the Lake Lorraine family income data, there are 427 families falling into the $200,000+ income range, which is the most common income bracket and makes up 21.2% of all families. Conversely, the $10,000 to $14,999 income bracket is the least frequent group with only 10 families (0.5%) belonging to this category.
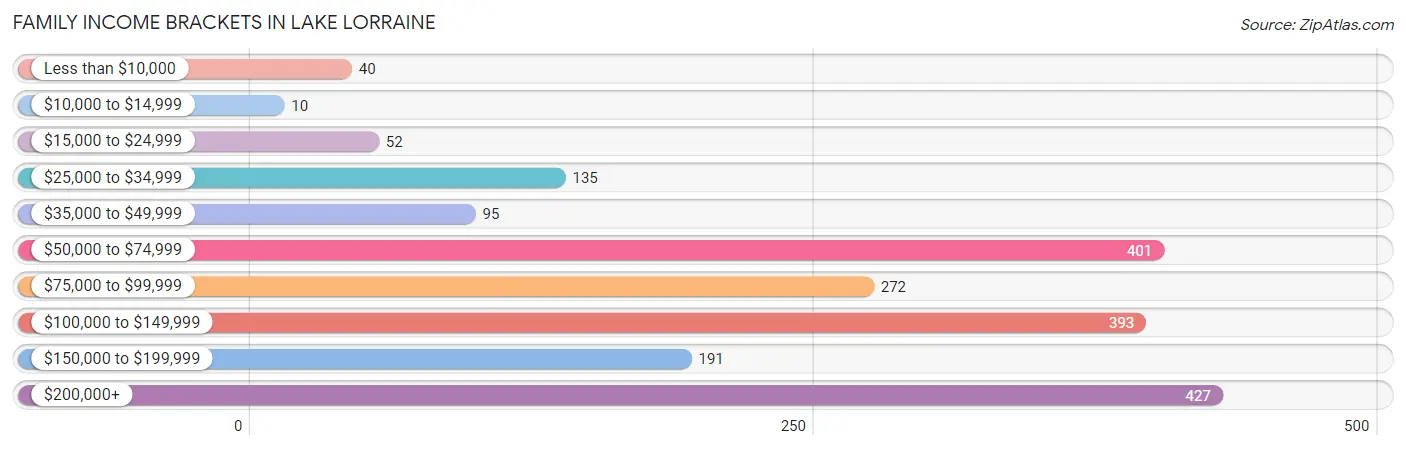
| Income Bracket | # Families | % Families |
| Less than $10,000 | 40 | 2.0% |
| $10,000 to $14,999 | 10 | 0.5% |
| $15,000 to $24,999 | 52 | 2.6% |
| $25,000 to $34,999 | 135 | 6.7% |
| $35,000 to $49,999 | 95 | 4.7% |
| $50,000 to $74,999 | 401 | 19.9% |
| $75,000 to $99,999 | 272 | 13.5% |
| $100,000 to $149,999 | 393 | 19.5% |
| $150,000 to $199,999 | 191 | 9.5% |
| $200,000+ | 427 | 21.2% |
Family Income by Famaliy Size in Lake Lorraine
3-person families (585 | 29.1%) account for the highest median family income in Lake Lorraine with $136,375 per family, while 3-person families (585 | 29.1%) have the highest median income of $45,458 per family member.
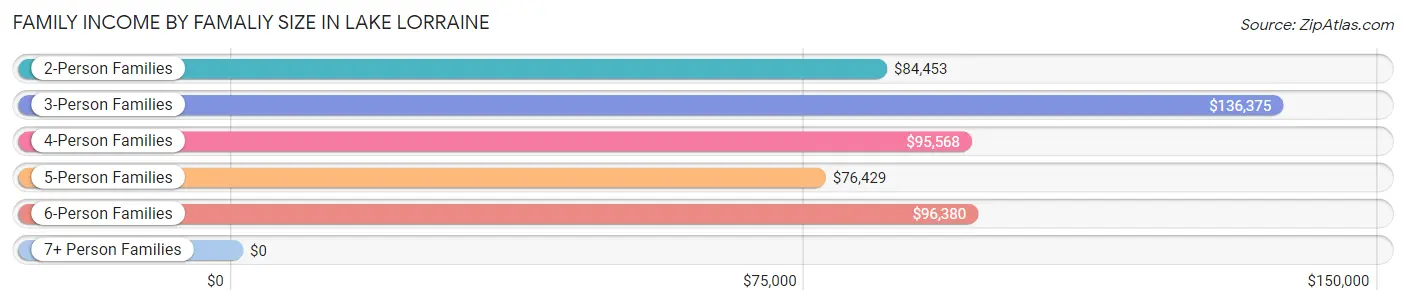
| Income Bracket | # Families | Median Income |
| 2-Person Families | 980 (48.7%) | $84,453 |
| 3-Person Families | 585 (29.1%) | $136,375 |
| 4-Person Families | 277 (13.8%) | $95,568 |
| 5-Person Families | 92 (4.6%) | $76,429 |
| 6-Person Families | 73 (3.6%) | $96,380 |
| 7+ Person Families | 6 (0.3%) | $0 |
| Total | 2,013 (100.0%) | $102,719 |
Family Income by Number of Earners in Lake Lorraine
The median family income in Lake Lorraine is $102,719, with families comprising 3+ earners (227) having the highest median family income of $152,699, while families with no earners (333) have the lowest median family income of $68,906, accounting for 11.3% and 16.5% of families, respectively.
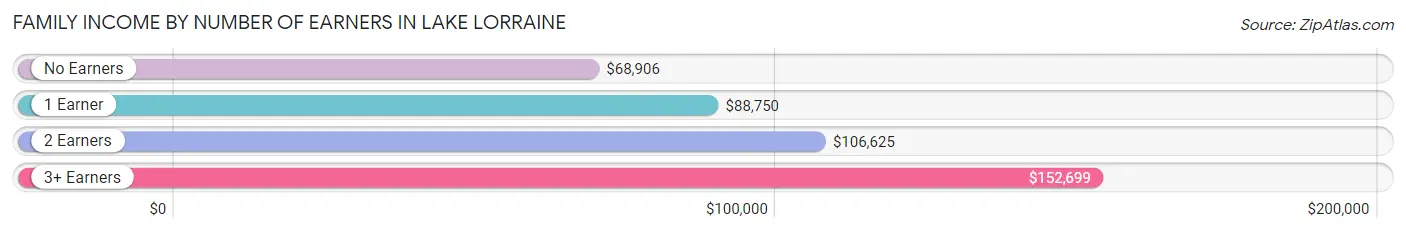
| Number of Earners | # Families | Median Income |
| No Earners | 333 (16.5%) | $68,906 |
| 1 Earner | 502 (24.9%) | $88,750 |
| 2 Earners | 951 (47.2%) | $106,625 |
| 3+ Earners | 227 (11.3%) | $152,699 |
| Total | 2,013 (100.0%) | $102,719 |
Household Income in Lake Lorraine
Household Income Brackets in Lake Lorraine
With 572 households falling in the category, the $50,000 to $74,999 income range is the most frequent in Lake Lorraine, accounting for 19.8% of all households. In contrast, only 32 households (1.1%) fall into the $10,000 to $14,999 income bracket, making it the least populous group.
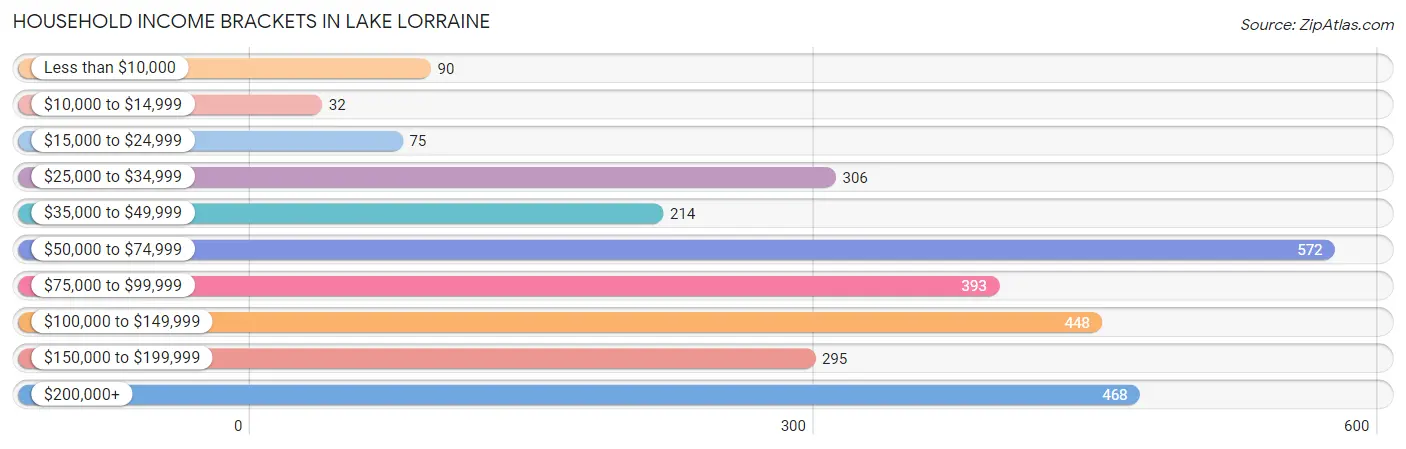
| Income Bracket | # Households | % Households |
| Less than $10,000 | 90 | 3.1% |
| $10,000 to $14,999 | 32 | 1.1% |
| $15,000 to $24,999 | 75 | 2.6% |
| $25,000 to $34,999 | 306 | 10.6% |
| $35,000 to $49,999 | 214 | 7.4% |
| $50,000 to $74,999 | 572 | 19.8% |
| $75,000 to $99,999 | 393 | 13.6% |
| $100,000 to $149,999 | 448 | 15.5% |
| $150,000 to $199,999 | 295 | 10.2% |
| $200,000+ | 468 | 16.2% |
Household Income by Householder Age in Lake Lorraine
The median household income in Lake Lorraine is $85,313, with the highest median household income of $127,381 found in the 45 to 64 years age bracket for the primary householder. A total of 1,066 households (36.9%) fall into this category. Meanwhile, the 15 to 24 years age bracket for the primary householder has the lowest median household income of $0, with 149 households (5.2%) in this group.
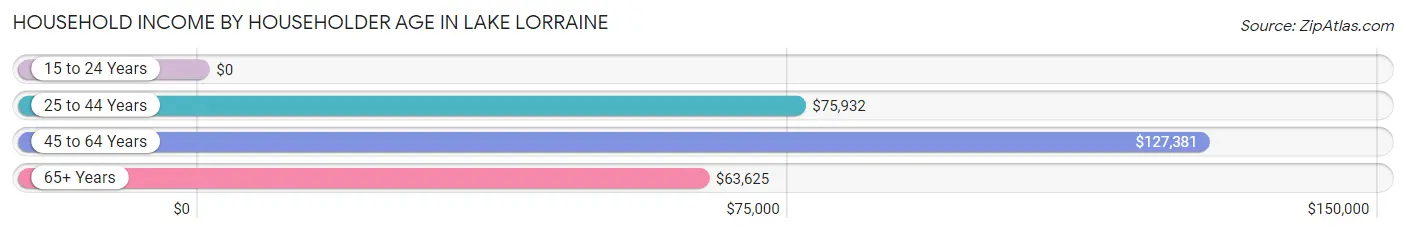
| Income Bracket | # Households | Median Income |
| 15 to 24 Years | 149 (5.2%) | $0 |
| 25 to 44 Years | 804 (27.8%) | $75,932 |
| 45 to 64 Years | 1,066 (36.9%) | $127,381 |
| 65+ Years | 871 (30.1%) | $63,625 |
| Total | 2,890 (100.0%) | $85,313 |
Poverty in Lake Lorraine
Income Below Poverty by Sex and Age in Lake Lorraine
With 10.1% poverty level for males and 9.7% for females among the residents of Lake Lorraine, under 5 year old males and 15 year old females are the most vulnerable to poverty, with 101 males (32.9%) and 11 females (100.0%) in their respective age groups living below the poverty level.
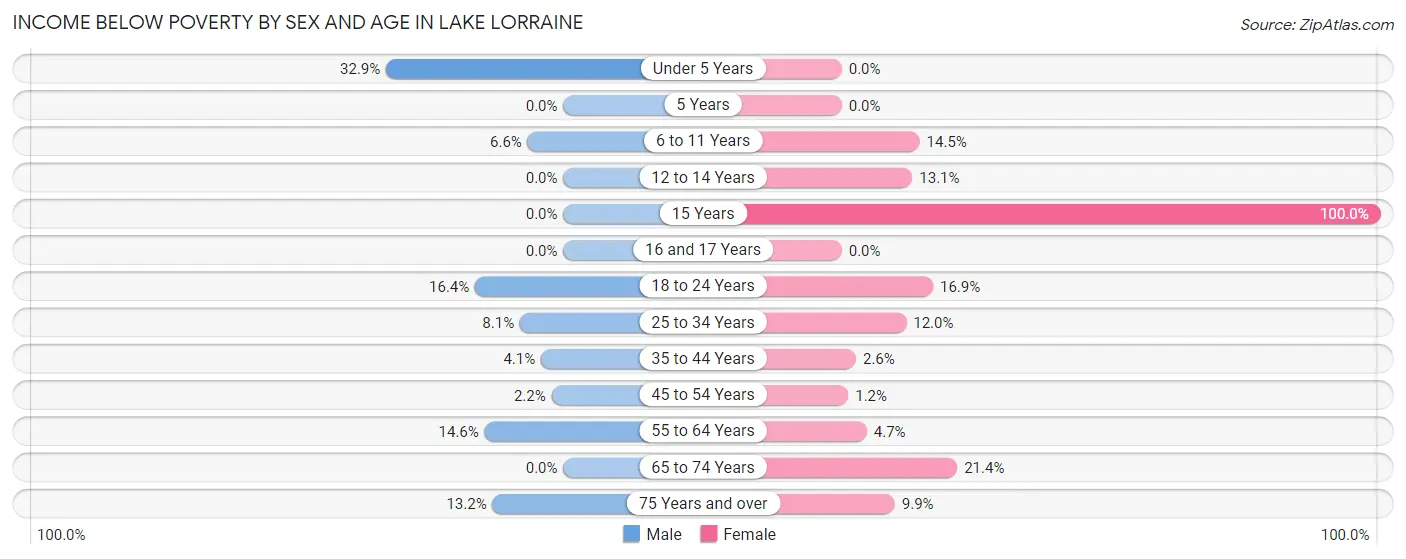
| Age Bracket | Male | Female |
| Under 5 Years | 101 (32.9%) | 0 (0.0%) |
| 5 Years | 0 (0.0%) | 0 (0.0%) |
| 6 to 11 Years | 10 (6.6%) | 51 (14.4%) |
| 12 to 14 Years | 0 (0.0%) | 19 (13.1%) |
| 15 Years | 0 (0.0%) | 11 (100.0%) |
| 16 and 17 Years | 0 (0.0%) | 0 (0.0%) |
| 18 to 24 Years | 58 (16.4%) | 61 (16.9%) |
| 25 to 34 Years | 42 (8.1%) | 59 (12.0%) |
| 35 to 44 Years | 11 (4.1%) | 11 (2.6%) |
| 45 to 54 Years | 10 (2.2%) | 5 (1.2%) |
| 55 to 64 Years | 84 (14.6%) | 24 (4.6%) |
| 65 to 74 Years | 0 (0.0%) | 72 (21.4%) |
| 75 Years and over | 43 (13.2%) | 32 (9.9%) |
| Total | 359 (10.1%) | 345 (9.7%) |
Income Above Poverty by Sex and Age in Lake Lorraine
According to the poverty statistics in Lake Lorraine, males aged 5 years and females aged under 5 years are the age groups that are most secure financially, with 100.0% of males and 100.0% of females in these age groups living above the poverty line.
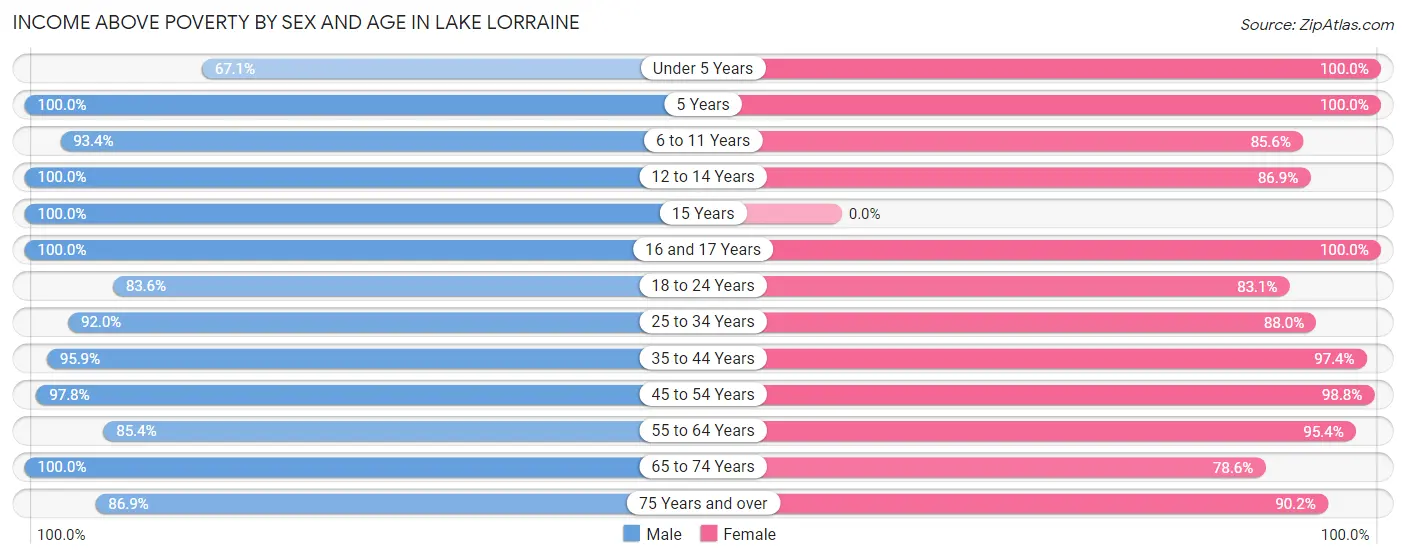
| Age Bracket | Male | Female |
| Under 5 Years | 206 (67.1%) | 80 (100.0%) |
| 5 Years | 59 (100.0%) | 24 (100.0%) |
| 6 to 11 Years | 141 (93.4%) | 302 (85.6%) |
| 12 to 14 Years | 127 (100.0%) | 126 (86.9%) |
| 15 Years | 46 (100.0%) | 0 (0.0%) |
| 16 and 17 Years | 63 (100.0%) | 83 (100.0%) |
| 18 to 24 Years | 296 (83.6%) | 299 (83.1%) |
| 25 to 34 Years | 480 (91.9%) | 434 (88.0%) |
| 35 to 44 Years | 255 (95.9%) | 405 (97.4%) |
| 45 to 54 Years | 447 (97.8%) | 412 (98.8%) |
| 55 to 64 Years | 491 (85.4%) | 492 (95.4%) |
| 65 to 74 Years | 311 (100.0%) | 264 (78.6%) |
| 75 Years and over | 284 (86.9%) | 293 (90.1%) |
| Total | 3,206 (89.9%) | 3,214 (90.3%) |
Income Below Poverty Among Married-Couple Families in Lake Lorraine
The poverty statistics for married-couple families in Lake Lorraine show that 5.6% or 85 of the total 1,522 families live below the poverty line. Families with 3 or 4 children have the highest poverty rate of 30.6%, comprising of 19 families. On the other hand, families with 5 or more children have the lowest poverty rate of 0.0%, which includes 0 families.
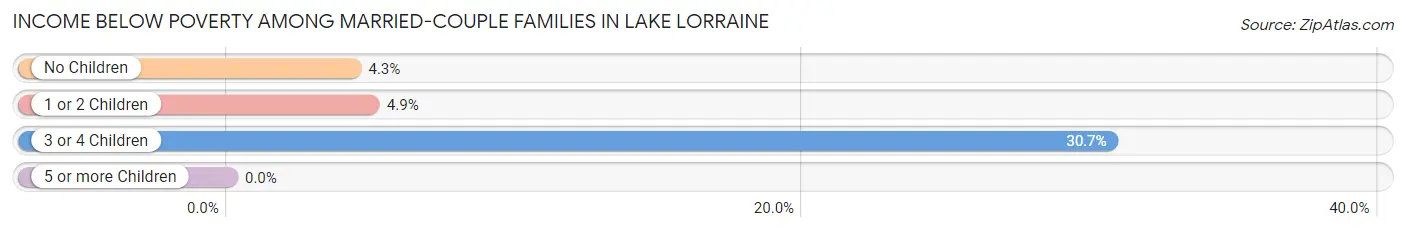
| Children | Above Poverty | Below Poverty |
| No Children | 868 (95.7%) | 39 (4.3%) |
| 1 or 2 Children | 520 (95.1%) | 27 (4.9%) |
| 3 or 4 Children | 43 (69.4%) | 19 (30.6%) |
| 5 or more Children | 6 (100.0%) | 0 (0.0%) |
| Total | 1,437 (94.4%) | 85 (5.6%) |
Income Below Poverty Among Single-Parent Households in Lake Lorraine
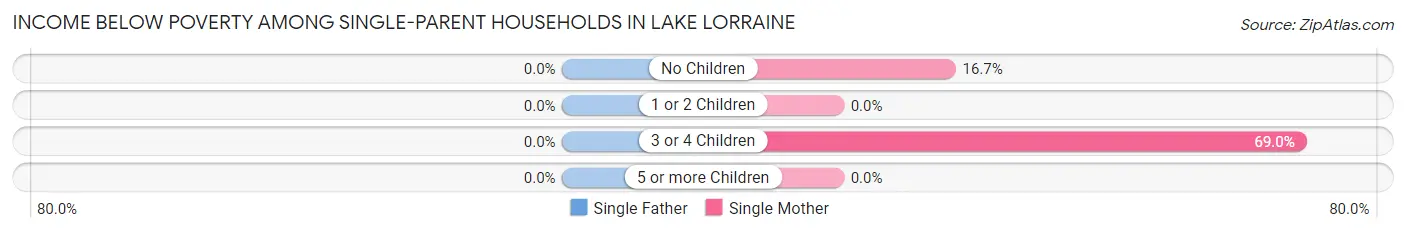
| Children | Single Father | Single Mother |
| No Children | 0 (0.0%) | 25 (16.7%) |
| 1 or 2 Children | 0 (0.0%) | 0 (0.0%) |
| 3 or 4 Children | 0 (0.0%) | 20 (69.0%) |
| 5 or more Children | 0 (0.0%) | 0 (0.0%) |
| Total | 0 (0.0%) | 45 (12.0%) |
Income Below Poverty Among Married-Couple vs Single-Parent Households in Lake Lorraine
The poverty data for Lake Lorraine shows that 85 of the married-couple family households (5.6%) and 45 of the single-parent households (9.2%) are living below the poverty level. Within the married-couple family households, those with 3 or 4 children have the highest poverty rate, with 19 households (30.6%) falling below the poverty line. Among the single-parent households, those with 3 or 4 children have the highest poverty rate, with 20 household (51.3%) living below poverty.
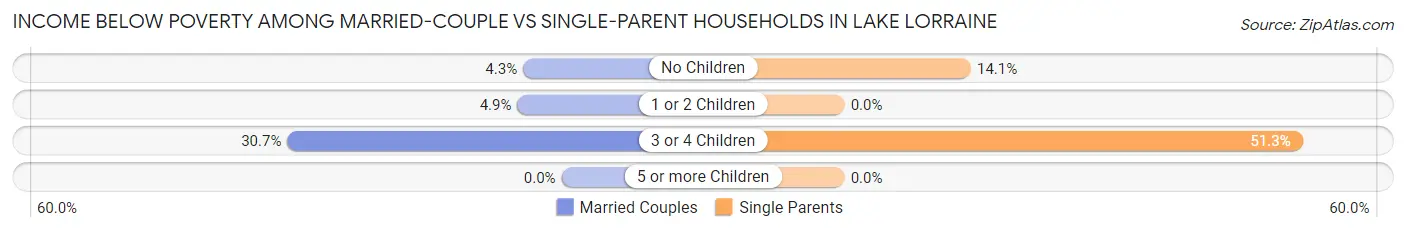
| Children | Married-Couple Families | Single-Parent Households |
| No Children | 39 (4.3%) | 25 (14.1%) |
| 1 or 2 Children | 27 (4.9%) | 0 (0.0%) |
| 3 or 4 Children | 19 (30.6%) | 20 (51.3%) |
| 5 or more Children | 0 (0.0%) | 0 (0.0%) |
| Total | 85 (5.6%) | 45 (9.2%) |
Race in Lake Lorraine
The most populous races in Lake Lorraine are White / Caucasian (5,470 | 76.3%), Hispanic or Latino (1,179 | 16.5%), and Two or more Races (561 | 7.8%).
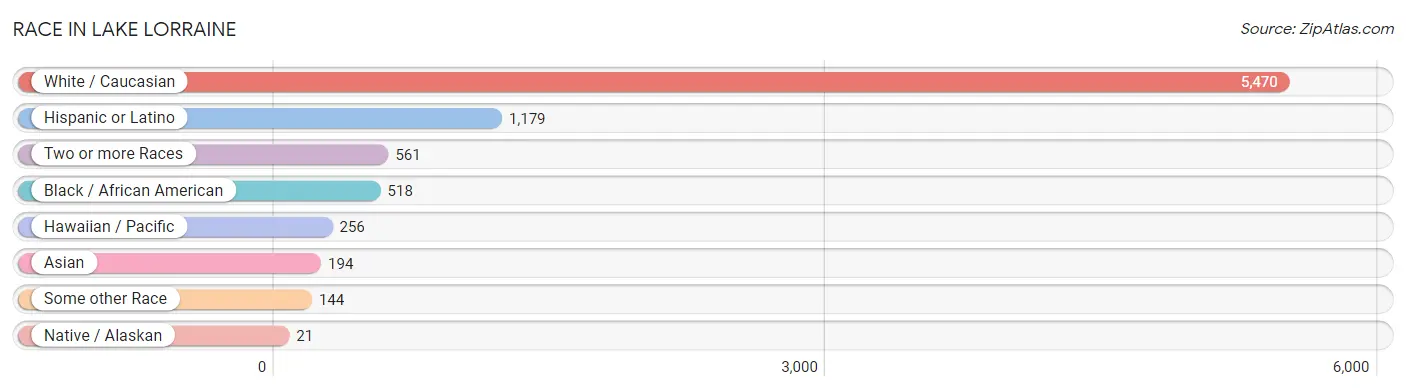
| Race | # Population | % Population |
| Asian | 194 | 2.7% |
| Black / African American | 518 | 7.2% |
| Hawaiian / Pacific | 256 | 3.6% |
| Hispanic or Latino | 1,179 | 16.5% |
| Native / Alaskan | 21 | 0.3% |
| White / Caucasian | 5,470 | 76.3% |
| Two or more Races | 561 | 7.8% |
| Some other Race | 144 | 2.0% |
| Total | 7,164 | 100.0% |
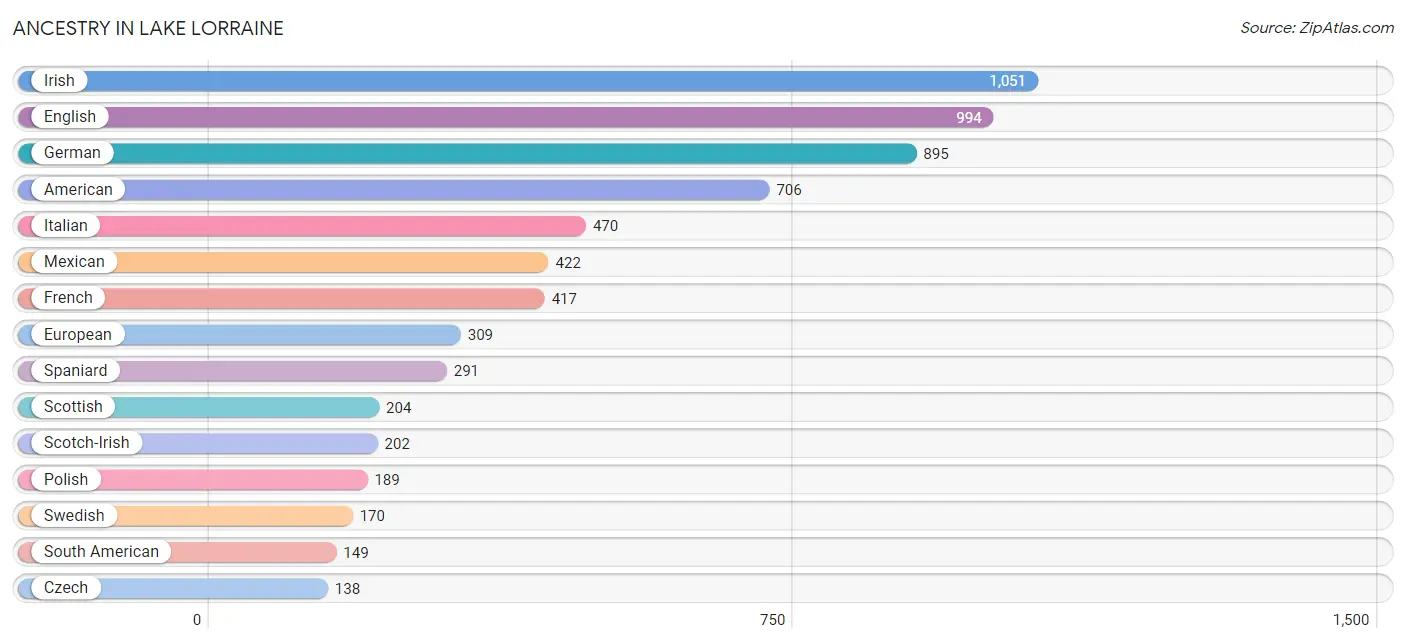
Ancestry in Lake Lorraine
The most populous ancestries reported in Lake Lorraine are Irish (1,051 | 14.7%), English (994 | 13.9%), German (895 | 12.5%), American (706 | 9.9%), and Italian (470 | 6.6%), together accounting for 57.4% of all Lake Lorraine residents.
| Ancestry | # Population | % Population |
| African | 35 | 0.5% |
| American | 706 | 9.9% |
| Apache | 21 | 0.3% |
| Armenian | 12 | 0.2% |
| Austrian | 8 | 0.1% |
| Bhutanese | 32 | 0.4% |
| British | 52 | 0.7% |
| Burmese | 53 | 0.7% |
| Central American | 107 | 1.5% |
| Central American Indian | 23 | 0.3% |
| Cherokee | 11 | 0.2% |
| Colombian | 111 | 1.5% |
| Czech | 138 | 1.9% |
| Danish | 117 | 1.6% |
| Dutch | 26 | 0.4% |
| Eastern European | 47 | 0.7% |
| English | 994 | 13.9% |
| Ethiopian | 23 | 0.3% |
| European | 309 | 4.3% |
| French | 417 | 5.8% |
| German | 895 | 12.5% |
| Greek | 9 | 0.1% |
| Guamanian / Chamorro | 55 | 0.8% |
| Guatemalan | 37 | 0.5% |
| Indian (Asian) | 19 | 0.3% |
| Irish | 1,051 | 14.7% |
| Italian | 470 | 6.6% |
| Korean | 138 | 1.9% |
| Latvian | 8 | 0.1% |
| Luxembourger | 6 | 0.1% |
| Mexican | 422 | 5.9% |
| Norwegian | 42 | 0.6% |
| Pakistani | 37 | 0.5% |
| Panamanian | 28 | 0.4% |
| Peruvian | 38 | 0.5% |
| Polish | 189 | 2.6% |
| Portuguese | 17 | 0.2% |
| Puerto Rican | 56 | 0.8% |
| Romanian | 22 | 0.3% |
| Russian | 32 | 0.4% |
| Salvadoran | 42 | 0.6% |
| Scandinavian | 41 | 0.6% |
| Scotch-Irish | 202 | 2.8% |
| Scottish | 204 | 2.9% |
| Seminole | 23 | 0.3% |
| Slavic | 24 | 0.3% |
| Slovak | 27 | 0.4% |
| South American | 149 | 2.1% |
| Spaniard | 291 | 4.1% |
| Spanish | 132 | 1.8% |
| Sri Lankan | 31 | 0.4% |
| Subsaharan African | 35 | 0.5% |
| Swedish | 170 | 2.4% |
| Swiss | 19 | 0.3% |
| Vietnamese | 27 | 0.4% |
| Welsh | 17 | 0.2% | View All 56 Rows |
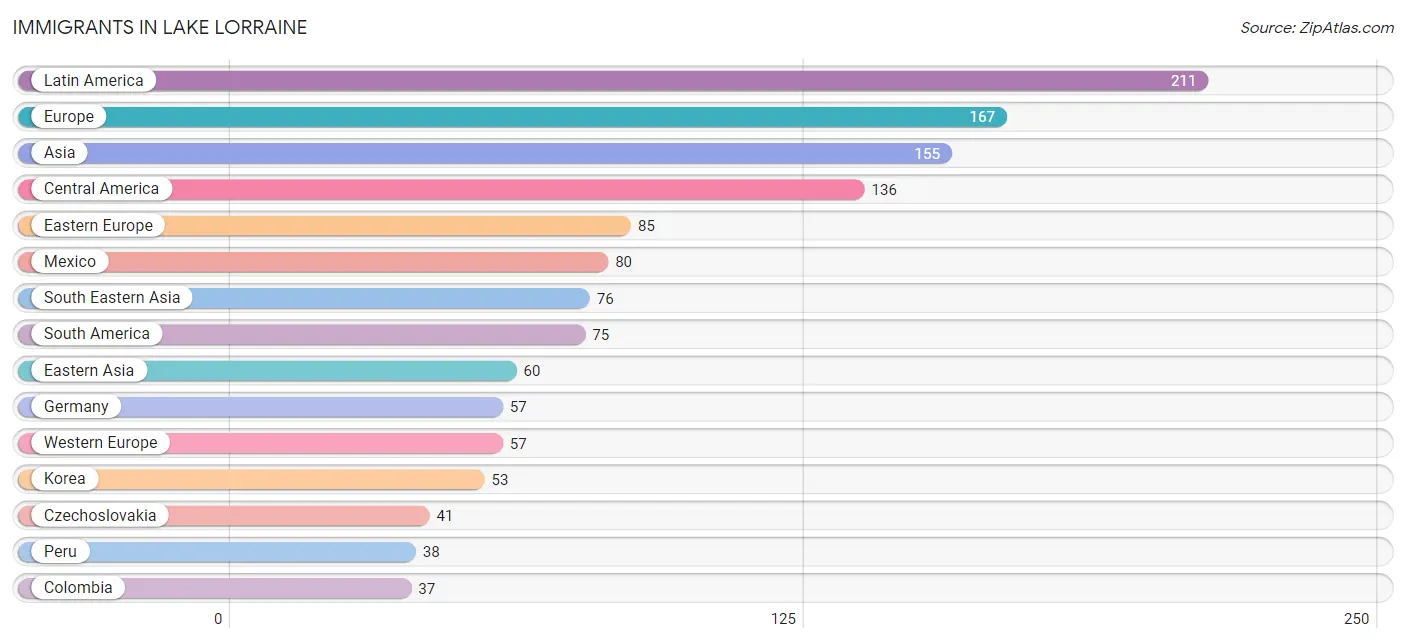
Immigrants in Lake Lorraine
The most numerous immigrant groups reported in Lake Lorraine came from Latin America (211 | 2.9%), Europe (167 | 2.3%), Asia (155 | 2.2%), Central America (136 | 1.9%), and Eastern Europe (85 | 1.2%), together accounting for 10.5% of all Lake Lorraine residents.
| Immigration Origin | # Population | % Population |
| Africa | 35 | 0.5% |
| Asia | 155 | 2.2% |
| Bangladesh | 19 | 0.3% |
| Central America | 136 | 1.9% |
| Colombia | 37 | 0.5% |
| Czechoslovakia | 41 | 0.6% |
| Eastern Africa | 23 | 0.3% |
| Eastern Asia | 60 | 0.8% |
| Eastern Europe | 85 | 1.2% |
| El Salvador | 12 | 0.2% |
| England | 8 | 0.1% |
| Ethiopia | 23 | 0.3% |
| Europe | 167 | 2.3% |
| Germany | 57 | 0.8% |
| Greece | 9 | 0.1% |
| Guatemala | 37 | 0.5% |
| Japan | 7 | 0.1% |
| Korea | 53 | 0.7% |
| Latin America | 211 | 2.9% |
| Latvia | 8 | 0.1% |
| Mexico | 80 | 1.1% |
| Middle Africa | 12 | 0.2% |
| Moldova | 11 | 0.2% |
| Northern Europe | 16 | 0.2% |
| Panama | 7 | 0.1% |
| Peru | 38 | 0.5% |
| Philippines | 25 | 0.4% |
| Russia | 25 | 0.4% |
| South America | 75 | 1.1% |
| South Central Asia | 19 | 0.3% |
| South Eastern Asia | 76 | 1.1% |
| Southern Europe | 9 | 0.1% |
| Thailand | 37 | 0.5% |
| Vietnam | 14 | 0.2% |
| Western Europe | 57 | 0.8% |
| Zaire | 12 | 0.2% | View All 36 Rows |
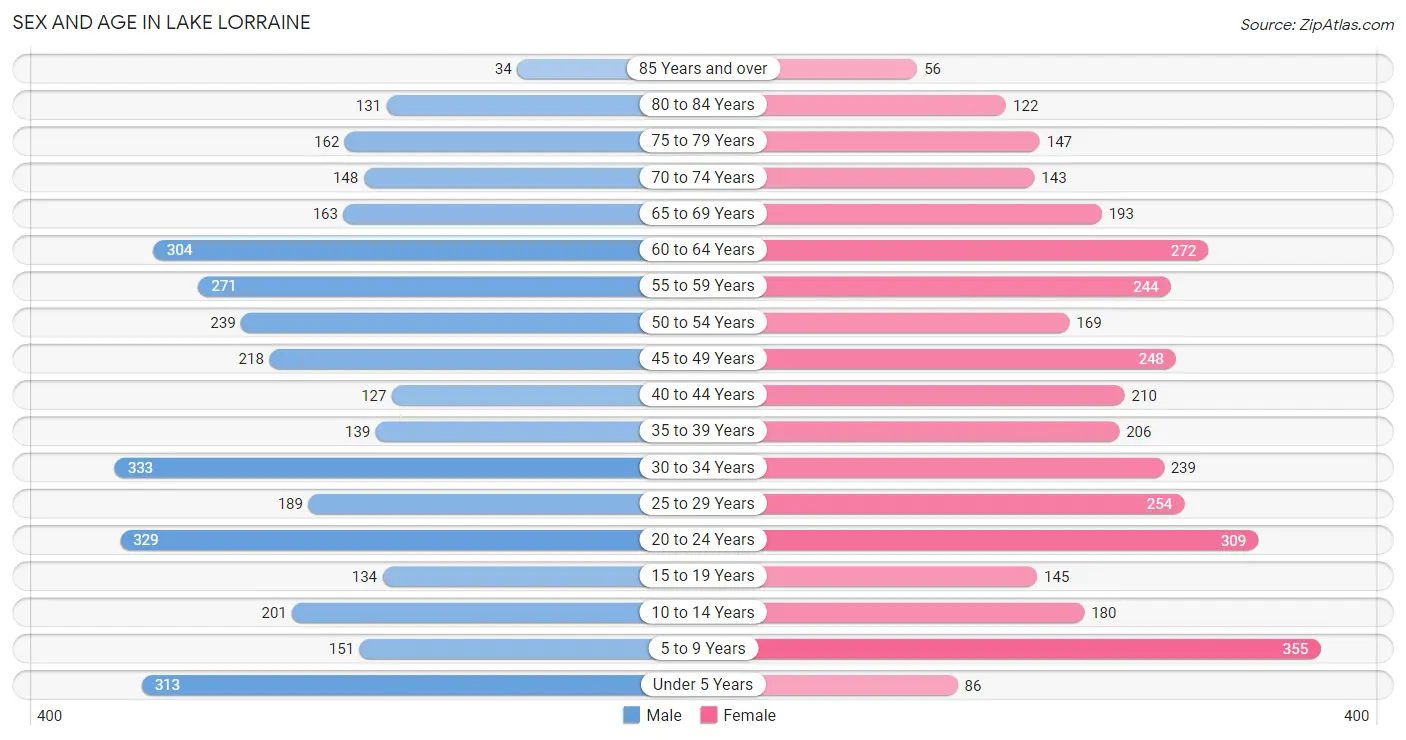
Sex and Age in Lake Lorraine
Sex and Age in Lake Lorraine
The most populous age groups in Lake Lorraine are 30 to 34 Years (333 | 9.3%) for men and 5 to 9 Years (355 | 9.9%) for women.
| Age Bracket | Male | Female |
| Under 5 Years | 313 (8.7%) | 86 (2.4%) |
| 5 to 9 Years | 151 (4.2%) | 355 (9.9%) |
| 10 to 14 Years | 201 (5.6%) | 180 (5.0%) |
| 15 to 19 Years | 134 (3.7%) | 145 (4.1%) |
| 20 to 24 Years | 329 (9.2%) | 309 (8.6%) |
| 25 to 29 Years | 189 (5.3%) | 254 (7.1%) |
| 30 to 34 Years | 333 (9.3%) | 239 (6.7%) |
| 35 to 39 Years | 139 (3.9%) | 206 (5.8%) |
| 40 to 44 Years | 127 (3.5%) | 210 (5.9%) |
| 45 to 49 Years | 218 (6.1%) | 248 (6.9%) |
| 50 to 54 Years | 239 (6.7%) | 169 (4.7%) |
| 55 to 59 Years | 271 (7.6%) | 244 (6.8%) |
| 60 to 64 Years | 304 (8.5%) | 272 (7.6%) |
| 65 to 69 Years | 163 (4.5%) | 193 (5.4%) |
| 70 to 74 Years | 148 (4.1%) | 143 (4.0%) |
| 75 to 79 Years | 162 (4.5%) | 147 (4.1%) |
| 80 to 84 Years | 131 (3.6%) | 122 (3.4%) |
| 85 Years and over | 34 (0.9%) | 56 (1.6%) |
| Total | 3,586 (100.0%) | 3,578 (100.0%) |
Families and Households in Lake Lorraine
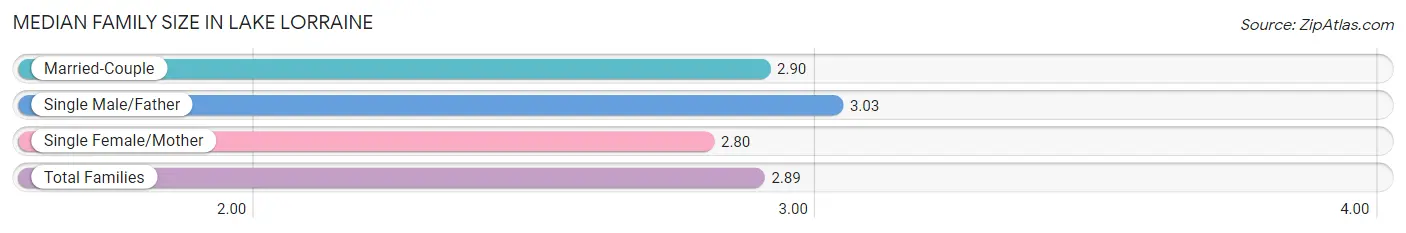
Median Family Size in Lake Lorraine
The median family size in Lake Lorraine is 2.89 persons per family, with single male/father families (116 | 5.8%) accounting for the largest median family size of 3.03 persons per family. On the other hand, single female/mother families (375 | 18.6%) represent the smallest median family size with 2.80 persons per family.
| Family Type | # Families | Family Size |
| Married-Couple | 1,522 (75.6%) | 2.90 |
| Single Male/Father | 116 (5.8%) | 3.03 |
| Single Female/Mother | 375 (18.6%) | 2.80 |
| Total Families | 2,013 (100.0%) | 2.89 |
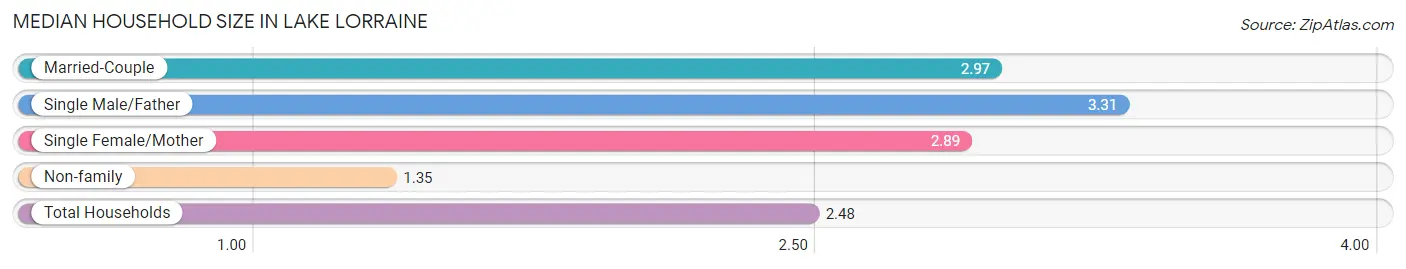
Median Household Size in Lake Lorraine
The median household size in Lake Lorraine is 2.48 persons per household, with single male/father households (116 | 4.0%) accounting for the largest median household size of 3.31 persons per household. non-family households (877 | 30.3%) represent the smallest median household size with 1.35 persons per household.
| Household Type | # Households | Household Size |
| Married-Couple | 1,522 (52.7%) | 2.97 |
| Single Male/Father | 116 (4.0%) | 3.31 |
| Single Female/Mother | 375 (13.0%) | 2.89 |
| Non-family | 877 (30.3%) | 1.35 |
| Total Households | 2,890 (100.0%) | 2.48 |
Household Size by Marriage Status in Lake Lorraine
Out of a total of 2,890 households in Lake Lorraine, 2,013 (69.7%) are family households, while 877 (30.3%) are nonfamily households. The most numerous type of family households are 2-person households, comprising 969, and the most common type of nonfamily households are 1-person households, comprising 658.
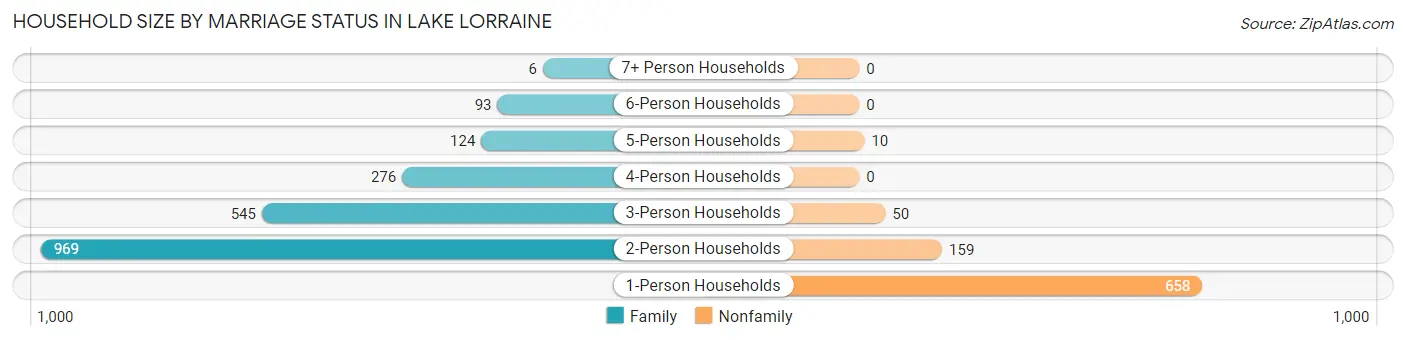
| Household Size | Family Households | Nonfamily Households |
| 1-Person Households | - | 658 (22.8%) |
| 2-Person Households | 969 (33.5%) | 159 (5.5%) |
| 3-Person Households | 545 (18.9%) | 50 (1.7%) |
| 4-Person Households | 276 (9.6%) | 0 (0.0%) |
| 5-Person Households | 124 (4.3%) | 10 (0.4%) |
| 6-Person Households | 93 (3.2%) | 0 (0.0%) |
| 7+ Person Households | 6 (0.2%) | 0 (0.0%) |
| Total | 2,013 (69.7%) | 877 (30.3%) |
Female Fertility in Lake Lorraine
Fertility by Age in Lake Lorraine
Average fertility rate in Lake Lorraine is 35.0 births per 1,000 women. Women in the age bracket of 20 to 34 years have the highest fertility rate with 70.0 births per 1,000 women. Women in the age bracket of 20 to 34 years acount for 100.0% of all women with births.
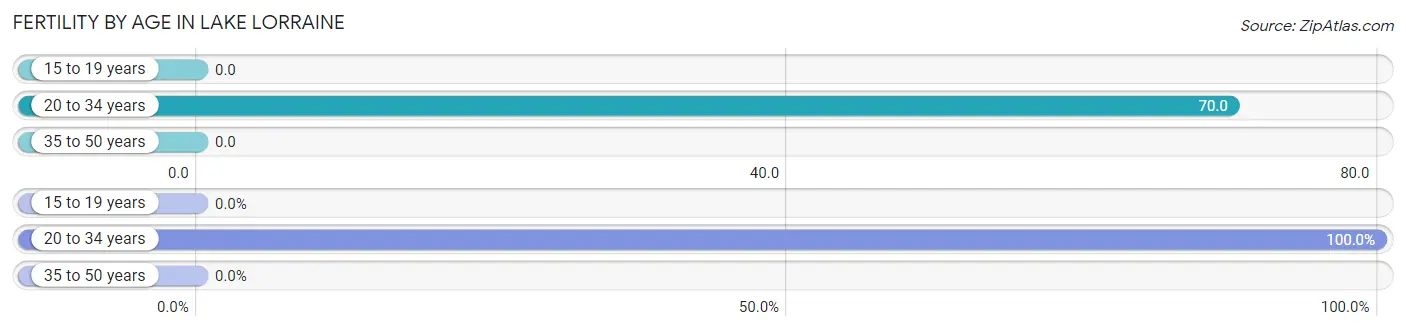
| Age Bracket | Women with Births | Births / 1,000 Women |
| 15 to 19 years | 0 (0.0%) | 0.0 |
| 20 to 34 years | 56 (100.0%) | 70.0 |
| 35 to 50 years | 0 (0.0%) | 0.0 |
| Total | 56 (100.0%) | 35.0 |
Fertility by Age by Marriage Status in Lake Lorraine
55.4% of women with births (56) in Lake Lorraine are married. The highest percentage of unmarried women with births falls into 20 to 34 years age bracket with 44.6% of them unmarried at the time of birth, while the lowest percentage of unmarried women with births belong to 20 to 34 years age bracket with 44.6% of them unmarried.
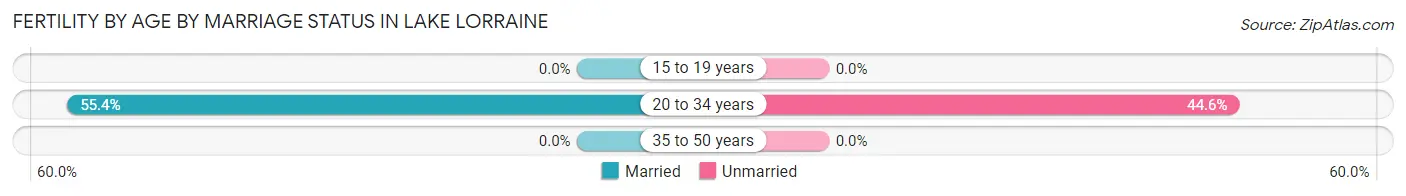
| Age Bracket | Married | Unmarried |
| 15 to 19 years | 0 (0.0%) | 0 (0.0%) |
| 20 to 34 years | 31 (55.4%) | 25 (44.6%) |
| 35 to 50 years | 0 (0.0%) | 0 (0.0%) |
| Total | 31 (55.4%) | 25 (44.6%) |
Fertility by Education in Lake Lorraine
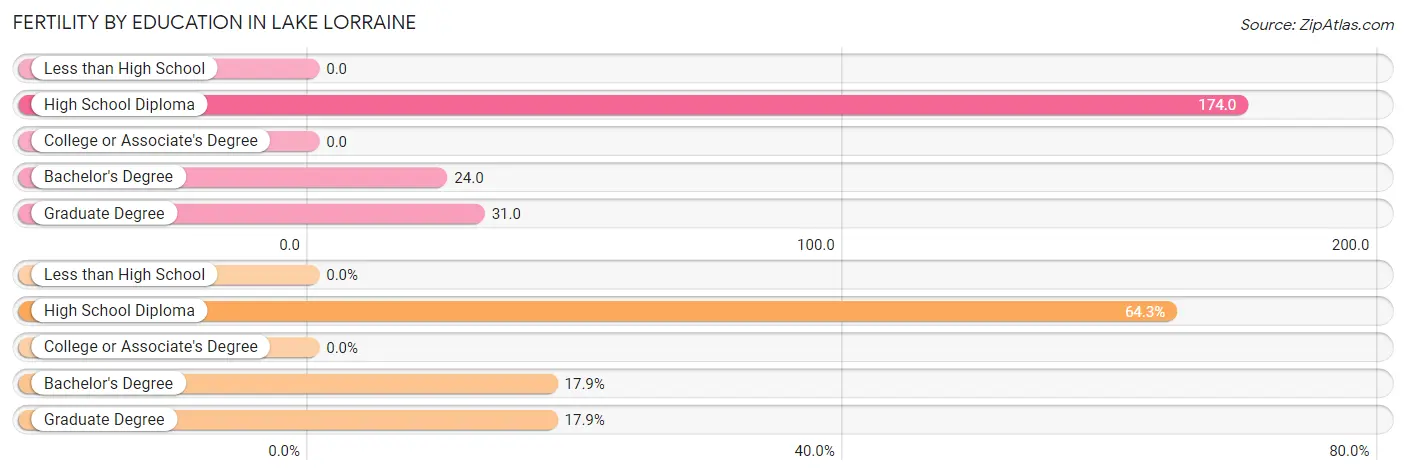
| Educational Attainment | Women with Births | Births / 1,000 Women |
| Less than High School | 0 (0.0%) | 0.0 |
| High School Diploma | 36 (64.3%) | 174.0 |
| College or Associate's Degree | 0 (0.0%) | 0.0 |
| Bachelor's Degree | 10 (17.9%) | 24.0 |
| Graduate Degree | 10 (17.9%) | 31.0 |
| Total | 56 (100.0%) | 35.0 |
Fertility by Education by Marriage Status in Lake Lorraine
44.6% of women with births in Lake Lorraine are unmarried. Women with the educational attainment of bachelor's degree are most likely to be married with 100.0% of them married at childbirth, while women with the educational attainment of high school diploma are least likely to be married with 69.4% of them unmarried at childbirth.
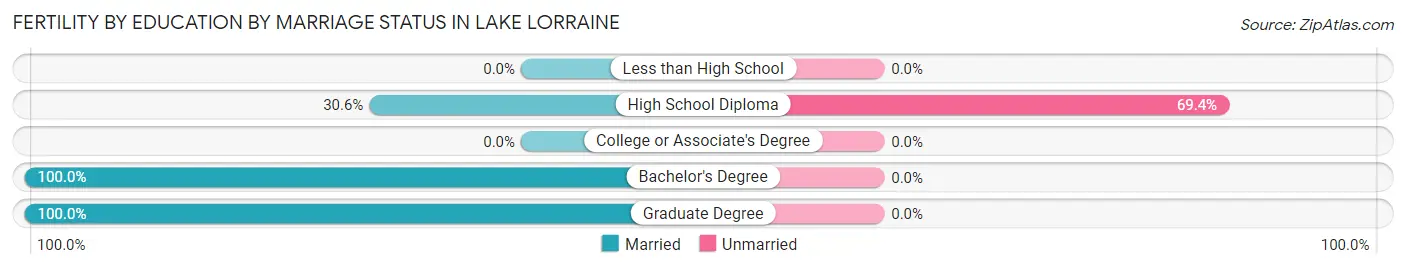
| Educational Attainment | Married | Unmarried |
| Less than High School | 0 (0.0%) | 0 (0.0%) |
| High School Diploma | 11 (30.6%) | 25 (69.4%) |
| College or Associate's Degree | 0 (0.0%) | 0 (0.0%) |
| Bachelor's Degree | 10 (100.0%) | 0 (0.0%) |
| Graduate Degree | 10 (100.0%) | 0 (0.0%) |
| Total | 31 (55.4%) | 25 (44.6%) |
Employment Characteristics in Lake Lorraine
Employment by Class of Employer in Lake Lorraine
Among the 3,751 employed individuals in Lake Lorraine, private company employees (2,106 | 56.1%), federal government employees (731 | 19.5%), and state government employees (279 | 7.4%) make up the most common classes of employment.
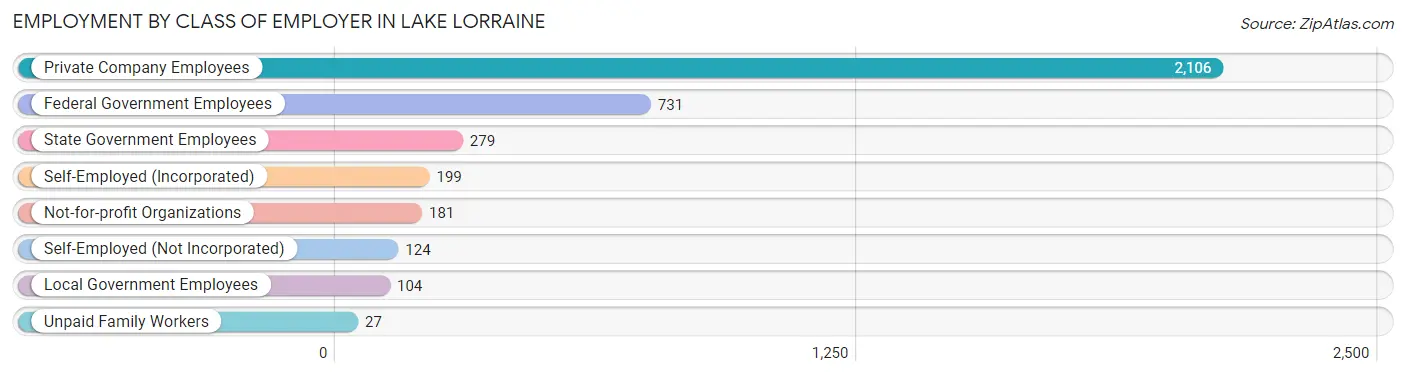
| Employer Class | # Employees | % Employees |
| Private Company Employees | 2,106 | 56.1% |
| Self-Employed (Incorporated) | 199 | 5.3% |
| Self-Employed (Not Incorporated) | 124 | 3.3% |
| Not-for-profit Organizations | 181 | 4.8% |
| Local Government Employees | 104 | 2.8% |
| State Government Employees | 279 | 7.4% |
| Federal Government Employees | 731 | 19.5% |
| Unpaid Family Workers | 27 | 0.7% |
| Total | 3,751 | 100.0% |
Employment Status by Age in Lake Lorraine
According to the labor force statistics for Lake Lorraine, out of the total population over 16 years of age (5,821), 65.9% or 3,836 individuals are in the labor force, with 1.7% or 65 of them unemployed. The age group with the highest labor force participation rate is 45 to 54 years, with 89.9% or 786 individuals in the labor force. Within the labor force, the 16 to 19 years age range has the highest percentage of unemployed individuals, with 8.2% or 11 of them being unemployed.
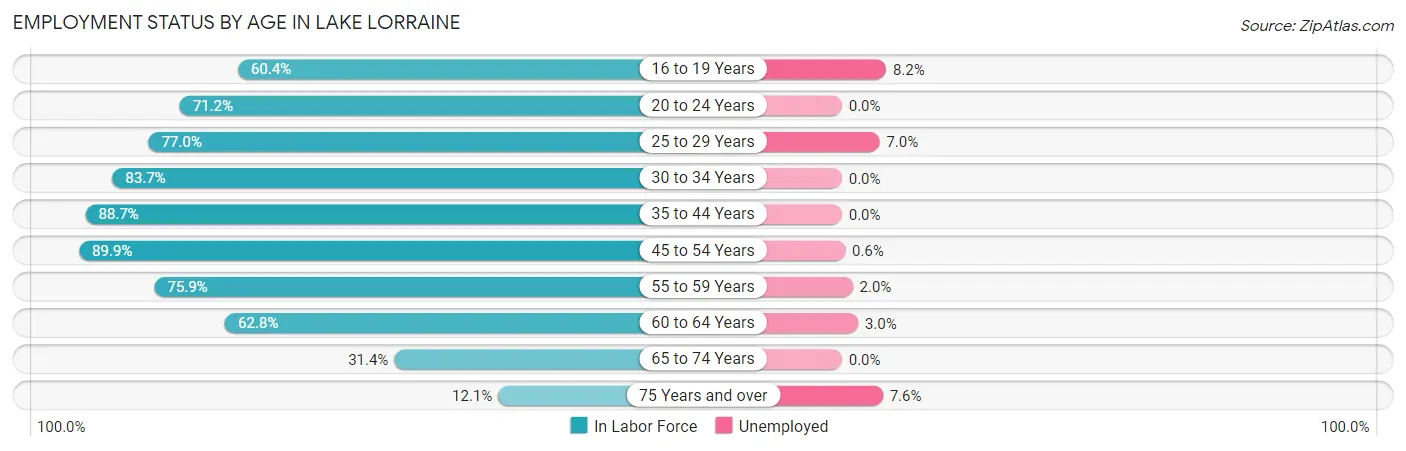
| Age Bracket | In Labor Force | Unemployed |
| 16 to 19 Years | 134 (60.4%) | 11 (8.2%) |
| 20 to 24 Years | 454 (71.2%) | 0 (0.0%) |
| 25 to 29 Years | 341 (77.0%) | 24 (7.0%) |
| 30 to 34 Years | 479 (83.7%) | 0 (0.0%) |
| 35 to 44 Years | 605 (88.7%) | 0 (0.0%) |
| 45 to 54 Years | 786 (89.9%) | 5 (0.6%) |
| 55 to 59 Years | 391 (75.9%) | 8 (2.0%) |
| 60 to 64 Years | 362 (62.8%) | 11 (3.0%) |
| 65 to 74 Years | 203 (31.4%) | 0 (0.0%) |
| 75 Years and over | 79 (12.1%) | 6 (7.6%) |
| Total | 3,836 (65.9%) | 65 (1.7%) |
Employment Status by Educational Attainment in Lake Lorraine
According to labor force statistics for Lake Lorraine, 80.9% of individuals (2,963) out of the total population between 25 and 64 years of age (3,662) are in the labor force, with 1.6% or 47 of them being unemployed. The group with the highest labor force participation rate are those with the educational attainment of bachelor's degree or higher, with 90.5% or 1,660 individuals in the labor force. Within the labor force, individuals with less than high school education have the highest percentage of unemployment, with 6.3% or 8 of them being unemployed.
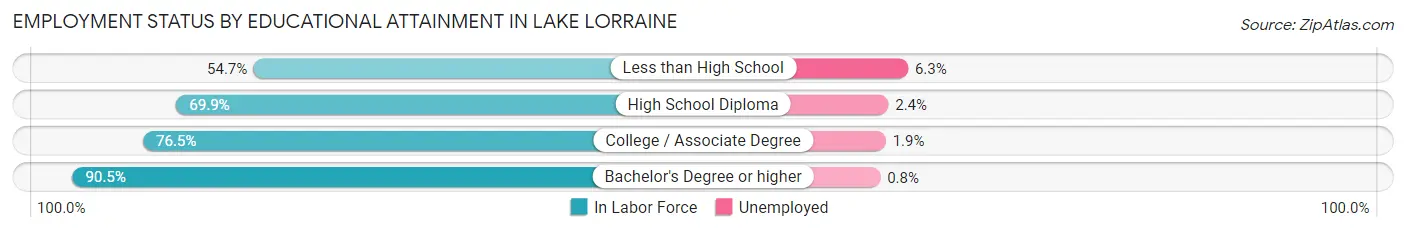
| Educational Attainment | In Labor Force | Unemployed |
| Less than High School | 127 (54.7%) | 15 (6.3%) |
| High School Diploma | 456 (69.9%) | 16 (2.4%) |
| College / Associate Degree | 722 (76.5%) | 18 (1.9%) |
| Bachelor's Degree or higher | 1,660 (90.5%) | 15 (0.8%) |
| Total | 2,963 (80.9%) | 59 (1.6%) |
Employment Occupations by Sex in Lake Lorraine
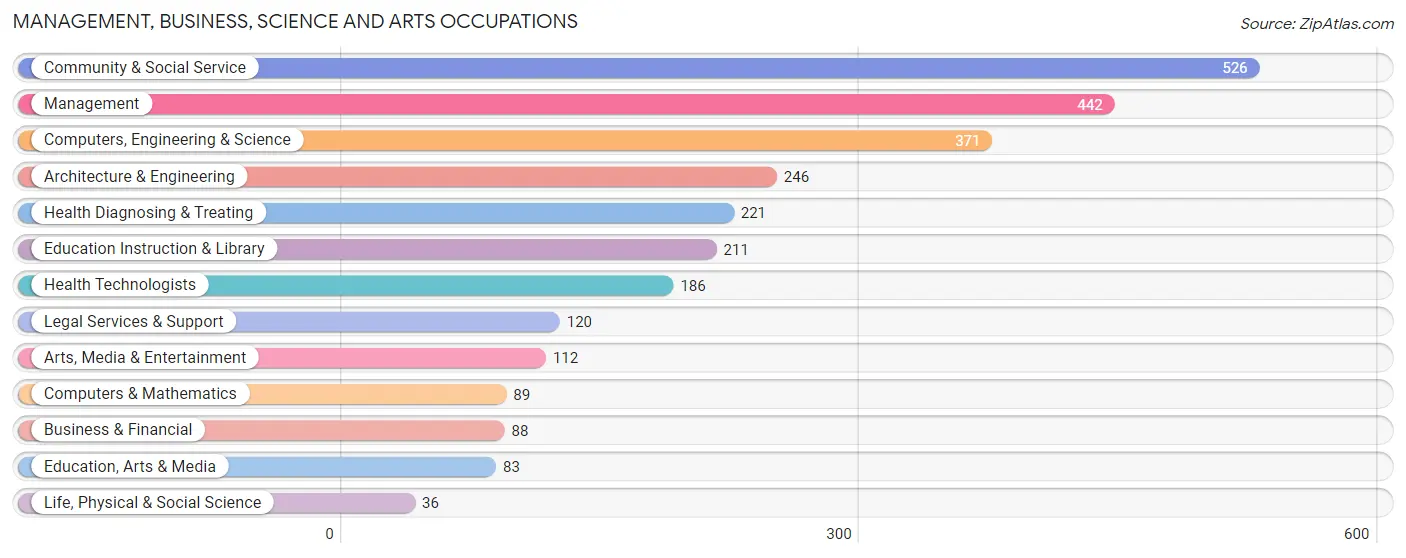
Management, Business, Science and Arts Occupations
The most common Management, Business, Science and Arts occupations in Lake Lorraine are Community & Social Service (526 | 15.0%), Management (442 | 12.6%), Computers, Engineering & Science (371 | 10.6%), Architecture & Engineering (246 | 7.0%), and Health Diagnosing & Treating (221 | 6.3%).
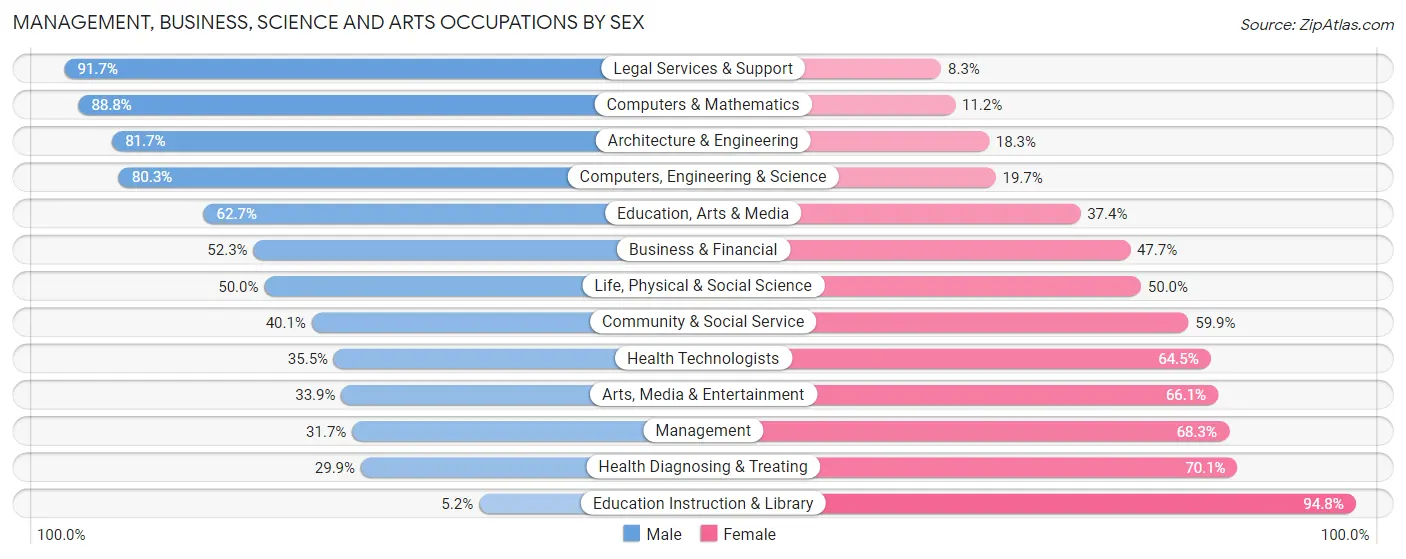
Management, Business, Science and Arts Occupations by Sex
Within the Management, Business, Science and Arts occupations in Lake Lorraine, the most male-oriented occupations are Legal Services & Support (91.7%), Computers & Mathematics (88.8%), and Architecture & Engineering (81.7%), while the most female-oriented occupations are Education Instruction & Library (94.8%), Health Diagnosing & Treating (70.1%), and Management (68.3%).
| Occupation | Male | Female |
| Management | 140 (31.7%) | 302 (68.3%) |
| Business & Financial | 46 (52.3%) | 42 (47.7%) |
| Computers, Engineering & Science | 298 (80.3%) | 73 (19.7%) |
| Computers & Mathematics | 79 (88.8%) | 10 (11.2%) |
| Architecture & Engineering | 201 (81.7%) | 45 (18.3%) |
| Life, Physical & Social Science | 18 (50.0%) | 18 (50.0%) |
| Community & Social Service | 211 (40.1%) | 315 (59.9%) |
| Education, Arts & Media | 52 (62.6%) | 31 (37.3%) |
| Legal Services & Support | 110 (91.7%) | 10 (8.3%) |
| Education Instruction & Library | 11 (5.2%) | 200 (94.8%) |
| Arts, Media & Entertainment | 38 (33.9%) | 74 (66.1%) |
| Health Diagnosing & Treating | 66 (29.9%) | 155 (70.1%) |
| Health Technologists | 66 (35.5%) | 120 (64.5%) |
| Total (Category) | 761 (46.2%) | 887 (53.8%) |
| Total (Overall) | 1,680 (47.9%) | 1,824 (52.0%) |
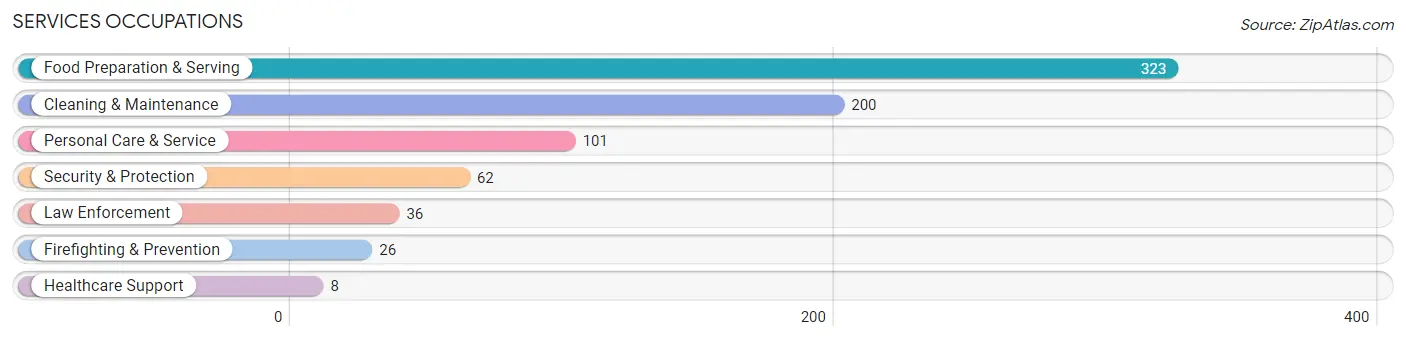
Services Occupations
The most common Services occupations in Lake Lorraine are Food Preparation & Serving (323 | 9.2%), Cleaning & Maintenance (200 | 5.7%), Personal Care & Service (101 | 2.9%), Security & Protection (62 | 1.8%), and Law Enforcement (36 | 1.0%).
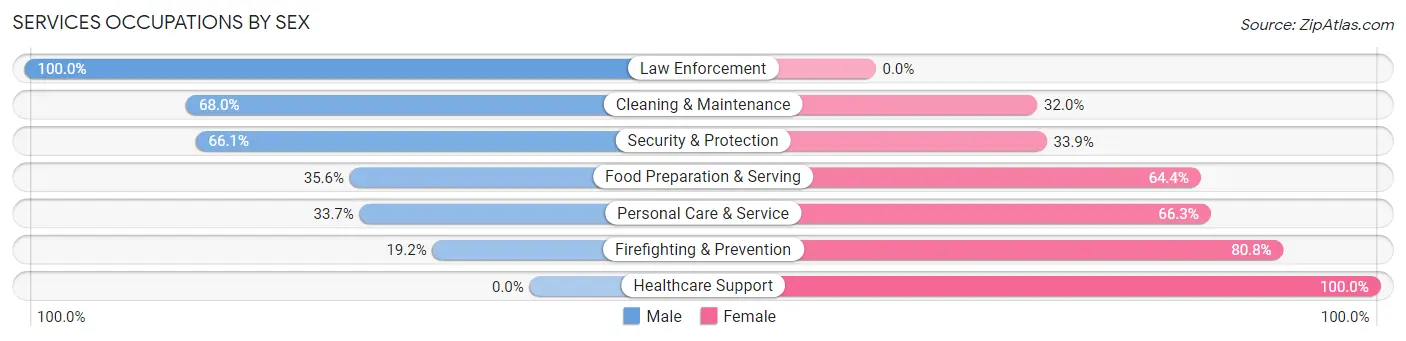
Services Occupations by Sex
Within the Services occupations in Lake Lorraine, the most male-oriented occupations are Law Enforcement (100.0%), Cleaning & Maintenance (68.0%), and Security & Protection (66.1%), while the most female-oriented occupations are Healthcare Support (100.0%), Firefighting & Prevention (80.8%), and Personal Care & Service (66.3%).
| Occupation | Male | Female |
| Healthcare Support | 0 (0.0%) | 8 (100.0%) |
| Security & Protection | 41 (66.1%) | 21 (33.9%) |
| Firefighting & Prevention | 5 (19.2%) | 21 (80.8%) |
| Law Enforcement | 36 (100.0%) | 0 (0.0%) |
| Food Preparation & Serving | 115 (35.6%) | 208 (64.4%) |
| Cleaning & Maintenance | 136 (68.0%) | 64 (32.0%) |
| Personal Care & Service | 34 (33.7%) | 67 (66.3%) |
| Total (Category) | 326 (47.0%) | 368 (53.0%) |
| Total (Overall) | 1,680 (47.9%) | 1,824 (52.0%) |
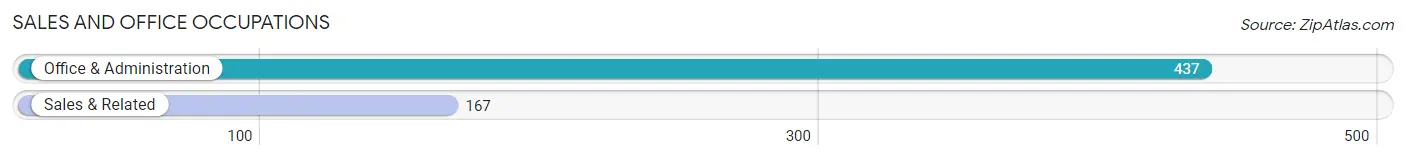
Sales and Office Occupations
The most common Sales and Office occupations in Lake Lorraine are Office & Administration (437 | 12.5%), and Sales & Related (167 | 4.8%).
Sales and Office Occupations by Sex
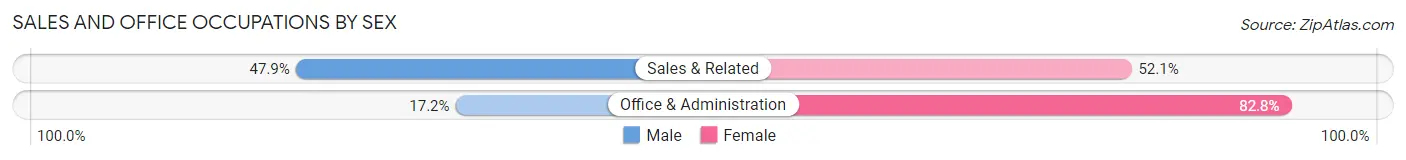
| Occupation | Male | Female |
| Sales & Related | 80 (47.9%) | 87 (52.1%) |
| Office & Administration | 75 (17.2%) | 362 (82.8%) |
| Total (Category) | 155 (25.7%) | 449 (74.3%) |
| Total (Overall) | 1,680 (47.9%) | 1,824 (52.0%) |
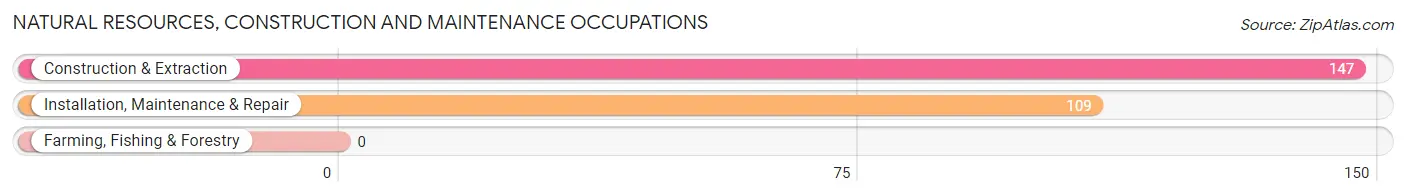
Natural Resources, Construction and Maintenance Occupations
The most common Natural Resources, Construction and Maintenance occupations in Lake Lorraine are Construction & Extraction (147 | 4.2%), and Installation, Maintenance & Repair (109 | 3.1%).
Natural Resources, Construction and Maintenance Occupations by Sex
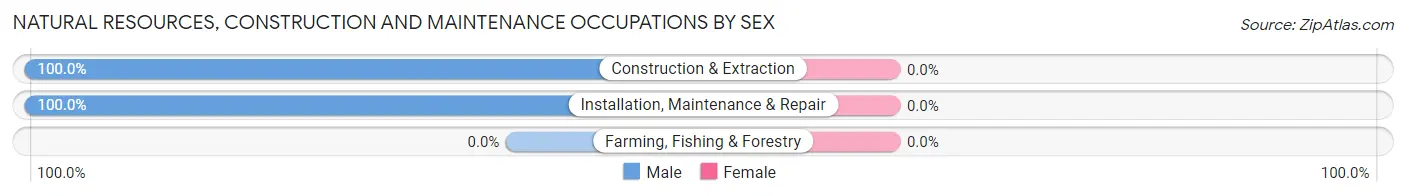
| Occupation | Male | Female |
| Farming, Fishing & Forestry | 0 (0.0%) | 0 (0.0%) |
| Construction & Extraction | 147 (100.0%) | 0 (0.0%) |
| Installation, Maintenance & Repair | 109 (100.0%) | 0 (0.0%) |
| Total (Category) | 256 (100.0%) | 0 (0.0%) |
| Total (Overall) | 1,680 (47.9%) | 1,824 (52.0%) |
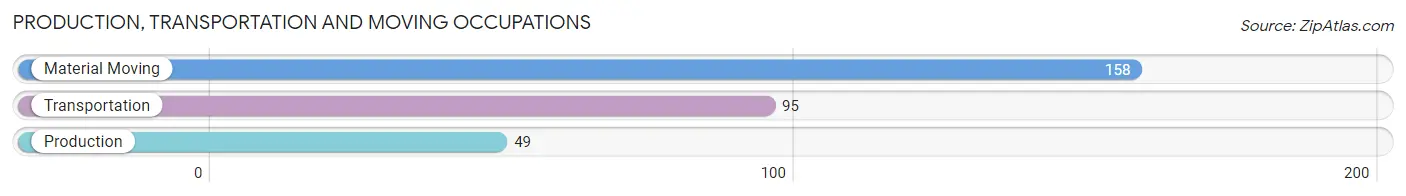
Production, Transportation and Moving Occupations
The most common Production, Transportation and Moving occupations in Lake Lorraine are Material Moving (158 | 4.5%), Transportation (95 | 2.7%), and Production (49 | 1.4%).
Production, Transportation and Moving Occupations by Sex
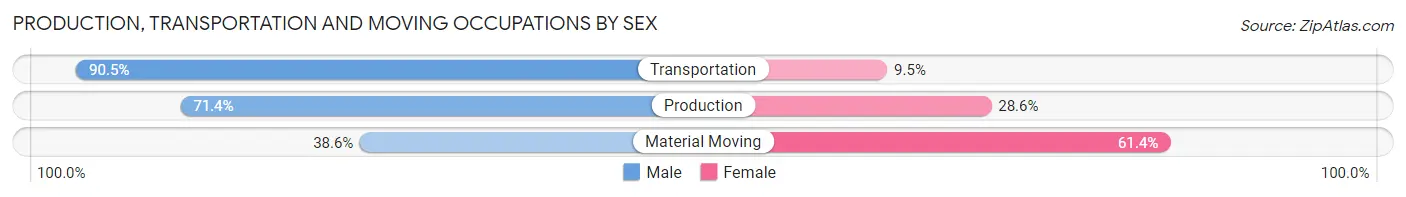
| Occupation | Male | Female |
| Production | 35 (71.4%) | 14 (28.6%) |
| Transportation | 86 (90.5%) | 9 (9.5%) |
| Material Moving | 61 (38.6%) | 97 (61.4%) |
| Total (Category) | 182 (60.3%) | 120 (39.7%) |
| Total (Overall) | 1,680 (47.9%) | 1,824 (52.0%) |
Employment Industries by Sex in Lake Lorraine
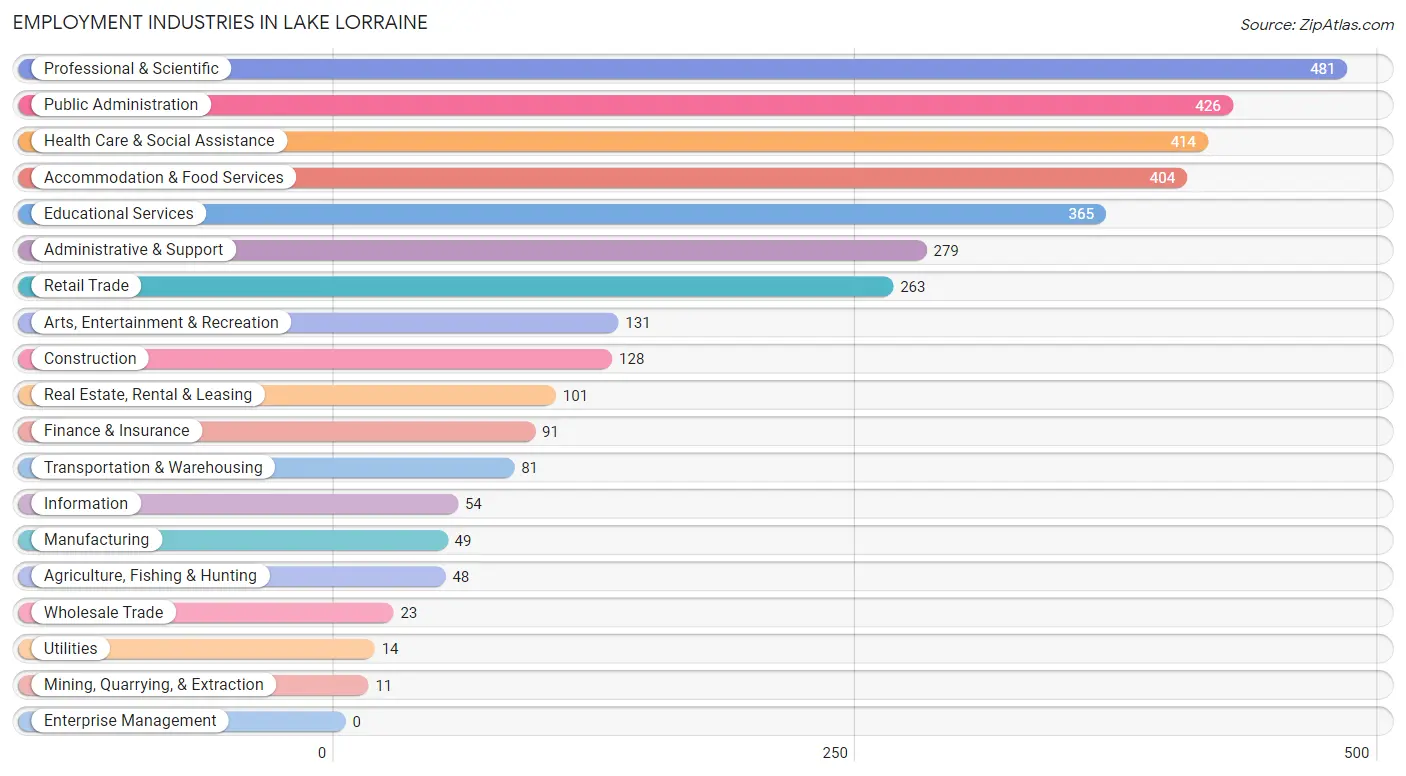
Employment Industries in Lake Lorraine
The major employment industries in Lake Lorraine include Professional & Scientific (481 | 13.7%), Public Administration (426 | 12.2%), Health Care & Social Assistance (414 | 11.8%), Accommodation & Food Services (404 | 11.5%), and Educational Services (365 | 10.4%).
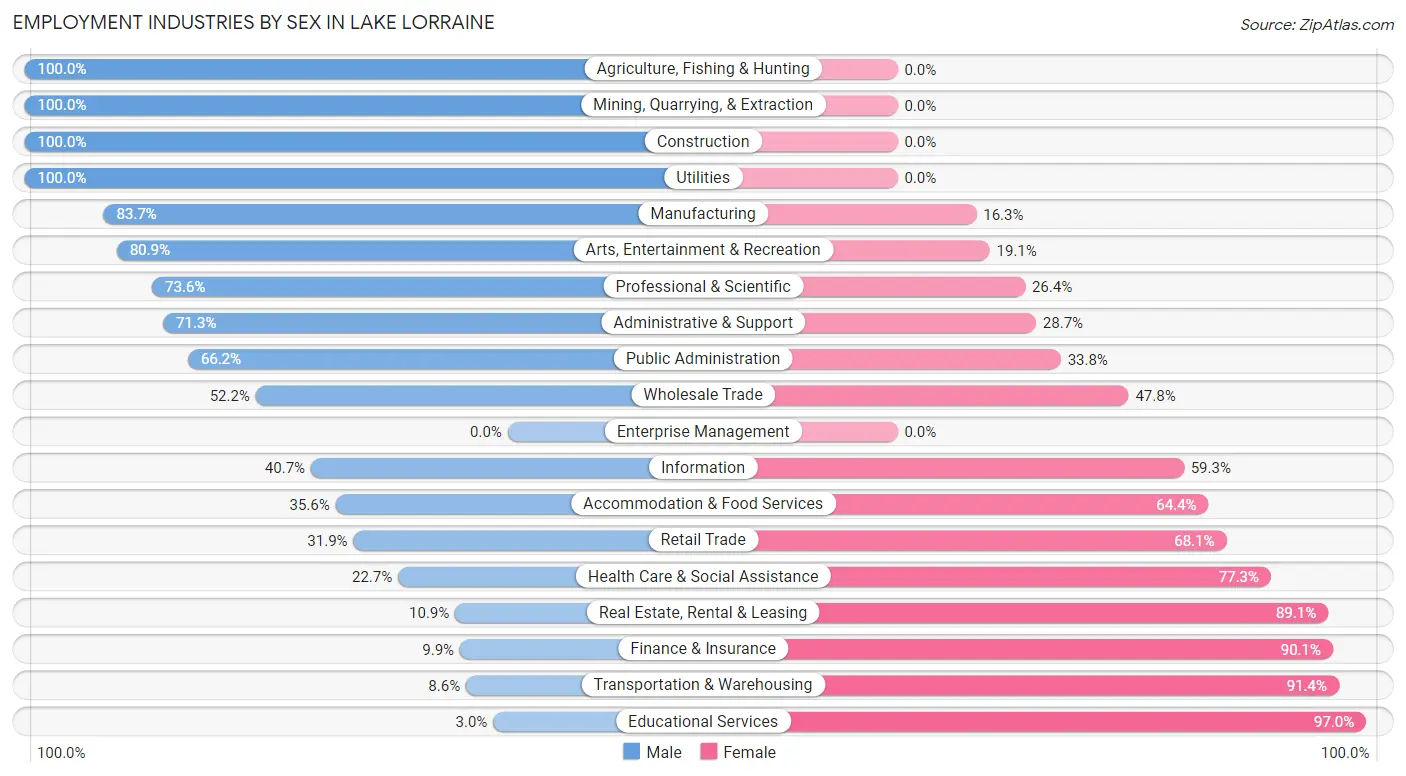
Employment Industries by Sex in Lake Lorraine
The Lake Lorraine industries that see more men than women are Agriculture, Fishing & Hunting (100.0%), Mining, Quarrying, & Extraction (100.0%), and Construction (100.0%), whereas the industries that tend to have a higher number of women are Educational Services (97.0%), Transportation & Warehousing (91.4%), and Finance & Insurance (90.1%).
| Industry | Male | Female |
| Agriculture, Fishing & Hunting | 48 (100.0%) | 0 (0.0%) |
| Mining, Quarrying, & Extraction | 11 (100.0%) | 0 (0.0%) |
| Construction | 128 (100.0%) | 0 (0.0%) |
| Manufacturing | 41 (83.7%) | 8 (16.3%) |
| Wholesale Trade | 12 (52.2%) | 11 (47.8%) |
| Retail Trade | 84 (31.9%) | 179 (68.1%) |
| Transportation & Warehousing | 7 (8.6%) | 74 (91.4%) |
| Utilities | 14 (100.0%) | 0 (0.0%) |
| Information | 22 (40.7%) | 32 (59.3%) |
| Finance & Insurance | 9 (9.9%) | 82 (90.1%) |
| Real Estate, Rental & Leasing | 11 (10.9%) | 90 (89.1%) |
| Professional & Scientific | 354 (73.6%) | 127 (26.4%) |
| Enterprise Management | 0 (0.0%) | 0 (0.0%) |
| Administrative & Support | 199 (71.3%) | 80 (28.7%) |
| Educational Services | 11 (3.0%) | 354 (97.0%) |
| Health Care & Social Assistance | 94 (22.7%) | 320 (77.3%) |
| Arts, Entertainment & Recreation | 106 (80.9%) | 25 (19.1%) |
| Accommodation & Food Services | 144 (35.6%) | 260 (64.4%) |
| Public Administration | 282 (66.2%) | 144 (33.8%) |
| Total | 1,680 (47.9%) | 1,824 (52.0%) |
Education in Lake Lorraine
School Enrollment in Lake Lorraine
The most common levels of schooling among the 1,728 students in Lake Lorraine are elementary school (422 | 24.4%), college / undergraduate (316 | 18.3%), and middle school (297 | 17.2%).
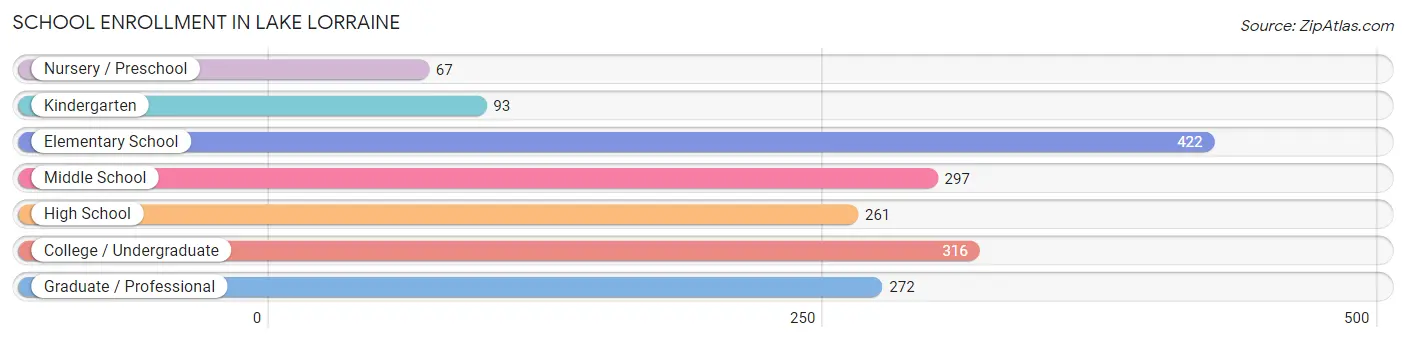
| School Level | # Students | % Students |
| Nursery / Preschool | 67 | 3.9% |
| Kindergarten | 93 | 5.4% |
| Elementary School | 422 | 24.4% |
| Middle School | 297 | 17.2% |
| High School | 261 | 15.1% |
| College / Undergraduate | 316 | 18.3% |
| Graduate / Professional | 272 | 15.7% |
| Total | 1,728 | 100.0% |
School Enrollment by Age by Funding Source in Lake Lorraine
Out of a total of 1,728 students who are enrolled in schools in Lake Lorraine, 325 (18.8%) attend a private institution, while the remaining 1,403 (81.2%) are enrolled in public schools. The age group of 35 years and over has the highest likelihood of being enrolled in private schools, with 46 (27.7% in the age bracket) enrolled. Conversely, the age group of 15 to 17 year olds has the lowest likelihood of being enrolled in a private school, with 203 (100.0% in the age bracket) attending a public institution.
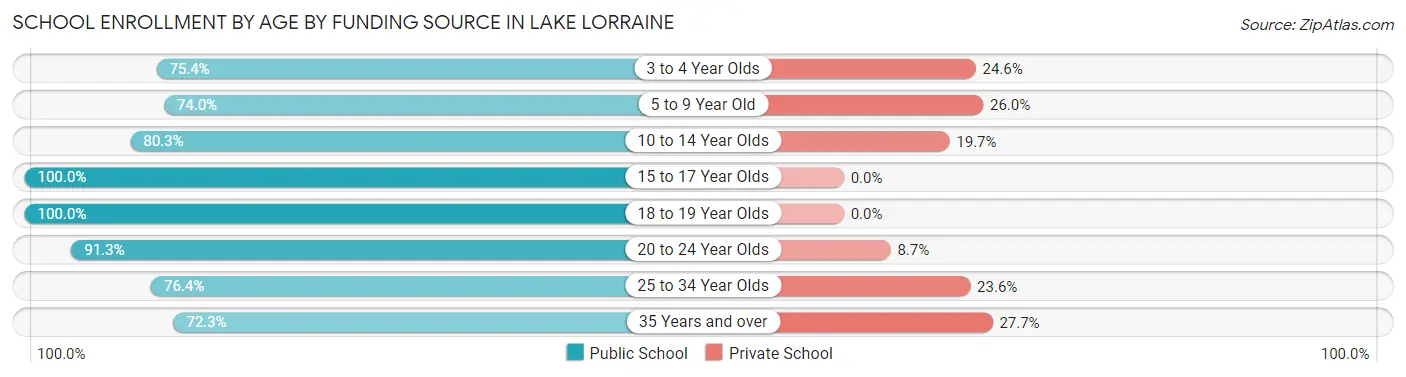
| Age Bracket | Public School | Private School |
| 3 to 4 Year Olds | 43 (75.4%) | 14 (24.6%) |
| 5 to 9 Year Old | 365 (74.0%) | 128 (26.0%) |
| 10 to 14 Year Olds | 306 (80.3%) | 75 (19.7%) |
| 15 to 17 Year Olds | 203 (100.0%) | 0 (0.0%) |
| 18 to 19 Year Olds | 13 (100.0%) | 0 (0.0%) |
| 20 to 24 Year Olds | 220 (91.3%) | 21 (8.7%) |
| 25 to 34 Year Olds | 133 (76.4%) | 41 (23.6%) |
| 35 Years and over | 120 (72.3%) | 46 (27.7%) |
| Total | 1,403 (81.2%) | 325 (18.8%) |
Educational Attainment by Field of Study in Lake Lorraine
Engineering (442 | 17.2%), business (377 | 14.7%), education (265 | 10.3%), social sciences (217 | 8.5%), and science & technology (207 | 8.1%) are the most common fields of study among 2,564 individuals in Lake Lorraine who have obtained a bachelor's degree or higher.
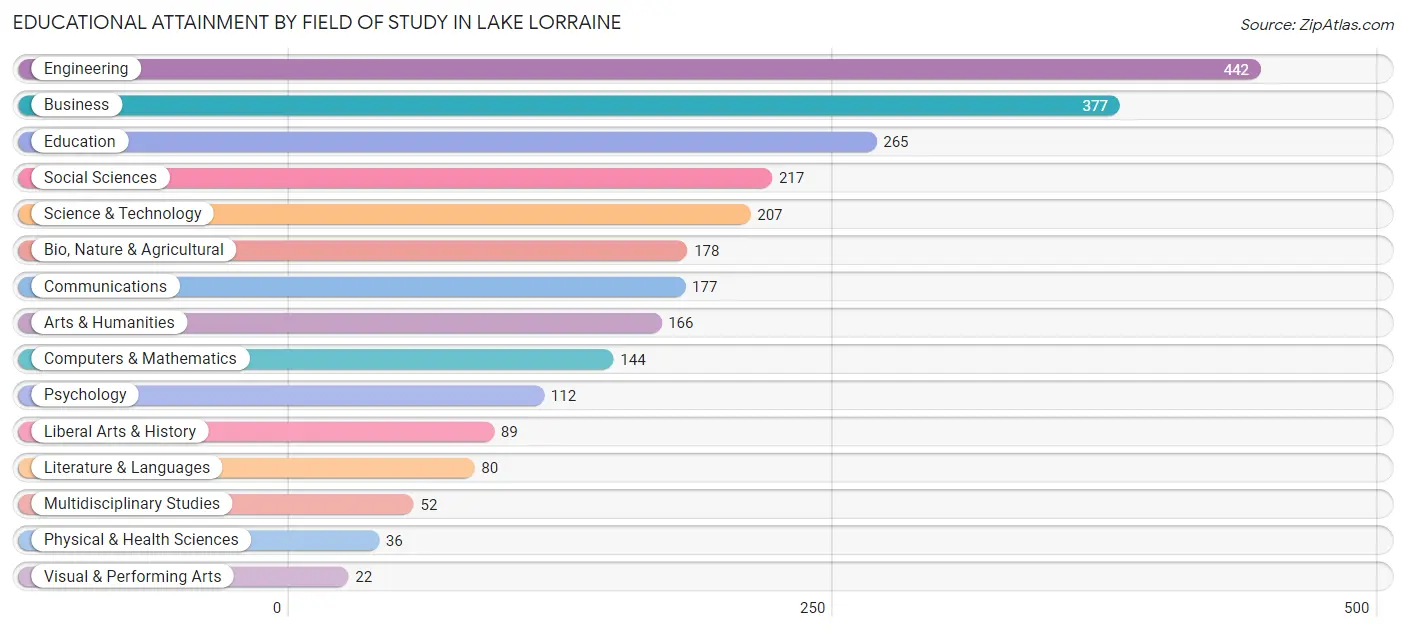
| Field of Study | # Graduates | % Graduates |
| Computers & Mathematics | 144 | 5.6% |
| Bio, Nature & Agricultural | 178 | 6.9% |
| Physical & Health Sciences | 36 | 1.4% |
| Psychology | 112 | 4.4% |
| Social Sciences | 217 | 8.5% |
| Engineering | 442 | 17.2% |
| Multidisciplinary Studies | 52 | 2.0% |
| Science & Technology | 207 | 8.1% |
| Business | 377 | 14.7% |
| Education | 265 | 10.3% |
| Literature & Languages | 80 | 3.1% |
| Liberal Arts & History | 89 | 3.5% |
| Visual & Performing Arts | 22 | 0.9% |
| Communications | 177 | 6.9% |
| Arts & Humanities | 166 | 6.5% |
| Total | 2,564 | 100.0% |
Transportation & Commute in Lake Lorraine
Vehicle Availability by Sex in Lake Lorraine
The most prevalent vehicle ownership categories in Lake Lorraine are males with 3 vehicles (723, accounting for 38.1%) and females with 3 vehicles (627, making up 39.0%).
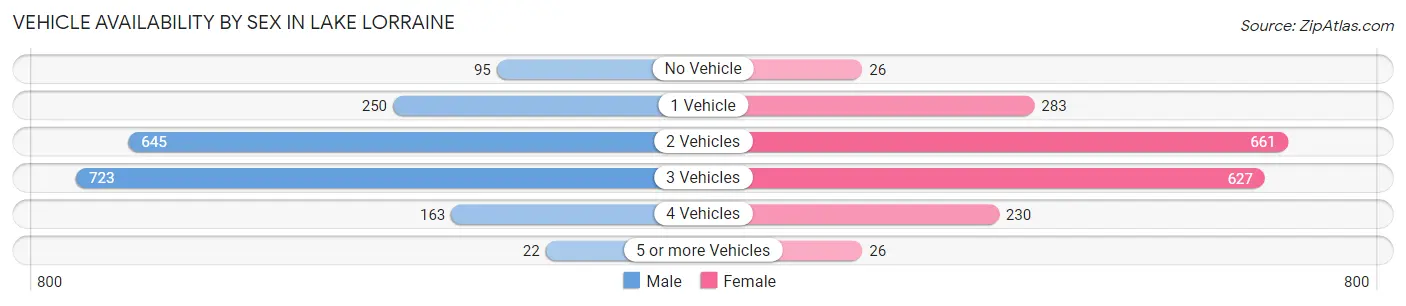
| Vehicles Available | Male | Female |
| No Vehicle | 95 (5.0%) | 26 (1.4%) |
| 1 Vehicle | 250 (13.2%) | 283 (15.3%) |
| 2 Vehicles | 645 (34.0%) | 661 (35.7%) |
| 3 Vehicles | 723 (38.1%) | 627 (33.8%) |
| 4 Vehicles | 163 (8.6%) | 230 (12.4%) |
| 5 or more Vehicles | 22 (1.2%) | 26 (1.4%) |
| Total | 1,898 (100.0%) | 1,853 (100.0%) |
Commute Time in Lake Lorraine
The most frequently occuring commute durations in Lake Lorraine are 15 to 19 minutes (906 commuters, 26.2%), 20 to 24 minutes (554 commuters, 16.0%), and 10 to 14 minutes (553 commuters, 16.0%).
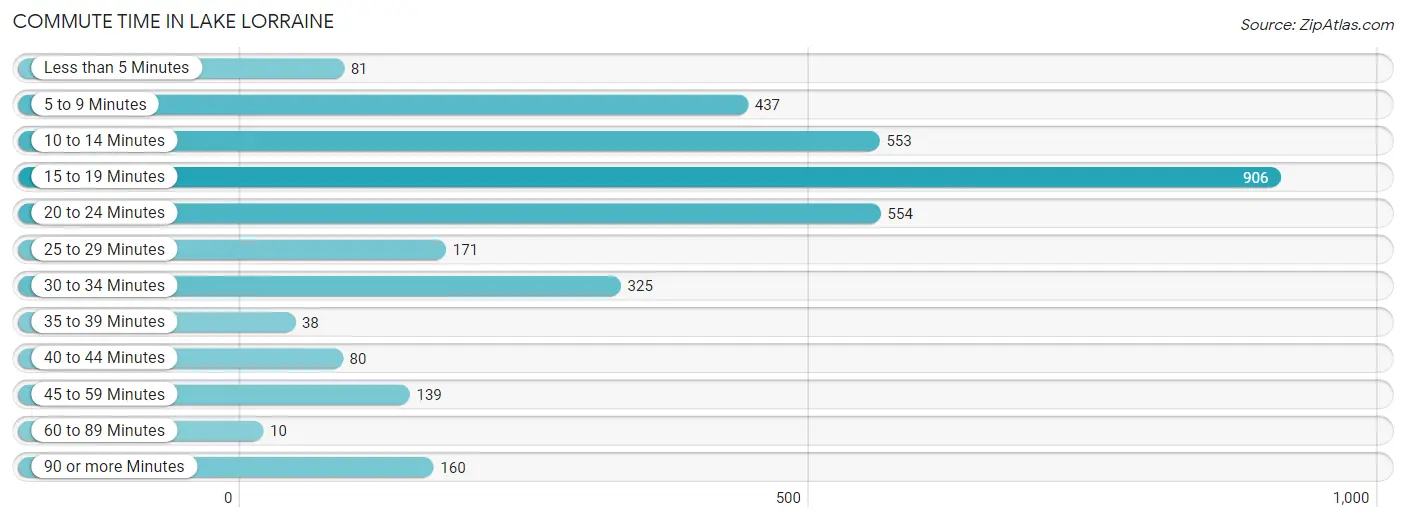
| Commute Time | # Commuters | % Commuters |
| Less than 5 Minutes | 81 | 2.4% |
| 5 to 9 Minutes | 437 | 12.7% |
| 10 to 14 Minutes | 553 | 16.0% |
| 15 to 19 Minutes | 906 | 26.2% |
| 20 to 24 Minutes | 554 | 16.0% |
| 25 to 29 Minutes | 171 | 5.0% |
| 30 to 34 Minutes | 325 | 9.4% |
| 35 to 39 Minutes | 38 | 1.1% |
| 40 to 44 Minutes | 80 | 2.3% |
| 45 to 59 Minutes | 139 | 4.0% |
| 60 to 89 Minutes | 10 | 0.3% |
| 90 or more Minutes | 160 | 4.6% |
Commute Time by Sex in Lake Lorraine
The most common commute times in Lake Lorraine are 15 to 19 minutes (389 commuters, 22.0%) for males and 15 to 19 minutes (517 commuters, 30.7%) for females.
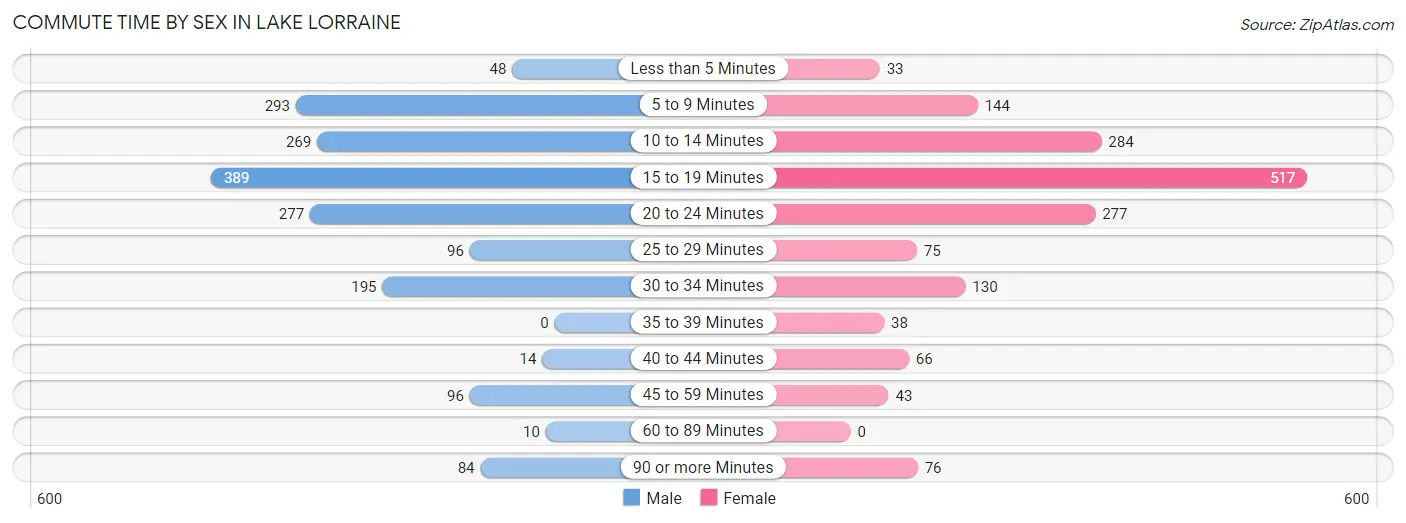
| Commute Time | Male | Female |
| Less than 5 Minutes | 48 (2.7%) | 33 (2.0%) |
| 5 to 9 Minutes | 293 (16.5%) | 144 (8.6%) |
| 10 to 14 Minutes | 269 (15.2%) | 284 (16.9%) |
| 15 to 19 Minutes | 389 (22.0%) | 517 (30.7%) |
| 20 to 24 Minutes | 277 (15.6%) | 277 (16.5%) |
| 25 to 29 Minutes | 96 (5.4%) | 75 (4.5%) |
| 30 to 34 Minutes | 195 (11.0%) | 130 (7.7%) |
| 35 to 39 Minutes | 0 (0.0%) | 38 (2.3%) |
| 40 to 44 Minutes | 14 (0.8%) | 66 (3.9%) |
| 45 to 59 Minutes | 96 (5.4%) | 43 (2.5%) |
| 60 to 89 Minutes | 10 (0.6%) | 0 (0.0%) |
| 90 or more Minutes | 84 (4.7%) | 76 (4.5%) |
Time of Departure to Work by Sex in Lake Lorraine
The most frequent times of departure to work in Lake Lorraine are 6:00 AM to 6:29 AM (342, 19.3%) for males and 7:00 AM to 7:29 AM (295, 17.5%) for females.
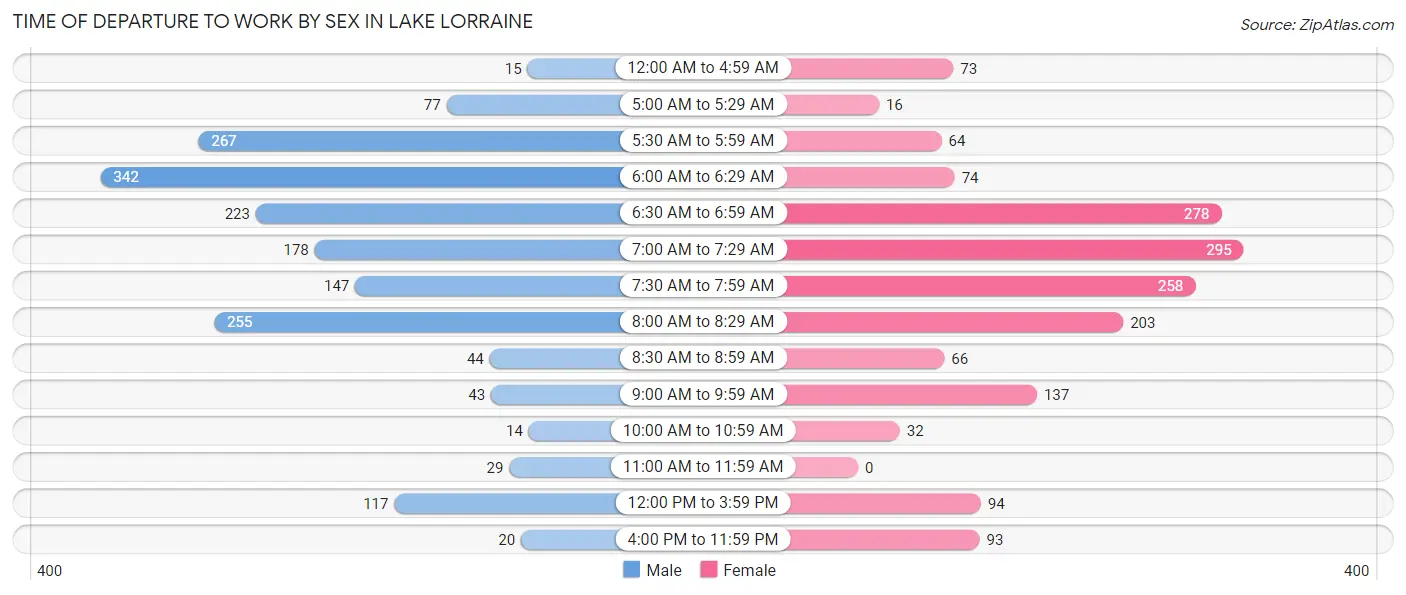
| Time of Departure | Male | Female |
| 12:00 AM to 4:59 AM | 15 (0.9%) | 73 (4.3%) |
| 5:00 AM to 5:29 AM | 77 (4.3%) | 16 (0.9%) |
| 5:30 AM to 5:59 AM | 267 (15.1%) | 64 (3.8%) |
| 6:00 AM to 6:29 AM | 342 (19.3%) | 74 (4.4%) |
| 6:30 AM to 6:59 AM | 223 (12.6%) | 278 (16.5%) |
| 7:00 AM to 7:29 AM | 178 (10.1%) | 295 (17.5%) |
| 7:30 AM to 7:59 AM | 147 (8.3%) | 258 (15.3%) |
| 8:00 AM to 8:29 AM | 255 (14.4%) | 203 (12.1%) |
| 8:30 AM to 8:59 AM | 44 (2.5%) | 66 (3.9%) |
| 9:00 AM to 9:59 AM | 43 (2.4%) | 137 (8.1%) |
| 10:00 AM to 10:59 AM | 14 (0.8%) | 32 (1.9%) |
| 11:00 AM to 11:59 AM | 29 (1.6%) | 0 (0.0%) |
| 12:00 PM to 3:59 PM | 117 (6.6%) | 94 (5.6%) |
| 4:00 PM to 11:59 PM | 20 (1.1%) | 93 (5.5%) |
| Total | 1,771 (100.0%) | 1,683 (100.0%) |
Housing Occupancy in Lake Lorraine
Occupancy by Ownership in Lake Lorraine
Of the total 2,890 dwellings in Lake Lorraine, owner-occupied units account for 2,156 (74.6%), while renter-occupied units make up 734 (25.4%).
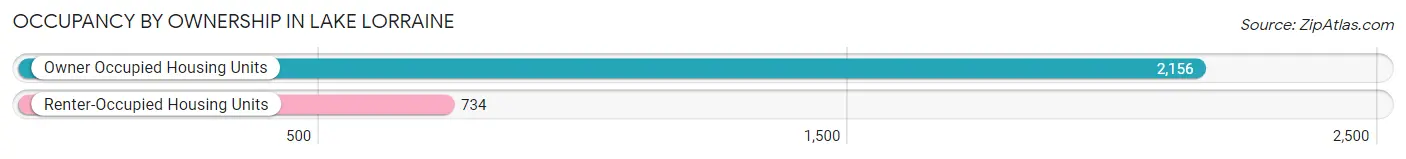
| Occupancy | # Housing Units | % Housing Units |
| Owner Occupied Housing Units | 2,156 | 74.6% |
| Renter-Occupied Housing Units | 734 | 25.4% |
| Total Occupied Housing Units | 2,890 | 100.0% |
Occupancy by Household Size in Lake Lorraine
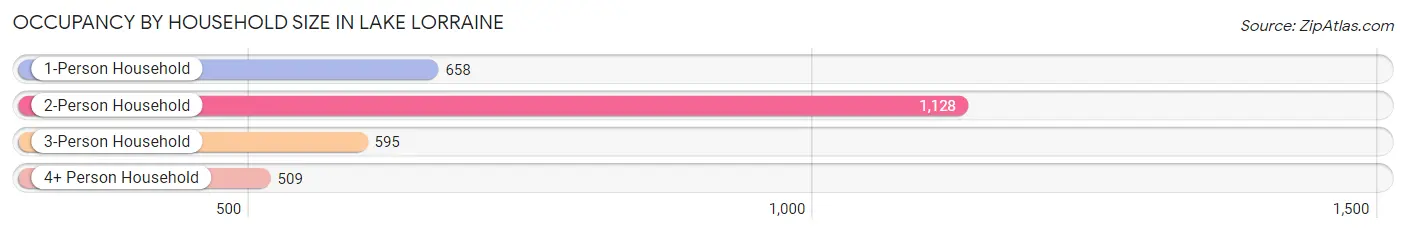
| Household Size | # Housing Units | % Housing Units |
| 1-Person Household | 658 | 22.8% |
| 2-Person Household | 1,128 | 39.0% |
| 3-Person Household | 595 | 20.6% |
| 4+ Person Household | 509 | 17.6% |
| Total Housing Units | 2,890 | 100.0% |
Occupancy by Ownership by Household Size in Lake Lorraine
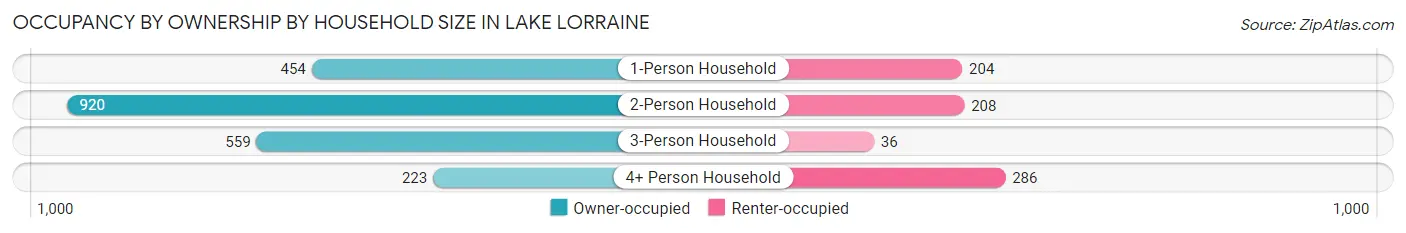
| Household Size | Owner-occupied | Renter-occupied |
| 1-Person Household | 454 (69.0%) | 204 (31.0%) |
| 2-Person Household | 920 (81.6%) | 208 (18.4%) |
| 3-Person Household | 559 (94.0%) | 36 (6.0%) |
| 4+ Person Household | 223 (43.8%) | 286 (56.2%) |
| Total Housing Units | 2,156 (74.6%) | 734 (25.4%) |
Occupancy by Educational Attainment in Lake Lorraine
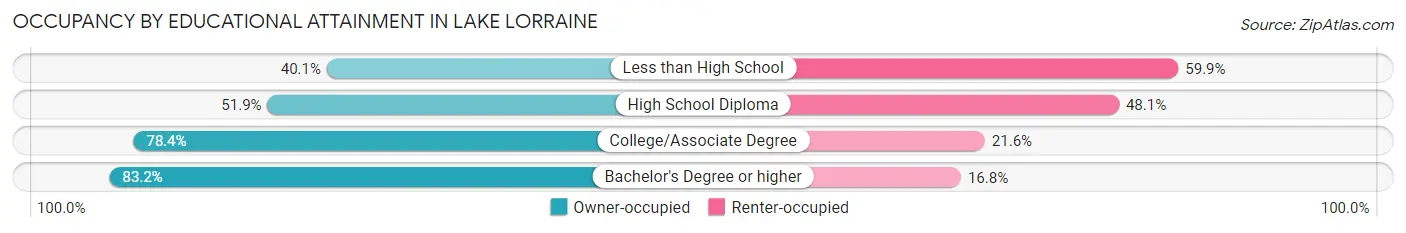
| Household Size | Owner-occupied | Renter-occupied |
| Less than High School | 85 (40.1%) | 127 (59.9%) |
| High School Diploma | 209 (51.9%) | 194 (48.1%) |
| College/Associate Degree | 502 (78.4%) | 138 (21.6%) |
| Bachelor's Degree or higher | 1,360 (83.2%) | 275 (16.8%) |
Occupancy by Age of Householder in Lake Lorraine
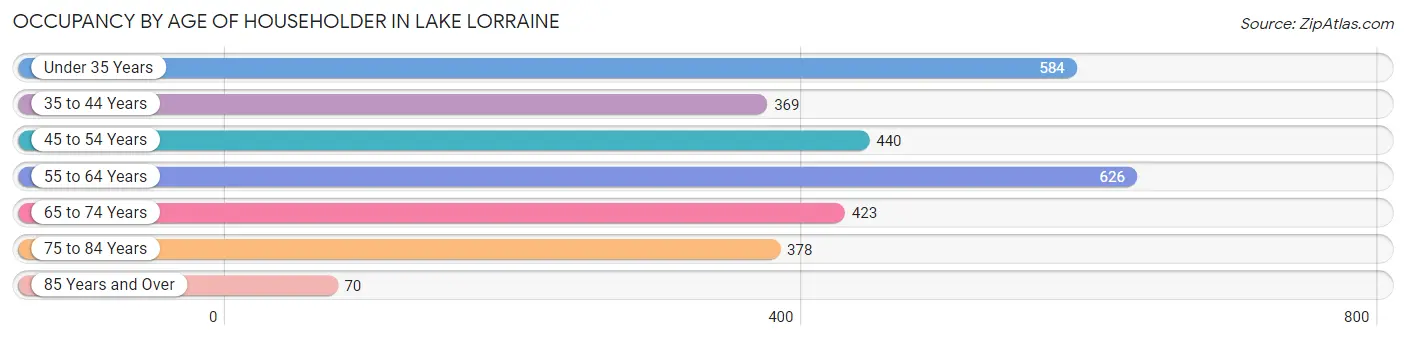
| Age Bracket | # Households | % Households |
| Under 35 Years | 584 | 20.2% |
| 35 to 44 Years | 369 | 12.8% |
| 45 to 54 Years | 440 | 15.2% |
| 55 to 64 Years | 626 | 21.7% |
| 65 to 74 Years | 423 | 14.6% |
| 75 to 84 Years | 378 | 13.1% |
| 85 Years and Over | 70 | 2.4% |
| Total | 2,890 | 100.0% |
Housing Finances in Lake Lorraine
Median Income by Occupancy in Lake Lorraine
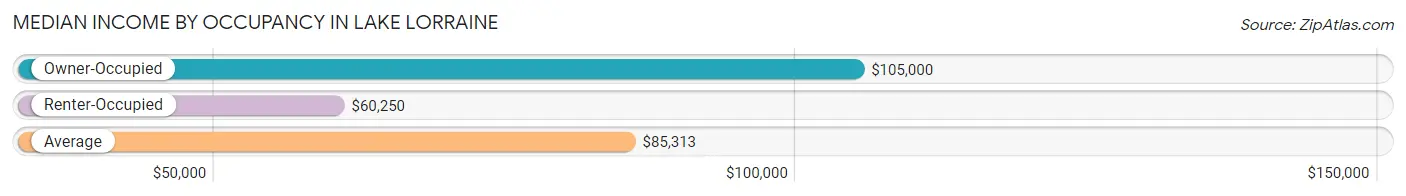
| Occupancy Type | # Households | Median Income |
| Owner-Occupied | 2,156 (74.6%) | $105,000 |
| Renter-Occupied | 734 (25.4%) | $60,250 |
| Average | 2,890 (100.0%) | $85,313 |
Occupancy by Householder Income Bracket in Lake Lorraine
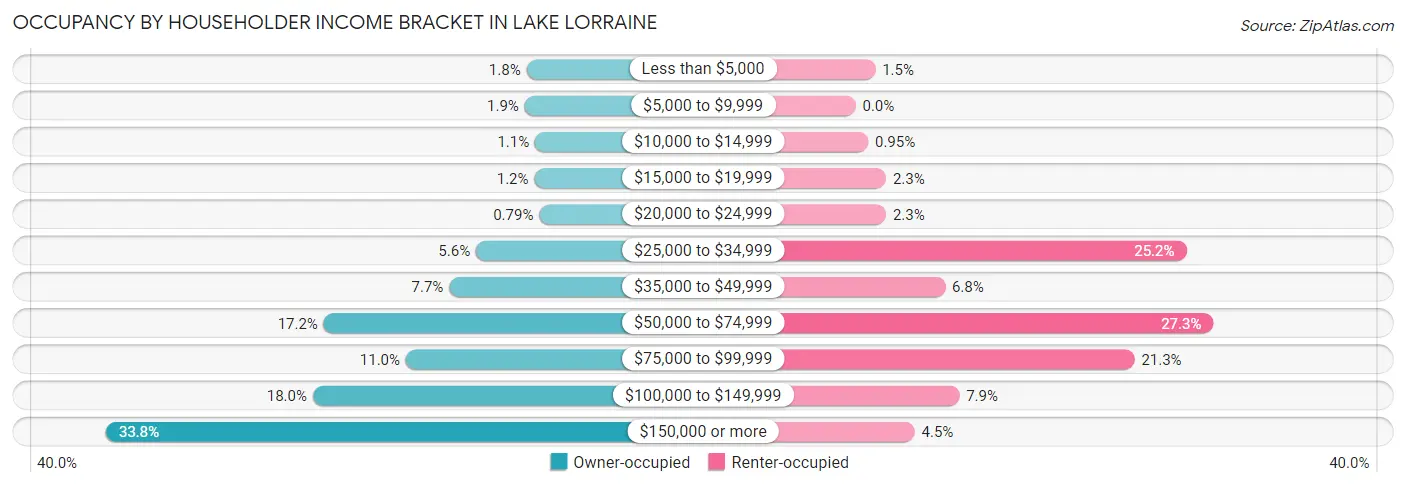
| Income Bracket | Owner-occupied | Renter-occupied |
| Less than $5,000 | 38 (1.8%) | 11 (1.5%) |
| $5,000 to $9,999 | 41 (1.9%) | 0 (0.0%) |
| $10,000 to $14,999 | 24 (1.1%) | 7 (0.9%) |
| $15,000 to $19,999 | 25 (1.2%) | 17 (2.3%) |
| $20,000 to $24,999 | 17 (0.8%) | 17 (2.3%) |
| $25,000 to $34,999 | 121 (5.6%) | 185 (25.2%) |
| $35,000 to $49,999 | 165 (7.6%) | 50 (6.8%) |
| $50,000 to $74,999 | 371 (17.2%) | 200 (27.3%) |
| $75,000 to $99,999 | 236 (11.0%) | 156 (21.2%) |
| $100,000 to $149,999 | 389 (18.0%) | 58 (7.9%) |
| $150,000 or more | 729 (33.8%) | 33 (4.5%) |
| Total | 2,156 (100.0%) | 734 (100.0%) |
Monthly Housing Cost Tiers in Lake Lorraine
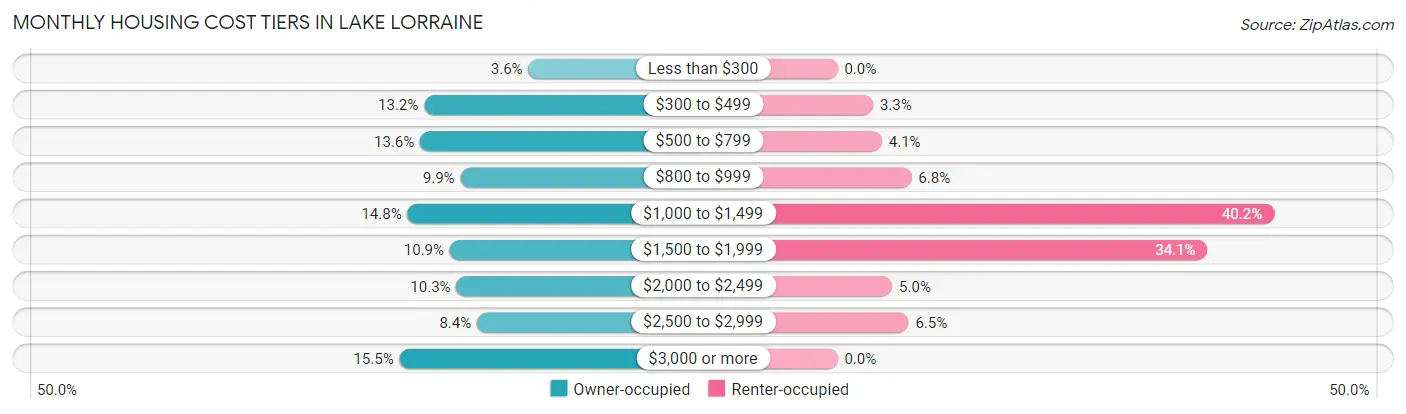
| Monthly Cost | Owner-occupied | Renter-occupied |
| Less than $300 | 78 (3.6%) | 0 (0.0%) |
| $300 to $499 | 285 (13.2%) | 24 (3.3%) |
| $500 to $799 | 293 (13.6%) | 30 (4.1%) |
| $800 to $999 | 213 (9.9%) | 50 (6.8%) |
| $1,000 to $1,499 | 318 (14.7%) | 295 (40.2%) |
| $1,500 to $1,999 | 234 (10.8%) | 250 (34.1%) |
| $2,000 to $2,499 | 221 (10.2%) | 37 (5.0%) |
| $2,500 to $2,999 | 180 (8.4%) | 48 (6.5%) |
| $3,000 or more | 334 (15.5%) | 0 (0.0%) |
| Total | 2,156 (100.0%) | 734 (100.0%) |
Physical Housing Characteristics in Lake Lorraine
Housing Structures in Lake Lorraine
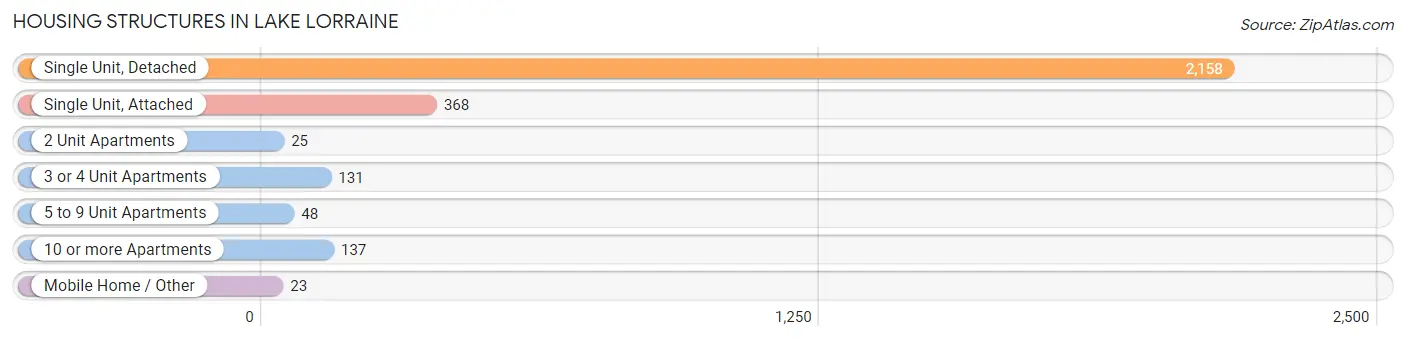
| Structure Type | # Housing Units | % Housing Units |
| Single Unit, Detached | 2,158 | 74.7% |
| Single Unit, Attached | 368 | 12.7% |
| 2 Unit Apartments | 25 | 0.9% |
| 3 or 4 Unit Apartments | 131 | 4.5% |
| 5 to 9 Unit Apartments | 48 | 1.7% |
| 10 or more Apartments | 137 | 4.7% |
| Mobile Home / Other | 23 | 0.8% |
| Total | 2,890 | 100.0% |
Housing Structures by Occupancy in Lake Lorraine
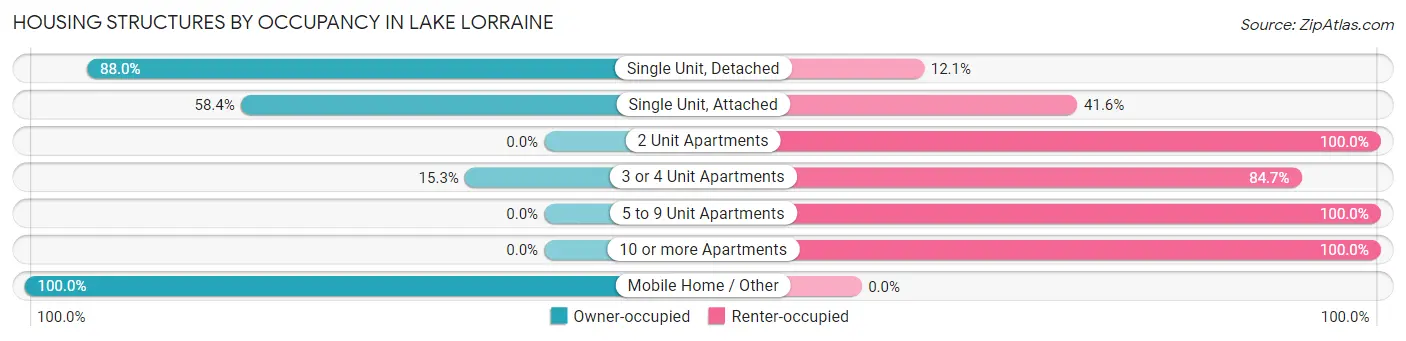
| Structure Type | Owner-occupied | Renter-occupied |
| Single Unit, Detached | 1,898 (87.9%) | 260 (12.0%) |
| Single Unit, Attached | 215 (58.4%) | 153 (41.6%) |
| 2 Unit Apartments | 0 (0.0%) | 25 (100.0%) |
| 3 or 4 Unit Apartments | 20 (15.3%) | 111 (84.7%) |
| 5 to 9 Unit Apartments | 0 (0.0%) | 48 (100.0%) |
| 10 or more Apartments | 0 (0.0%) | 137 (100.0%) |
| Mobile Home / Other | 23 (100.0%) | 0 (0.0%) |
| Total | 2,156 (74.6%) | 734 (25.4%) |
Housing Structures by Number of Rooms in Lake Lorraine
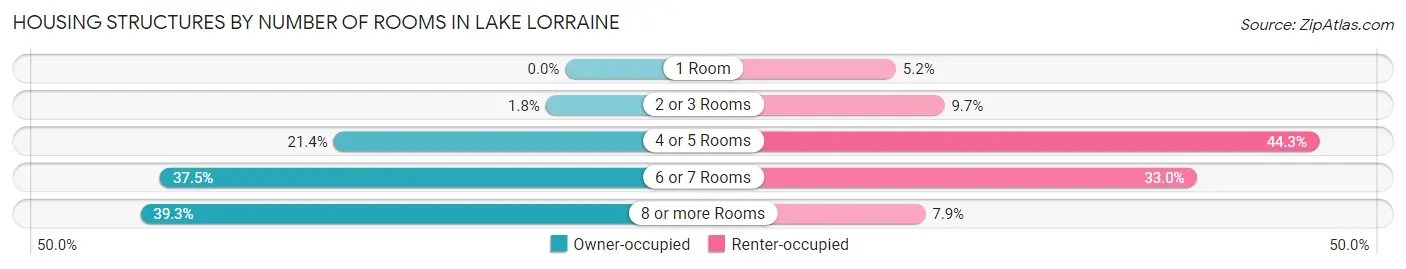
| Number of Rooms | Owner-occupied | Renter-occupied |
| 1 Room | 0 (0.0%) | 38 (5.2%) |
| 2 or 3 Rooms | 39 (1.8%) | 71 (9.7%) |
| 4 or 5 Rooms | 462 (21.4%) | 325 (44.3%) |
| 6 or 7 Rooms | 808 (37.5%) | 242 (33.0%) |
| 8 or more Rooms | 847 (39.3%) | 58 (7.9%) |
| Total | 2,156 (100.0%) | 734 (100.0%) |
Housing Structure by Heating Type in Lake Lorraine
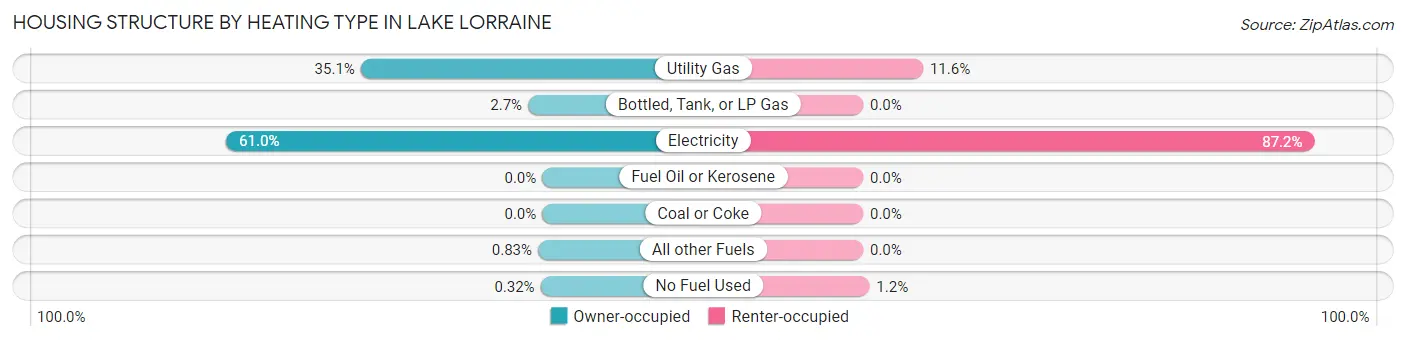
| Heating Type | Owner-occupied | Renter-occupied |
| Utility Gas | 756 (35.1%) | 85 (11.6%) |
| Bottled, Tank, or LP Gas | 59 (2.7%) | 0 (0.0%) |
| Electricity | 1,316 (61.0%) | 640 (87.2%) |
| Fuel Oil or Kerosene | 0 (0.0%) | 0 (0.0%) |
| Coal or Coke | 0 (0.0%) | 0 (0.0%) |
| All other Fuels | 18 (0.8%) | 0 (0.0%) |
| No Fuel Used | 7 (0.3%) | 9 (1.2%) |
| Total | 2,156 (100.0%) | 734 (100.0%) |
Household Vehicle Usage in Lake Lorraine
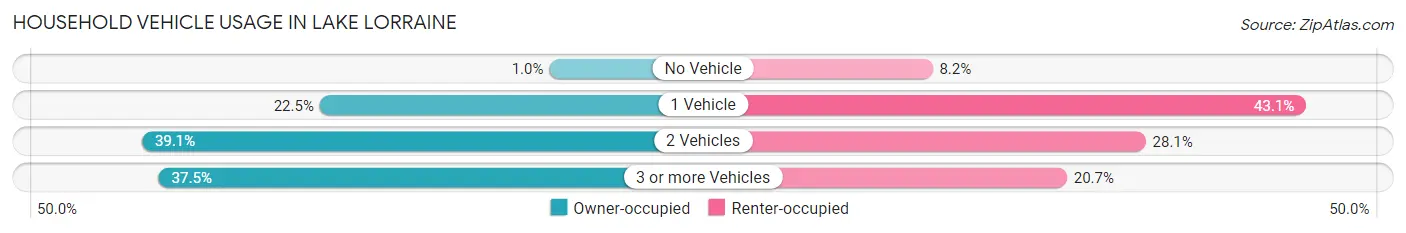
| Vehicles per Household | Owner-occupied | Renter-occupied |
| No Vehicle | 22 (1.0%) | 60 (8.2%) |
| 1 Vehicle | 484 (22.5%) | 316 (43.0%) |
| 2 Vehicles | 842 (39.1%) | 206 (28.1%) |
| 3 or more Vehicles | 808 (37.5%) | 152 (20.7%) |
| Total | 2,156 (100.0%) | 734 (100.0%) |
Real Estate & Mortgages in Lake Lorraine
Real Estate and Mortgage Overview in Lake Lorraine
| Characteristic | Without Mortgage | With Mortgage |
| Housing Units | 828 | 1,328 |
| Median Property Value | $311,100 | $401,000 |
| Median Household Income | $74,485 | $532 |
| Monthly Housing Costs | $548 | $324 |
| Real Estate Taxes | $1,765 | $15 |
Property Value by Mortgage Status in Lake Lorraine
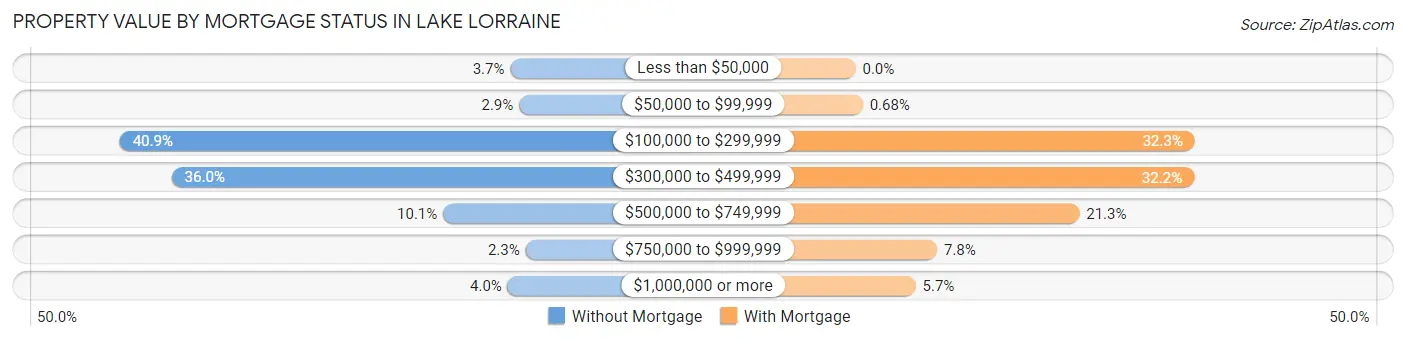
| Property Value | Without Mortgage | With Mortgage |
| Less than $50,000 | 31 (3.7%) | 0 (0.0%) |
| $50,000 to $99,999 | 24 (2.9%) | 9 (0.7%) |
| $100,000 to $299,999 | 339 (40.9%) | 429 (32.3%) |
| $300,000 to $499,999 | 298 (36.0%) | 428 (32.2%) |
| $500,000 to $749,999 | 84 (10.1%) | 283 (21.3%) |
| $750,000 to $999,999 | 19 (2.3%) | 103 (7.8%) |
| $1,000,000 or more | 33 (4.0%) | 76 (5.7%) |
| Total | 828 (100.0%) | 1,328 (100.0%) |
Household Income by Mortgage Status in Lake Lorraine
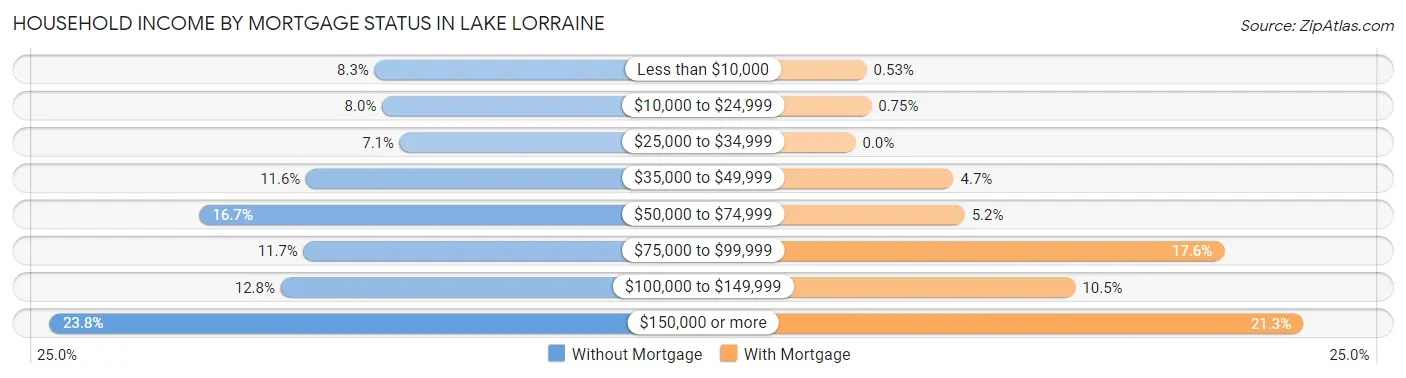
| Household Income | Without Mortgage | With Mortgage |
| Less than $10,000 | 69 (8.3%) | 7 (0.5%) |
| $10,000 to $24,999 | 66 (8.0%) | 10 (0.7%) |
| $25,000 to $34,999 | 59 (7.1%) | 0 (0.0%) |
| $35,000 to $49,999 | 96 (11.6%) | 62 (4.7%) |
| $50,000 to $74,999 | 138 (16.7%) | 69 (5.2%) |
| $75,000 to $99,999 | 97 (11.7%) | 233 (17.5%) |
| $100,000 to $149,999 | 106 (12.8%) | 139 (10.5%) |
| $150,000 or more | 197 (23.8%) | 283 (21.3%) |
| Total | 828 (100.0%) | 1,328 (100.0%) |
Property Value to Household Income Ratio in Lake Lorraine
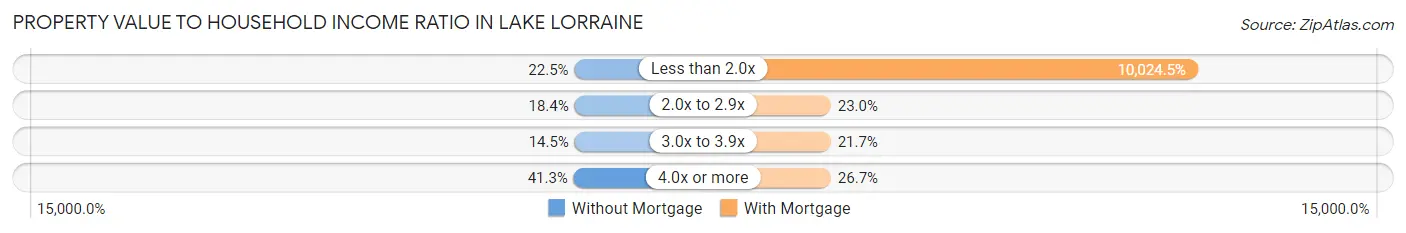
| Value-to-Income Ratio | Without Mortgage | With Mortgage |
| Less than 2.0x | 186 (22.5%) | 133,125 (10,024.5%) |
| 2.0x to 2.9x | 152 (18.4%) | 305 (23.0%) |
| 3.0x to 3.9x | 120 (14.5%) | 288 (21.7%) |
| 4.0x or more | 342 (41.3%) | 354 (26.7%) |
| Total | 828 (100.0%) | 1,328 (100.0%) |
Real Estate Taxes by Mortgage Status in Lake Lorraine
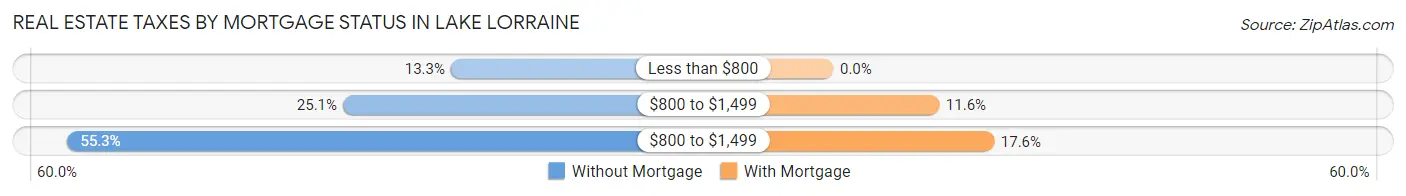
| Property Taxes | Without Mortgage | With Mortgage |
| Less than $800 | 110 (13.3%) | 0 (0.0%) |
| $800 to $1,499 | 208 (25.1%) | 154 (11.6%) |
| $800 to $1,499 | 458 (55.3%) | 234 (17.6%) |
| Total | 828 (100.0%) | 1,328 (100.0%) |
Health & Disability in Lake Lorraine
Health Insurance Coverage by Age in Lake Lorraine
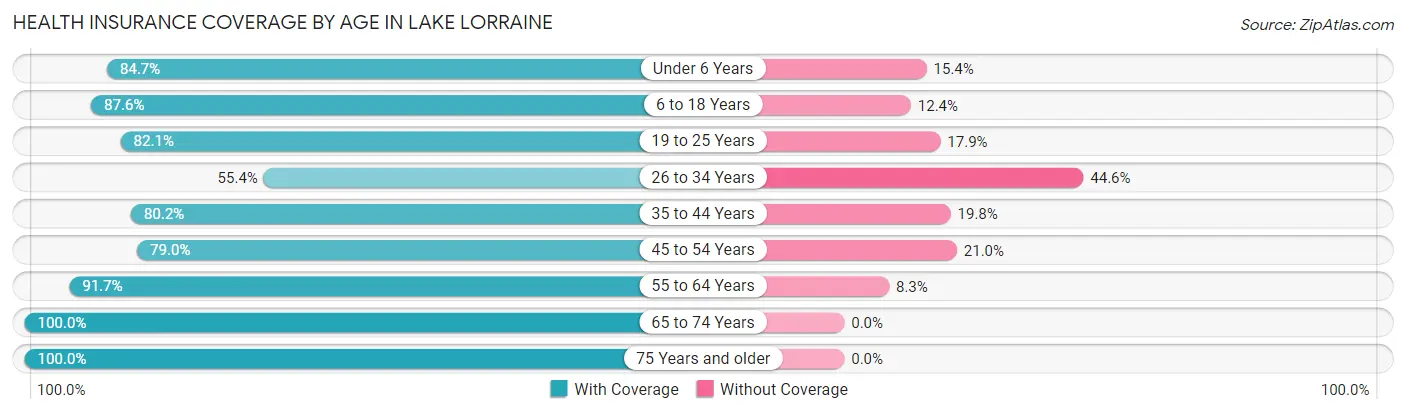
| Age Bracket | With Coverage | Without Coverage |
| Under 6 Years | 408 (84.7%) | 74 (15.3%) |
| 6 to 18 Years | 889 (87.6%) | 126 (12.4%) |
| 19 to 25 Years | 591 (82.1%) | 129 (17.9%) |
| 26 to 34 Years | 460 (55.4%) | 370 (44.6%) |
| 35 to 44 Years | 473 (80.2%) | 117 (19.8%) |
| 45 to 54 Years | 685 (79.0%) | 182 (21.0%) |
| 55 to 64 Years | 1,000 (91.7%) | 91 (8.3%) |
| 65 to 74 Years | 647 (100.0%) | 0 (0.0%) |
| 75 Years and older | 652 (100.0%) | 0 (0.0%) |
| Total | 5,805 (84.2%) | 1,089 (15.8%) |
Health Insurance Coverage by Citizenship Status in Lake Lorraine
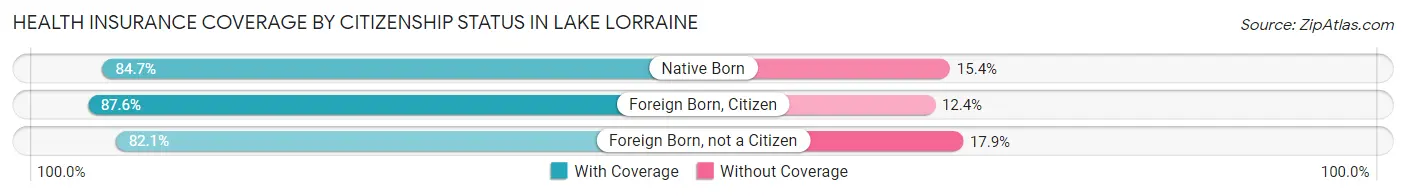
| Citizenship Status | With Coverage | Without Coverage |
| Native Born | 408 (84.7%) | 74 (15.3%) |
| Foreign Born, Citizen | 889 (87.6%) | 126 (12.4%) |
| Foreign Born, not a Citizen | 591 (82.1%) | 129 (17.9%) |
Health Insurance Coverage by Household Income in Lake Lorraine
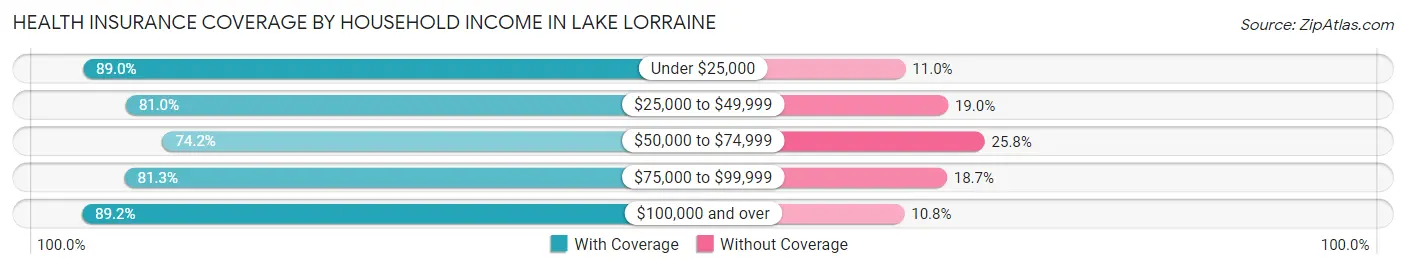
| Household Income | With Coverage | Without Coverage |
| Under $25,000 | 365 (89.0%) | 45 (11.0%) |
| $25,000 to $49,999 | 808 (81.0%) | 189 (19.0%) |
| $50,000 to $74,999 | 905 (74.2%) | 315 (25.8%) |
| $75,000 to $99,999 | 820 (81.3%) | 189 (18.7%) |
| $100,000 and over | 2,907 (89.2%) | 351 (10.8%) |
Public vs Private Health Insurance Coverage by Age in Lake Lorraine
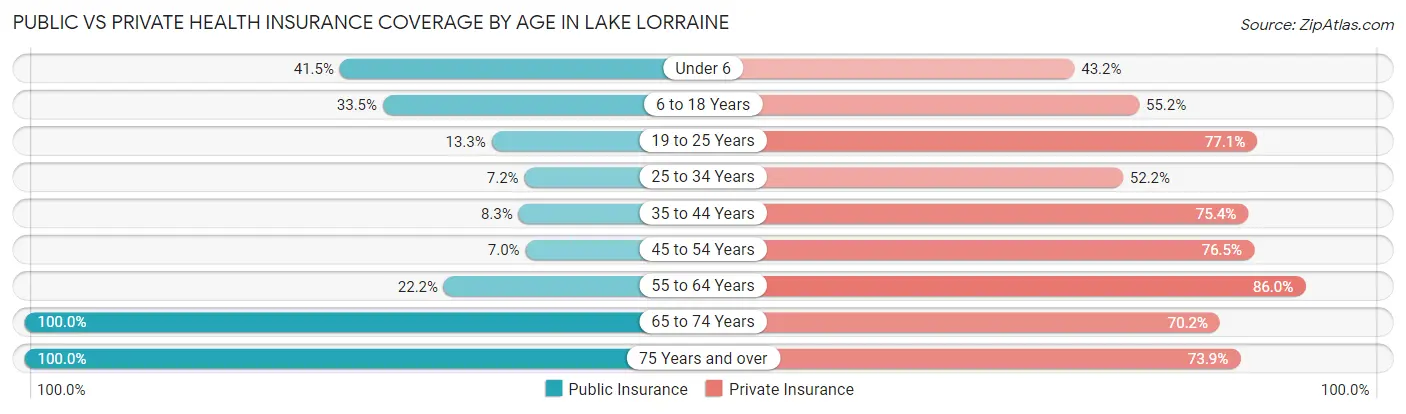
| Age Bracket | Public Insurance | Private Insurance |
| Under 6 | 200 (41.5%) | 208 (43.1%) |
| 6 to 18 Years | 340 (33.5%) | 560 (55.2%) |
| 19 to 25 Years | 96 (13.3%) | 555 (77.1%) |
| 25 to 34 Years | 60 (7.2%) | 433 (52.2%) |
| 35 to 44 Years | 49 (8.3%) | 445 (75.4%) |
| 45 to 54 Years | 61 (7.0%) | 663 (76.5%) |
| 55 to 64 Years | 242 (22.2%) | 938 (86.0%) |
| 65 to 74 Years | 647 (100.0%) | 454 (70.2%) |
| 75 Years and over | 652 (100.0%) | 482 (73.9%) |
| Total | 2,347 (34.0%) | 4,738 (68.7%) |
Disability Status by Sex by Age in Lake Lorraine
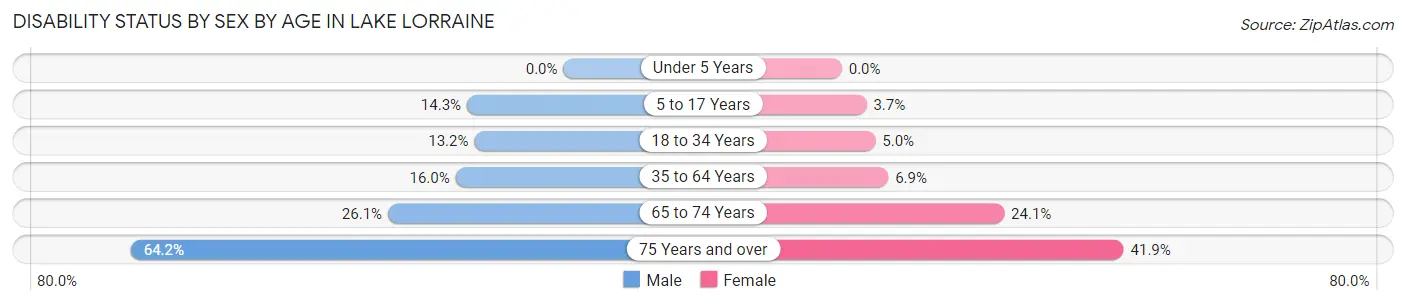
| Age Bracket | Male | Female |
| Under 5 Years | 0 (0.0%) | 0 (0.0%) |
| 5 to 17 Years | 66 (14.3%) | 23 (3.7%) |
| 18 to 34 Years | 97 (13.2%) | 41 (5.0%) |
| 35 to 64 Years | 192 (16.0%) | 93 (6.9%) |
| 65 to 74 Years | 81 (26.1%) | 81 (24.1%) |
| 75 Years and over | 210 (64.2%) | 136 (41.8%) |
Disability Class by Sex by Age in Lake Lorraine
Disability Class: Hearing Difficulty
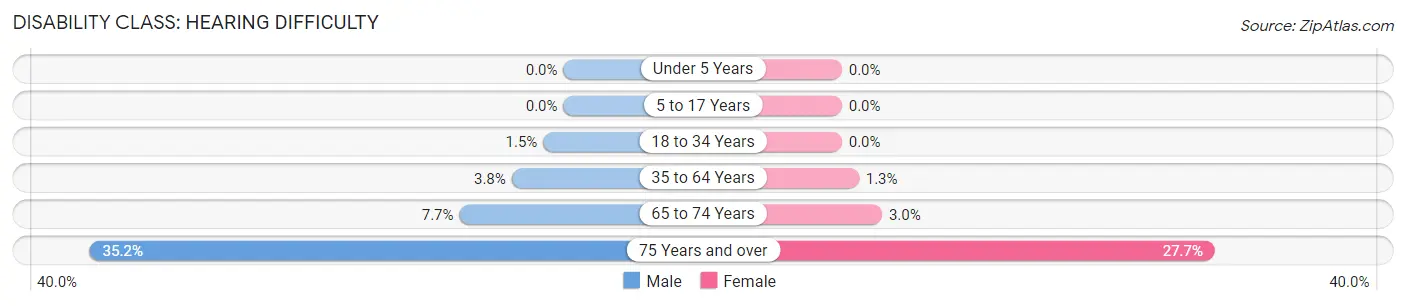
| Age Bracket | Male | Female |
| Under 5 Years | 0 (0.0%) | 0 (0.0%) |
| 5 to 17 Years | 0 (0.0%) | 0 (0.0%) |
| 18 to 34 Years | 11 (1.5%) | 0 (0.0%) |
| 35 to 64 Years | 46 (3.8%) | 17 (1.3%) |
| 65 to 74 Years | 24 (7.7%) | 10 (3.0%) |
| 75 Years and over | 115 (35.2%) | 90 (27.7%) |
Disability Class: Vision Difficulty
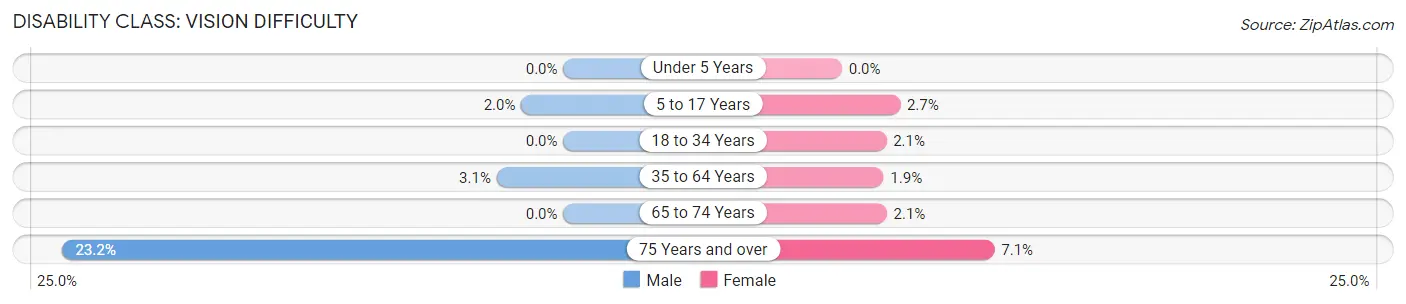
| Age Bracket | Male | Female |
| Under 5 Years | 0 (0.0%) | 0 (0.0%) |
| 5 to 17 Years | 9 (1.9%) | 17 (2.7%) |
| 18 to 34 Years | 0 (0.0%) | 17 (2.1%) |
| 35 to 64 Years | 37 (3.1%) | 26 (1.9%) |
| 65 to 74 Years | 0 (0.0%) | 7 (2.1%) |
| 75 Years and over | 76 (23.2%) | 23 (7.1%) |
Disability Class: Cognitive Difficulty
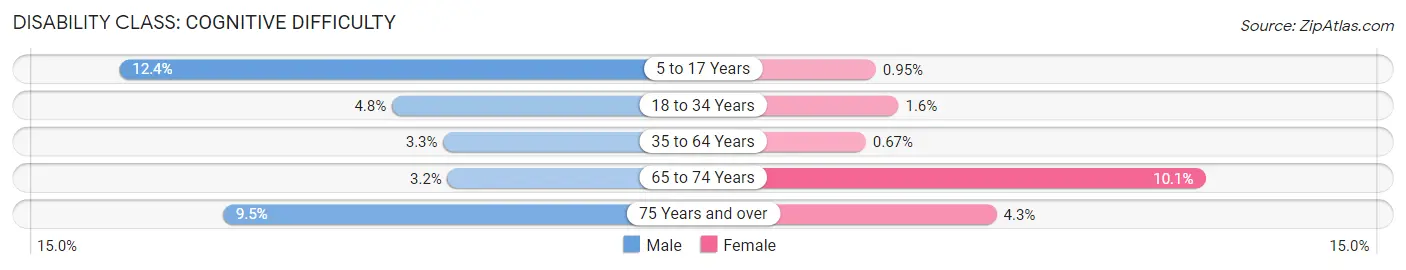
| Age Bracket | Male | Female |
| 5 to 17 Years | 57 (12.4%) | 6 (0.9%) |
| 18 to 34 Years | 35 (4.8%) | 13 (1.6%) |
| 35 to 64 Years | 40 (3.3%) | 9 (0.7%) |
| 65 to 74 Years | 10 (3.2%) | 34 (10.1%) |
| 75 Years and over | 31 (9.5%) | 14 (4.3%) |
Disability Class: Ambulatory Difficulty
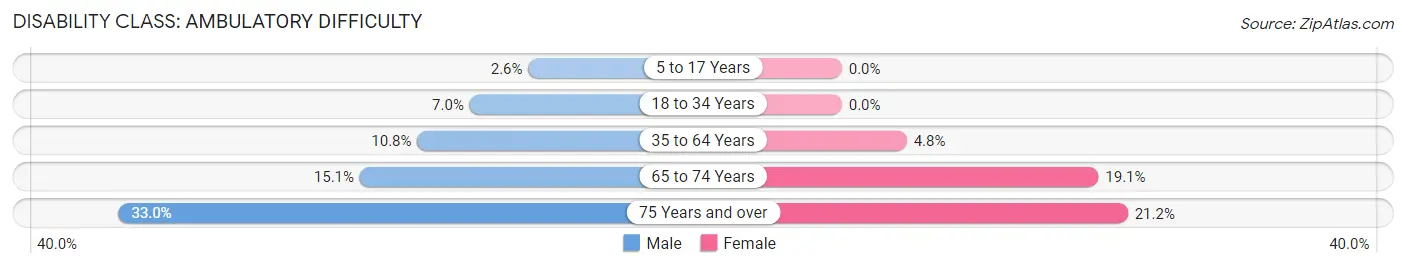
| Age Bracket | Male | Female |
| 5 to 17 Years | 12 (2.6%) | 0 (0.0%) |
| 18 to 34 Years | 51 (7.0%) | 0 (0.0%) |
| 35 to 64 Years | 130 (10.8%) | 65 (4.8%) |
| 65 to 74 Years | 47 (15.1%) | 64 (19.1%) |
| 75 Years and over | 108 (33.0%) | 69 (21.2%) |
Disability Class: Self-Care Difficulty
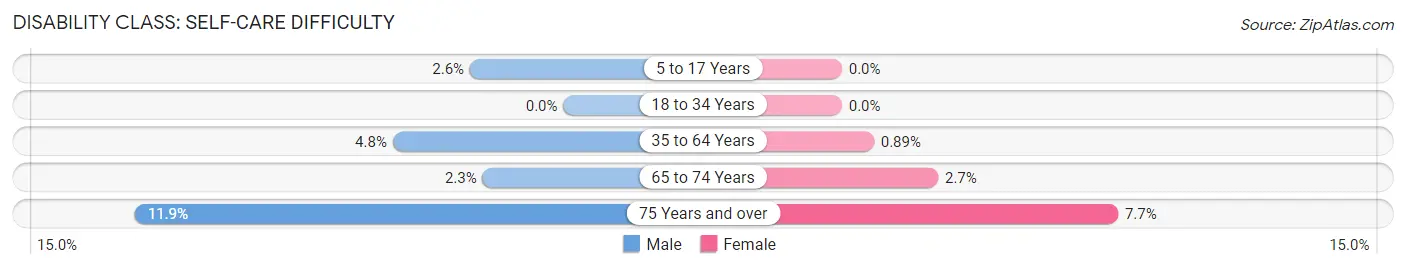
| Age Bracket | Male | Female |
| 5 to 17 Years | 12 (2.6%) | 0 (0.0%) |
| 18 to 34 Years | 0 (0.0%) | 0 (0.0%) |
| 35 to 64 Years | 57 (4.8%) | 12 (0.9%) |
| 65 to 74 Years | 7 (2.2%) | 9 (2.7%) |
| 75 Years and over | 39 (11.9%) | 25 (7.7%) |
Technology Access in Lake Lorraine
Computing Device Access in Lake Lorraine
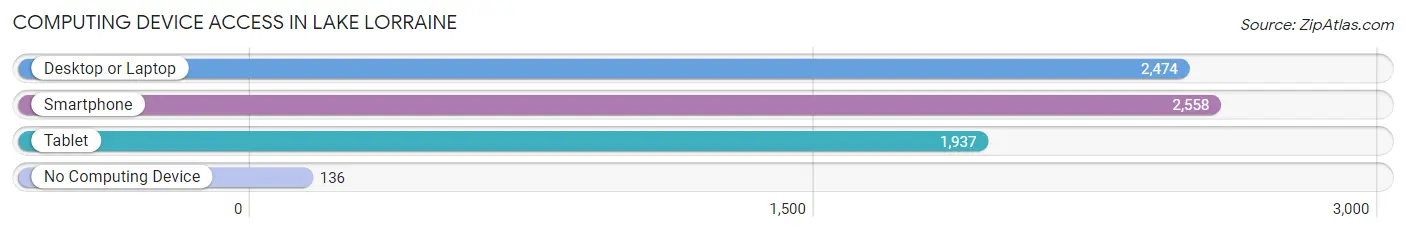
| Device Type | # Households | % Households |
| Desktop or Laptop | 2,474 | 85.6% |
| Smartphone | 2,558 | 88.5% |
| Tablet | 1,937 | 67.0% |
| No Computing Device | 136 | 4.7% |
| Total | 2,890 | 100.0% |
Internet Access in Lake Lorraine
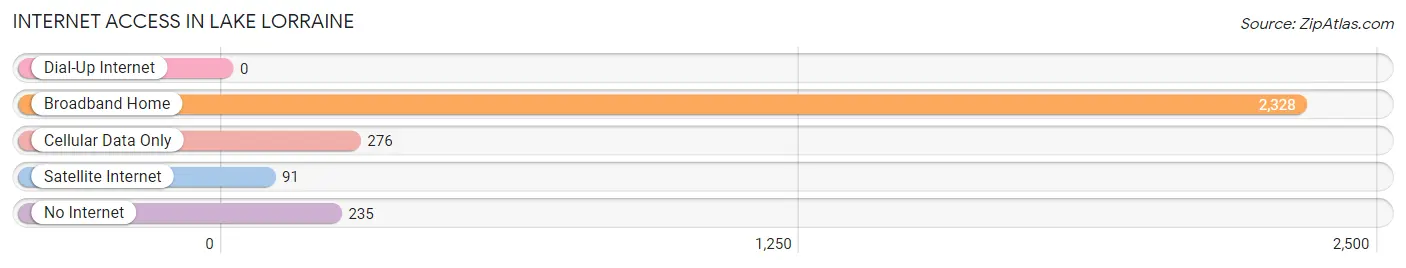
| Internet Type | # Households | % Households |
| Dial-Up Internet | 0 | 0.0% |
| Broadband Home | 2,328 | 80.5% |
| Cellular Data Only | 276 | 9.6% |
| Satellite Internet | 91 | 3.2% |
| No Internet | 235 | 8.1% |
| Total | 2,890 | 100.0% |
Lake Lorraine Summary
Lake Lorraine is a small unincorporated community located in the state of Florida, in the United States. It is situated in the northern part of the state, in the county of Walton. The community is located on the shores of Lake Lorraine, a small lake that is part of the Choctawhatchee River system. The lake is a popular destination for fishing, swimming, and other recreational activities.
History
The area around Lake Lorraine has been inhabited for thousands of years. The first known inhabitants were Native American tribes, including the Choctaw, Creek, and Seminole. These tribes used the lake and its surrounding area for hunting, fishing, and gathering.
The first European settlers arrived in the area in the early 1800s. These settlers were mostly farmers and ranchers who established small homesteads in the area. The area was also home to a number of small sawmills and turpentine stills.
In the late 1800s, the area around Lake Lorraine began to develop as a resort destination. The lake was a popular spot for fishing and swimming, and several resorts were built in the area. The resorts attracted visitors from all over the country, and the area became known as a popular vacation spot.
In the early 1900s, the area around Lake Lorraine began to experience a population boom. The population of the area grew rapidly, and the town of Lake Lorraine was established in the 1920s. The town was named after the lake, and it quickly became a popular destination for tourists and locals alike.
Geography
Lake Lorraine is located in the northern part of the state of Florida, in the county of Walton. The lake is part of the Choctawhatchee River system, and it is surrounded by a number of small towns and communities. The lake is approximately 4 miles long and 1 mile wide, and it has a maximum depth of about 20 feet.
The area around Lake Lorraine is mostly flat, with some rolling hills. The lake is surrounded by a number of small creeks and streams, and the area is home to a variety of wildlife, including deer, turkey, and a variety of waterfowl.
Economy
The economy of Lake Lorraine is largely based on tourism and recreation. The lake is a popular destination for fishing, swimming, and other recreational activities. The area is also home to a number of small businesses, including restaurants, convenience stores, and gas stations.
The area around Lake Lorraine is also home to a number of farms and ranches. These farms and ranches produce a variety of crops, including corn, soybeans, and hay.
Demographics
As of the 2010 census, the population of Lake Lorraine was 1,845. The population is mostly white (94.3%), with a small percentage of African Americans (2.3%) and Hispanics (2.2%). The median household income in the area is $41,944, and the median age is 44.
Conclusion
Lake Lorraine is a small unincorporated community located in the northern part of the state of Florida, in the county of Walton. The area has a long history of settlement, and it is now a popular destination for fishing, swimming, and other recreational activities. The economy of the area is largely based on tourism and recreation, and the population is mostly white.
Common Questions
What is Per Capita Income in Lake Lorraine?
Per Capita income in Lake Lorraine is $47,312.
What is the Median Family Income in Lake Lorraine?
Median Family Income in Lake Lorraine is $102,719.
What is the Median Household income in Lake Lorraine?
Median Household Income in Lake Lorraine is $85,313.
What is Income or Wage Gap in Lake Lorraine?
Income or Wage Gap in Lake Lorraine is 24.3%.
Women in Lake Lorraine earn 75.7 cents for every dollar earned by a man.
What is Family Income Deficit in Lake Lorraine?
Family Income Deficit in Lake Lorraine is $9,069.
Families that are below poverty line in Lake Lorraine earn $9,069 less on average than the poverty threshold level.
What is Inequality or Gini Index in Lake Lorraine?
Inequality or Gini Index in Lake Lorraine is 0.43.
What is the Total Population of Lake Lorraine?
Total Population of Lake Lorraine is 7,164.
What is the Total Male Population of Lake Lorraine?
Total Male Population of Lake Lorraine is 3,586.
What is the Total Female Population of Lake Lorraine?
Total Female Population of Lake Lorraine is 3,578.
What is the Ratio of Males per 100 Females in Lake Lorraine?
There are 100.22 Males per 100 Females in Lake Lorraine.
What is the Ratio of Females per 100 Males in Lake Lorraine?
There are 99.78 Females per 100 Males in Lake Lorraine.
What is the Median Population Age in Lake Lorraine?
Median Population Age in Lake Lorraine is 40.4 Years.
What is the Average Family Size in Lake Lorraine
Average Family Size in Lake Lorraine is 2.9 People.
What is the Average Household Size in Lake Lorraine
Average Household Size in Lake Lorraine is 2.5 People.
How Large is the Labor Force in Lake Lorraine?
There are 3,836 People in the Labor Forcein in Lake Lorraine.
What is the Percentage of People in the Labor Force in Lake Lorraine?
65.9% of People are in the Labor Force in Lake Lorraine.
What is the Unemployment Rate in Lake Lorraine?
Unemployment Rate in Lake Lorraine is 1.7%.