Pea Ridge, FL Map & Demographics
Pea Ridge Map
Pea Ridge Overview
$29,934
PER CAPITA INCOME
$81,563
AVG FAMILY INCOME
$58,490
AVG HOUSEHOLD INCOME
27.6%
WAGE / INCOME GAP [ % ]
72.4¢/ $1
WAGE / INCOME GAP [ $ ]
0.36
INEQUALITY / GINI INDEX
3,765
TOTAL POPULATION
1,856
MALE POPULATION
1,909
FEMALE POPULATION
97.22
MALES / 100 FEMALES
102.86
FEMALES / 100 MALES
35.4
MEDIAN AGE
3.3
AVG FAMILY SIZE
2.6
AVG HOUSEHOLD SIZE
1,980
LABOR FORCE [ PEOPLE ]
65.8%
PERCENT IN LABOR FORCE
1.6%
UNEMPLOYMENT RATE
Income in Pea Ridge
Income Overview in Pea Ridge
Per Capita Income in Pea Ridge is $29,934, while median incomes of families and households are $81,563 and $58,490 respectively.
| Characteristic | Number | Measure |
| Per Capita Income | 3,765 | $29,934 |
| Median Family Income | 938 | $81,563 |
| Mean Family Income | 938 | $86,887 |
| Median Household Income | 1,448 | $58,490 |
| Mean Household Income | 1,448 | $73,584 |
| Income Deficit | 938 | $0 |
| Wage / Income Gap (%) | 3,765 | 27.57% |
| Wage / Income Gap ($) | 3,765 | 72.43¢ per $1 |
| Gini / Inequality Index | 3,765 | 0.36 |
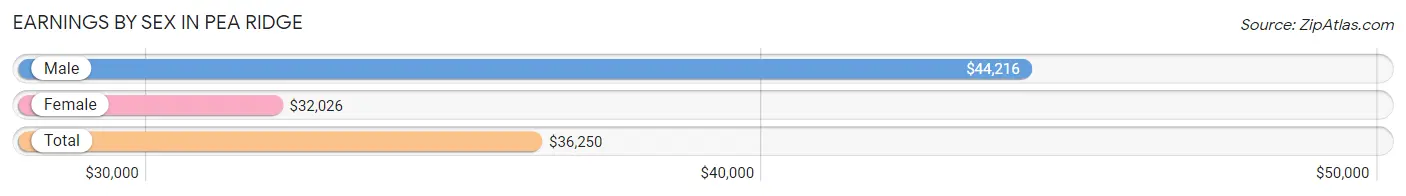
Earnings by Sex in Pea Ridge
Average Earnings in Pea Ridge are $36,250, $44,216 for men and $32,026 for women, a difference of 27.6%.
| Sex | Number | Average Earnings |
| Male | 1,112 (54.8%) | $44,216 |
| Female | 917 (45.2%) | $32,026 |
| Total | 2,029 (100.0%) | $36,250 |
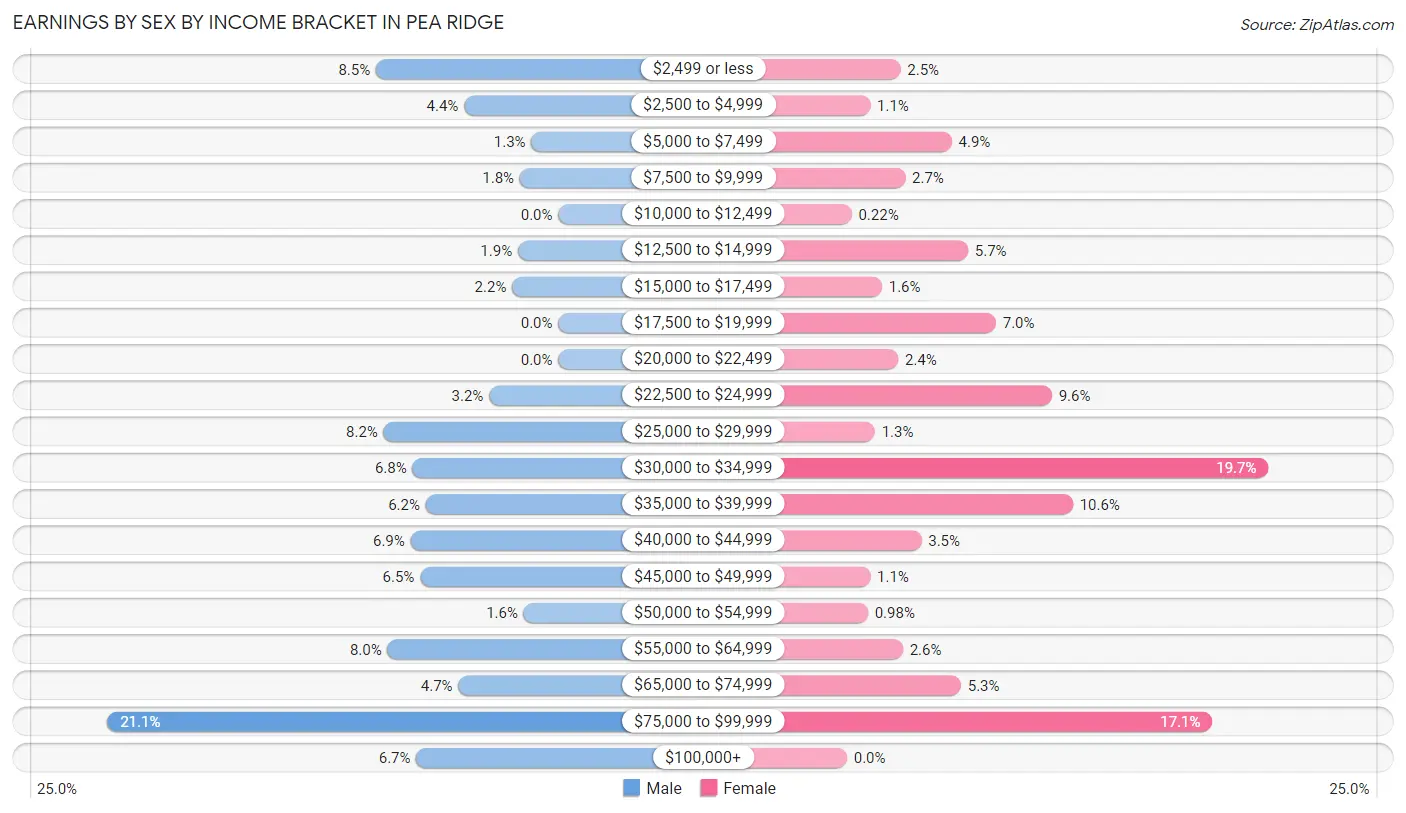
Earnings by Sex by Income Bracket in Pea Ridge
The most common earnings brackets in Pea Ridge are $75,000 to $99,999 for men (235 | 21.1%) and $30,000 to $34,999 for women (181 | 19.7%).
| Income | Male | Female |
| $2,499 or less | 95 (8.5%) | 23 (2.5%) |
| $2,500 to $4,999 | 49 (4.4%) | 10 (1.1%) |
| $5,000 to $7,499 | 14 (1.3%) | 45 (4.9%) |
| $7,500 to $9,999 | 20 (1.8%) | 25 (2.7%) |
| $10,000 to $12,499 | 0 (0.0%) | 2 (0.2%) |
| $12,500 to $14,999 | 21 (1.9%) | 52 (5.7%) |
| $15,000 to $17,499 | 24 (2.2%) | 15 (1.6%) |
| $17,500 to $19,999 | 0 (0.0%) | 64 (7.0%) |
| $20,000 to $22,499 | 0 (0.0%) | 22 (2.4%) |
| $22,500 to $24,999 | 36 (3.2%) | 88 (9.6%) |
| $25,000 to $29,999 | 91 (8.2%) | 12 (1.3%) |
| $30,000 to $34,999 | 76 (6.8%) | 181 (19.7%) |
| $35,000 to $39,999 | 69 (6.2%) | 97 (10.6%) |
| $40,000 to $44,999 | 77 (6.9%) | 32 (3.5%) |
| $45,000 to $49,999 | 72 (6.5%) | 10 (1.1%) |
| $50,000 to $54,999 | 18 (1.6%) | 9 (1.0%) |
| $55,000 to $64,999 | 89 (8.0%) | 24 (2.6%) |
| $65,000 to $74,999 | 52 (4.7%) | 49 (5.3%) |
| $75,000 to $99,999 | 235 (21.1%) | 157 (17.1%) |
| $100,000+ | 74 (6.7%) | 0 (0.0%) |
| Total | 1,112 (100.0%) | 917 (100.0%) |
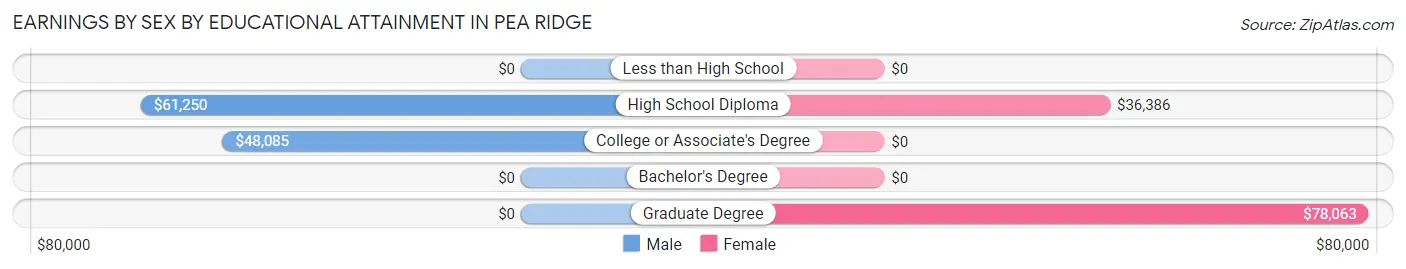
Earnings by Sex by Educational Attainment in Pea Ridge
Average earnings in Pea Ridge are $50,208 for men and $35,202 for women, a difference of 29.9%. Men with an educational attainment of high school diploma enjoy the highest average annual earnings of $61,250, while those with college or associate's degree education earn the least with $48,085. Women with an educational attainment of graduate degree earn the most with the average annual earnings of $78,063, while those with high school diploma education have the smallest earnings of $36,386.
| Educational Attainment | Male Income | Female Income |
| Less than High School | - | - |
| High School Diploma | $61,250 | $36,386 |
| College or Associate's Degree | $48,085 | $0 |
| Bachelor's Degree | - | - |
| Graduate Degree | - | - |
| Total | $50,208 | $35,202 |
Family Income in Pea Ridge
Family Income Brackets in Pea Ridge
According to the Pea Ridge family income data, there are 205 families falling into the $35,000 to $49,999 income range, which is the most common income bracket and makes up 21.9% of all families.
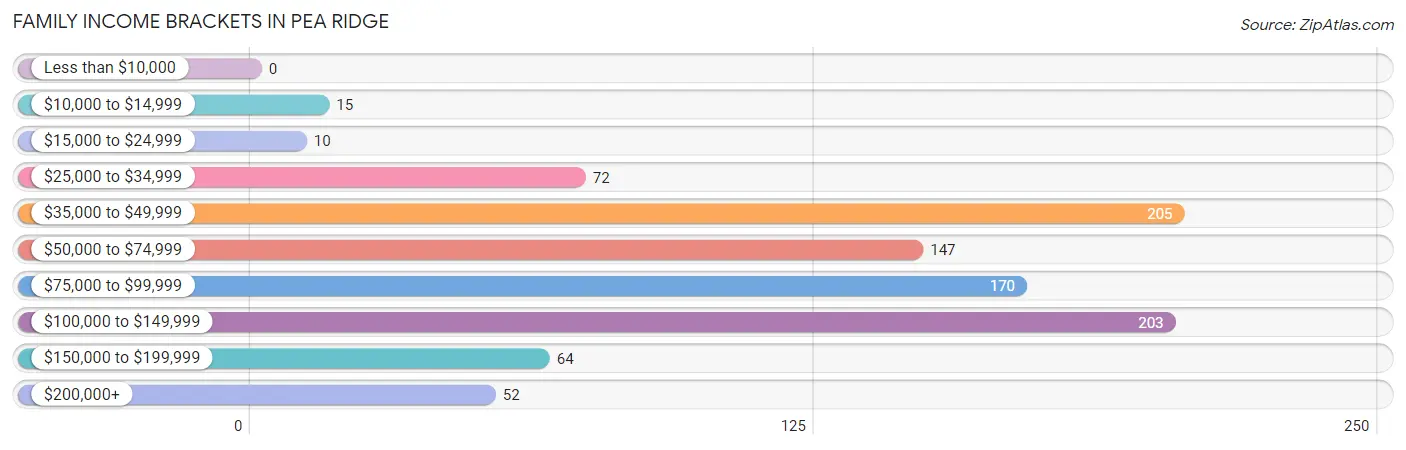
| Income Bracket | # Families | % Families |
| Less than $10,000 | 0 | 0.0% |
| $10,000 to $14,999 | 15 | 1.6% |
| $15,000 to $24,999 | 10 | 1.1% |
| $25,000 to $34,999 | 72 | 7.7% |
| $35,000 to $49,999 | 205 | 21.9% |
| $50,000 to $74,999 | 147 | 15.7% |
| $75,000 to $99,999 | 170 | 18.1% |
| $100,000 to $149,999 | 203 | 21.6% |
| $150,000 to $199,999 | 64 | 6.8% |
| $200,000+ | 52 | 5.5% |
Family Income by Famaliy Size in Pea Ridge
3-person families (351 | 37.4%) account for the highest median family income in Pea Ridge with $72,440 per family, while 3-person families (351 | 37.4%) have the highest median income of $24,147 per family member.
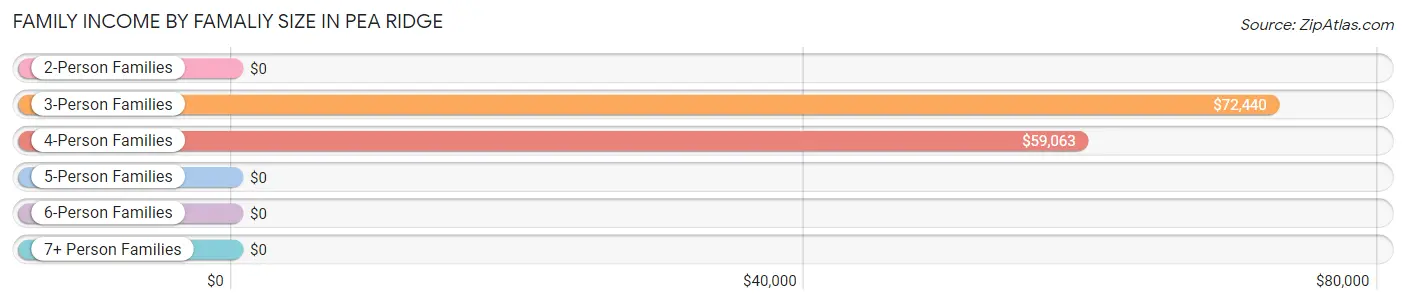
| Income Bracket | # Families | Median Income |
| 2-Person Families | 298 (31.8%) | $0 |
| 3-Person Families | 351 (37.4%) | $72,440 |
| 4-Person Families | 169 (18.0%) | $59,063 |
| 5-Person Families | 96 (10.2%) | $0 |
| 6-Person Families | 12 (1.3%) | $0 |
| 7+ Person Families | 12 (1.3%) | $0 |
| Total | 938 (100.0%) | $81,563 |
Family Income by Number of Earners in Pea Ridge
The median family income in Pea Ridge is $81,563, with families comprising 1 earner (287) having the highest median family income of $90,781, while families with no earners (106) have the lowest median family income of $44,786, accounting for 30.6% and 11.3% of families, respectively.
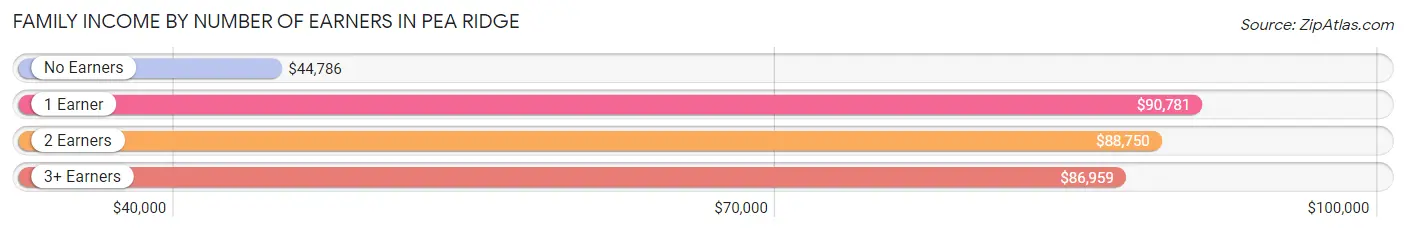
| Number of Earners | # Families | Median Income |
| No Earners | 106 (11.3%) | $44,786 |
| 1 Earner | 287 (30.6%) | $90,781 |
| 2 Earners | 395 (42.1%) | $88,750 |
| 3+ Earners | 150 (16.0%) | $86,959 |
| Total | 938 (100.0%) | $81,563 |
Household Income in Pea Ridge
Household Income Brackets in Pea Ridge
With 291 households falling in the category, the $50,000 to $74,999 income range is the most frequent in Pea Ridge, accounting for 20.1% of all households. In contrast, only 12 households (0.8%) fall into the less than $10,000 income bracket, making it the least populous group.
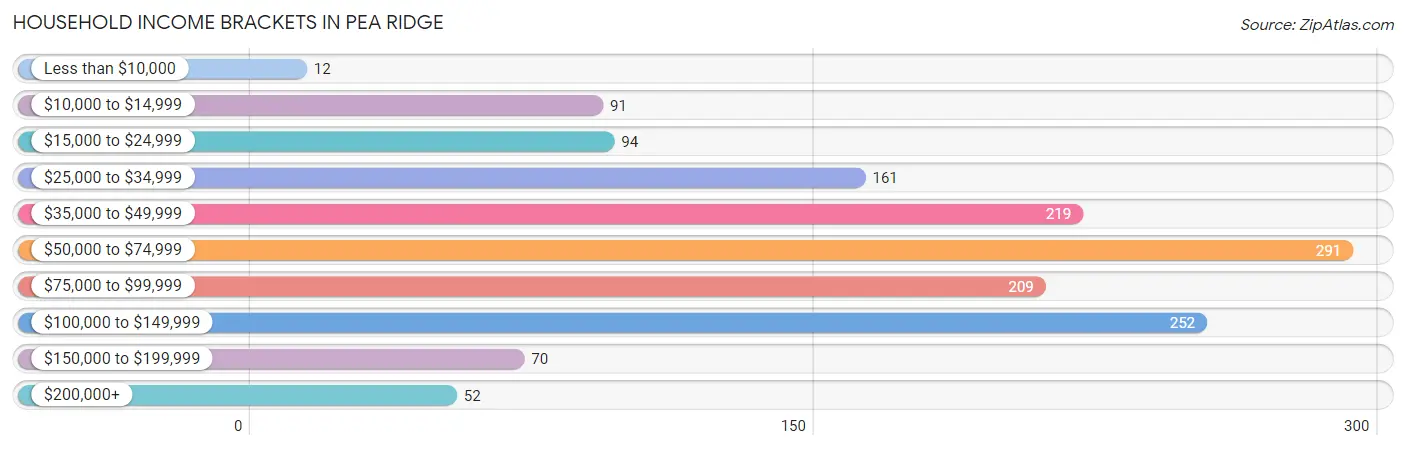
| Income Bracket | # Households | % Households |
| Less than $10,000 | 12 | 0.8% |
| $10,000 to $14,999 | 91 | 6.3% |
| $15,000 to $24,999 | 94 | 6.5% |
| $25,000 to $34,999 | 161 | 11.1% |
| $35,000 to $49,999 | 219 | 15.1% |
| $50,000 to $74,999 | 291 | 20.1% |
| $75,000 to $99,999 | 209 | 14.4% |
| $100,000 to $149,999 | 252 | 17.4% |
| $150,000 to $199,999 | 70 | 4.8% |
| $200,000+ | 52 | 3.6% |
Household Income by Householder Age in Pea Ridge
The median household income in Pea Ridge is $58,490, with the highest median household income of $74,152 found in the 45 to 64 years age bracket for the primary householder. A total of 553 households (38.2%) fall into this category. Meanwhile, the 15 to 24 years age bracket for the primary householder has the lowest median household income of $0, with 72 households (5.0%) in this group.
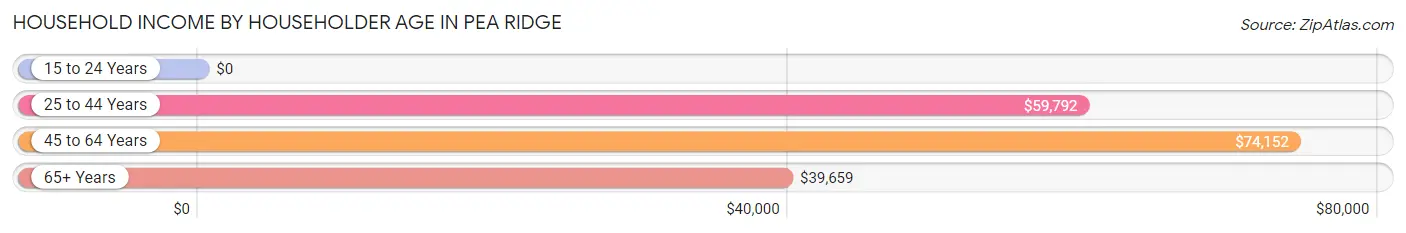
| Income Bracket | # Households | Median Income |
| 15 to 24 Years | 72 (5.0%) | $0 |
| 25 to 44 Years | 492 (34.0%) | $59,792 |
| 45 to 64 Years | 553 (38.2%) | $74,152 |
| 65+ Years | 331 (22.9%) | $39,659 |
| Total | 1,448 (100.0%) | $58,490 |
Poverty in Pea Ridge
Income Below Poverty by Sex and Age in Pea Ridge
With 3.6% poverty level for males and 3.2% for females among the residents of Pea Ridge, 65 to 74 year old males and 75 year old and over females are the most vulnerable to poverty, with 29 males (22.0%) and 39 females (20.4%) in their respective age groups living below the poverty level.
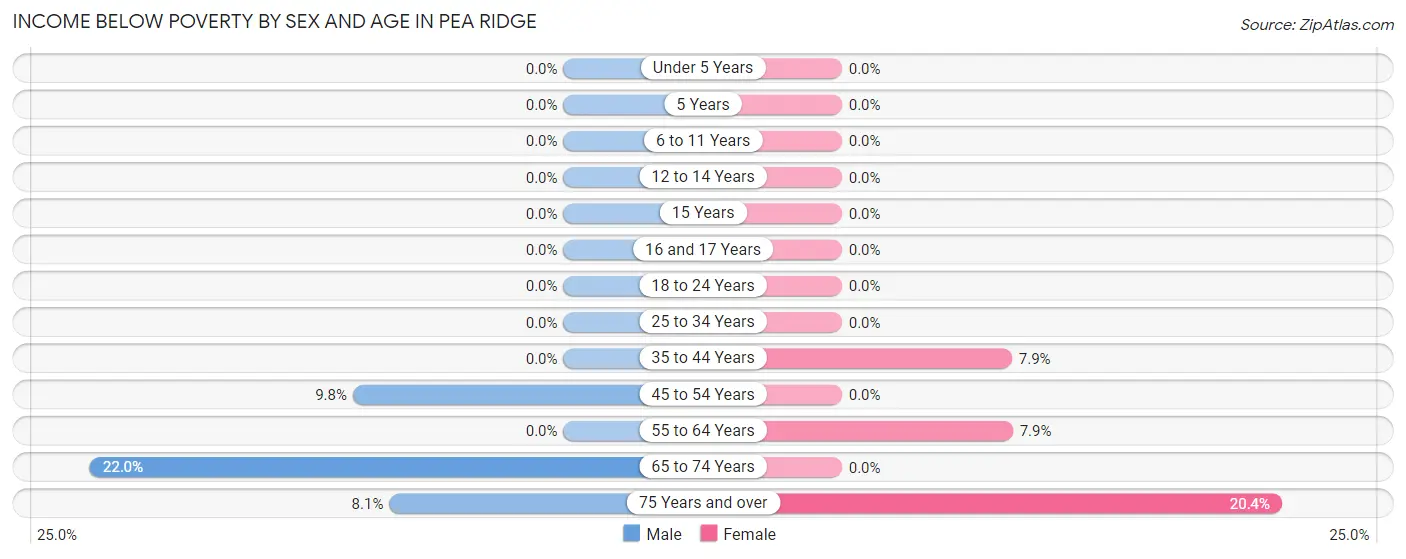
| Age Bracket | Male | Female |
| Under 5 Years | 0 (0.0%) | 0 (0.0%) |
| 5 Years | 0 (0.0%) | 0 (0.0%) |
| 6 to 11 Years | 0 (0.0%) | 0 (0.0%) |
| 12 to 14 Years | 0 (0.0%) | 0 (0.0%) |
| 15 Years | 0 (0.0%) | 0 (0.0%) |
| 16 and 17 Years | 0 (0.0%) | 0 (0.0%) |
| 18 to 24 Years | 0 (0.0%) | 0 (0.0%) |
| 25 to 34 Years | 0 (0.0%) | 0 (0.0%) |
| 35 to 44 Years | 0 (0.0%) | 9 (7.9%) |
| 45 to 54 Years | 30 (9.8%) | 0 (0.0%) |
| 55 to 64 Years | 0 (0.0%) | 13 (7.9%) |
| 65 to 74 Years | 29 (22.0%) | 0 (0.0%) |
| 75 Years and over | 8 (8.1%) | 39 (20.4%) |
| Total | 67 (3.6%) | 61 (3.2%) |
Income Above Poverty by Sex and Age in Pea Ridge
According to the poverty statistics in Pea Ridge, males aged under 5 years and females aged under 5 years are the age groups that are most secure financially, with 100.0% of males and 100.0% of females in these age groups living above the poverty line.
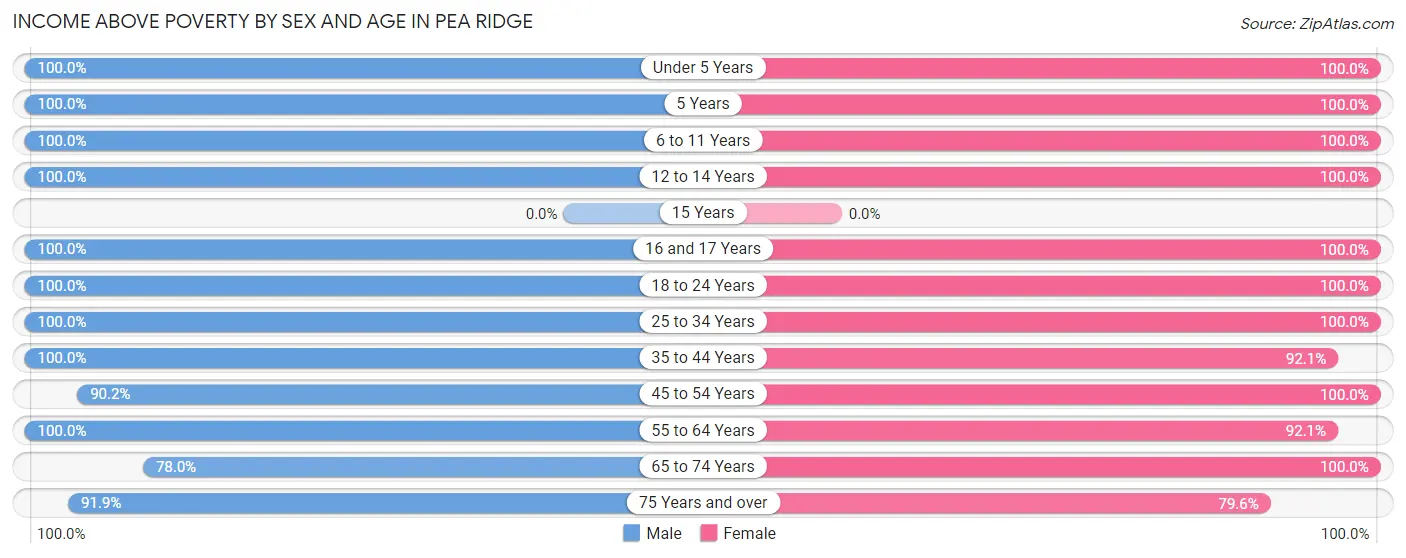
| Age Bracket | Male | Female |
| Under 5 Years | 89 (100.0%) | 138 (100.0%) |
| 5 Years | 1 (100.0%) | 48 (100.0%) |
| 6 to 11 Years | 135 (100.0%) | 176 (100.0%) |
| 12 to 14 Years | 65 (100.0%) | 81 (100.0%) |
| 15 Years | 0 (0.0%) | 0 (0.0%) |
| 16 and 17 Years | 65 (100.0%) | 56 (100.0%) |
| 18 to 24 Years | 175 (100.0%) | 167 (100.0%) |
| 25 to 34 Years | 393 (100.0%) | 256 (100.0%) |
| 35 to 44 Years | 212 (100.0%) | 105 (92.1%) |
| 45 to 54 Years | 277 (90.2%) | 375 (100.0%) |
| 55 to 64 Years | 183 (100.0%) | 151 (92.1%) |
| 65 to 74 Years | 103 (78.0%) | 120 (100.0%) |
| 75 Years and over | 91 (91.9%) | 152 (79.6%) |
| Total | 1,789 (96.4%) | 1,825 (96.8%) |
Income Below Poverty Among Married-Couple Families in Pea Ridge
The poverty statistics for married-couple families in Pea Ridge show that 3.3% or 25 of the total 761 families live below the poverty line. Families with no children have the highest poverty rate of 7.1%, comprising of 25 families. On the other hand, families with 1 or 2 children have the lowest poverty rate of 0.0%, which includes 0 families.
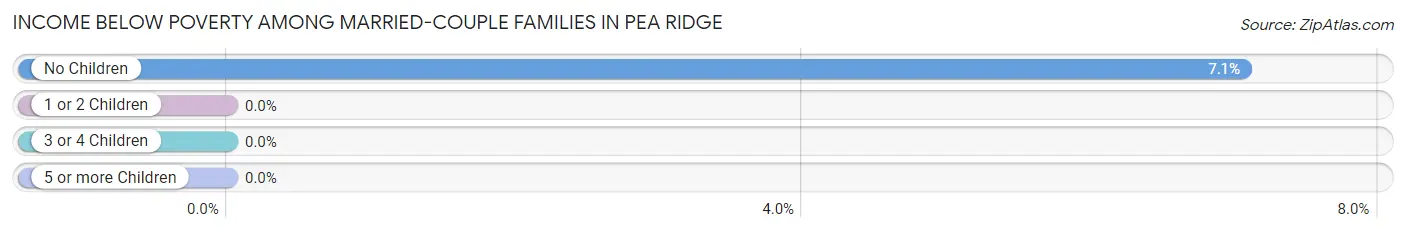
| Children | Above Poverty | Below Poverty |
| No Children | 329 (92.9%) | 25 (7.1%) |
| 1 or 2 Children | 336 (100.0%) | 0 (0.0%) |
| 3 or 4 Children | 71 (100.0%) | 0 (0.0%) |
| 5 or more Children | 0 (0.0%) | 0 (0.0%) |
| Total | 736 (96.7%) | 25 (3.3%) |
Income Below Poverty Among Single-Parent Households in Pea Ridge
| Children | Single Father | Single Mother |
| No Children | 0 (0.0%) | 0 (0.0%) |
| 1 or 2 Children | 0 (0.0%) | 0 (0.0%) |
| 3 or 4 Children | 0 (0.0%) | 0 (0.0%) |
| 5 or more Children | 0 (0.0%) | 0 (0.0%) |
| Total | 0 (0.0%) | 0 (0.0%) |
Income Below Poverty Among Married-Couple vs Single-Parent Households in Pea Ridge
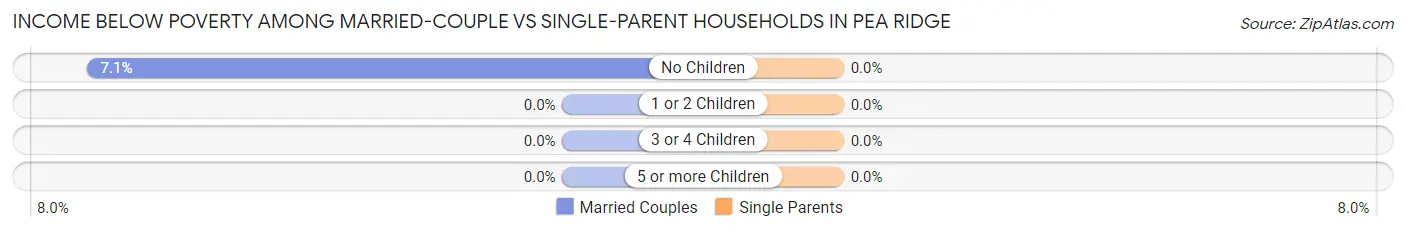
| Children | Married-Couple Families | Single-Parent Households |
| No Children | 25 (7.1%) | 0 (0.0%) |
| 1 or 2 Children | 0 (0.0%) | 0 (0.0%) |
| 3 or 4 Children | 0 (0.0%) | 0 (0.0%) |
| 5 or more Children | 0 (0.0%) | 0 (0.0%) |
| Total | 25 (3.3%) | 0 (0.0%) |
Race in Pea Ridge
The most populous races in Pea Ridge are White / Caucasian (3,294 | 87.5%), Two or more Races (281 | 7.5%), and Hispanic or Latino (191 | 5.1%).
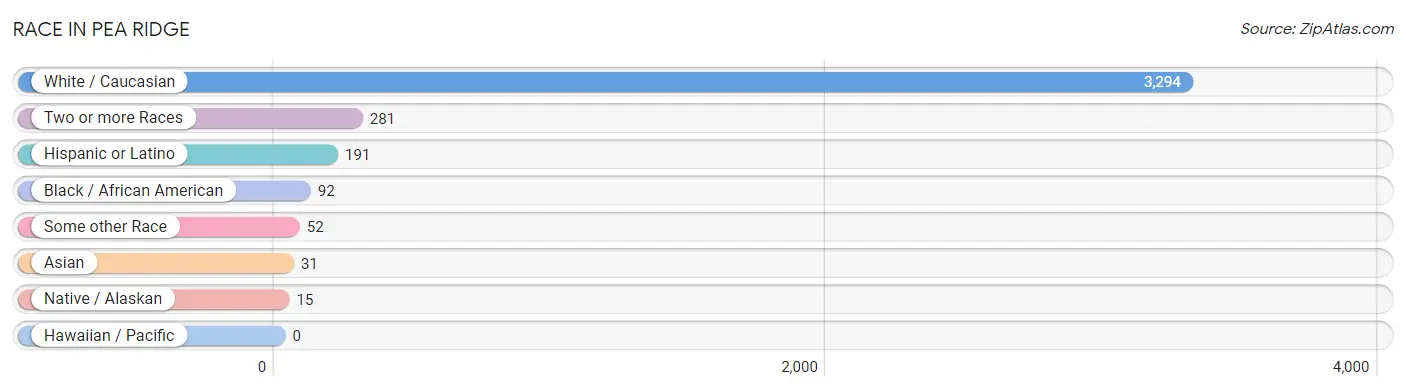
| Race | # Population | % Population |
| Asian | 31 | 0.8% |
| Black / African American | 92 | 2.4% |
| Hawaiian / Pacific | 0 | 0.0% |
| Hispanic or Latino | 191 | 5.1% |
| Native / Alaskan | 15 | 0.4% |
| White / Caucasian | 3,294 | 87.5% |
| Two or more Races | 281 | 7.5% |
| Some other Race | 52 | 1.4% |
| Total | 3,765 | 100.0% |
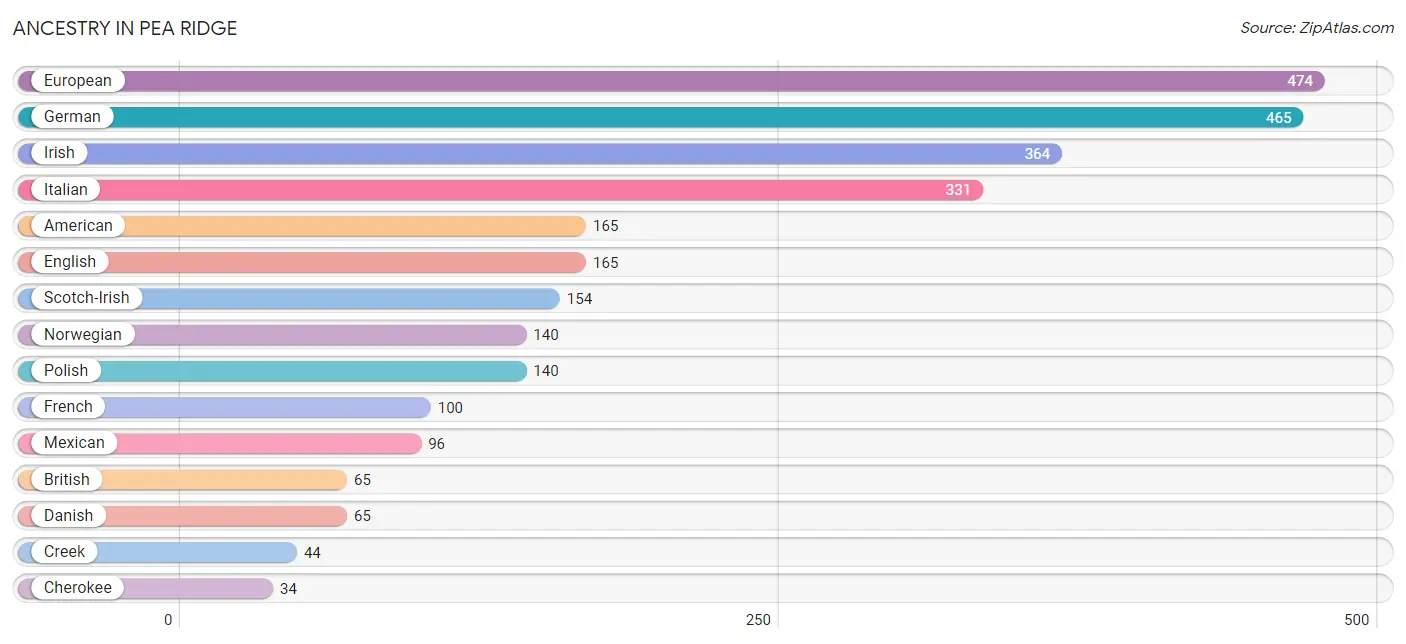
Ancestry in Pea Ridge
The most populous ancestries reported in Pea Ridge are European (474 | 12.6%), German (465 | 12.3%), Irish (364 | 9.7%), Italian (331 | 8.8%), and American (165 | 4.4%), together accounting for 47.8% of all Pea Ridge residents.
| Ancestry | # Population | % Population |
| African | 29 | 0.8% |
| American | 165 | 4.4% |
| Austrian | 16 | 0.4% |
| British | 65 | 1.7% |
| Central American | 32 | 0.9% |
| Cherokee | 34 | 0.9% |
| Creek | 44 | 1.2% |
| Czech | 19 | 0.5% |
| Danish | 65 | 1.7% |
| Dutch | 18 | 0.5% |
| English | 165 | 4.4% |
| European | 474 | 12.6% |
| Finnish | 14 | 0.4% |
| French | 100 | 2.7% |
| French Canadian | 11 | 0.3% |
| German | 465 | 12.3% |
| Hungarian | 10 | 0.3% |
| Icelander | 13 | 0.4% |
| Irish | 364 | 9.7% |
| Italian | 331 | 8.8% |
| Korean | 31 | 0.8% |
| Lithuanian | 21 | 0.6% |
| Mexican | 96 | 2.5% |
| Norwegian | 140 | 3.7% |
| Panamanian | 32 | 0.9% |
| Polish | 140 | 3.7% |
| Puerto Rican | 9 | 0.2% |
| Scotch-Irish | 154 | 4.1% |
| Spaniard | 23 | 0.6% |
| Spanish | 31 | 0.8% |
| Subsaharan African | 29 | 0.8% |
| Swedish | 12 | 0.3% |
| Welsh | 20 | 0.5% | View All 33 Rows |
Immigrants in Pea Ridge
The most numerous immigrant groups reported in Pea Ridge came from Asia (31 | 0.8%), Philippines (31 | 0.8%), South Eastern Asia (31 | 0.8%), Central America (21 | 0.6%), and Latin America (21 | 0.6%), together accounting for 3.6% of all Pea Ridge residents.
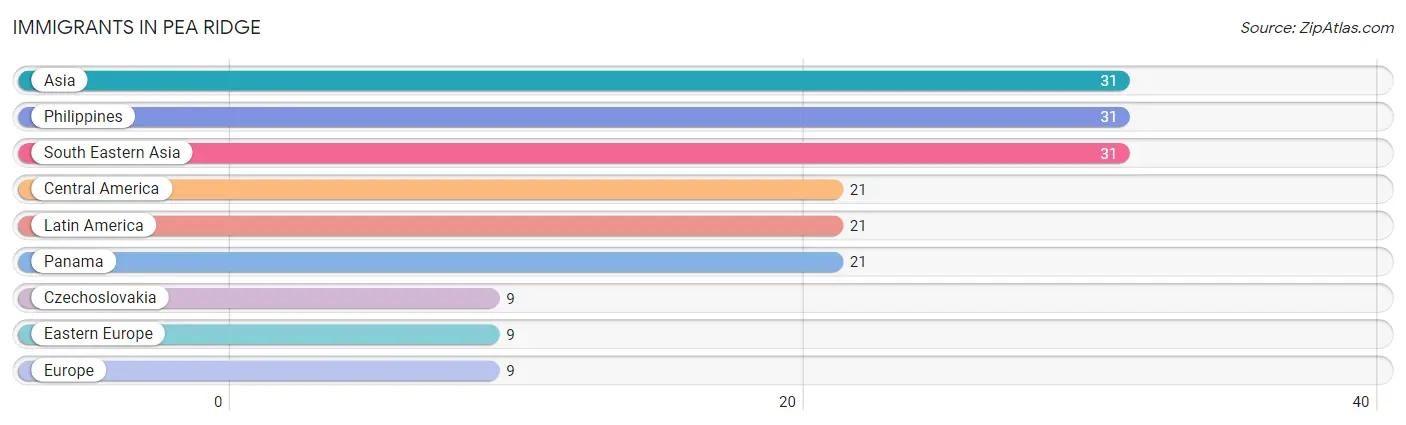
| Immigration Origin | # Population | % Population |
| Asia | 31 | 0.8% |
| Central America | 21 | 0.6% |
| Czechoslovakia | 9 | 0.2% |
| Eastern Europe | 9 | 0.2% |
| Europe | 9 | 0.2% |
| Latin America | 21 | 0.6% |
| Panama | 21 | 0.6% |
| Philippines | 31 | 0.8% |
| South Eastern Asia | 31 | 0.8% | View All 9 Rows |
Sex and Age in Pea Ridge
Sex and Age in Pea Ridge
The most populous age groups in Pea Ridge are 25 to 29 Years (232 | 12.5%) for men and 45 to 49 Years (285 | 14.9%) for women.
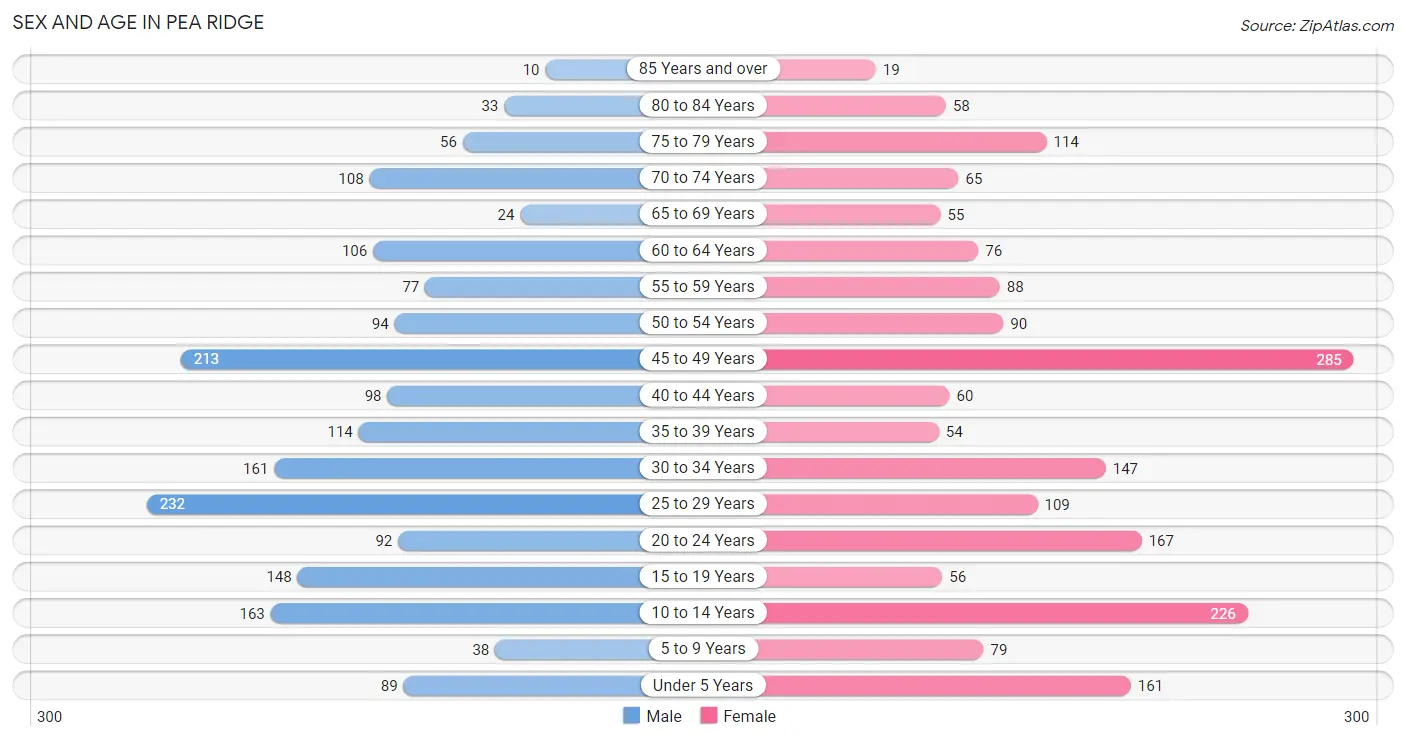
| Age Bracket | Male | Female |
| Under 5 Years | 89 (4.8%) | 161 (8.4%) |
| 5 to 9 Years | 38 (2.1%) | 79 (4.1%) |
| 10 to 14 Years | 163 (8.8%) | 226 (11.8%) |
| 15 to 19 Years | 148 (8.0%) | 56 (2.9%) |
| 20 to 24 Years | 92 (5.0%) | 167 (8.7%) |
| 25 to 29 Years | 232 (12.5%) | 109 (5.7%) |
| 30 to 34 Years | 161 (8.7%) | 147 (7.7%) |
| 35 to 39 Years | 114 (6.1%) | 54 (2.8%) |
| 40 to 44 Years | 98 (5.3%) | 60 (3.1%) |
| 45 to 49 Years | 213 (11.5%) | 285 (14.9%) |
| 50 to 54 Years | 94 (5.1%) | 90 (4.7%) |
| 55 to 59 Years | 77 (4.2%) | 88 (4.6%) |
| 60 to 64 Years | 106 (5.7%) | 76 (4.0%) |
| 65 to 69 Years | 24 (1.3%) | 55 (2.9%) |
| 70 to 74 Years | 108 (5.8%) | 65 (3.4%) |
| 75 to 79 Years | 56 (3.0%) | 114 (6.0%) |
| 80 to 84 Years | 33 (1.8%) | 58 (3.0%) |
| 85 Years and over | 10 (0.5%) | 19 (1.0%) |
| Total | 1,856 (100.0%) | 1,909 (100.0%) |
Families and Households in Pea Ridge
Median Family Size in Pea Ridge
The median family size in Pea Ridge is 3.32 persons per family, with single female/mother families (137 | 14.6%) accounting for the largest median family size of 3.66 persons per family. On the other hand, single male/father families (40 | 4.3%) represent the smallest median family size with 2.78 persons per family.
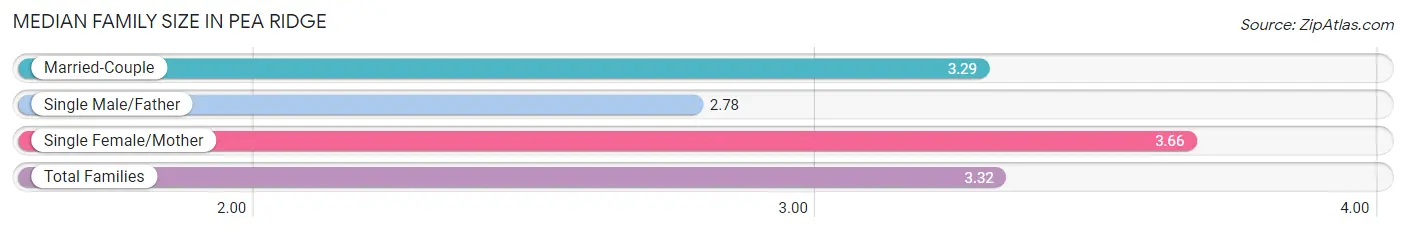
| Family Type | # Families | Family Size |
| Married-Couple | 761 (81.1%) | 3.29 |
| Single Male/Father | 40 (4.3%) | 2.78 |
| Single Female/Mother | 137 (14.6%) | 3.66 |
| Total Families | 938 (100.0%) | 3.32 |
Median Household Size in Pea Ridge
The median household size in Pea Ridge is 2.60 persons per household, with single female/mother households (137 | 9.5%) accounting for the largest median household size of 3.84 persons per household. non-family households (510 | 35.2%) represent the smallest median household size with 1.18 persons per household.
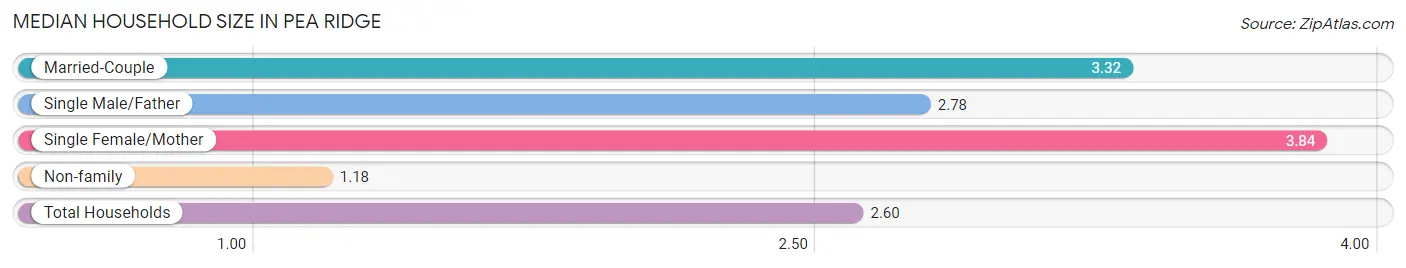
| Household Type | # Households | Household Size |
| Married-Couple | 761 (52.6%) | 3.32 |
| Single Male/Father | 40 (2.8%) | 2.78 |
| Single Female/Mother | 137 (9.5%) | 3.84 |
| Non-family | 510 (35.2%) | 1.18 |
| Total Households | 1,448 (100.0%) | 2.60 |
Household Size by Marriage Status in Pea Ridge
Out of a total of 1,448 households in Pea Ridge, 938 (64.8%) are family households, while 510 (35.2%) are nonfamily households. The most numerous type of family households are 3-person households, comprising 345, and the most common type of nonfamily households are 1-person households, comprising 410.
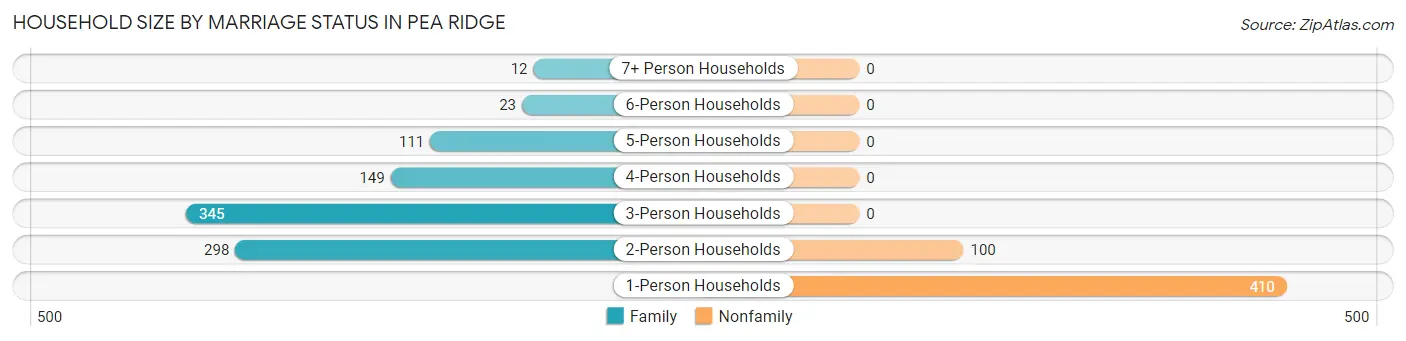
| Household Size | Family Households | Nonfamily Households |
| 1-Person Households | - | 410 (28.3%) |
| 2-Person Households | 298 (20.6%) | 100 (6.9%) |
| 3-Person Households | 345 (23.8%) | 0 (0.0%) |
| 4-Person Households | 149 (10.3%) | 0 (0.0%) |
| 5-Person Households | 111 (7.7%) | 0 (0.0%) |
| 6-Person Households | 23 (1.6%) | 0 (0.0%) |
| 7+ Person Households | 12 (0.8%) | 0 (0.0%) |
| Total | 938 (64.8%) | 510 (35.2%) |
Female Fertility in Pea Ridge
Fertility by Age in Pea Ridge
Average fertility rate in Pea Ridge is 110.0 births per 1,000 women. Women in the age bracket of 20 to 34 years have the highest fertility rate with 234.0 births per 1,000 women. Women in the age bracket of 20 to 34 years acount for 100.0% of all women with births.
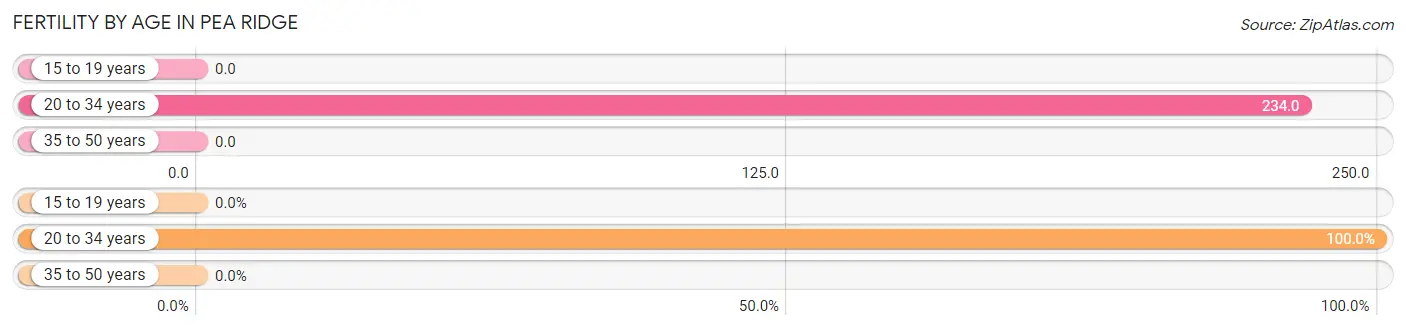
| Age Bracket | Women with Births | Births / 1,000 Women |
| 15 to 19 years | 0 (0.0%) | 0.0 |
| 20 to 34 years | 99 (100.0%) | 234.0 |
| 35 to 50 years | 0 (0.0%) | 0.0 |
| Total | 99 (100.0%) | 110.0 |
Fertility by Age by Marriage Status in Pea Ridge
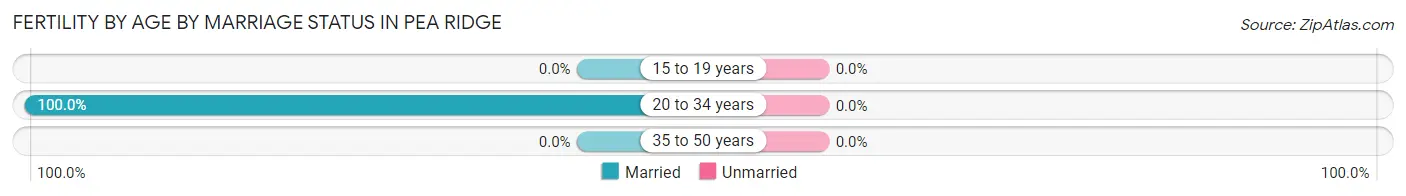
| Age Bracket | Married | Unmarried |
| 15 to 19 years | 0 (0.0%) | 0 (0.0%) |
| 20 to 34 years | 99 (100.0%) | 0 (0.0%) |
| 35 to 50 years | 0 (0.0%) | 0 (0.0%) |
| Total | 99 (100.0%) | 0 (0.0%) |
Fertility by Education in Pea Ridge
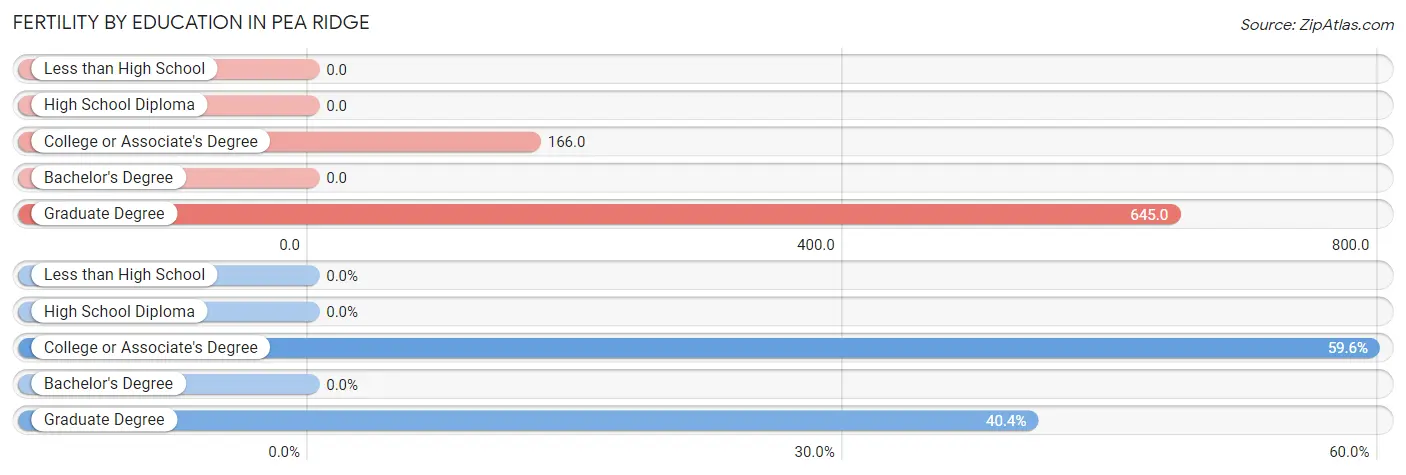
| Educational Attainment | Women with Births | Births / 1,000 Women |
| Less than High School | 0 (0.0%) | 0.0 |
| High School Diploma | 0 (0.0%) | 0.0 |
| College or Associate's Degree | 59 (59.6%) | 166.0 |
| Bachelor's Degree | 0 (0.0%) | 0.0 |
| Graduate Degree | 40 (40.4%) | 645.0 |
| Total | 99 (100.0%) | 110.0 |
Fertility by Education by Marriage Status in Pea Ridge
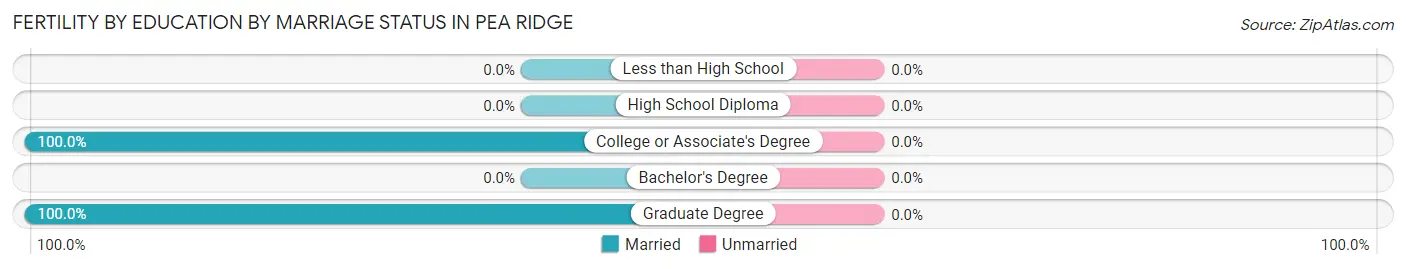
| Educational Attainment | Married | Unmarried |
| Less than High School | 0 (0.0%) | 0 (0.0%) |
| High School Diploma | 0 (0.0%) | 0 (0.0%) |
| College or Associate's Degree | 59 (100.0%) | 0 (0.0%) |
| Bachelor's Degree | 0 (0.0%) | 0 (0.0%) |
| Graduate Degree | 40 (100.0%) | 0 (0.0%) |
| Total | 99 (100.0%) | 0 (0.0%) |
Employment Characteristics in Pea Ridge
Employment by Class of Employer in Pea Ridge
Among the 1,855 employed individuals in Pea Ridge, private company employees (1,227 | 66.1%), not-for-profit organizations (161 | 8.7%), and local government employees (133 | 7.2%) make up the most common classes of employment.
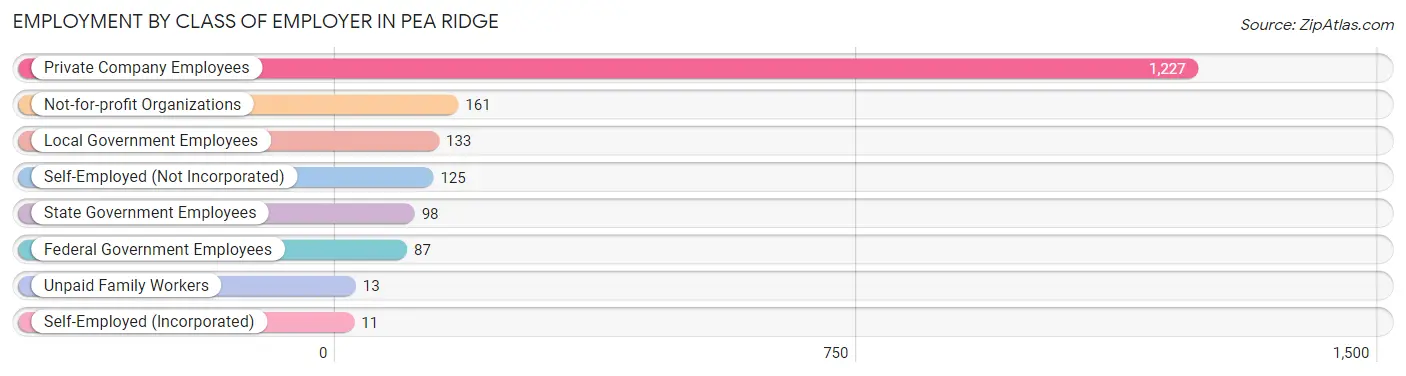
| Employer Class | # Employees | % Employees |
| Private Company Employees | 1,227 | 66.1% |
| Self-Employed (Incorporated) | 11 | 0.6% |
| Self-Employed (Not Incorporated) | 125 | 6.7% |
| Not-for-profit Organizations | 161 | 8.7% |
| Local Government Employees | 133 | 7.2% |
| State Government Employees | 98 | 5.3% |
| Federal Government Employees | 87 | 4.7% |
| Unpaid Family Workers | 13 | 0.7% |
| Total | 1,855 | 100.0% |
Employment Status by Age in Pea Ridge
According to the labor force statistics for Pea Ridge, out of the total population over 16 years of age (3,009), 65.8% or 1,980 individuals are in the labor force, with 1.6% or 32 of them unemployed. The age group with the highest labor force participation rate is 45 to 54 years, with 92.4% or 630 individuals in the labor force. Within the labor force, the 20 to 24 years age range has the highest percentage of unemployed individuals, with 8.4% or 17 of them being unemployed.
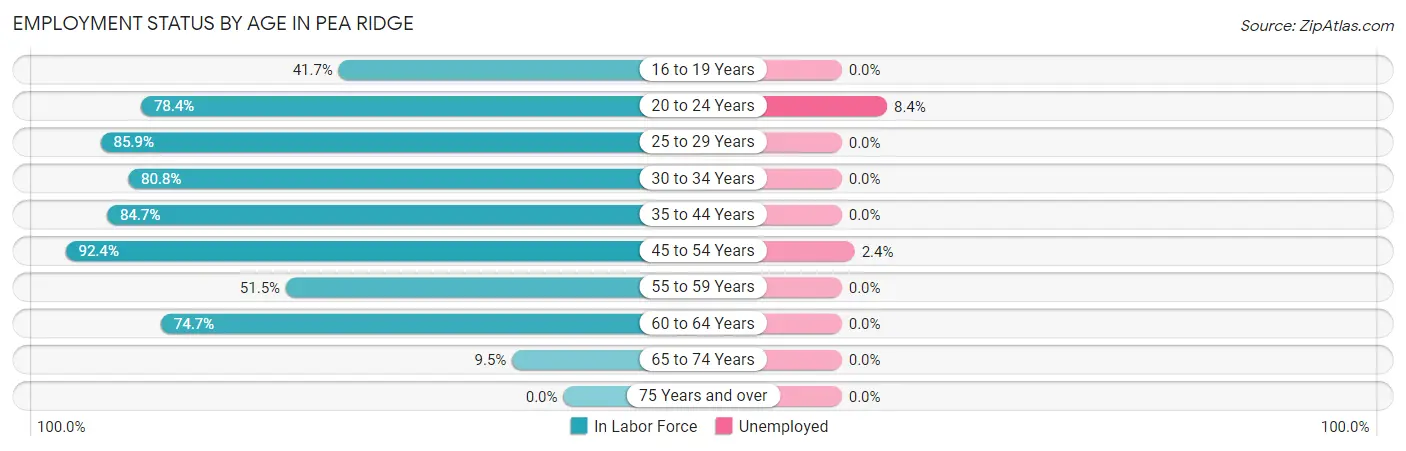
| Age Bracket | In Labor Force | Unemployed |
| 16 to 19 Years | 85 (41.7%) | 0 (0.0%) |
| 20 to 24 Years | 203 (78.4%) | 17 (8.4%) |
| 25 to 29 Years | 293 (85.9%) | 0 (0.0%) |
| 30 to 34 Years | 249 (80.8%) | 0 (0.0%) |
| 35 to 44 Years | 276 (84.7%) | 0 (0.0%) |
| 45 to 54 Years | 630 (92.4%) | 15 (2.4%) |
| 55 to 59 Years | 85 (51.5%) | 0 (0.0%) |
| 60 to 64 Years | 136 (74.7%) | 0 (0.0%) |
| 65 to 74 Years | 24 (9.5%) | 0 (0.0%) |
| 75 Years and over | 0 (0.0%) | 0 (0.0%) |
| Total | 1,980 (65.8%) | 32 (1.6%) |
Employment Status by Educational Attainment in Pea Ridge
According to labor force statistics for Pea Ridge, 83.3% of individuals (1,669) out of the total population between 25 and 64 years of age (2,004) are in the labor force, with 0.9% or 15 of them being unemployed. The group with the highest labor force participation rate are those with the educational attainment of bachelor's degree or higher, with 91.5% or 408 individuals in the labor force. Within the labor force, individuals with college / associate degree education have the highest percentage of unemployment, with 2.6% or 15 of them being unemployed.
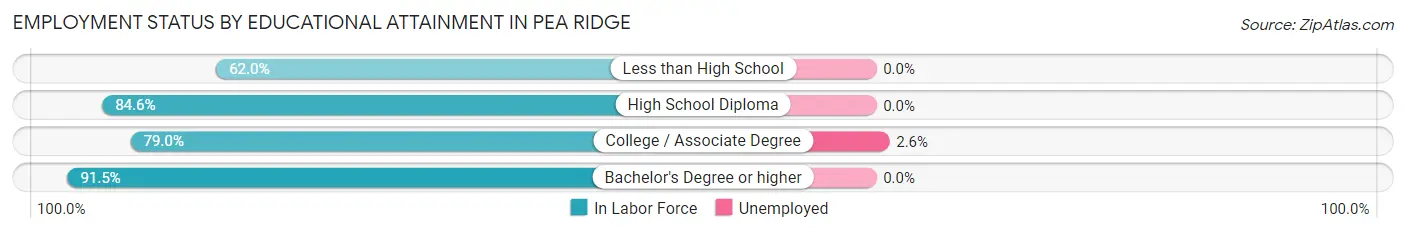
| Educational Attainment | In Labor Force | Unemployed |
| Less than High School | 44 (62.0%) | 0 (0.0%) |
| High School Diploma | 638 (84.6%) | 0 (0.0%) |
| College / Associate Degree | 579 (79.0%) | 19 (2.6%) |
| Bachelor's Degree or higher | 408 (91.5%) | 0 (0.0%) |
| Total | 1,669 (83.3%) | 18 (0.9%) |
Employment Occupations by Sex in Pea Ridge
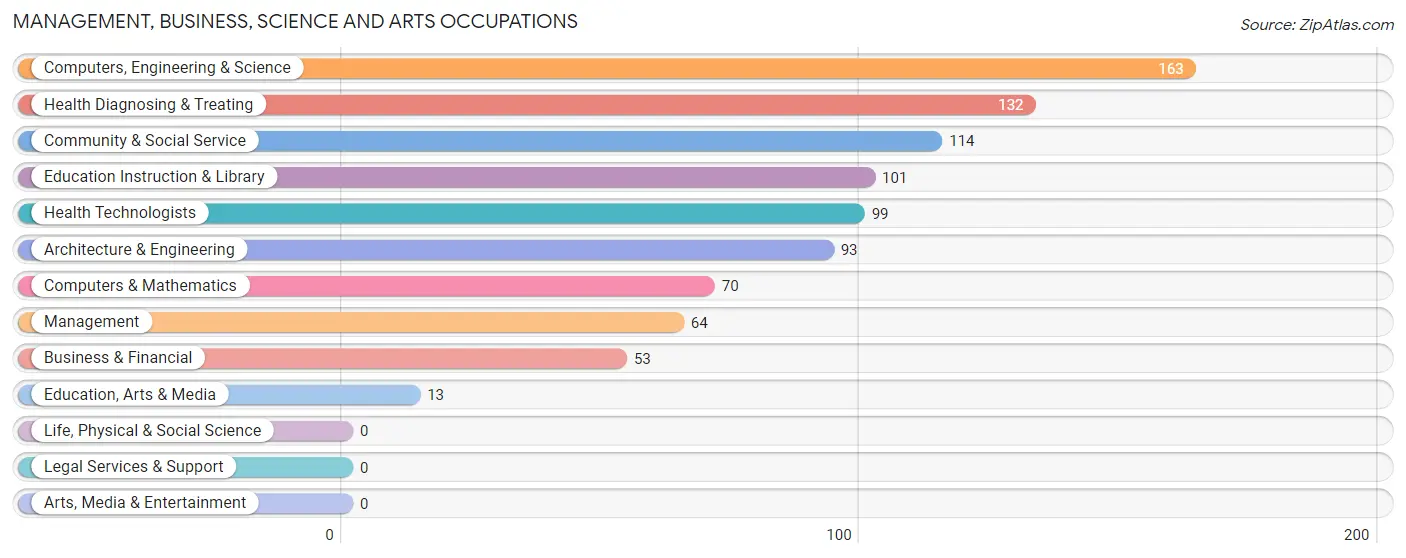
Management, Business, Science and Arts Occupations
The most common Management, Business, Science and Arts occupations in Pea Ridge are Computers, Engineering & Science (163 | 8.4%), Health Diagnosing & Treating (132 | 6.8%), Community & Social Service (114 | 5.9%), Education Instruction & Library (101 | 5.2%), and Health Technologists (99 | 5.1%).
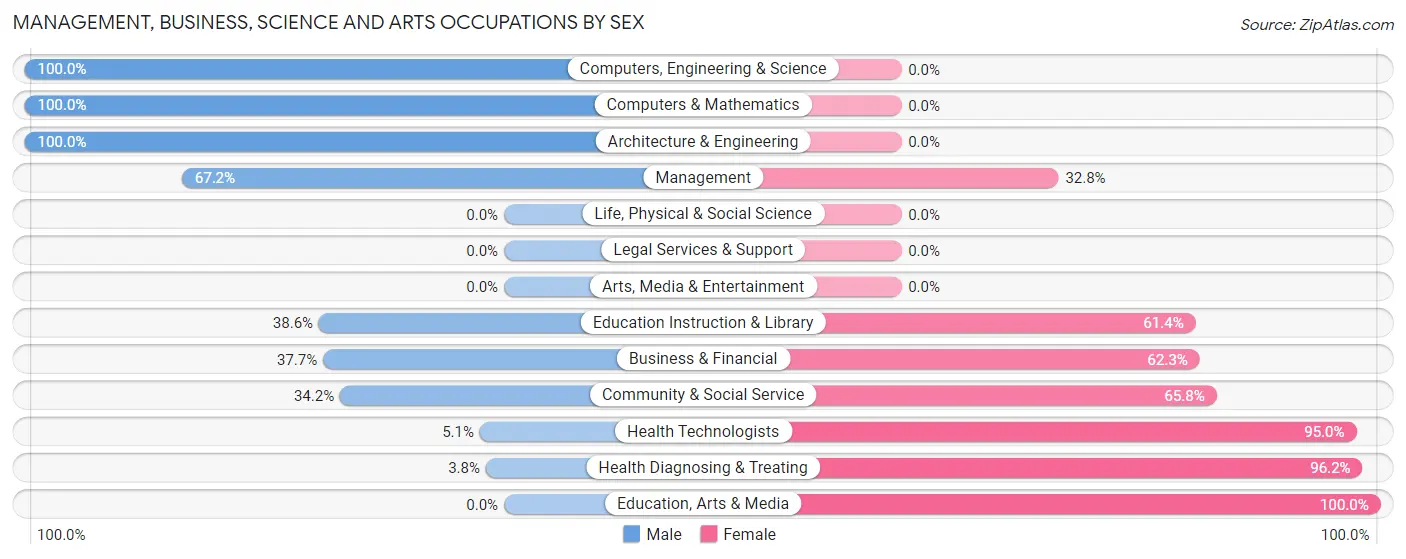
Management, Business, Science and Arts Occupations by Sex
Within the Management, Business, Science and Arts occupations in Pea Ridge, the most male-oriented occupations are Computers, Engineering & Science (100.0%), Computers & Mathematics (100.0%), and Architecture & Engineering (100.0%), while the most female-oriented occupations are Education, Arts & Media (100.0%), Health Diagnosing & Treating (96.2%), and Health Technologists (95.0%).
| Occupation | Male | Female |
| Management | 43 (67.2%) | 21 (32.8%) |
| Business & Financial | 20 (37.7%) | 33 (62.3%) |
| Computers, Engineering & Science | 163 (100.0%) | 0 (0.0%) |
| Computers & Mathematics | 70 (100.0%) | 0 (0.0%) |
| Architecture & Engineering | 93 (100.0%) | 0 (0.0%) |
| Life, Physical & Social Science | 0 (0.0%) | 0 (0.0%) |
| Community & Social Service | 39 (34.2%) | 75 (65.8%) |
| Education, Arts & Media | 0 (0.0%) | 13 (100.0%) |
| Legal Services & Support | 0 (0.0%) | 0 (0.0%) |
| Education Instruction & Library | 39 (38.6%) | 62 (61.4%) |
| Arts, Media & Entertainment | 0 (0.0%) | 0 (0.0%) |
| Health Diagnosing & Treating | 5 (3.8%) | 127 (96.2%) |
| Health Technologists | 5 (5.1%) | 94 (95.0%) |
| Total (Category) | 270 (51.3%) | 256 (48.7%) |
| Total (Overall) | 1,054 (54.1%) | 895 (45.9%) |
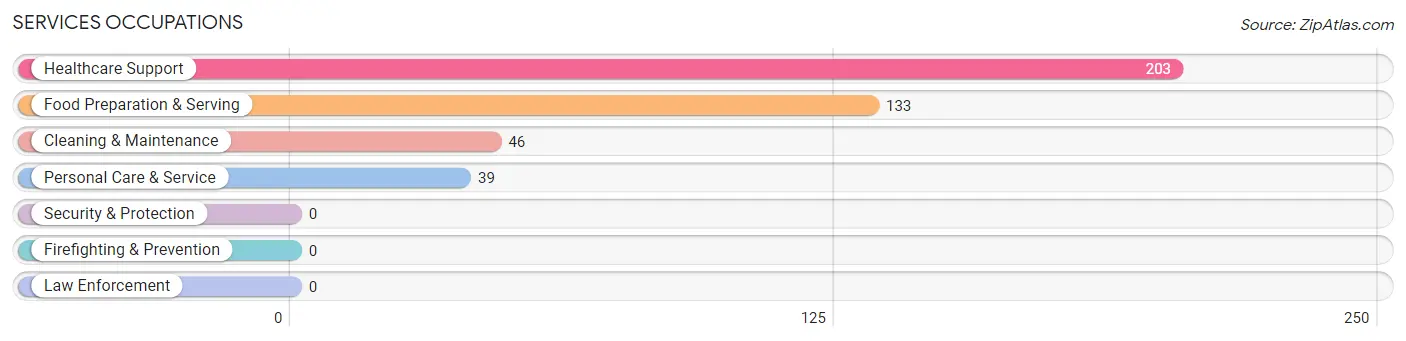
Services Occupations
The most common Services occupations in Pea Ridge are Healthcare Support (203 | 10.4%), Food Preparation & Serving (133 | 6.8%), Cleaning & Maintenance (46 | 2.4%), and Personal Care & Service (39 | 2.0%).
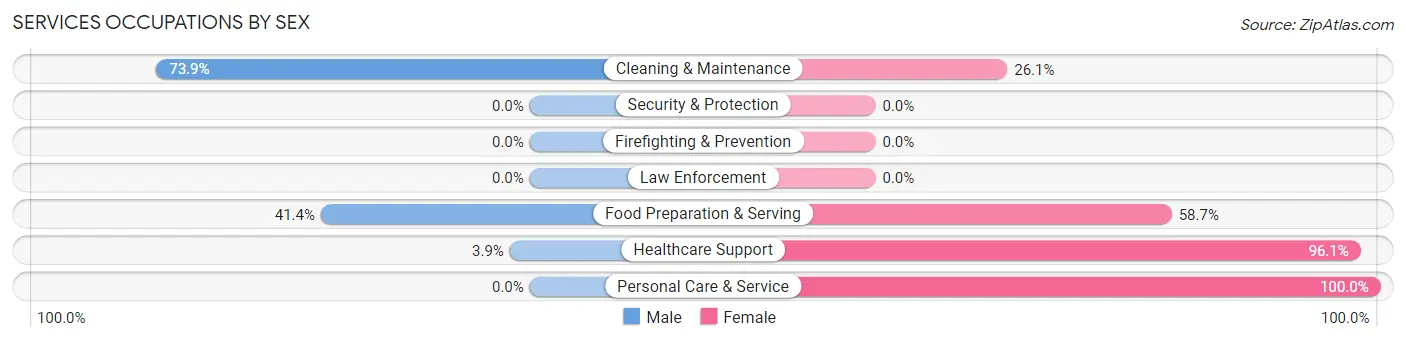
Services Occupations by Sex
Within the Services occupations in Pea Ridge, the most male-oriented occupations are Cleaning & Maintenance (73.9%), Food Preparation & Serving (41.3%), and Healthcare Support (3.9%), while the most female-oriented occupations are Personal Care & Service (100.0%), Healthcare Support (96.1%), and Food Preparation & Serving (58.7%).
| Occupation | Male | Female |
| Healthcare Support | 8 (3.9%) | 195 (96.1%) |
| Security & Protection | 0 (0.0%) | 0 (0.0%) |
| Firefighting & Prevention | 0 (0.0%) | 0 (0.0%) |
| Law Enforcement | 0 (0.0%) | 0 (0.0%) |
| Food Preparation & Serving | 55 (41.3%) | 78 (58.7%) |
| Cleaning & Maintenance | 34 (73.9%) | 12 (26.1%) |
| Personal Care & Service | 0 (0.0%) | 39 (100.0%) |
| Total (Category) | 97 (23.0%) | 324 (77.0%) |
| Total (Overall) | 1,054 (54.1%) | 895 (45.9%) |
Sales and Office Occupations
The most common Sales and Office occupations in Pea Ridge are Office & Administration (290 | 14.9%), and Sales & Related (177 | 9.1%).
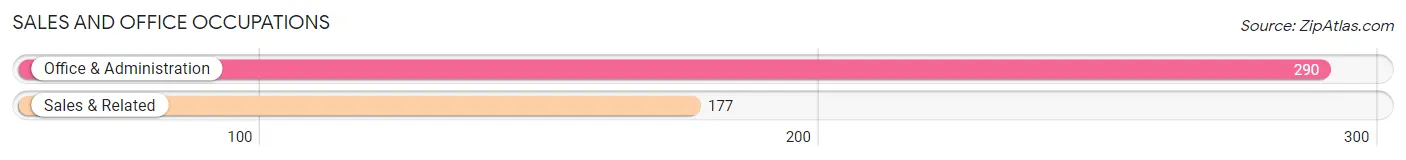
Sales and Office Occupations by Sex
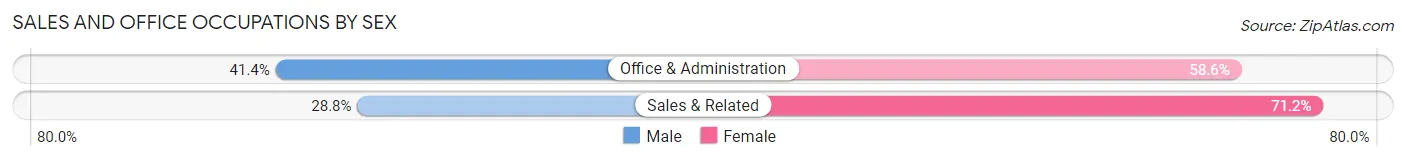
| Occupation | Male | Female |
| Sales & Related | 51 (28.8%) | 126 (71.2%) |
| Office & Administration | 120 (41.4%) | 170 (58.6%) |
| Total (Category) | 171 (36.6%) | 296 (63.4%) |
| Total (Overall) | 1,054 (54.1%) | 895 (45.9%) |
Natural Resources, Construction and Maintenance Occupations
The most common Natural Resources, Construction and Maintenance occupations in Pea Ridge are Construction & Extraction (162 | 8.3%), and Installation, Maintenance & Repair (147 | 7.5%).
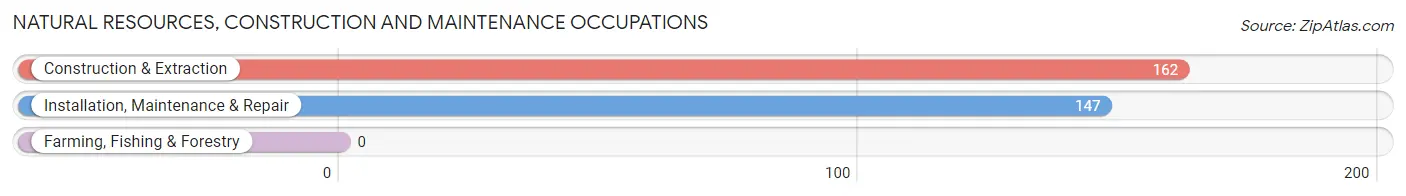
Natural Resources, Construction and Maintenance Occupations by Sex

| Occupation | Male | Female |
| Farming, Fishing & Forestry | 0 (0.0%) | 0 (0.0%) |
| Construction & Extraction | 162 (100.0%) | 0 (0.0%) |
| Installation, Maintenance & Repair | 147 (100.0%) | 0 (0.0%) |
| Total (Category) | 309 (100.0%) | 0 (0.0%) |
| Total (Overall) | 1,054 (54.1%) | 895 (45.9%) |
Production, Transportation and Moving Occupations
The most common Production, Transportation and Moving occupations in Pea Ridge are Material Moving (110 | 5.6%), Transportation (60 | 3.1%), and Production (56 | 2.9%).
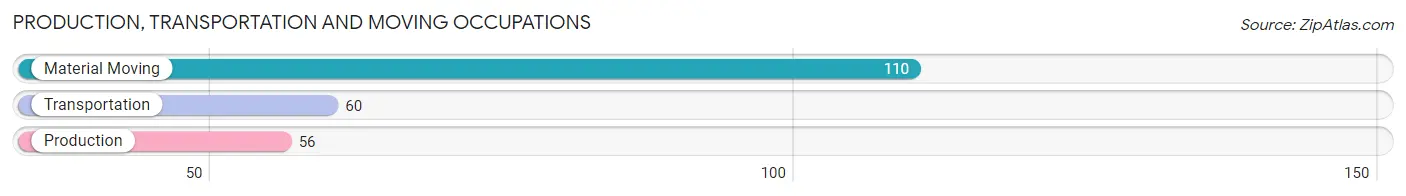
Production, Transportation and Moving Occupations by Sex
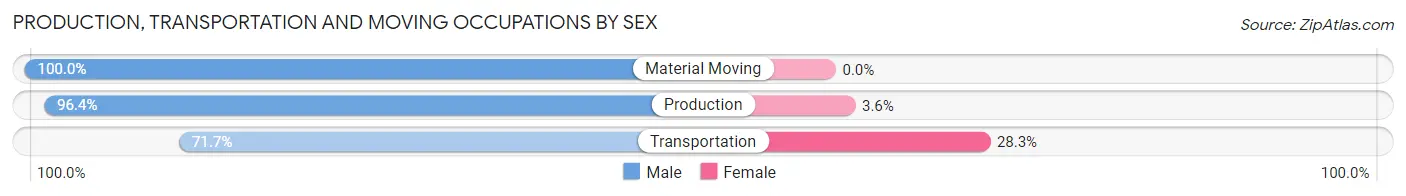
| Occupation | Male | Female |
| Production | 54 (96.4%) | 2 (3.6%) |
| Transportation | 43 (71.7%) | 17 (28.3%) |
| Material Moving | 110 (100.0%) | 0 (0.0%) |
| Total (Category) | 207 (91.6%) | 19 (8.4%) |
| Total (Overall) | 1,054 (54.1%) | 895 (45.9%) |
Employment Industries by Sex in Pea Ridge
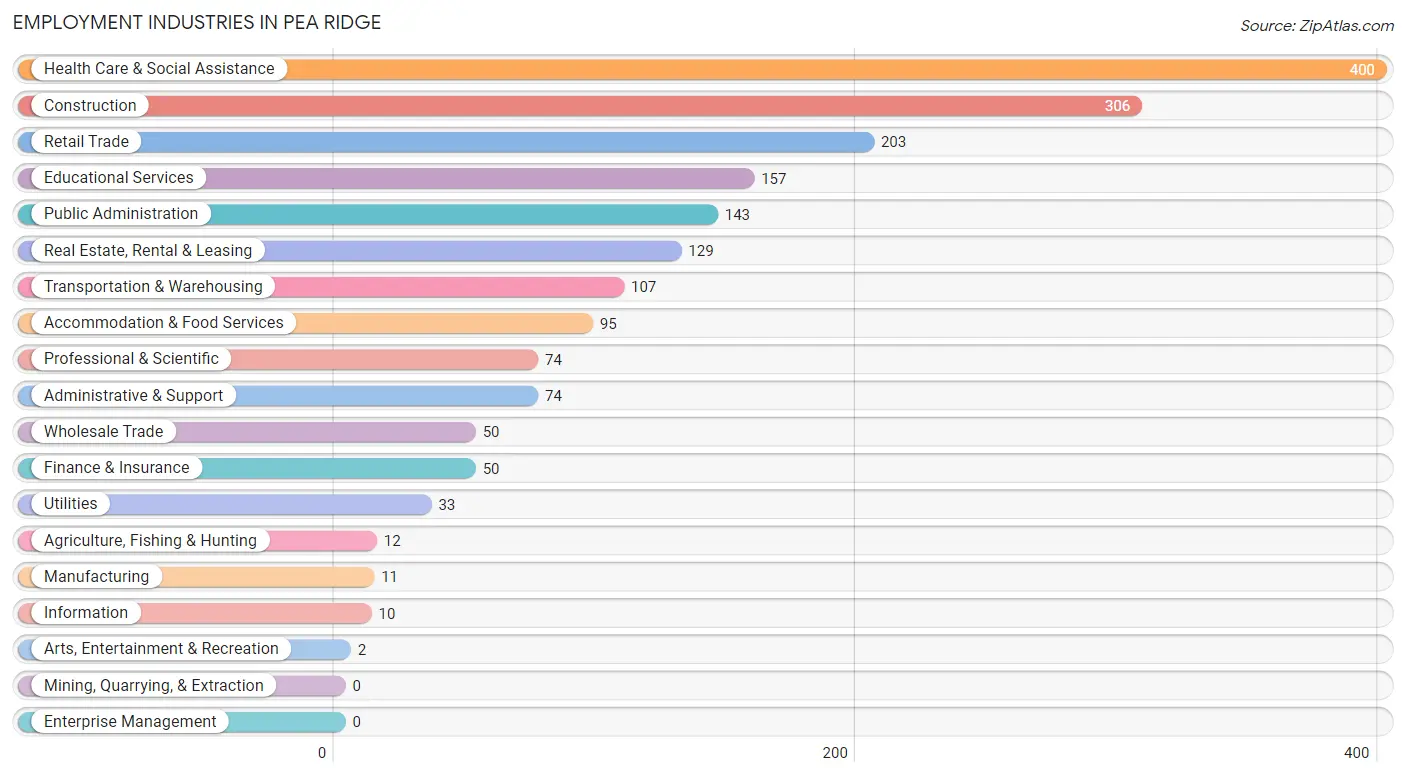
Employment Industries in Pea Ridge
The major employment industries in Pea Ridge include Health Care & Social Assistance (400 | 20.5%), Construction (306 | 15.7%), Retail Trade (203 | 10.4%), Educational Services (157 | 8.1%), and Public Administration (143 | 7.3%).
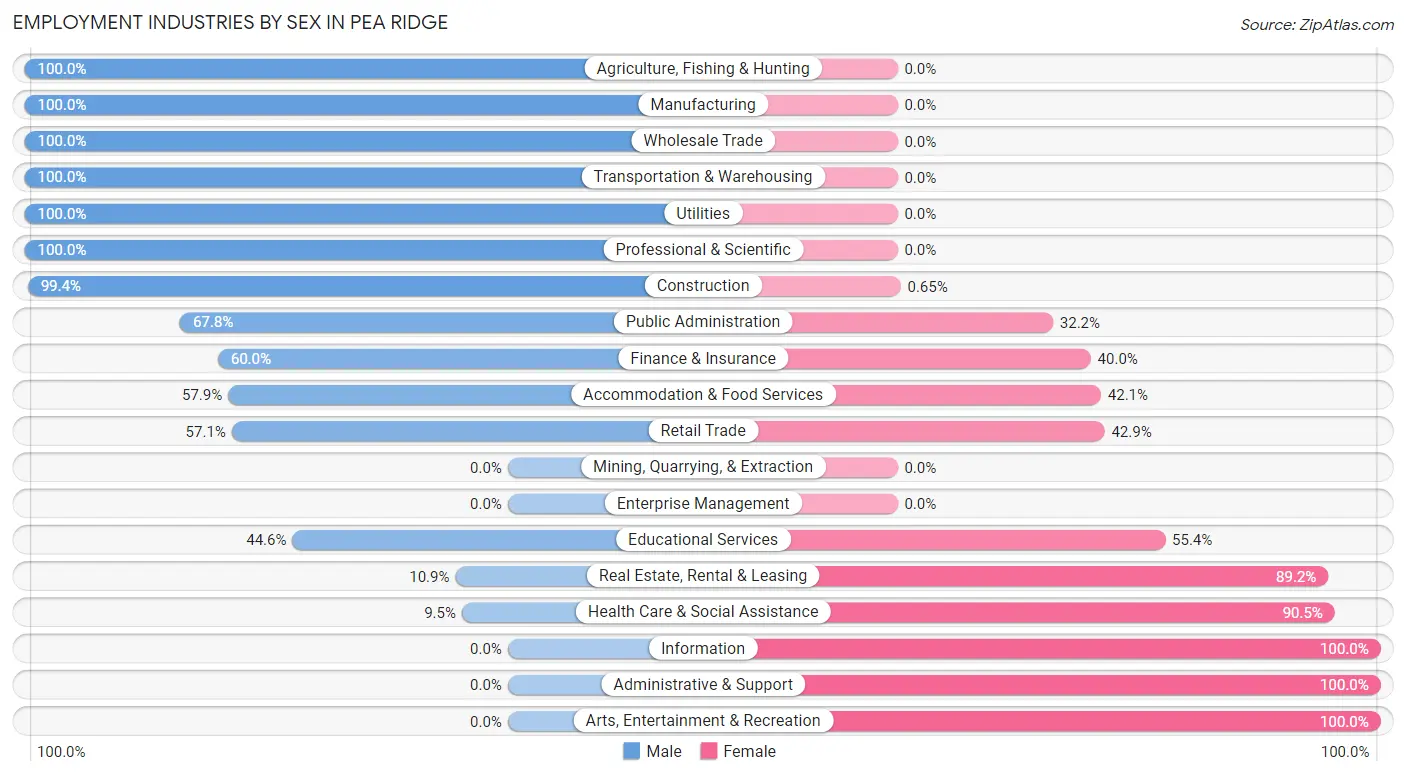
Employment Industries by Sex in Pea Ridge
The Pea Ridge industries that see more men than women are Agriculture, Fishing & Hunting (100.0%), Manufacturing (100.0%), and Wholesale Trade (100.0%), whereas the industries that tend to have a higher number of women are Information (100.0%), Administrative & Support (100.0%), and Arts, Entertainment & Recreation (100.0%).
| Industry | Male | Female |
| Agriculture, Fishing & Hunting | 12 (100.0%) | 0 (0.0%) |
| Mining, Quarrying, & Extraction | 0 (0.0%) | 0 (0.0%) |
| Construction | 304 (99.4%) | 2 (0.6%) |
| Manufacturing | 11 (100.0%) | 0 (0.0%) |
| Wholesale Trade | 50 (100.0%) | 0 (0.0%) |
| Retail Trade | 116 (57.1%) | 87 (42.9%) |
| Transportation & Warehousing | 107 (100.0%) | 0 (0.0%) |
| Utilities | 33 (100.0%) | 0 (0.0%) |
| Information | 0 (0.0%) | 10 (100.0%) |
| Finance & Insurance | 30 (60.0%) | 20 (40.0%) |
| Real Estate, Rental & Leasing | 14 (10.8%) | 115 (89.1%) |
| Professional & Scientific | 74 (100.0%) | 0 (0.0%) |
| Enterprise Management | 0 (0.0%) | 0 (0.0%) |
| Administrative & Support | 0 (0.0%) | 74 (100.0%) |
| Educational Services | 70 (44.6%) | 87 (55.4%) |
| Health Care & Social Assistance | 38 (9.5%) | 362 (90.5%) |
| Arts, Entertainment & Recreation | 0 (0.0%) | 2 (100.0%) |
| Accommodation & Food Services | 55 (57.9%) | 40 (42.1%) |
| Public Administration | 97 (67.8%) | 46 (32.2%) |
| Total | 1,054 (54.1%) | 895 (45.9%) |
Education in Pea Ridge
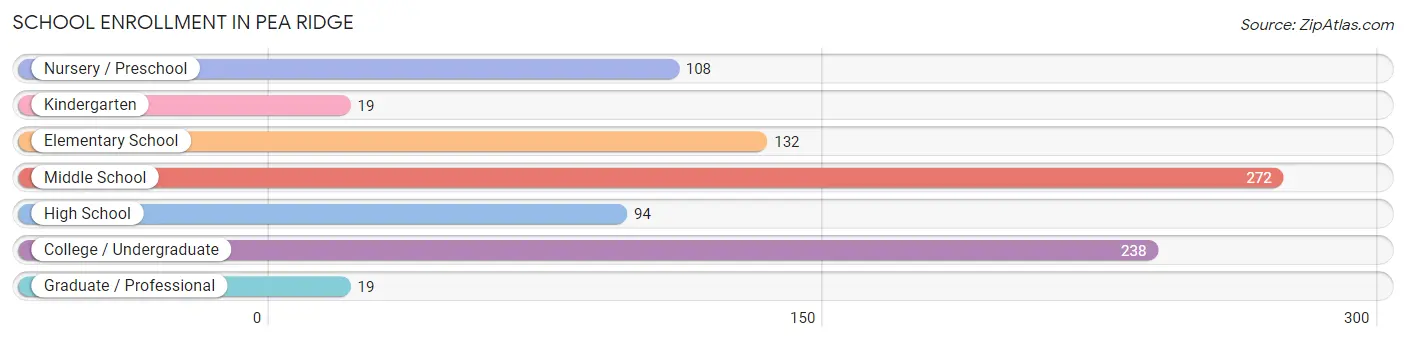
School Enrollment in Pea Ridge
The most common levels of schooling among the 882 students in Pea Ridge are middle school (272 | 30.8%), college / undergraduate (238 | 27.0%), and elementary school (132 | 15.0%).
| School Level | # Students | % Students |
| Nursery / Preschool | 108 | 12.2% |
| Kindergarten | 19 | 2.1% |
| Elementary School | 132 | 15.0% |
| Middle School | 272 | 30.8% |
| High School | 94 | 10.7% |
| College / Undergraduate | 238 | 27.0% |
| Graduate / Professional | 19 | 2.1% |
| Total | 882 | 100.0% |
School Enrollment by Age by Funding Source in Pea Ridge
Out of a total of 882 students who are enrolled in schools in Pea Ridge, 84 (9.5%) attend a private institution, while the remaining 798 (90.5%) are enrolled in public schools. The age group of 35 years and over has the highest likelihood of being enrolled in private schools, with 19 (61.3% in the age bracket) enrolled. Conversely, the age group of 3 to 4 year olds has the lowest likelihood of being enrolled in a private school, with 71 (100.0% in the age bracket) attending a public institution.
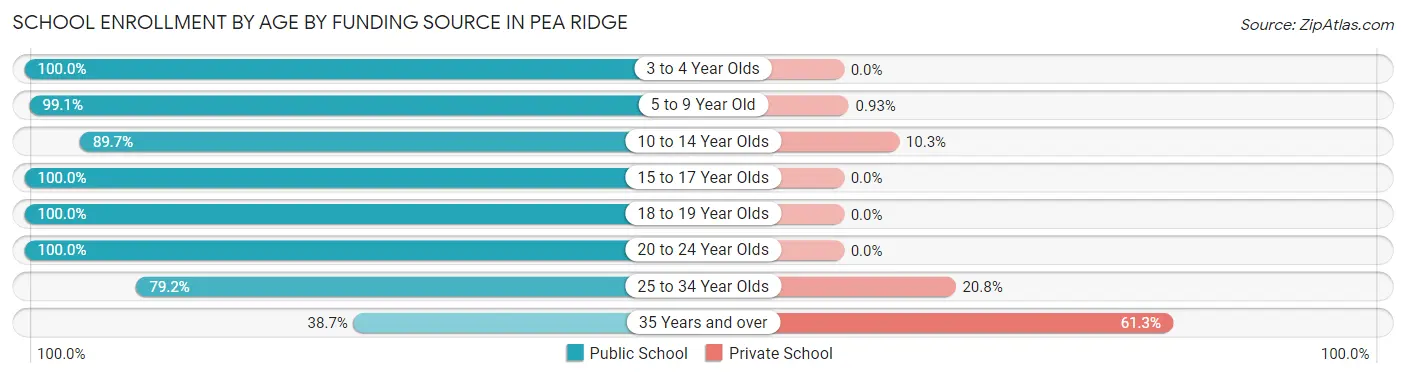
| Age Bracket | Public School | Private School |
| 3 to 4 Year Olds | 71 (100.0%) | 0 (0.0%) |
| 5 to 9 Year Old | 107 (99.1%) | 1 (0.9%) |
| 10 to 14 Year Olds | 340 (89.7%) | 39 (10.3%) |
| 15 to 17 Year Olds | 67 (100.0%) | 0 (0.0%) |
| 18 to 19 Year Olds | 40 (100.0%) | 0 (0.0%) |
| 20 to 24 Year Olds | 66 (100.0%) | 0 (0.0%) |
| 25 to 34 Year Olds | 95 (79.2%) | 25 (20.8%) |
| 35 Years and over | 12 (38.7%) | 19 (61.3%) |
| Total | 798 (90.5%) | 84 (9.5%) |
Educational Attainment by Field of Study in Pea Ridge
Business (134 | 27.4%), education (118 | 24.1%), psychology (63 | 12.9%), arts & humanities (40 | 8.2%), and computers & mathematics (35 | 7.1%) are the most common fields of study among 490 individuals in Pea Ridge who have obtained a bachelor's degree or higher.
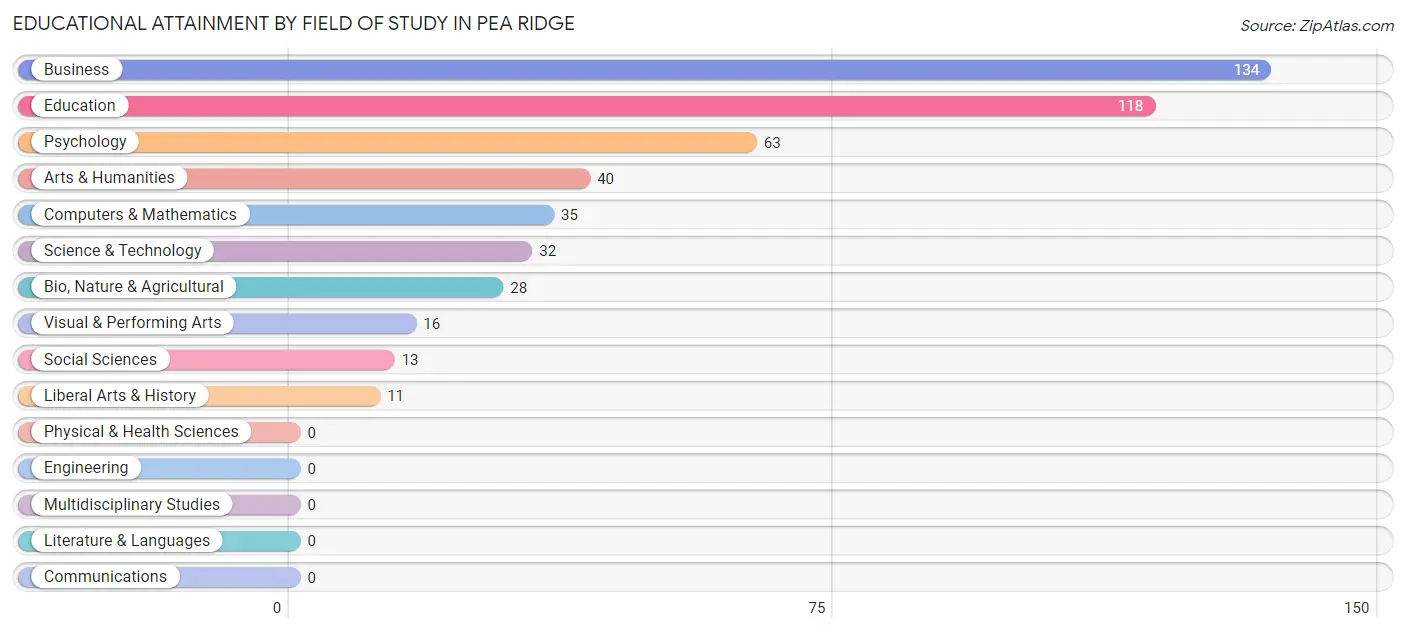
| Field of Study | # Graduates | % Graduates |
| Computers & Mathematics | 35 | 7.1% |
| Bio, Nature & Agricultural | 28 | 5.7% |
| Physical & Health Sciences | 0 | 0.0% |
| Psychology | 63 | 12.9% |
| Social Sciences | 13 | 2.6% |
| Engineering | 0 | 0.0% |
| Multidisciplinary Studies | 0 | 0.0% |
| Science & Technology | 32 | 6.5% |
| Business | 134 | 27.4% |
| Education | 118 | 24.1% |
| Literature & Languages | 0 | 0.0% |
| Liberal Arts & History | 11 | 2.2% |
| Visual & Performing Arts | 16 | 3.3% |
| Communications | 0 | 0.0% |
| Arts & Humanities | 40 | 8.2% |
| Total | 490 | 100.0% |
Transportation & Commute in Pea Ridge
Vehicle Availability by Sex in Pea Ridge
The most prevalent vehicle ownership categories in Pea Ridge are males with 2 vehicles (614, accounting for 58.3%) and females with 2 vehicles (429, making up 76.6%).
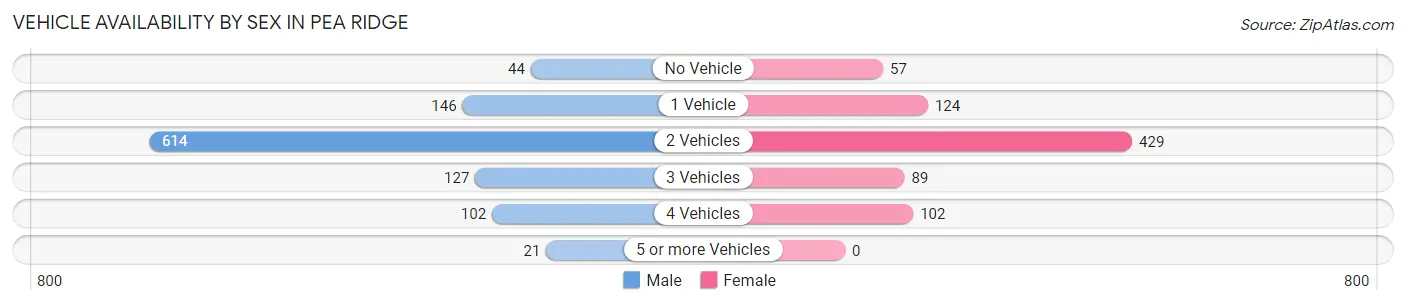
| Vehicles Available | Male | Female |
| No Vehicle | 44 (4.2%) | 57 (7.1%) |
| 1 Vehicle | 146 (13.9%) | 124 (15.5%) |
| 2 Vehicles | 614 (58.3%) | 429 (53.6%) |
| 3 Vehicles | 127 (12.0%) | 89 (11.1%) |
| 4 Vehicles | 102 (9.7%) | 102 (12.7%) |
| 5 or more Vehicles | 21 (2.0%) | 0 (0.0%) |
| Total | 1,054 (100.0%) | 801 (100.0%) |
Commute Time in Pea Ridge
The most frequently occuring commute durations in Pea Ridge are 30 to 34 minutes (451 commuters, 25.4%), 20 to 24 minutes (368 commuters, 20.8%), and 25 to 29 minutes (277 commuters, 15.6%).
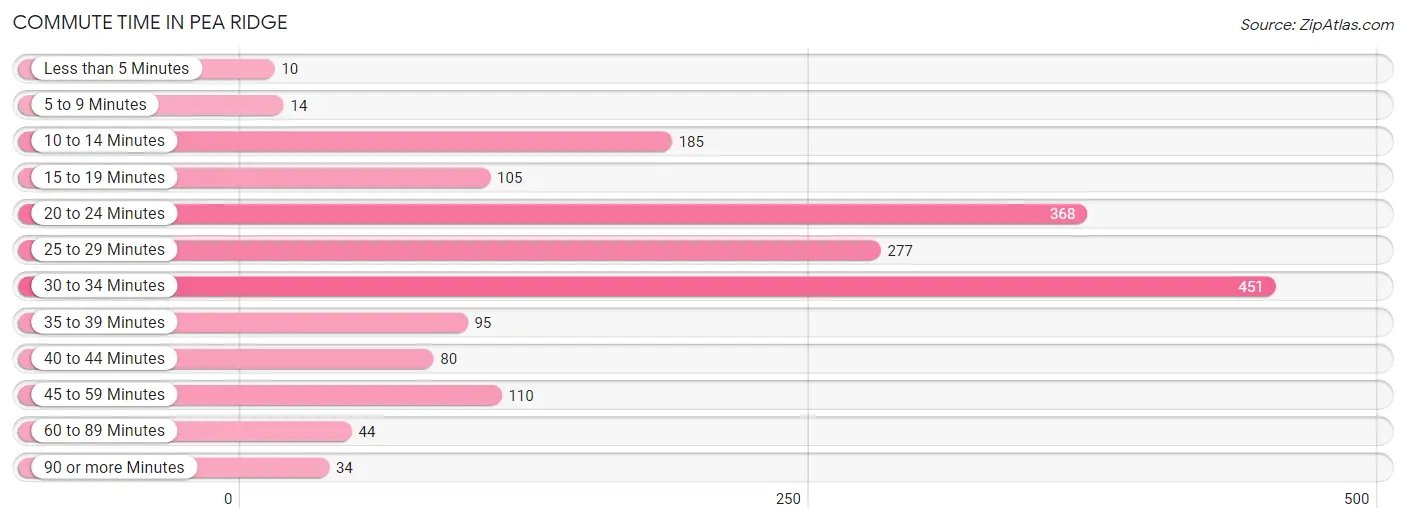
| Commute Time | # Commuters | % Commuters |
| Less than 5 Minutes | 10 | 0.6% |
| 5 to 9 Minutes | 14 | 0.8% |
| 10 to 14 Minutes | 185 | 10.4% |
| 15 to 19 Minutes | 105 | 5.9% |
| 20 to 24 Minutes | 368 | 20.8% |
| 25 to 29 Minutes | 277 | 15.6% |
| 30 to 34 Minutes | 451 | 25.4% |
| 35 to 39 Minutes | 95 | 5.4% |
| 40 to 44 Minutes | 80 | 4.5% |
| 45 to 59 Minutes | 110 | 6.2% |
| 60 to 89 Minutes | 44 | 2.5% |
| 90 or more Minutes | 34 | 1.9% |
Commute Time by Sex in Pea Ridge
The most common commute times in Pea Ridge are 30 to 34 minutes (296 commuters, 29.4%) for males and 20 to 24 minutes (208 commuters, 27.1%) for females.
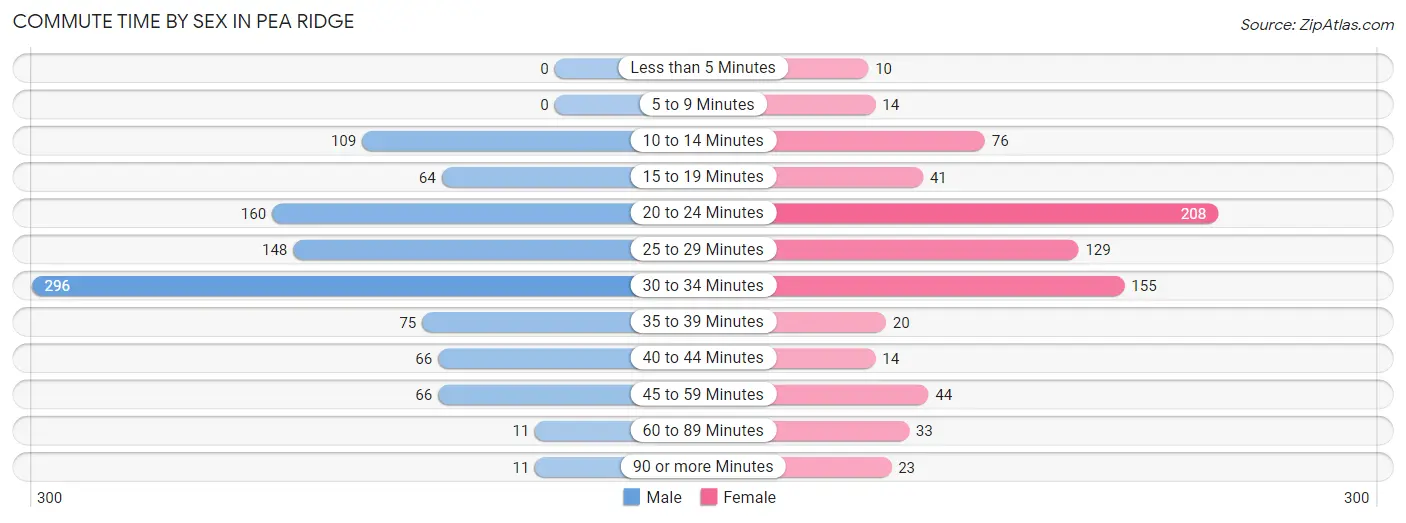
| Commute Time | Male | Female |
| Less than 5 Minutes | 0 (0.0%) | 10 (1.3%) |
| 5 to 9 Minutes | 0 (0.0%) | 14 (1.8%) |
| 10 to 14 Minutes | 109 (10.8%) | 76 (9.9%) |
| 15 to 19 Minutes | 64 (6.4%) | 41 (5.3%) |
| 20 to 24 Minutes | 160 (15.9%) | 208 (27.1%) |
| 25 to 29 Minutes | 148 (14.7%) | 129 (16.8%) |
| 30 to 34 Minutes | 296 (29.4%) | 155 (20.2%) |
| 35 to 39 Minutes | 75 (7.5%) | 20 (2.6%) |
| 40 to 44 Minutes | 66 (6.6%) | 14 (1.8%) |
| 45 to 59 Minutes | 66 (6.6%) | 44 (5.7%) |
| 60 to 89 Minutes | 11 (1.1%) | 33 (4.3%) |
| 90 or more Minutes | 11 (1.1%) | 23 (3.0%) |
Time of Departure to Work by Sex in Pea Ridge
The most frequent times of departure to work in Pea Ridge are 6:00 AM to 6:29 AM (195, 19.4%) for males and 6:00 AM to 6:29 AM (183, 23.9%) for females.
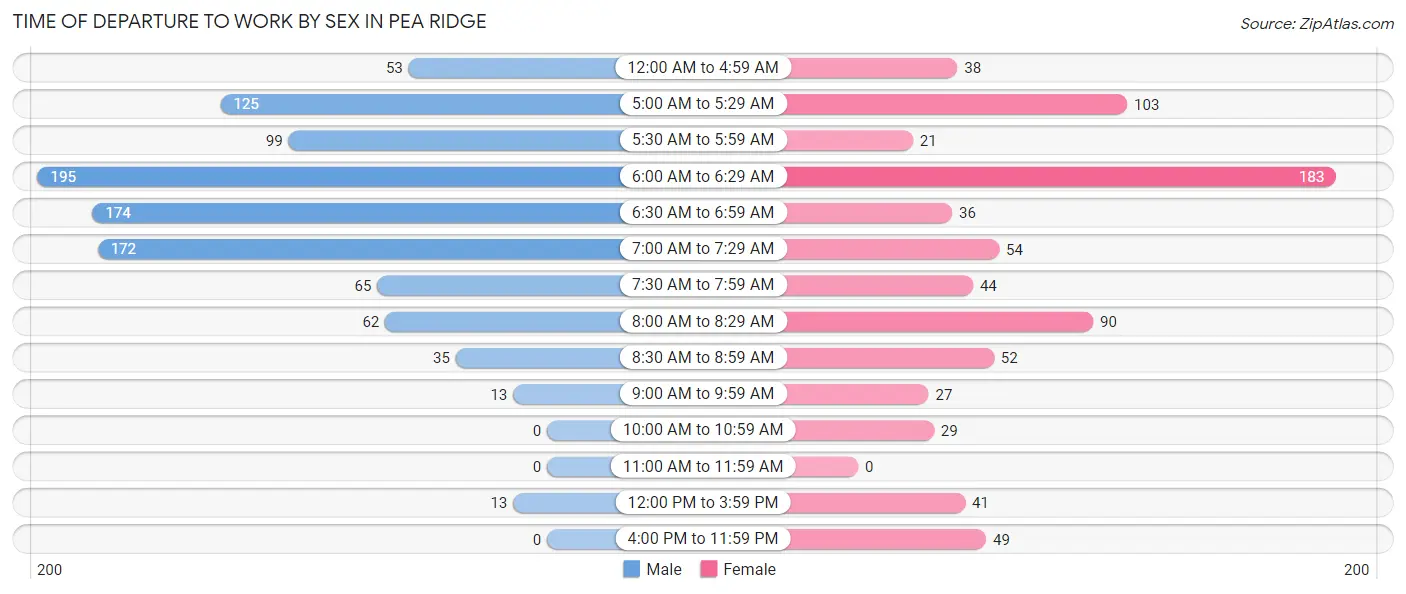
| Time of Departure | Male | Female |
| 12:00 AM to 4:59 AM | 53 (5.3%) | 38 (5.0%) |
| 5:00 AM to 5:29 AM | 125 (12.4%) | 103 (13.4%) |
| 5:30 AM to 5:59 AM | 99 (9.8%) | 21 (2.7%) |
| 6:00 AM to 6:29 AM | 195 (19.4%) | 183 (23.9%) |
| 6:30 AM to 6:59 AM | 174 (17.3%) | 36 (4.7%) |
| 7:00 AM to 7:29 AM | 172 (17.1%) | 54 (7.0%) |
| 7:30 AM to 7:59 AM | 65 (6.5%) | 44 (5.7%) |
| 8:00 AM to 8:29 AM | 62 (6.2%) | 90 (11.7%) |
| 8:30 AM to 8:59 AM | 35 (3.5%) | 52 (6.8%) |
| 9:00 AM to 9:59 AM | 13 (1.3%) | 27 (3.5%) |
| 10:00 AM to 10:59 AM | 0 (0.0%) | 29 (3.8%) |
| 11:00 AM to 11:59 AM | 0 (0.0%) | 0 (0.0%) |
| 12:00 PM to 3:59 PM | 13 (1.3%) | 41 (5.3%) |
| 4:00 PM to 11:59 PM | 0 (0.0%) | 49 (6.4%) |
| Total | 1,006 (100.0%) | 767 (100.0%) |
Housing Occupancy in Pea Ridge
Occupancy by Ownership in Pea Ridge
Of the total 1,448 dwellings in Pea Ridge, owner-occupied units account for 1,067 (73.7%), while renter-occupied units make up 381 (26.3%).
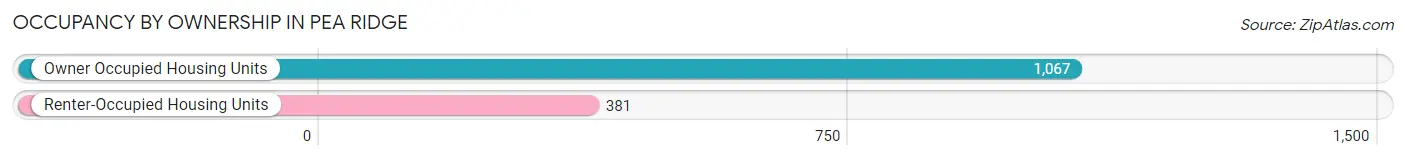
| Occupancy | # Housing Units | % Housing Units |
| Owner Occupied Housing Units | 1,067 | 73.7% |
| Renter-Occupied Housing Units | 381 | 26.3% |
| Total Occupied Housing Units | 1,448 | 100.0% |
Occupancy by Household Size in Pea Ridge
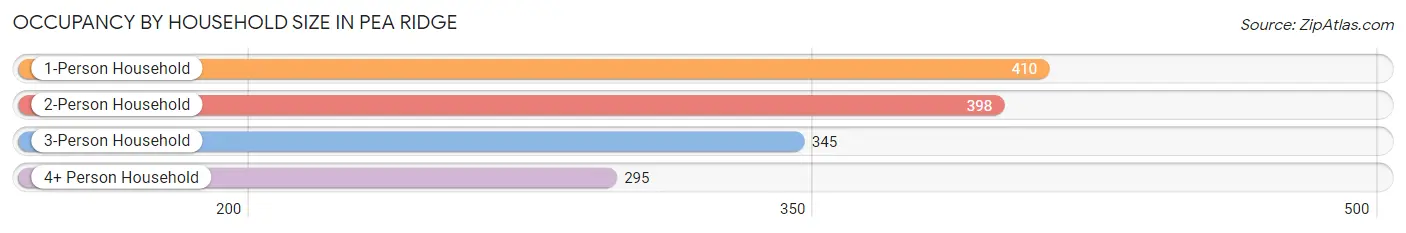
| Household Size | # Housing Units | % Housing Units |
| 1-Person Household | 410 | 28.3% |
| 2-Person Household | 398 | 27.5% |
| 3-Person Household | 345 | 23.8% |
| 4+ Person Household | 295 | 20.4% |
| Total Housing Units | 1,448 | 100.0% |
Occupancy by Ownership by Household Size in Pea Ridge
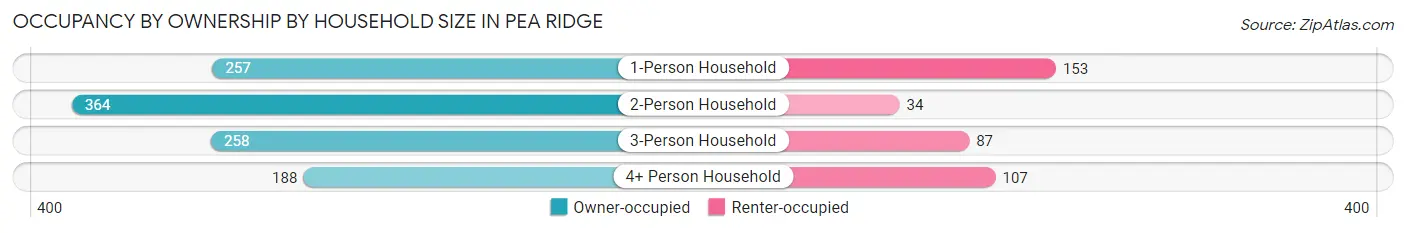
| Household Size | Owner-occupied | Renter-occupied |
| 1-Person Household | 257 (62.7%) | 153 (37.3%) |
| 2-Person Household | 364 (91.5%) | 34 (8.5%) |
| 3-Person Household | 258 (74.8%) | 87 (25.2%) |
| 4+ Person Household | 188 (63.7%) | 107 (36.3%) |
| Total Housing Units | 1,067 (73.7%) | 381 (26.3%) |
Occupancy by Educational Attainment in Pea Ridge
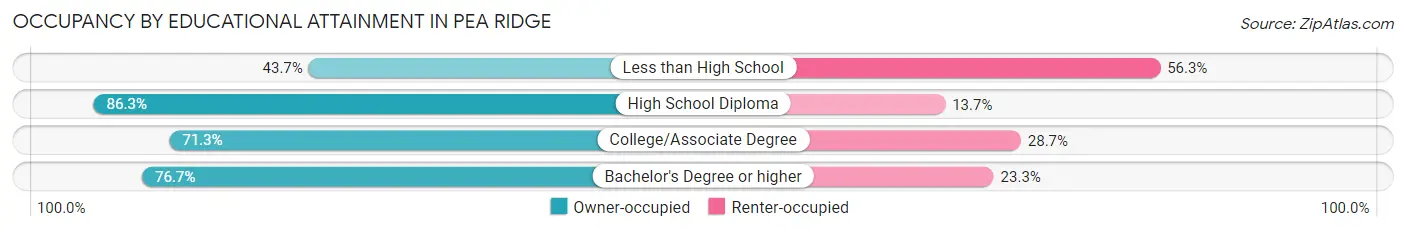
| Household Size | Owner-occupied | Renter-occupied |
| Less than High School | 45 (43.7%) | 58 (56.3%) |
| High School Diploma | 271 (86.3%) | 43 (13.7%) |
| College/Associate Degree | 527 (71.3%) | 212 (28.7%) |
| Bachelor's Degree or higher | 224 (76.7%) | 68 (23.3%) |
Occupancy by Age of Householder in Pea Ridge
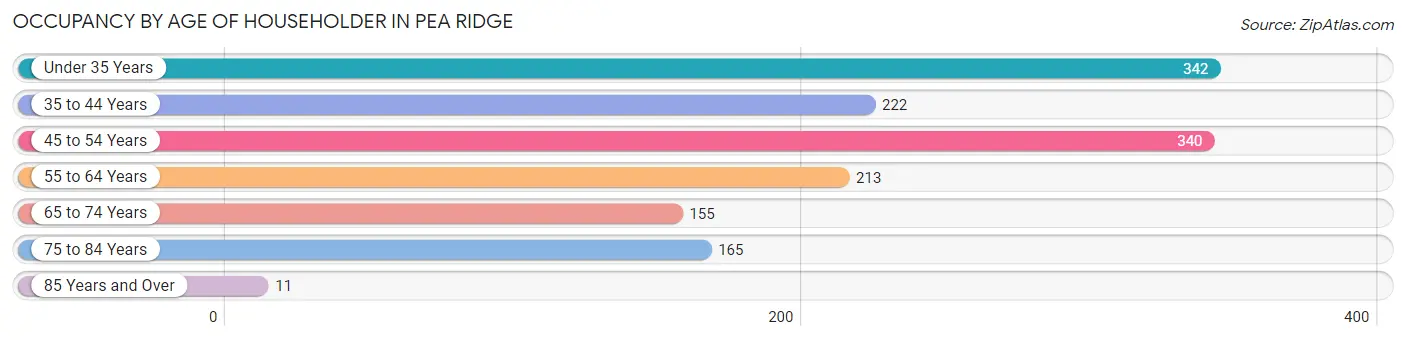
| Age Bracket | # Households | % Households |
| Under 35 Years | 342 | 23.6% |
| 35 to 44 Years | 222 | 15.3% |
| 45 to 54 Years | 340 | 23.5% |
| 55 to 64 Years | 213 | 14.7% |
| 65 to 74 Years | 155 | 10.7% |
| 75 to 84 Years | 165 | 11.4% |
| 85 Years and Over | 11 | 0.8% |
| Total | 1,448 | 100.0% |
Housing Finances in Pea Ridge
Median Income by Occupancy in Pea Ridge
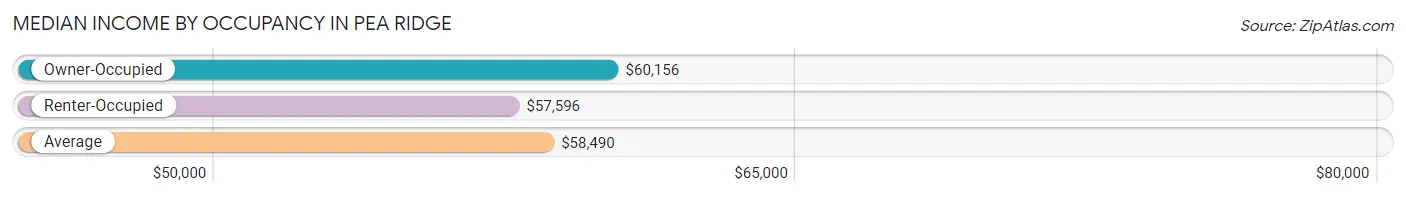
| Occupancy Type | # Households | Median Income |
| Owner-Occupied | 1,067 (73.7%) | $60,156 |
| Renter-Occupied | 381 (26.3%) | $57,596 |
| Average | 1,448 (100.0%) | $58,490 |
Occupancy by Householder Income Bracket in Pea Ridge
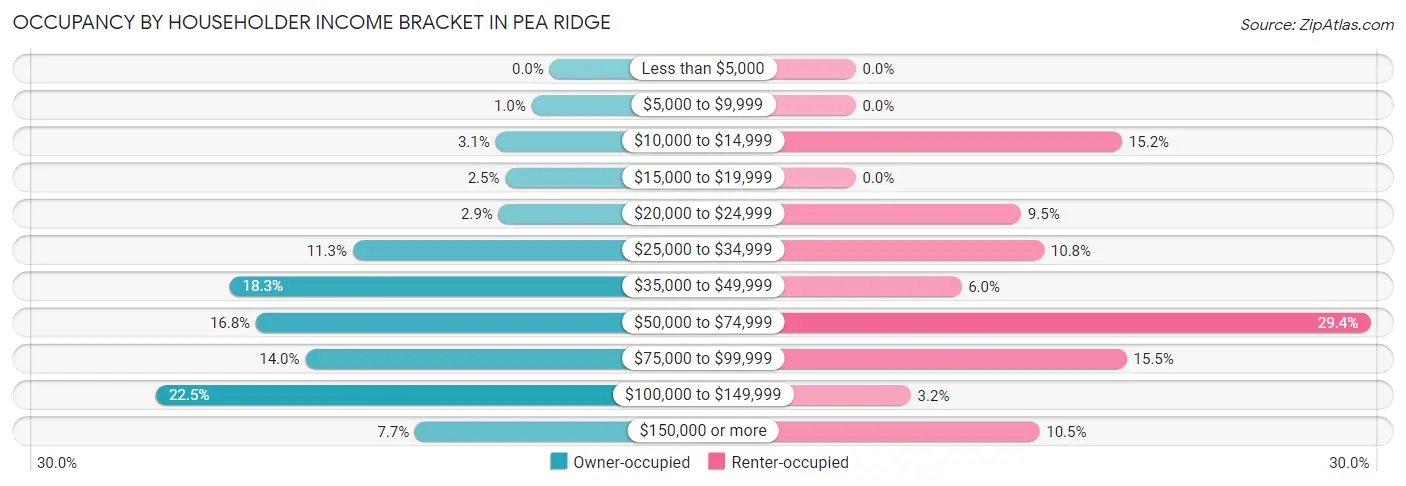
| Income Bracket | Owner-occupied | Renter-occupied |
| Less than $5,000 | 0 (0.0%) | 0 (0.0%) |
| $5,000 to $9,999 | 11 (1.0%) | 0 (0.0%) |
| $10,000 to $14,999 | 33 (3.1%) | 58 (15.2%) |
| $15,000 to $19,999 | 27 (2.5%) | 0 (0.0%) |
| $20,000 to $24,999 | 31 (2.9%) | 36 (9.5%) |
| $25,000 to $34,999 | 120 (11.3%) | 41 (10.8%) |
| $35,000 to $49,999 | 195 (18.3%) | 23 (6.0%) |
| $50,000 to $74,999 | 179 (16.8%) | 112 (29.4%) |
| $75,000 to $99,999 | 149 (14.0%) | 59 (15.5%) |
| $100,000 to $149,999 | 240 (22.5%) | 12 (3.2%) |
| $150,000 or more | 82 (7.7%) | 40 (10.5%) |
| Total | 1,067 (100.0%) | 381 (100.0%) |
Monthly Housing Cost Tiers in Pea Ridge
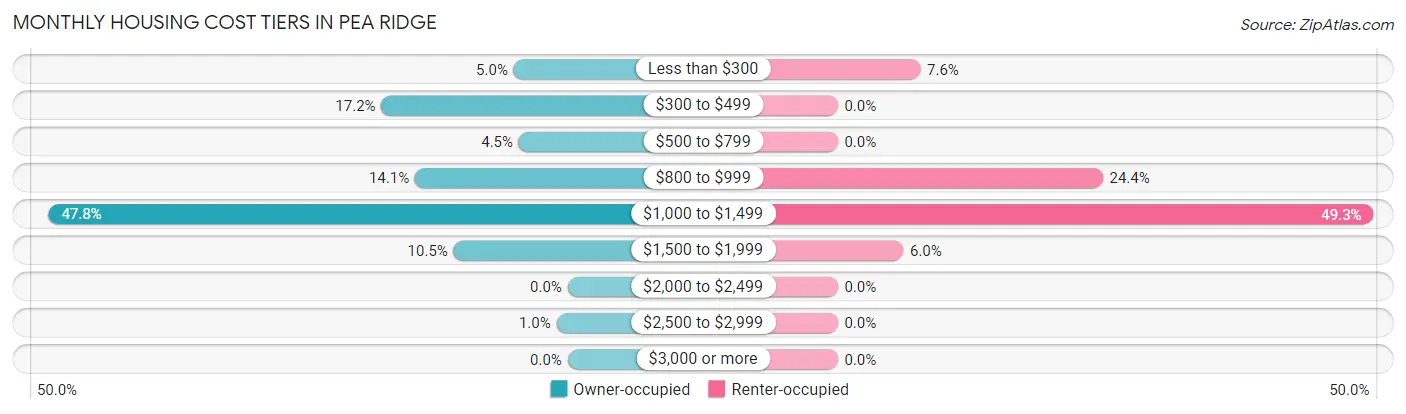
| Monthly Cost | Owner-occupied | Renter-occupied |
| Less than $300 | 53 (5.0%) | 29 (7.6%) |
| $300 to $499 | 183 (17.2%) | 0 (0.0%) |
| $500 to $799 | 48 (4.5%) | 0 (0.0%) |
| $800 to $999 | 150 (14.1%) | 93 (24.4%) |
| $1,000 to $1,499 | 510 (47.8%) | 188 (49.3%) |
| $1,500 to $1,999 | 112 (10.5%) | 23 (6.0%) |
| $2,000 to $2,499 | 0 (0.0%) | 0 (0.0%) |
| $2,500 to $2,999 | 11 (1.0%) | 0 (0.0%) |
| $3,000 or more | 0 (0.0%) | 0 (0.0%) |
| Total | 1,067 (100.0%) | 381 (100.0%) |
Physical Housing Characteristics in Pea Ridge
Housing Structures in Pea Ridge
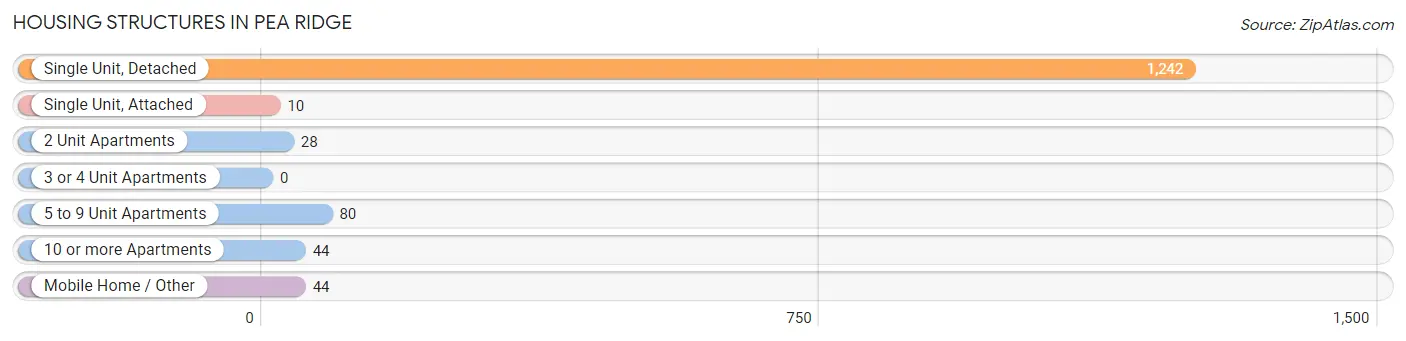
| Structure Type | # Housing Units | % Housing Units |
| Single Unit, Detached | 1,242 | 85.8% |
| Single Unit, Attached | 10 | 0.7% |
| 2 Unit Apartments | 28 | 1.9% |
| 3 or 4 Unit Apartments | 0 | 0.0% |
| 5 to 9 Unit Apartments | 80 | 5.5% |
| 10 or more Apartments | 44 | 3.0% |
| Mobile Home / Other | 44 | 3.0% |
| Total | 1,448 | 100.0% |
Housing Structures by Occupancy in Pea Ridge
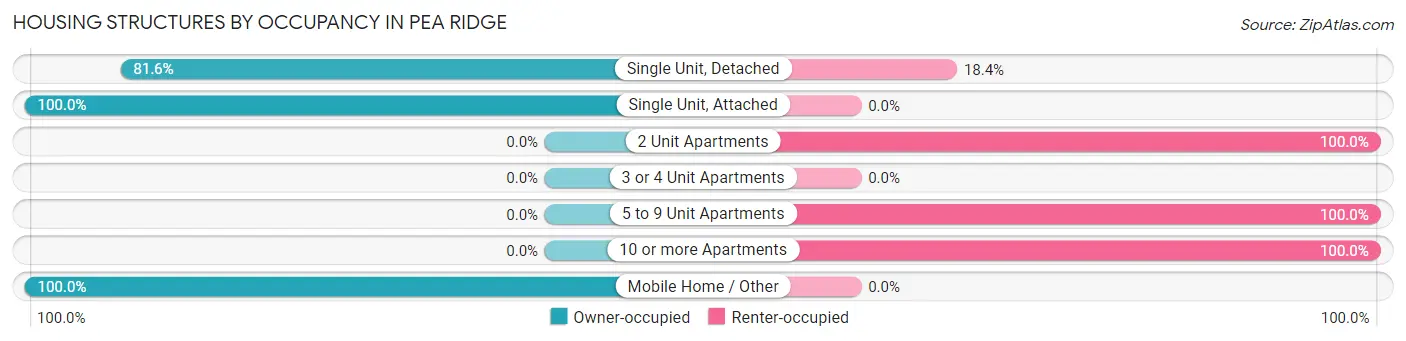
| Structure Type | Owner-occupied | Renter-occupied |
| Single Unit, Detached | 1,013 (81.6%) | 229 (18.4%) |
| Single Unit, Attached | 10 (100.0%) | 0 (0.0%) |
| 2 Unit Apartments | 0 (0.0%) | 28 (100.0%) |
| 3 or 4 Unit Apartments | 0 (0.0%) | 0 (0.0%) |
| 5 to 9 Unit Apartments | 0 (0.0%) | 80 (100.0%) |
| 10 or more Apartments | 0 (0.0%) | 44 (100.0%) |
| Mobile Home / Other | 44 (100.0%) | 0 (0.0%) |
| Total | 1,067 (73.7%) | 381 (26.3%) |
Housing Structures by Number of Rooms in Pea Ridge
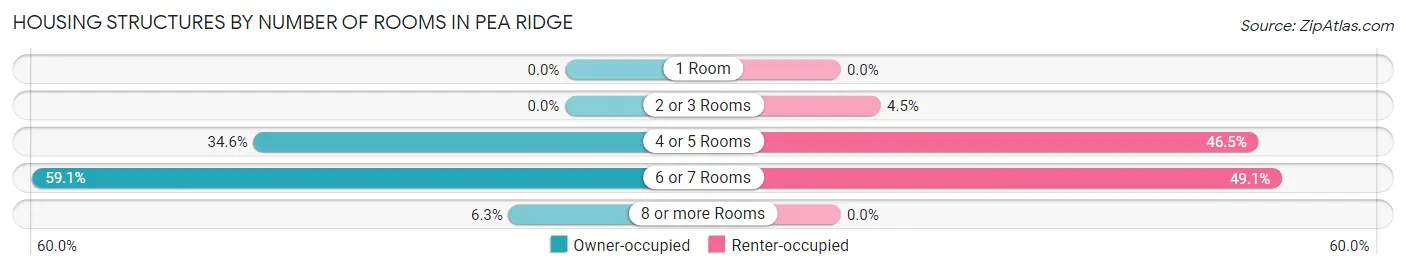
| Number of Rooms | Owner-occupied | Renter-occupied |
| 1 Room | 0 (0.0%) | 0 (0.0%) |
| 2 or 3 Rooms | 0 (0.0%) | 17 (4.5%) |
| 4 or 5 Rooms | 369 (34.6%) | 177 (46.5%) |
| 6 or 7 Rooms | 631 (59.1%) | 187 (49.1%) |
| 8 or more Rooms | 67 (6.3%) | 0 (0.0%) |
| Total | 1,067 (100.0%) | 381 (100.0%) |
Housing Structure by Heating Type in Pea Ridge
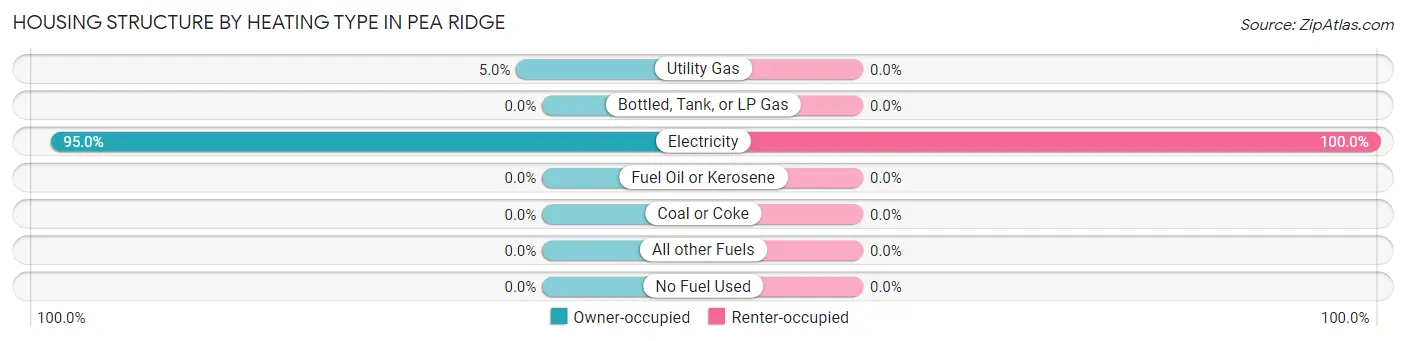
| Heating Type | Owner-occupied | Renter-occupied |
| Utility Gas | 53 (5.0%) | 0 (0.0%) |
| Bottled, Tank, or LP Gas | 0 (0.0%) | 0 (0.0%) |
| Electricity | 1,014 (95.0%) | 381 (100.0%) |
| Fuel Oil or Kerosene | 0 (0.0%) | 0 (0.0%) |
| Coal or Coke | 0 (0.0%) | 0 (0.0%) |
| All other Fuels | 0 (0.0%) | 0 (0.0%) |
| No Fuel Used | 0 (0.0%) | 0 (0.0%) |
| Total | 1,067 (100.0%) | 381 (100.0%) |
Household Vehicle Usage in Pea Ridge
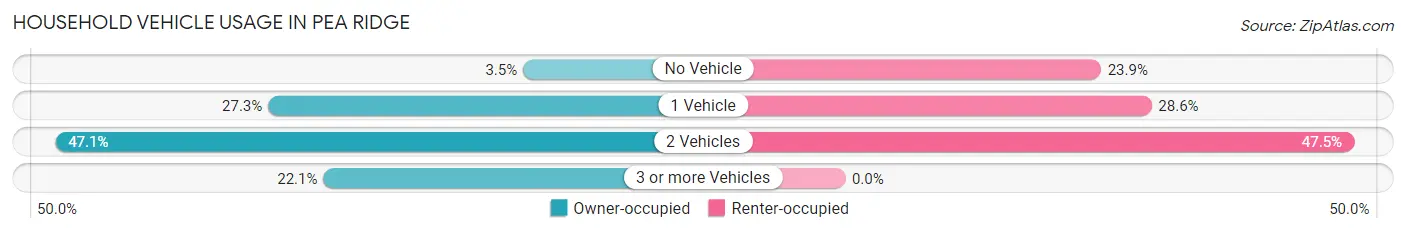
| Vehicles per Household | Owner-occupied | Renter-occupied |
| No Vehicle | 37 (3.5%) | 91 (23.9%) |
| 1 Vehicle | 291 (27.3%) | 109 (28.6%) |
| 2 Vehicles | 503 (47.1%) | 181 (47.5%) |
| 3 or more Vehicles | 236 (22.1%) | 0 (0.0%) |
| Total | 1,067 (100.0%) | 381 (100.0%) |
Real Estate & Mortgages in Pea Ridge
Real Estate and Mortgage Overview in Pea Ridge
| Characteristic | Without Mortgage | With Mortgage |
| Housing Units | 253 | 814 |
| Median Property Value | $170,700 | $185,000 |
| Median Household Income | $43,679 | $63 |
| Monthly Housing Costs | $388 | $0 |
| Real Estate Taxes | $895 | $5 |
Property Value by Mortgage Status in Pea Ridge
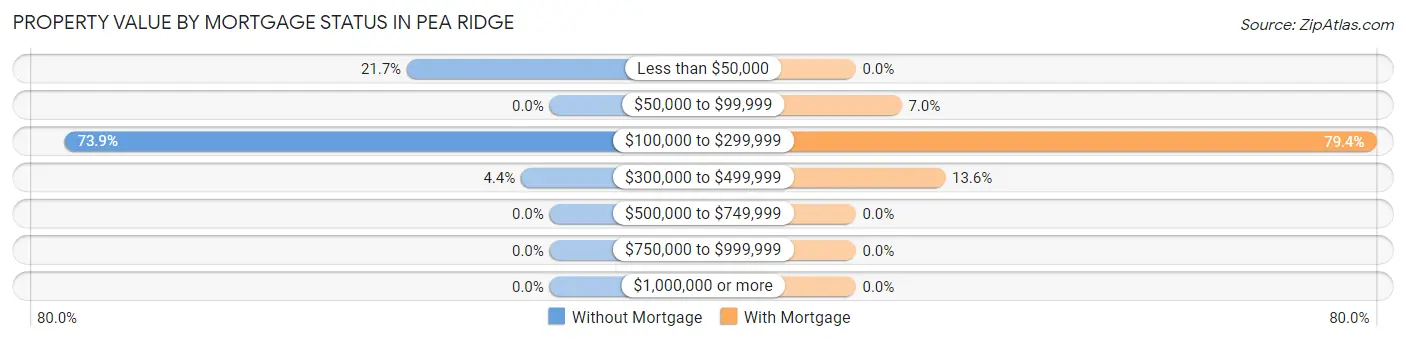
| Property Value | Without Mortgage | With Mortgage |
| Less than $50,000 | 55 (21.7%) | 0 (0.0%) |
| $50,000 to $99,999 | 0 (0.0%) | 57 (7.0%) |
| $100,000 to $299,999 | 187 (73.9%) | 646 (79.4%) |
| $300,000 to $499,999 | 11 (4.3%) | 111 (13.6%) |
| $500,000 to $749,999 | 0 (0.0%) | 0 (0.0%) |
| $750,000 to $999,999 | 0 (0.0%) | 0 (0.0%) |
| $1,000,000 or more | 0 (0.0%) | 0 (0.0%) |
| Total | 253 (100.0%) | 814 (100.0%) |
Household Income by Mortgage Status in Pea Ridge
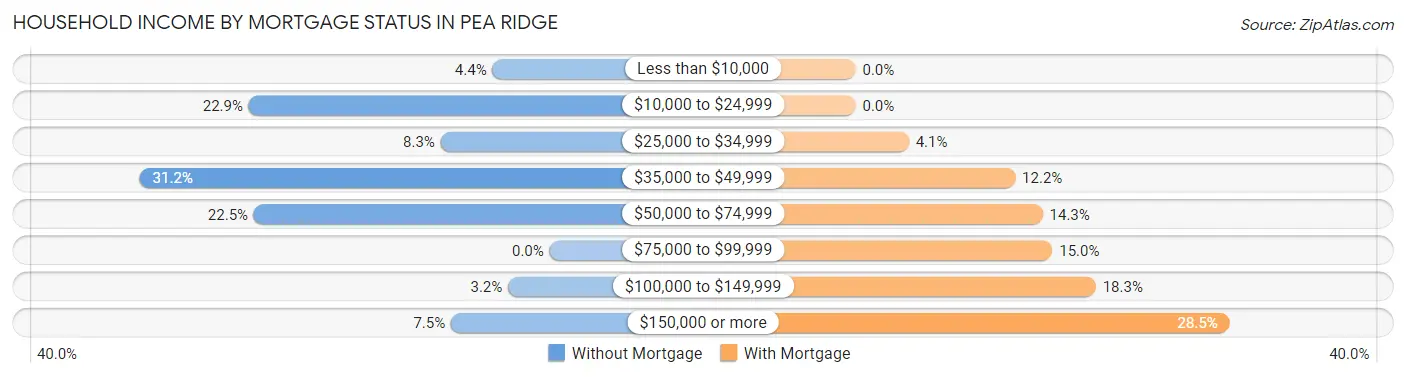
| Household Income | Without Mortgage | With Mortgage |
| Less than $10,000 | 11 (4.3%) | 0 (0.0%) |
| $10,000 to $24,999 | 58 (22.9%) | 0 (0.0%) |
| $25,000 to $34,999 | 21 (8.3%) | 33 (4.1%) |
| $35,000 to $49,999 | 79 (31.2%) | 99 (12.2%) |
| $50,000 to $74,999 | 57 (22.5%) | 116 (14.2%) |
| $75,000 to $99,999 | 0 (0.0%) | 122 (15.0%) |
| $100,000 to $149,999 | 8 (3.2%) | 149 (18.3%) |
| $150,000 or more | 19 (7.5%) | 232 (28.5%) |
| Total | 253 (100.0%) | 814 (100.0%) |
Property Value to Household Income Ratio in Pea Ridge
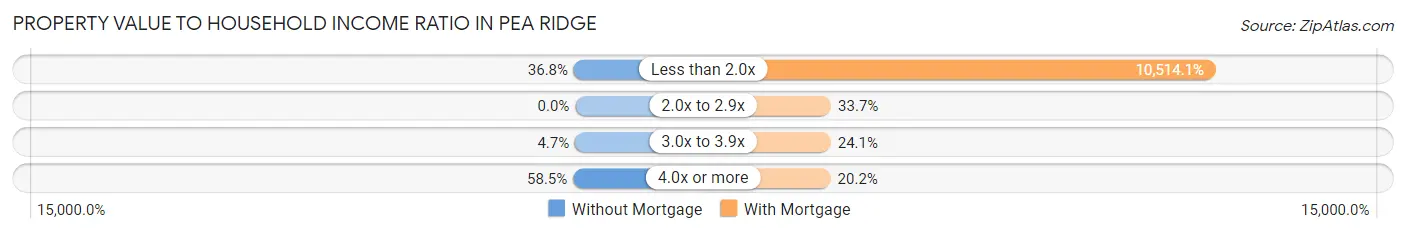
| Value-to-Income Ratio | Without Mortgage | With Mortgage |
| Less than 2.0x | 93 (36.8%) | 85,585 (10,514.1%) |
| 2.0x to 2.9x | 0 (0.0%) | 274 (33.7%) |
| 3.0x to 3.9x | 12 (4.7%) | 196 (24.1%) |
| 4.0x or more | 148 (58.5%) | 164 (20.2%) |
| Total | 253 (100.0%) | 814 (100.0%) |
Real Estate Taxes by Mortgage Status in Pea Ridge
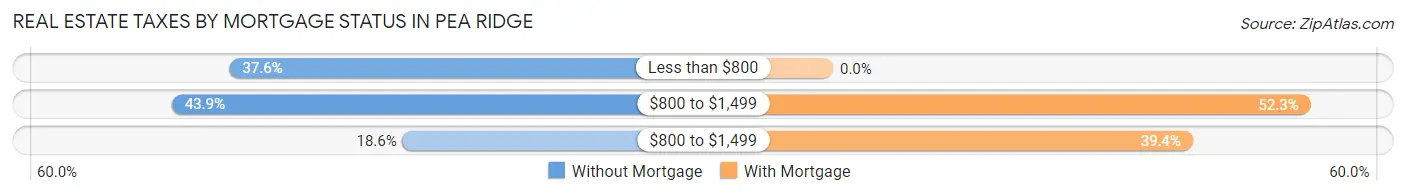
| Property Taxes | Without Mortgage | With Mortgage |
| Less than $800 | 95 (37.6%) | 0 (0.0%) |
| $800 to $1,499 | 111 (43.9%) | 426 (52.3%) |
| $800 to $1,499 | 47 (18.6%) | 321 (39.4%) |
| Total | 253 (100.0%) | 814 (100.0%) |
Health & Disability in Pea Ridge
Health Insurance Coverage by Age in Pea Ridge
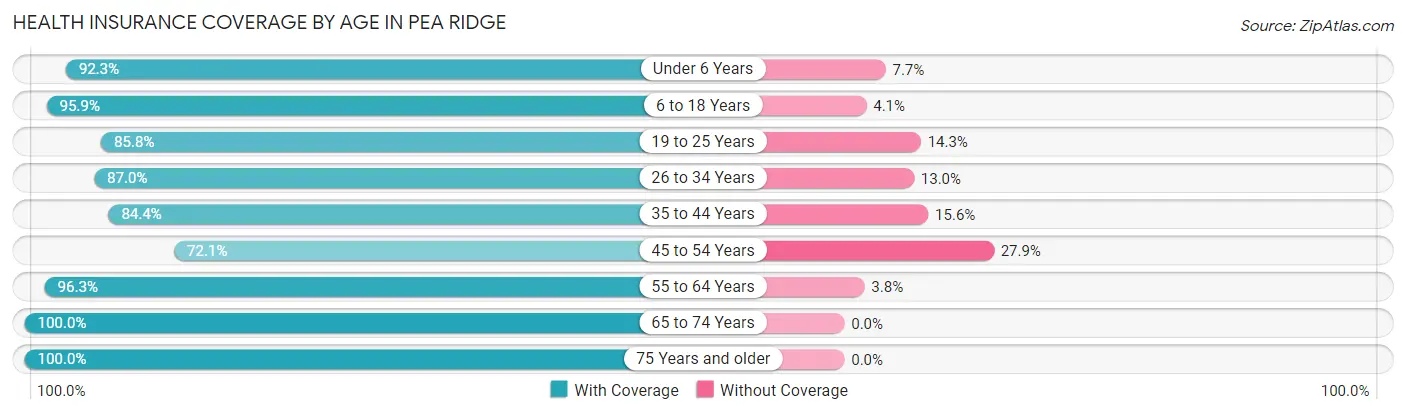
| Age Bracket | With Coverage | Without Coverage |
| Under 6 Years | 276 (92.3%) | 23 (7.7%) |
| 6 to 18 Years | 562 (95.9%) | 24 (4.1%) |
| 19 to 25 Years | 301 (85.8%) | 50 (14.2%) |
| 26 to 34 Years | 550 (87.0%) | 82 (13.0%) |
| 35 to 44 Years | 275 (84.4%) | 51 (15.6%) |
| 45 to 54 Years | 492 (72.1%) | 190 (27.9%) |
| 55 to 64 Years | 334 (96.3%) | 13 (3.7%) |
| 65 to 74 Years | 252 (100.0%) | 0 (0.0%) |
| 75 Years and older | 290 (100.0%) | 0 (0.0%) |
| Total | 3,332 (88.5%) | 433 (11.5%) |
Health Insurance Coverage by Citizenship Status in Pea Ridge
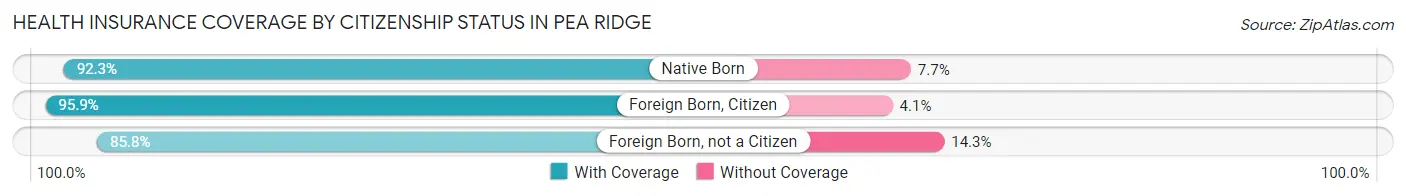
| Citizenship Status | With Coverage | Without Coverage |
| Native Born | 276 (92.3%) | 23 (7.7%) |
| Foreign Born, Citizen | 562 (95.9%) | 24 (4.1%) |
| Foreign Born, not a Citizen | 301 (85.8%) | 50 (14.2%) |
Health Insurance Coverage by Household Income in Pea Ridge
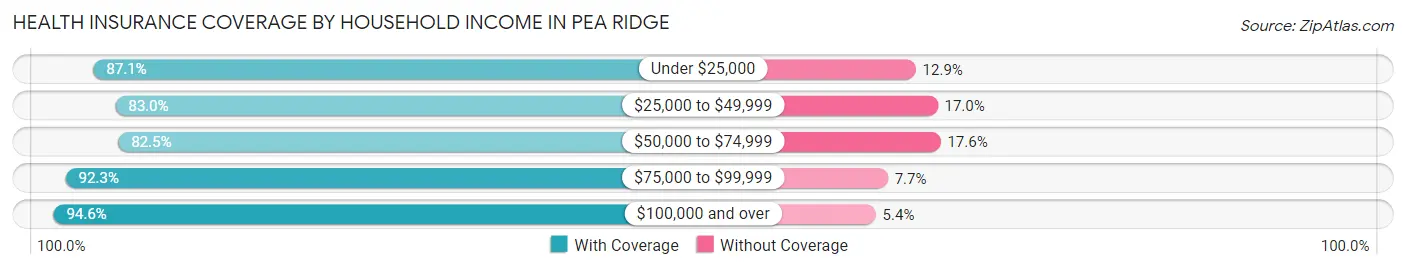
| Household Income | With Coverage | Without Coverage |
| Under $25,000 | 189 (87.1%) | 28 (12.9%) |
| $25,000 to $49,999 | 796 (83.0%) | 163 (17.0%) |
| $50,000 to $74,999 | 578 (82.5%) | 123 (17.5%) |
| $75,000 to $99,999 | 686 (92.3%) | 57 (7.7%) |
| $100,000 and over | 1,083 (94.6%) | 62 (5.4%) |
Public vs Private Health Insurance Coverage by Age in Pea Ridge
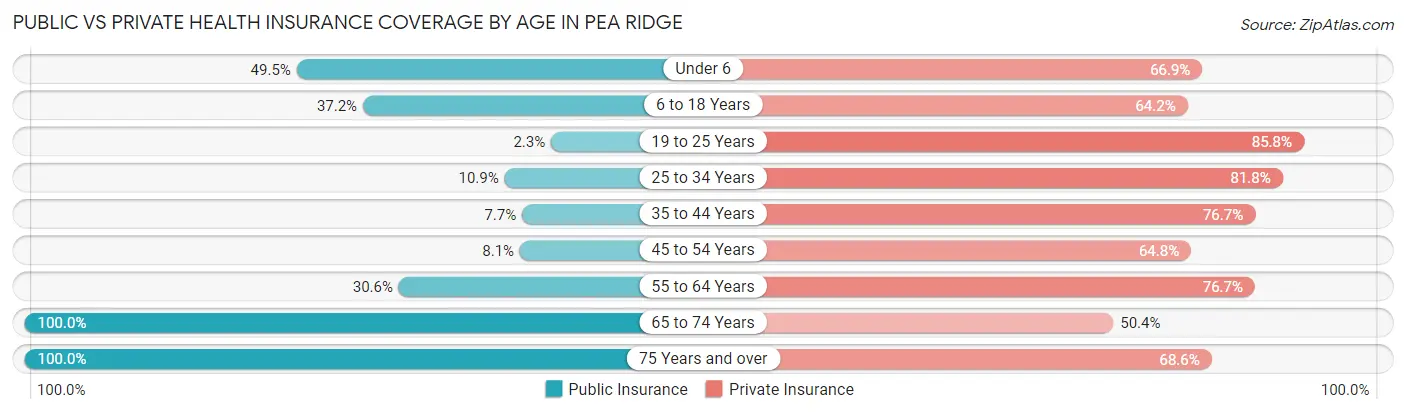
| Age Bracket | Public Insurance | Private Insurance |
| Under 6 | 148 (49.5%) | 200 (66.9%) |
| 6 to 18 Years | 218 (37.2%) | 376 (64.2%) |
| 19 to 25 Years | 8 (2.3%) | 301 (85.8%) |
| 25 to 34 Years | 69 (10.9%) | 517 (81.8%) |
| 35 to 44 Years | 25 (7.7%) | 250 (76.7%) |
| 45 to 54 Years | 55 (8.1%) | 442 (64.8%) |
| 55 to 64 Years | 106 (30.5%) | 266 (76.7%) |
| 65 to 74 Years | 252 (100.0%) | 127 (50.4%) |
| 75 Years and over | 290 (100.0%) | 199 (68.6%) |
| Total | 1,171 (31.1%) | 2,678 (71.1%) |
Disability Status by Sex by Age in Pea Ridge
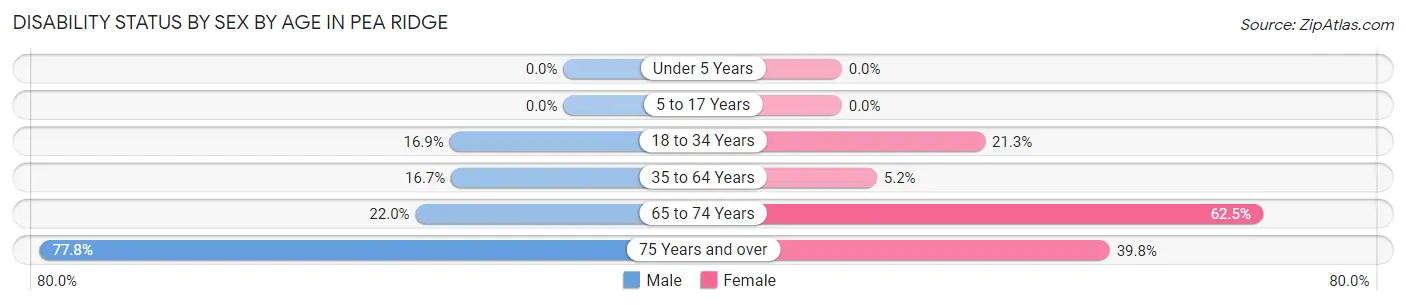
| Age Bracket | Male | Female |
| Under 5 Years | 0 (0.0%) | 0 (0.0%) |
| 5 to 17 Years | 0 (0.0%) | 0 (0.0%) |
| 18 to 34 Years | 96 (16.9%) | 90 (21.3%) |
| 35 to 64 Years | 117 (16.7%) | 34 (5.2%) |
| 65 to 74 Years | 29 (22.0%) | 75 (62.5%) |
| 75 Years and over | 77 (77.8%) | 76 (39.8%) |
Disability Class by Sex by Age in Pea Ridge
Disability Class: Hearing Difficulty
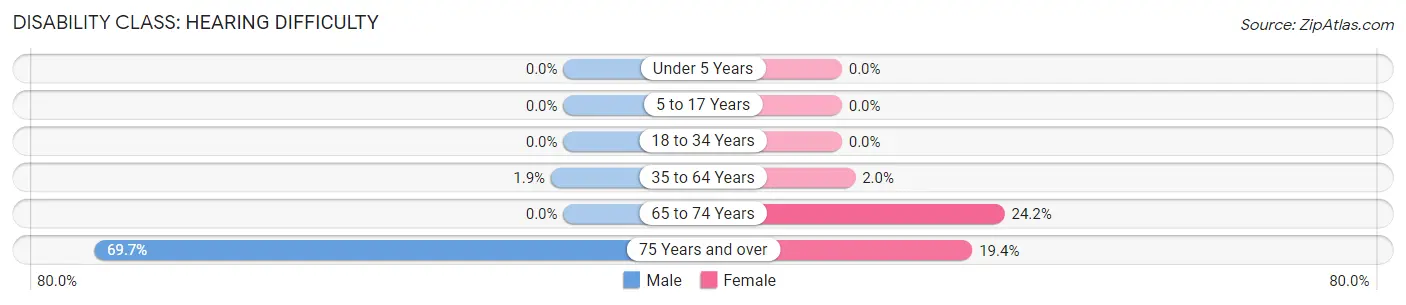
| Age Bracket | Male | Female |
| Under 5 Years | 0 (0.0%) | 0 (0.0%) |
| 5 to 17 Years | 0 (0.0%) | 0 (0.0%) |
| 18 to 34 Years | 0 (0.0%) | 0 (0.0%) |
| 35 to 64 Years | 13 (1.8%) | 13 (2.0%) |
| 65 to 74 Years | 0 (0.0%) | 29 (24.2%) |
| 75 Years and over | 69 (69.7%) | 37 (19.4%) |
Disability Class: Vision Difficulty
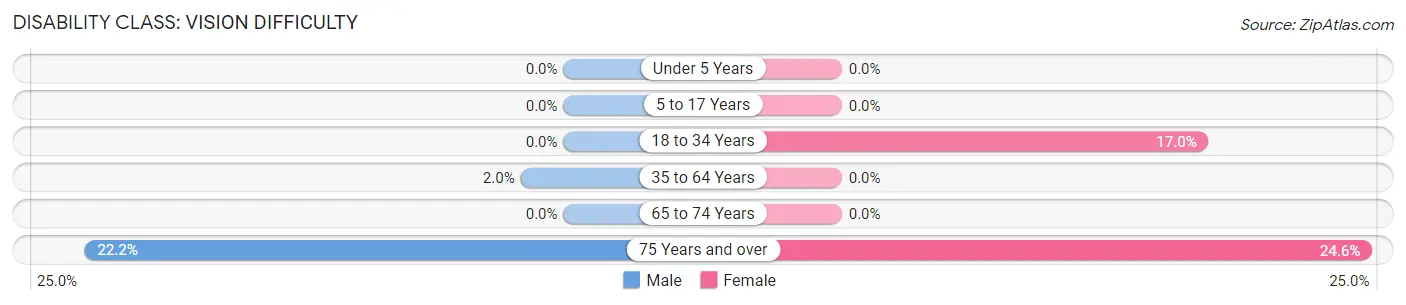
| Age Bracket | Male | Female |
| Under 5 Years | 0 (0.0%) | 0 (0.0%) |
| 5 to 17 Years | 0 (0.0%) | 0 (0.0%) |
| 18 to 34 Years | 0 (0.0%) | 72 (17.0%) |
| 35 to 64 Years | 14 (2.0%) | 0 (0.0%) |
| 65 to 74 Years | 0 (0.0%) | 0 (0.0%) |
| 75 Years and over | 22 (22.2%) | 47 (24.6%) |
Disability Class: Cognitive Difficulty
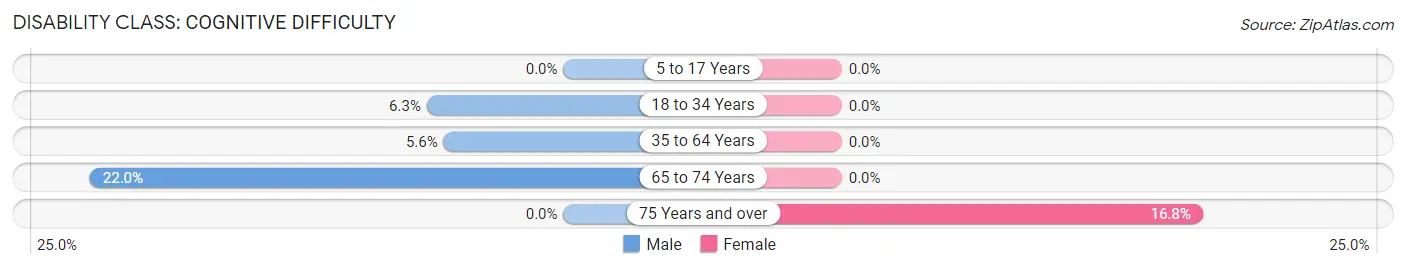
| Age Bracket | Male | Female |
| 5 to 17 Years | 0 (0.0%) | 0 (0.0%) |
| 18 to 34 Years | 36 (6.3%) | 0 (0.0%) |
| 35 to 64 Years | 39 (5.6%) | 0 (0.0%) |
| 65 to 74 Years | 29 (22.0%) | 0 (0.0%) |
| 75 Years and over | 0 (0.0%) | 32 (16.8%) |
Disability Class: Ambulatory Difficulty
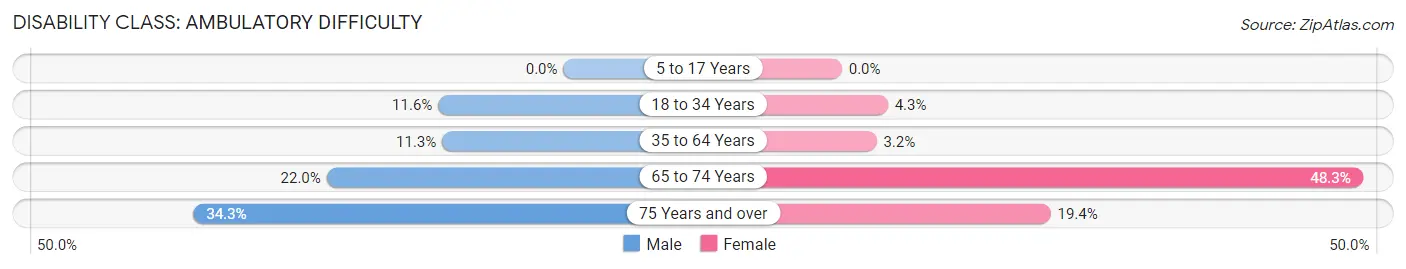
| Age Bracket | Male | Female |
| 5 to 17 Years | 0 (0.0%) | 0 (0.0%) |
| 18 to 34 Years | 66 (11.6%) | 18 (4.3%) |
| 35 to 64 Years | 79 (11.3%) | 21 (3.2%) |
| 65 to 74 Years | 29 (22.0%) | 58 (48.3%) |
| 75 Years and over | 34 (34.3%) | 37 (19.4%) |
Disability Class: Self-Care Difficulty
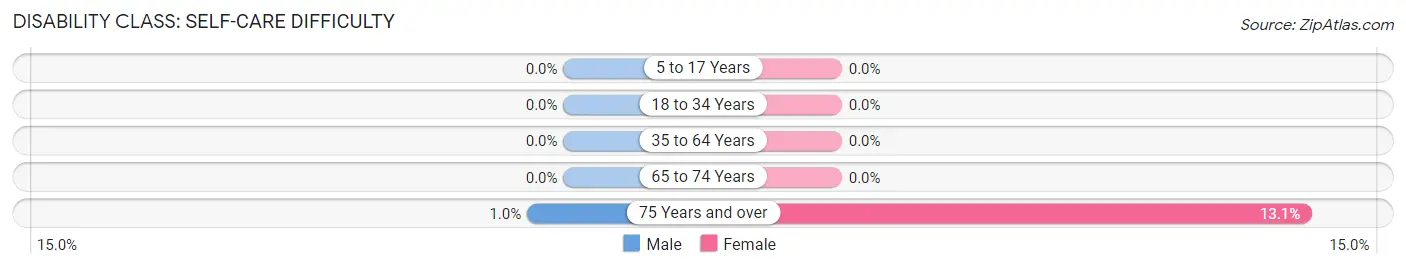
| Age Bracket | Male | Female |
| 5 to 17 Years | 0 (0.0%) | 0 (0.0%) |
| 18 to 34 Years | 0 (0.0%) | 0 (0.0%) |
| 35 to 64 Years | 0 (0.0%) | 0 (0.0%) |
| 65 to 74 Years | 0 (0.0%) | 0 (0.0%) |
| 75 Years and over | 1 (1.0%) | 25 (13.1%) |
Technology Access in Pea Ridge
Computing Device Access in Pea Ridge
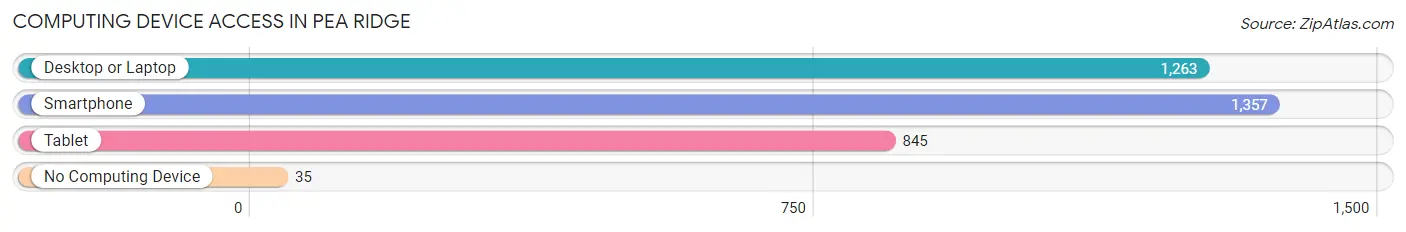
| Device Type | # Households | % Households |
| Desktop or Laptop | 1,263 | 87.2% |
| Smartphone | 1,357 | 93.7% |
| Tablet | 845 | 58.4% |
| No Computing Device | 35 | 2.4% |
| Total | 1,448 | 100.0% |
Internet Access in Pea Ridge
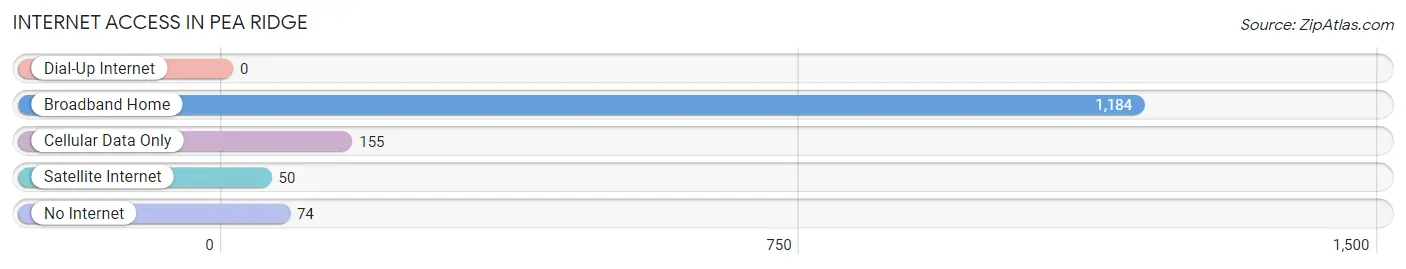
| Internet Type | # Households | % Households |
| Dial-Up Internet | 0 | 0.0% |
| Broadband Home | 1,184 | 81.8% |
| Cellular Data Only | 155 | 10.7% |
| Satellite Internet | 50 | 3.5% |
| No Internet | 74 | 5.1% |
| Total | 1,448 | 100.0% |
Pea Ridge Summary
Pea Ridge is a small unincorporated community located in Santa Rosa County, Florida. It is situated on the western edge of the county, just south of the Alabama state line. The community is named after a nearby ridge, which is believed to have been formed by a meteorite impact millions of years ago. Pea Ridge is home to a population of approximately 1,000 people, and is part of the Pensacola-Ferry Pass-Brent Metropolitan Statistical Area.
History
The area that is now Pea Ridge was first settled in the early 1800s by settlers from the Creek Nation. The Creek Nation had been forced to relocate to the area after the Indian Removal Act of 1830. The settlers established a small farming community and named it Pea Ridge after the nearby ridge.
In the late 1800s, the area was home to a large turpentine industry. The turpentine industry was a major source of income for the area, and it helped to fuel the local economy.
In the early 1900s, the area began to experience a population boom. This was due to the construction of the Pensacola and Atlantic Railroad, which ran through the area. The railroad brought new settlers to the area, and it also helped to spur economic growth.
In the mid-1900s, the area experienced a decline in population. This was due to the closure of the railroad and the decline of the turpentine industry. However, the area has since experienced a resurgence in population, and it is now home to a population of approximately 1,000 people.
Geography
Pea Ridge is located in Santa Rosa County, Florida. It is situated on the western edge of the county, just south of the Alabama state line. The community is located on the banks of the Escambia River, and it is surrounded by rolling hills and forests.
The climate in Pea Ridge is humid subtropical, with hot summers and mild winters. The average annual temperature is around 70 degrees Fahrenheit, and the average annual precipitation is around 55 inches.
Economy
The economy of Pea Ridge is largely based on agriculture and forestry. The area is home to several farms, and it is also home to a large timber industry. The timber industry is a major source of income for the area, and it helps to fuel the local economy.
In addition to agriculture and forestry, Pea Ridge is also home to a number of small businesses. These businesses include restaurants, retail stores, and other services.
Demographics
As of the 2010 census, Pea Ridge had a population of 1,000 people. The racial makeup of the community was 97.2% White, 0.7% African American, 0.3% Native American, 0.2% Asian, and 1.6% from other races.
The median household income in Pea Ridge was $37,500, and the median family income was $41,250. The per capita income in Pea Ridge was $17,500.
Conclusion
Pea Ridge is a small unincorporated community located in Santa Rosa County, Florida. It is situated on the western edge of the county, just south of the Alabama state line. The community is named after a nearby ridge, which is believed to have been formed by a meteorite impact millions of years ago. Pea Ridge is home to a population of approximately 1,000 people, and is part of the Pensacola-Ferry Pass-Brent Metropolitan Statistical Area. The economy of Pea Ridge is largely based on agriculture and forestry, and it is also home to a number of small businesses. The racial makeup of the community is 97.2% White, 0.7% African American, 0.3% Native American, 0.2% Asian, and 1.6% from other races. The median household income in Pea Ridge was $37,500, and the median family income was $41,250.
Common Questions
What is Per Capita Income in Pea Ridge?
Per Capita income in Pea Ridge is $29,934.
What is the Median Family Income in Pea Ridge?
Median Family Income in Pea Ridge is $81,563.
What is the Median Household income in Pea Ridge?
Median Household Income in Pea Ridge is $58,490.
What is Income or Wage Gap in Pea Ridge?
Income or Wage Gap in Pea Ridge is 27.6%.
Women in Pea Ridge earn 72.4 cents for every dollar earned by a man.
What is Inequality or Gini Index in Pea Ridge?
Inequality or Gini Index in Pea Ridge is 0.36.
What is the Total Population of Pea Ridge?
Total Population of Pea Ridge is 3,765.
What is the Total Male Population of Pea Ridge?
Total Male Population of Pea Ridge is 1,856.
What is the Total Female Population of Pea Ridge?
Total Female Population of Pea Ridge is 1,909.
What is the Ratio of Males per 100 Females in Pea Ridge?
There are 97.22 Males per 100 Females in Pea Ridge.
What is the Ratio of Females per 100 Males in Pea Ridge?
There are 102.86 Females per 100 Males in Pea Ridge.
What is the Median Population Age in Pea Ridge?
Median Population Age in Pea Ridge is 35.4 Years.
What is the Average Family Size in Pea Ridge
Average Family Size in Pea Ridge is 3.3 People.
What is the Average Household Size in Pea Ridge
Average Household Size in Pea Ridge is 2.6 People.
How Large is the Labor Force in Pea Ridge?
There are 1,980 People in the Labor Forcein in Pea Ridge.
What is the Percentage of People in the Labor Force in Pea Ridge?
65.8% of People are in the Labor Force in Pea Ridge.
What is the Unemployment Rate in Pea Ridge?
Unemployment Rate in Pea Ridge is 1.6%.