South Pasadena, FL Map & Demographics
South Pasadena Map
South Pasadena Overview
$46,038
PER CAPITA INCOME
$78,409
AVG FAMILY INCOME
$48,490
AVG HOUSEHOLD INCOME
3.3%
WAGE / INCOME GAP [ % ]
96.7¢/ $1
WAGE / INCOME GAP [ $ ]
0.50
INEQUALITY / GINI INDEX
5,334
TOTAL POPULATION
2,254
MALE POPULATION
3,080
FEMALE POPULATION
73.18
MALES / 100 FEMALES
136.65
FEMALES / 100 MALES
69.2
MEDIAN AGE
2.3
AVG FAMILY SIZE
1.5
AVG HOUSEHOLD SIZE
1,655
LABOR FORCE [ PEOPLE ]
31.7%
PERCENT IN LABOR FORCE
6.8%
UNEMPLOYMENT RATE
South Pasadena Area Codes
Income in South Pasadena
Income Overview in South Pasadena
Per Capita Income in South Pasadena is $46,038, while median incomes of families and households are $78,409 and $48,490 respectively.
| Characteristic | Number | Measure |
| Per Capita Income | 5,334 | $46,038 |
| Median Family Income | 1,110 | $78,409 |
| Mean Family Income | 1,110 | $114,367 |
| Median Household Income | 3,127 | $48,490 |
| Mean Household Income | 3,127 | $72,777 |
| Income Deficit | 1,110 | $0 |
| Wage / Income Gap (%) | 5,334 | 3.34% |
| Wage / Income Gap ($) | 5,334 | 96.66¢ per $1 |
| Gini / Inequality Index | 5,334 | 0.50 |
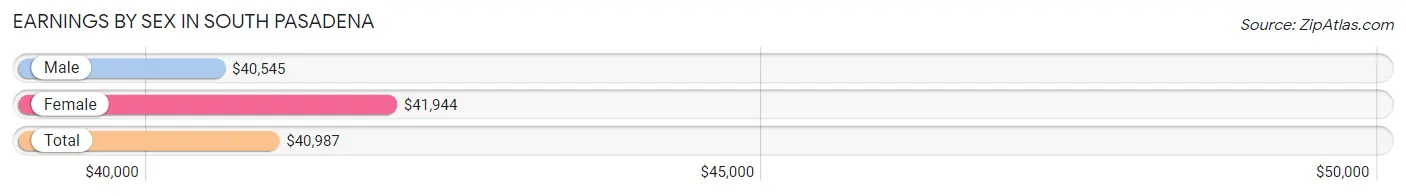
Earnings by Sex in South Pasadena
Average Earnings in South Pasadena are $40,987, $40,545 for men and $41,944 for women, a difference of 3.3%.
| Sex | Number | Average Earnings |
| Male | 847 (47.2%) | $40,545 |
| Female | 948 (52.8%) | $41,944 |
| Total | 1,795 (100.0%) | $40,987 |
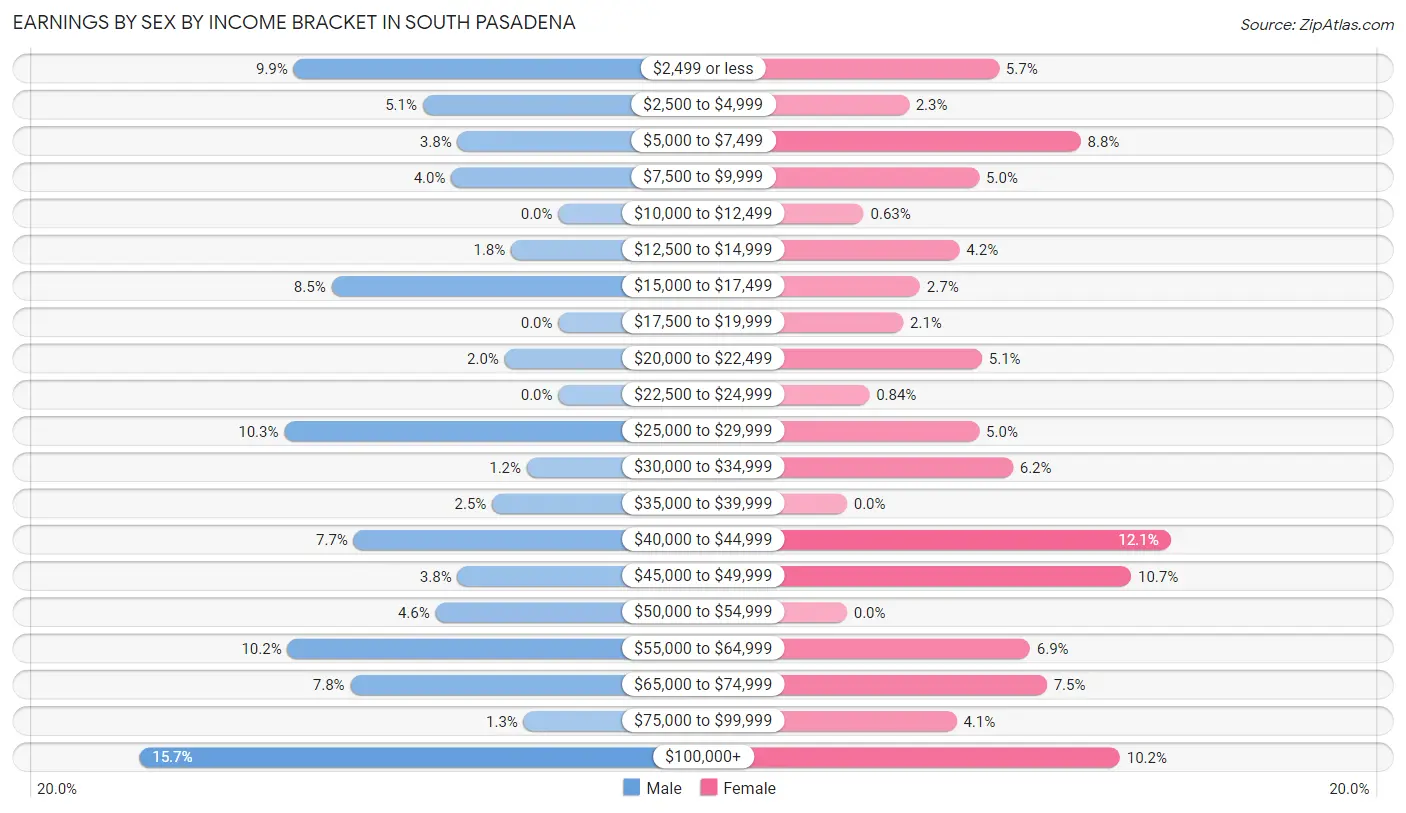
Earnings by Sex by Income Bracket in South Pasadena
The most common earnings brackets in South Pasadena are $100,000+ for men (133 | 15.7%) and $40,000 to $44,999 for women (115 | 12.1%).
| Income | Male | Female |
| $2,499 or less | 84 (9.9%) | 54 (5.7%) |
| $2,500 to $4,999 | 43 (5.1%) | 22 (2.3%) |
| $5,000 to $7,499 | 32 (3.8%) | 83 (8.8%) |
| $7,500 to $9,999 | 34 (4.0%) | 47 (5.0%) |
| $10,000 to $12,499 | 0 (0.0%) | 6 (0.6%) |
| $12,500 to $14,999 | 15 (1.8%) | 40 (4.2%) |
| $15,000 to $17,499 | 72 (8.5%) | 26 (2.7%) |
| $17,500 to $19,999 | 0 (0.0%) | 20 (2.1%) |
| $20,000 to $22,499 | 17 (2.0%) | 48 (5.1%) |
| $22,500 to $24,999 | 0 (0.0%) | 8 (0.8%) |
| $25,000 to $29,999 | 87 (10.3%) | 47 (5.0%) |
| $30,000 to $34,999 | 10 (1.2%) | 59 (6.2%) |
| $35,000 to $39,999 | 21 (2.5%) | 0 (0.0%) |
| $40,000 to $44,999 | 65 (7.7%) | 115 (12.1%) |
| $45,000 to $49,999 | 32 (3.8%) | 101 (10.6%) |
| $50,000 to $54,999 | 39 (4.6%) | 0 (0.0%) |
| $55,000 to $64,999 | 86 (10.2%) | 65 (6.9%) |
| $65,000 to $74,999 | 66 (7.8%) | 71 (7.5%) |
| $75,000 to $99,999 | 11 (1.3%) | 39 (4.1%) |
| $100,000+ | 133 (15.7%) | 97 (10.2%) |
| Total | 847 (100.0%) | 948 (100.0%) |
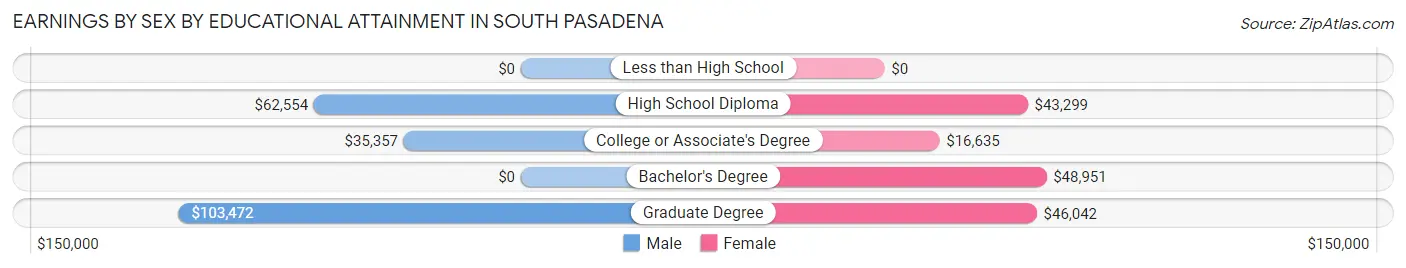
Earnings by Sex by Educational Attainment in South Pasadena
Average earnings in South Pasadena are $41,058 for men and $43,505 for women, a difference of 5.6%. Men with an educational attainment of graduate degree enjoy the highest average annual earnings of $103,472, while those with college or associate's degree education earn the least with $35,357. Women with an educational attainment of bachelor's degree earn the most with the average annual earnings of $48,951, while those with college or associate's degree education have the smallest earnings of $16,635.
| Educational Attainment | Male Income | Female Income |
| Less than High School | - | - |
| High School Diploma | $62,554 | $43,299 |
| College or Associate's Degree | $35,357 | $16,635 |
| Bachelor's Degree | - | - |
| Graduate Degree | $103,472 | $46,042 |
| Total | $41,058 | $43,505 |
Family Income in South Pasadena
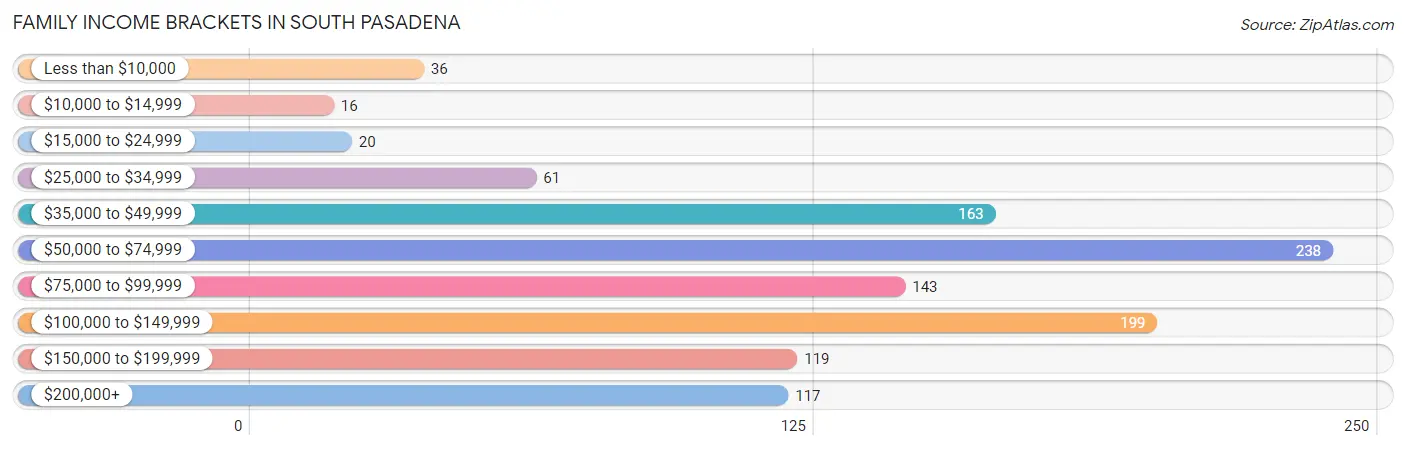
Family Income Brackets in South Pasadena
According to the South Pasadena family income data, there are 238 families falling into the $50,000 to $74,999 income range, which is the most common income bracket and makes up 21.4% of all families. Conversely, the $10,000 to $14,999 income bracket is the least frequent group with only 16 families (1.4%) belonging to this category.
| Income Bracket | # Families | % Families |
| Less than $10,000 | 36 | 3.2% |
| $10,000 to $14,999 | 16 | 1.4% |
| $15,000 to $24,999 | 20 | 1.8% |
| $25,000 to $34,999 | 61 | 5.5% |
| $35,000 to $49,999 | 163 | 14.7% |
| $50,000 to $74,999 | 238 | 21.4% |
| $75,000 to $99,999 | 143 | 12.9% |
| $100,000 to $149,999 | 199 | 17.9% |
| $150,000 to $199,999 | 119 | 10.7% |
| $200,000+ | 117 | 10.5% |
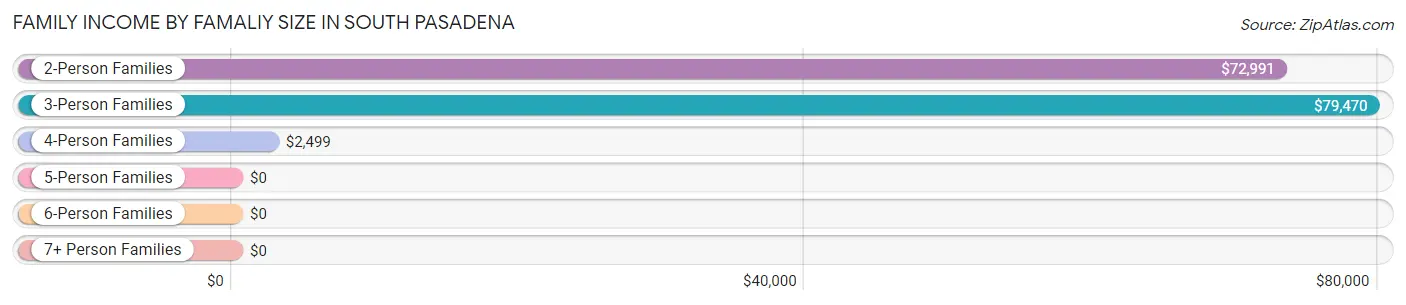
Family Income by Famaliy Size in South Pasadena
3-person families (74 | 6.7%) account for the highest median family income in South Pasadena with $79,470 per family, while 2-person families (985 | 88.7%) have the highest median income of $36,496 per family member.
| Income Bracket | # Families | Median Income |
| 2-Person Families | 985 (88.7%) | $72,991 |
| 3-Person Families | 74 (6.7%) | $79,470 |
| 4-Person Families | 32 (2.9%) | $2,499 |
| 5-Person Families | 19 (1.7%) | $0 |
| 6-Person Families | 0 (0.0%) | $0 |
| 7+ Person Families | 0 (0.0%) | $0 |
| Total | 1,110 (100.0%) | $78,409 |
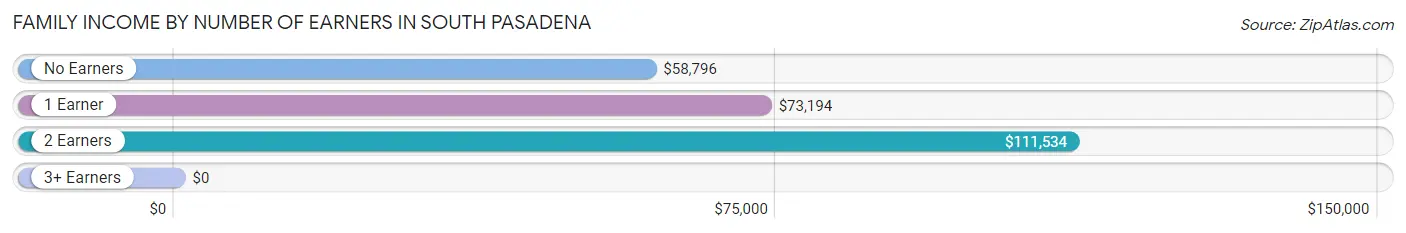
Family Income by Number of Earners in South Pasadena
| Number of Earners | # Families | Median Income |
| No Earners | 436 (39.3%) | $58,796 |
| 1 Earner | 382 (34.4%) | $73,194 |
| 2 Earners | 231 (20.8%) | $111,534 |
| 3+ Earners | 61 (5.5%) | $0 |
| Total | 1,110 (100.0%) | $78,409 |
Household Income in South Pasadena
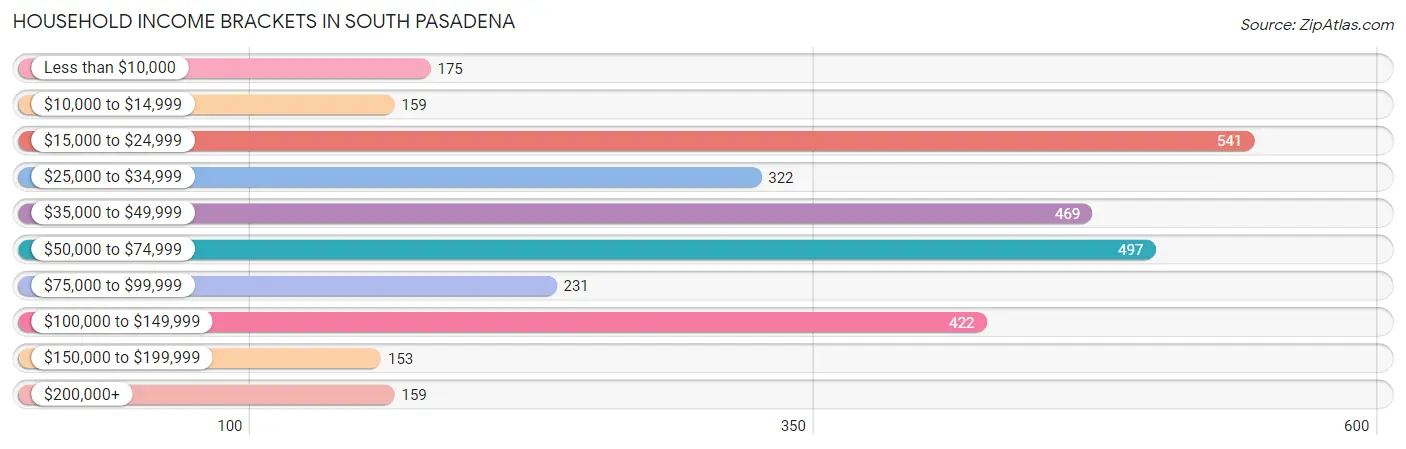
Household Income Brackets in South Pasadena
With 541 households falling in the category, the $15,000 to $24,999 income range is the most frequent in South Pasadena, accounting for 17.3% of all households. In contrast, only 153 households (4.9%) fall into the $150,000 to $199,999 income bracket, making it the least populous group.
| Income Bracket | # Households | % Households |
| Less than $10,000 | 175 | 5.6% |
| $10,000 to $14,999 | 159 | 5.1% |
| $15,000 to $24,999 | 541 | 17.3% |
| $25,000 to $34,999 | 322 | 10.3% |
| $35,000 to $49,999 | 469 | 15.0% |
| $50,000 to $74,999 | 497 | 15.9% |
| $75,000 to $99,999 | 231 | 7.4% |
| $100,000 to $149,999 | 422 | 13.5% |
| $150,000 to $199,999 | 153 | 4.9% |
| $200,000+ | 159 | 5.1% |
Household Income by Householder Age in South Pasadena
The median household income in South Pasadena is $48,490, with the highest median household income of $77,689 found in the 25 to 44 years age bracket for the primary householder. A total of 321 households (10.3%) fall into this category. Meanwhile, the 15 to 24 years age bracket for the primary householder has the lowest median household income of $0, with 32 households (1.0%) in this group.
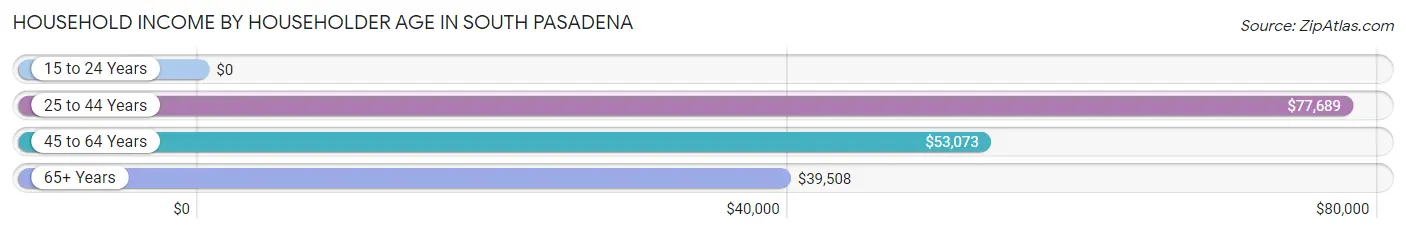
| Income Bracket | # Households | Median Income |
| 15 to 24 Years | 32 (1.0%) | $0 |
| 25 to 44 Years | 321 (10.3%) | $77,689 |
| 45 to 64 Years | 571 (18.3%) | $53,073 |
| 65+ Years | 2,203 (70.5%) | $39,508 |
| Total | 3,127 (100.0%) | $48,490 |
Poverty in South Pasadena
Income Below Poverty by Sex and Age in South Pasadena
With 8.9% poverty level for males and 13.2% for females among the residents of South Pasadena, under 5 year old males and 55 to 64 year old females are the most vulnerable to poverty, with 16 males (51.6%) and 142 females (27.3%) in their respective age groups living below the poverty level.
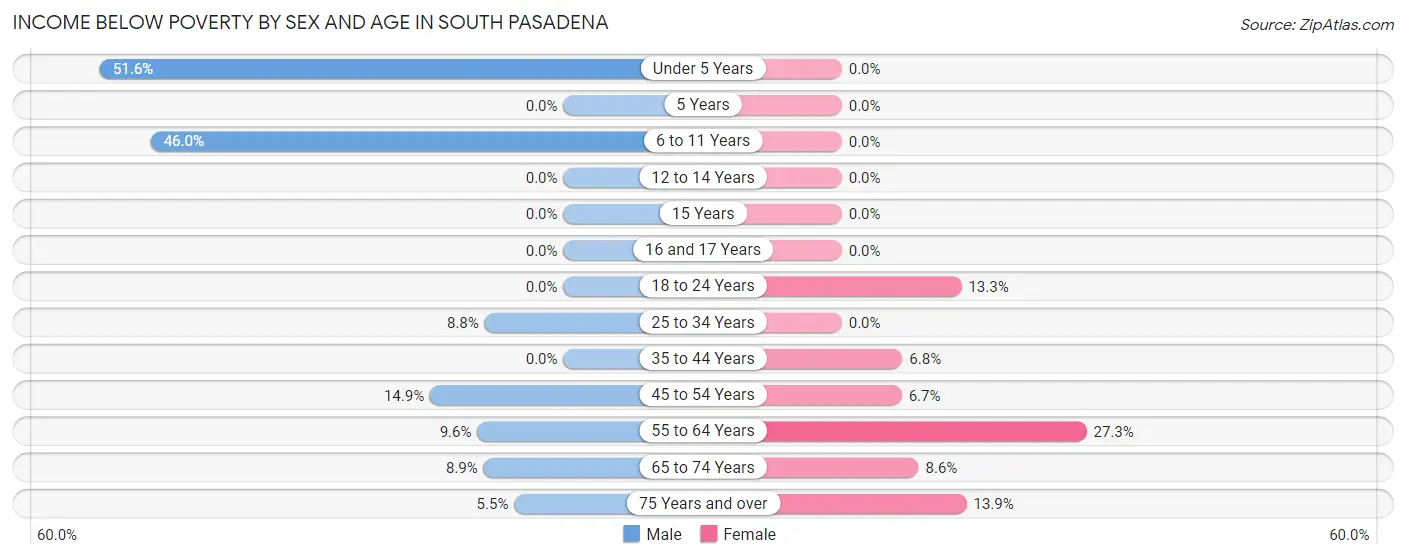
| Age Bracket | Male | Female |
| Under 5 Years | 16 (51.6%) | 0 (0.0%) |
| 5 Years | 0 (0.0%) | 0 (0.0%) |
| 6 to 11 Years | 17 (46.0%) | 0 (0.0%) |
| 12 to 14 Years | 0 (0.0%) | 0 (0.0%) |
| 15 Years | 0 (0.0%) | 0 (0.0%) |
| 16 and 17 Years | 0 (0.0%) | 0 (0.0%) |
| 18 to 24 Years | 0 (0.0%) | 8 (13.3%) |
| 25 to 34 Years | 15 (8.8%) | 0 (0.0%) |
| 35 to 44 Years | 0 (0.0%) | 17 (6.8%) |
| 45 to 54 Years | 15 (14.8%) | 8 (6.7%) |
| 55 to 64 Years | 23 (9.6%) | 142 (27.3%) |
| 65 to 74 Years | 71 (8.9%) | 68 (8.6%) |
| 75 Years and over | 32 (5.5%) | 154 (13.9%) |
| Total | 189 (8.9%) | 397 (13.2%) |
Income Above Poverty by Sex and Age in South Pasadena
According to the poverty statistics in South Pasadena, males aged 18 to 24 years and females aged under 5 years are the age groups that are most secure financially, with 100.0% of males and 100.0% of females in these age groups living above the poverty line.
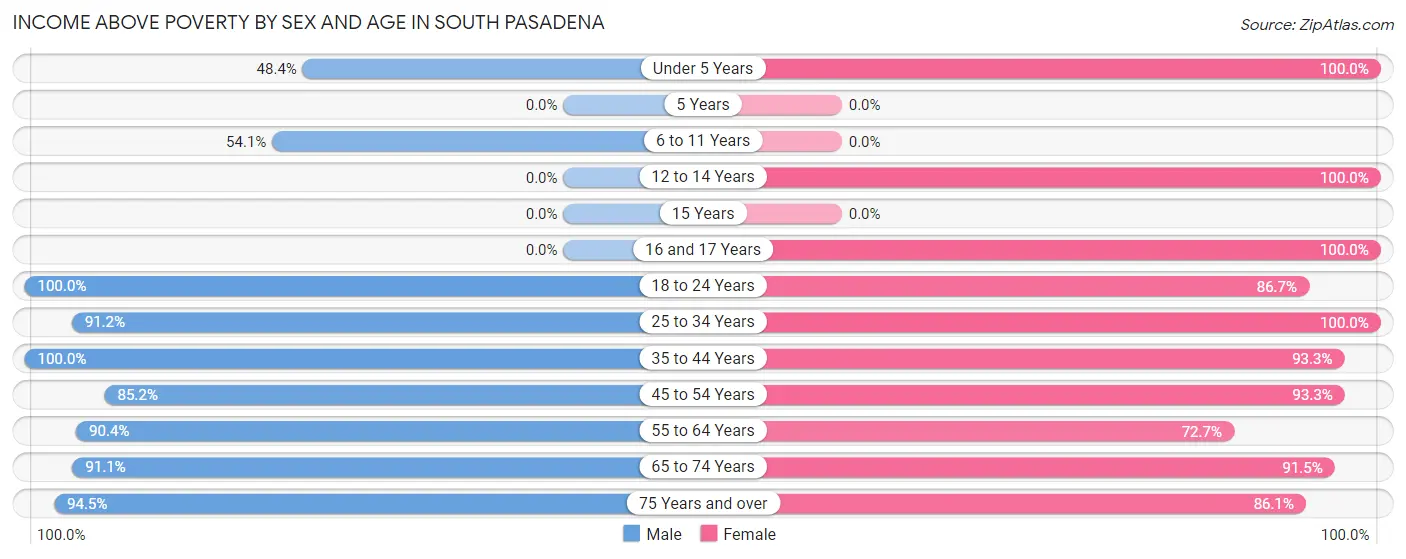
| Age Bracket | Male | Female |
| Under 5 Years | 15 (48.4%) | 35 (100.0%) |
| 5 Years | 0 (0.0%) | 0 (0.0%) |
| 6 to 11 Years | 20 (54.0%) | 0 (0.0%) |
| 12 to 14 Years | 0 (0.0%) | 10 (100.0%) |
| 15 Years | 0 (0.0%) | 0 (0.0%) |
| 16 and 17 Years | 0 (0.0%) | 39 (100.0%) |
| 18 to 24 Years | 74 (100.0%) | 52 (86.7%) |
| 25 to 34 Years | 156 (91.2%) | 66 (100.0%) |
| 35 to 44 Years | 86 (100.0%) | 235 (93.2%) |
| 45 to 54 Years | 86 (85.2%) | 112 (93.3%) |
| 55 to 64 Years | 217 (90.4%) | 379 (72.7%) |
| 65 to 74 Years | 729 (91.1%) | 727 (91.4%) |
| 75 Years and over | 553 (94.5%) | 955 (86.1%) |
| Total | 1,936 (91.1%) | 2,610 (86.8%) |
Income Below Poverty Among Married-Couple Families in South Pasadena
The poverty statistics for married-couple families in South Pasadena show that 1.9% or 18 of the total 921 families live below the poverty line. Families with no children have the highest poverty rate of 2.0%, comprising of 18 families. On the other hand, families with 1 or 2 children have the lowest poverty rate of 0.0%, which includes 0 families.
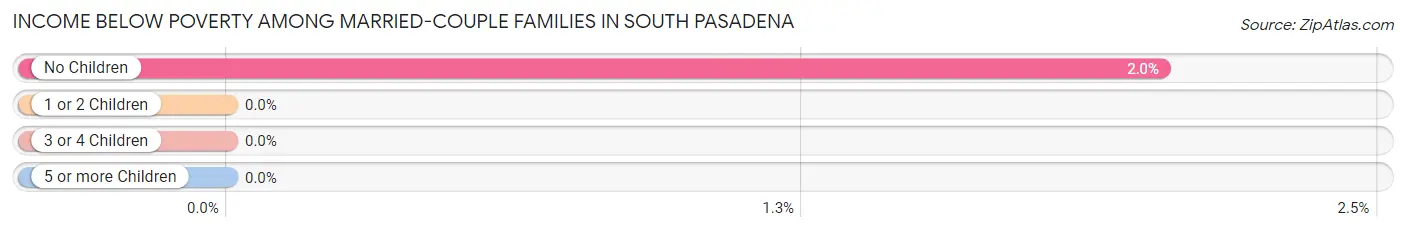
| Children | Above Poverty | Below Poverty |
| No Children | 867 (98.0%) | 18 (2.0%) |
| 1 or 2 Children | 36 (100.0%) | 0 (0.0%) |
| 3 or 4 Children | 0 (0.0%) | 0 (0.0%) |
| 5 or more Children | 0 (0.0%) | 0 (0.0%) |
| Total | 903 (98.1%) | 18 (1.9%) |
Income Below Poverty Among Single-Parent Households in South Pasadena
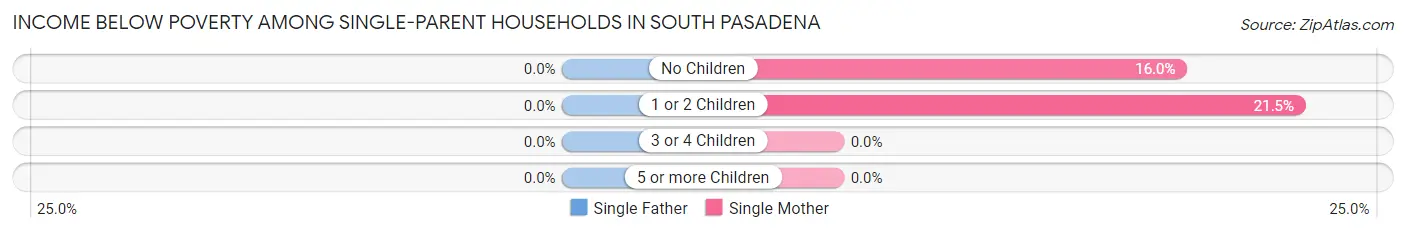
| Children | Single Father | Single Mother |
| No Children | 0 (0.0%) | 16 (16.0%) |
| 1 or 2 Children | 0 (0.0%) | 17 (21.5%) |
| 3 or 4 Children | 0 (0.0%) | 0 (0.0%) |
| 5 or more Children | 0 (0.0%) | 0 (0.0%) |
| Total | 0 (0.0%) | 33 (18.4%) |
Income Below Poverty Among Married-Couple vs Single-Parent Households in South Pasadena
The poverty data for South Pasadena shows that 18 of the married-couple family households (1.9%) and 33 of the single-parent households (17.5%) are living below the poverty level. Within the married-couple family households, those with no children have the highest poverty rate, with 18 households (2.0%) falling below the poverty line. Among the single-parent households, those with 1 or 2 children have the highest poverty rate, with 17 household (21.5%) living below poverty.
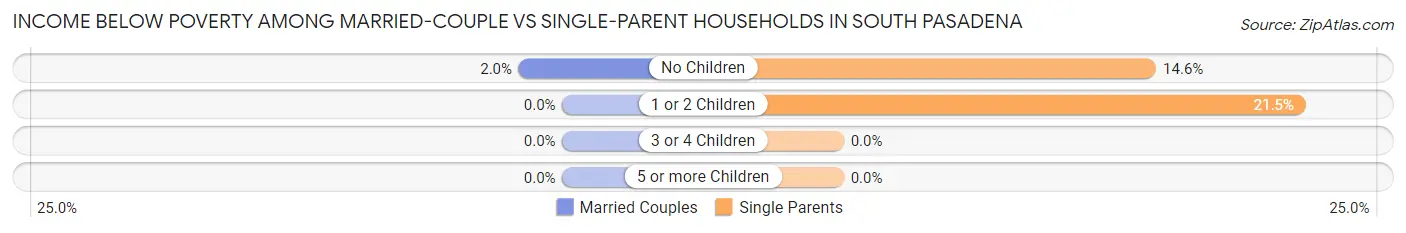
| Children | Married-Couple Families | Single-Parent Households |
| No Children | 18 (2.0%) | 16 (14.5%) |
| 1 or 2 Children | 0 (0.0%) | 17 (21.5%) |
| 3 or 4 Children | 0 (0.0%) | 0 (0.0%) |
| 5 or more Children | 0 (0.0%) | 0 (0.0%) |
| Total | 18 (1.9%) | 33 (17.5%) |
Race in South Pasadena
The most populous races in South Pasadena are White / Caucasian (4,784 | 89.7%), Hispanic or Latino (417 | 7.8%), and Two or more Races (330 | 6.2%).
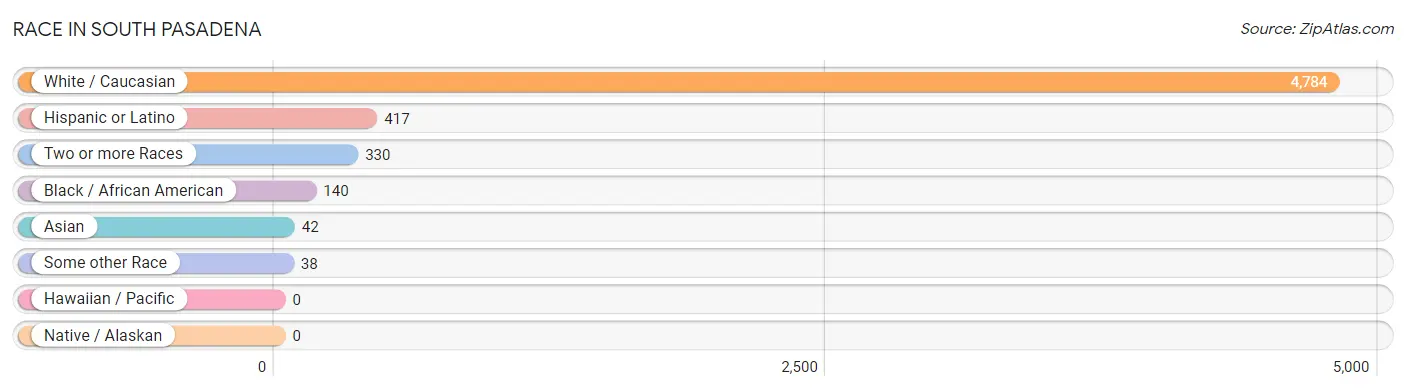
| Race | # Population | % Population |
| Asian | 42 | 0.8% |
| Black / African American | 140 | 2.6% |
| Hawaiian / Pacific | 0 | 0.0% |
| Hispanic or Latino | 417 | 7.8% |
| Native / Alaskan | 0 | 0.0% |
| White / Caucasian | 4,784 | 89.7% |
| Two or more Races | 330 | 6.2% |
| Some other Race | 38 | 0.7% |
| Total | 5,334 | 100.0% |
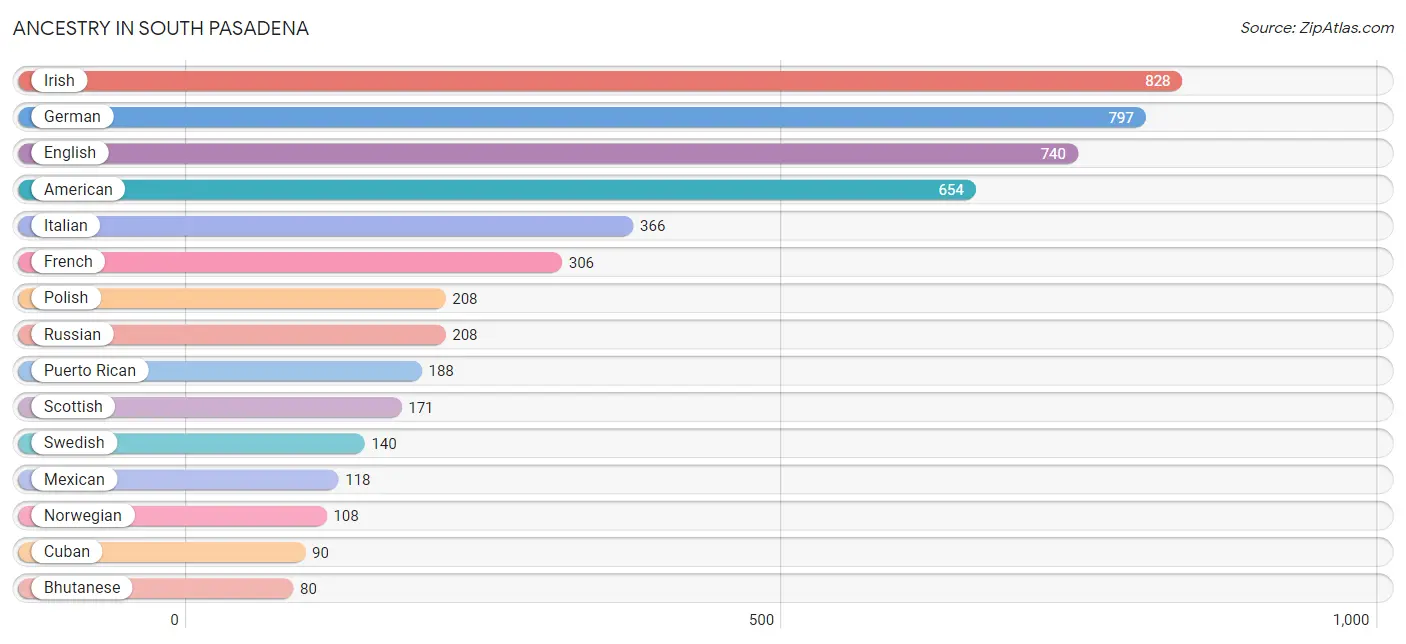
Ancestry in South Pasadena
The most populous ancestries reported in South Pasadena are Irish (828 | 15.5%), German (797 | 14.9%), English (740 | 13.9%), American (654 | 12.3%), and Italian (366 | 6.9%), together accounting for 63.4% of all South Pasadena residents.
| Ancestry | # Population | % Population |
| American | 654 | 12.3% |
| Armenian | 22 | 0.4% |
| Austrian | 16 | 0.3% |
| Bhutanese | 80 | 1.5% |
| Brazilian | 14 | 0.3% |
| British | 25 | 0.5% |
| Canadian | 18 | 0.3% |
| Celtic | 29 | 0.5% |
| Colombian | 11 | 0.2% |
| Croatian | 21 | 0.4% |
| Cuban | 90 | 1.7% |
| Cypriot | 8 | 0.2% |
| Czech | 27 | 0.5% |
| Czechoslovakian | 15 | 0.3% |
| Dutch | 26 | 0.5% |
| English | 740 | 13.9% |
| European | 15 | 0.3% |
| Finnish | 9 | 0.2% |
| French | 306 | 5.7% |
| French Canadian | 43 | 0.8% |
| German | 797 | 14.9% |
| Greek | 22 | 0.4% |
| Hungarian | 50 | 0.9% |
| Icelander | 9 | 0.2% |
| Inupiat | 6 | 0.1% |
| Irish | 828 | 15.5% |
| Italian | 366 | 6.9% |
| Jamaican | 15 | 0.3% |
| Latvian | 13 | 0.2% |
| Lithuanian | 26 | 0.5% |
| Mexican | 118 | 2.2% |
| Norwegian | 108 | 2.0% |
| Pennsylvania German | 15 | 0.3% |
| Polish | 208 | 3.9% |
| Puerto Rican | 188 | 3.5% |
| Russian | 208 | 3.9% |
| Scandinavian | 20 | 0.4% |
| Scotch-Irish | 45 | 0.8% |
| Scottish | 171 | 3.2% |
| Slovak | 28 | 0.5% |
| South American | 11 | 0.2% |
| Spaniard | 10 | 0.2% |
| Swedish | 140 | 2.6% |
| Swiss | 9 | 0.2% |
| Turkish | 14 | 0.3% |
| Ukrainian | 49 | 0.9% |
| Welsh | 47 | 0.9% |
| Yugoslavian | 14 | 0.3% | View All 48 Rows |
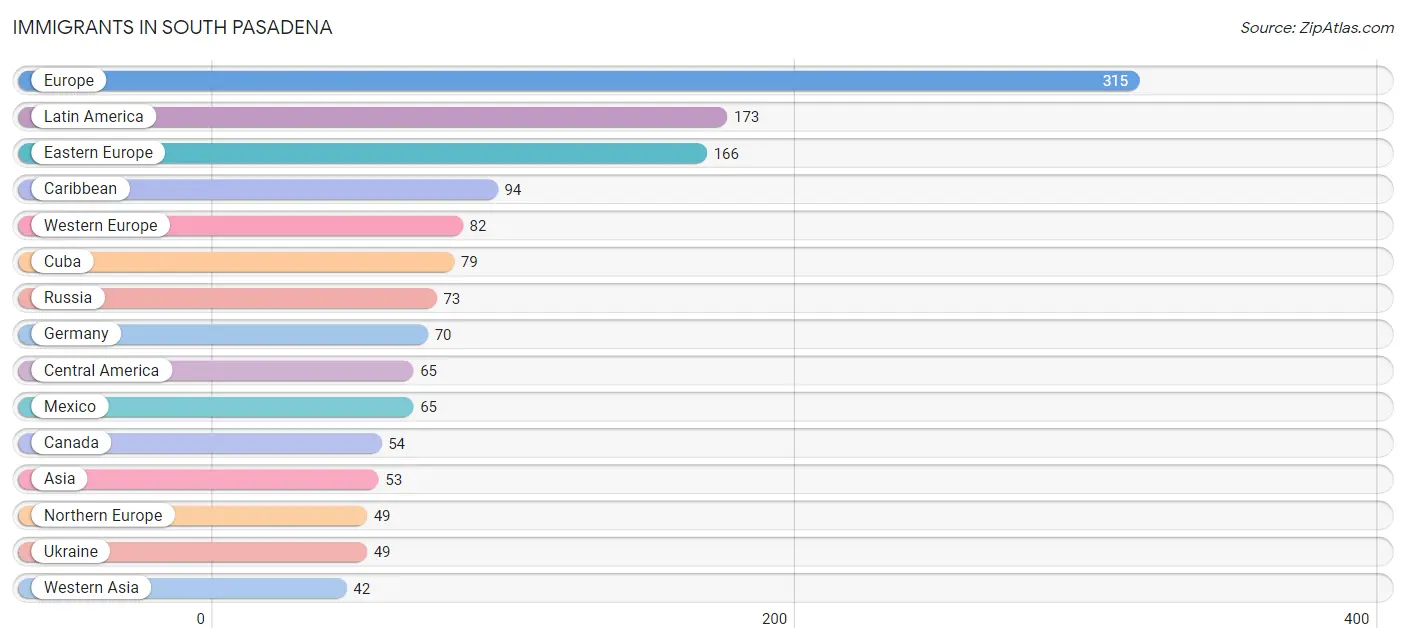
Immigrants in South Pasadena
The most numerous immigrant groups reported in South Pasadena came from Europe (315 | 5.9%), Latin America (173 | 3.2%), Eastern Europe (166 | 3.1%), Caribbean (94 | 1.8%), and Western Europe (82 | 1.5%), together accounting for 15.6% of all South Pasadena residents.
| Immigration Origin | # Population | % Population |
| Asia | 53 | 1.0% |
| Brazil | 10 | 0.2% |
| Canada | 54 | 1.0% |
| Caribbean | 94 | 1.8% |
| Central America | 65 | 1.2% |
| Colombia | 4 | 0.1% |
| Croatia | 12 | 0.2% |
| Cuba | 79 | 1.5% |
| Eastern Europe | 166 | 3.1% |
| England | 11 | 0.2% |
| Europe | 315 | 5.9% |
| France | 12 | 0.2% |
| Germany | 70 | 1.3% |
| Hungary | 18 | 0.3% |
| Italy | 18 | 0.3% |
| Jamaica | 15 | 0.3% |
| Kazakhstan | 11 | 0.2% |
| Latin America | 173 | 3.2% |
| Mexico | 65 | 1.2% |
| Northern Europe | 49 | 0.9% |
| Russia | 73 | 1.4% |
| Scotland | 21 | 0.4% |
| South America | 14 | 0.3% |
| South Central Asia | 11 | 0.2% |
| Southern Europe | 18 | 0.3% |
| Turkey | 36 | 0.7% |
| Ukraine | 49 | 0.9% |
| Western Asia | 42 | 0.8% |
| Western Europe | 82 | 1.5% | View All 29 Rows |
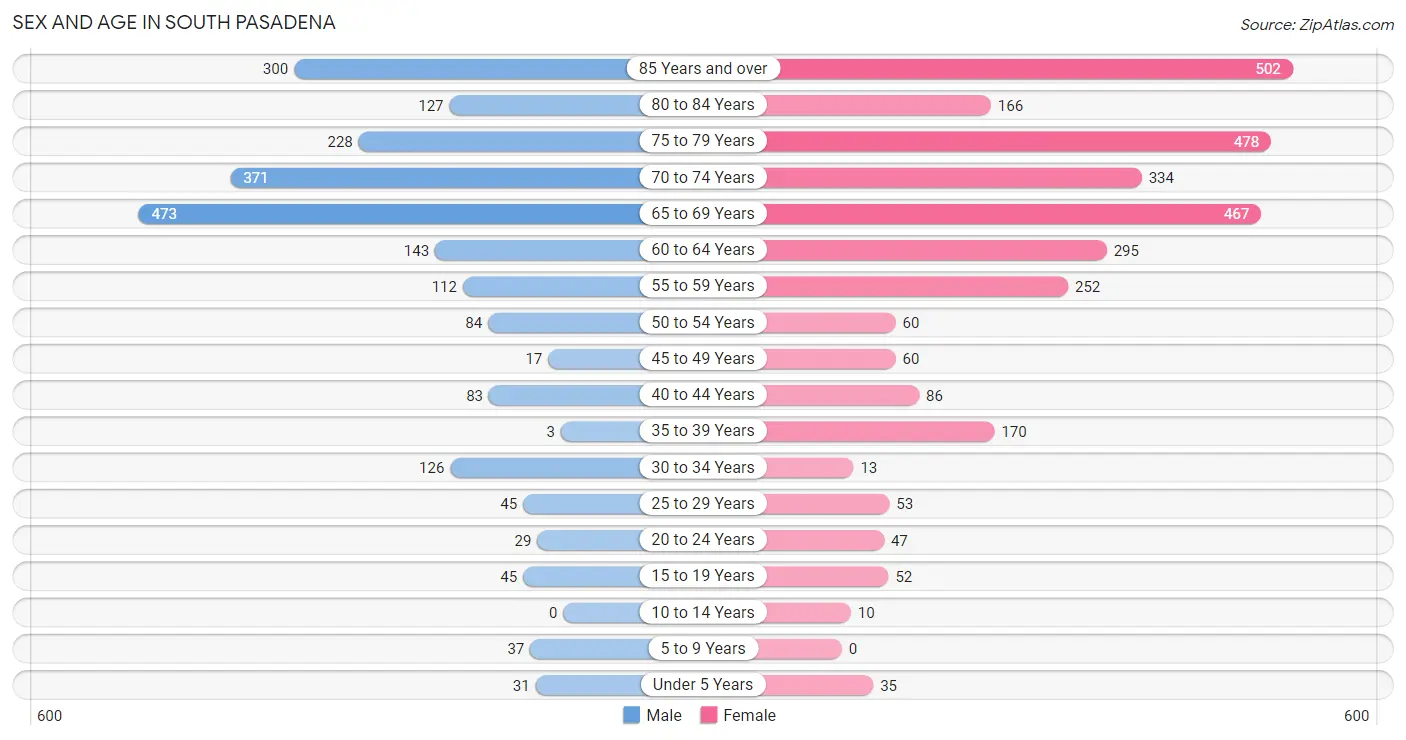
Sex and Age in South Pasadena
Sex and Age in South Pasadena
The most populous age groups in South Pasadena are 65 to 69 Years (473 | 21.0%) for men and 85 Years and over (502 | 16.3%) for women.
| Age Bracket | Male | Female |
| Under 5 Years | 31 (1.4%) | 35 (1.1%) |
| 5 to 9 Years | 37 (1.6%) | 0 (0.0%) |
| 10 to 14 Years | 0 (0.0%) | 10 (0.3%) |
| 15 to 19 Years | 45 (2.0%) | 52 (1.7%) |
| 20 to 24 Years | 29 (1.3%) | 47 (1.5%) |
| 25 to 29 Years | 45 (2.0%) | 53 (1.7%) |
| 30 to 34 Years | 126 (5.6%) | 13 (0.4%) |
| 35 to 39 Years | 3 (0.1%) | 170 (5.5%) |
| 40 to 44 Years | 83 (3.7%) | 86 (2.8%) |
| 45 to 49 Years | 17 (0.7%) | 60 (1.9%) |
| 50 to 54 Years | 84 (3.7%) | 60 (1.9%) |
| 55 to 59 Years | 112 (5.0%) | 252 (8.2%) |
| 60 to 64 Years | 143 (6.3%) | 295 (9.6%) |
| 65 to 69 Years | 473 (21.0%) | 467 (15.2%) |
| 70 to 74 Years | 371 (16.5%) | 334 (10.8%) |
| 75 to 79 Years | 228 (10.1%) | 478 (15.5%) |
| 80 to 84 Years | 127 (5.6%) | 166 (5.4%) |
| 85 Years and over | 300 (13.3%) | 502 (16.3%) |
| Total | 2,254 (100.0%) | 3,080 (100.0%) |
Families and Households in South Pasadena
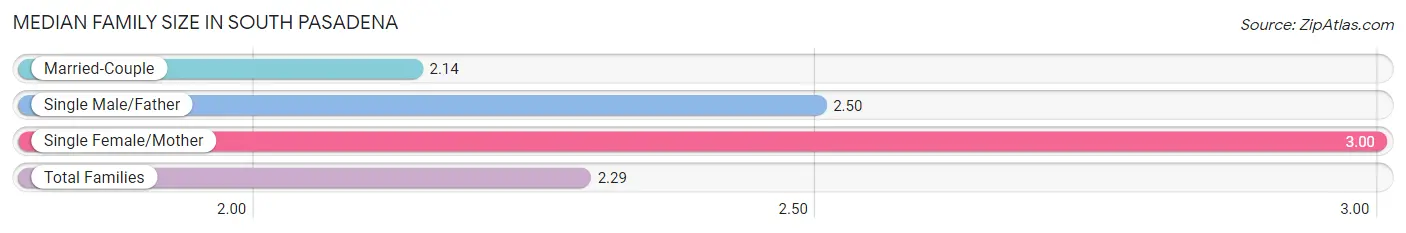
Median Family Size in South Pasadena
The median family size in South Pasadena is 2.29 persons per family, with single female/mother families (179 | 16.1%) accounting for the largest median family size of 3 persons per family. On the other hand, married-couple families (921 | 83.0%) represent the smallest median family size with 2.14 persons per family.
| Family Type | # Families | Family Size |
| Married-Couple | 921 (83.0%) | 2.14 |
| Single Male/Father | 10 (0.9%) | 2.50 |
| Single Female/Mother | 179 (16.1%) | 3.00 |
| Total Families | 1,110 (100.0%) | 2.29 |
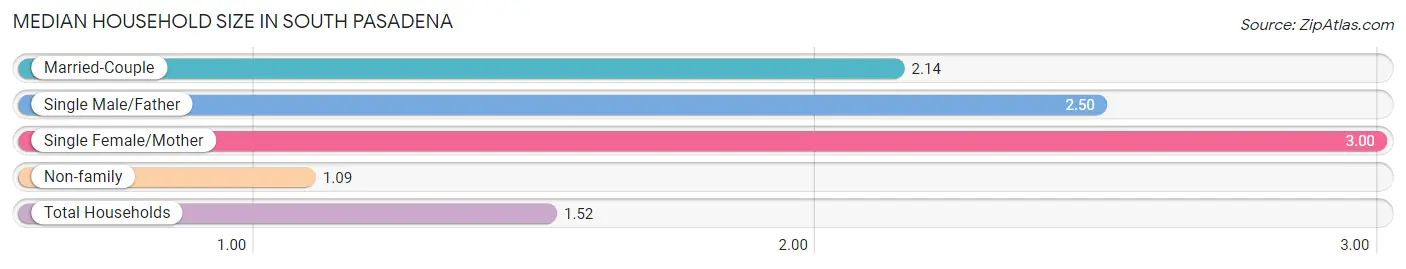
Median Household Size in South Pasadena
The median household size in South Pasadena is 1.52 persons per household, with single female/mother households (179 | 5.7%) accounting for the largest median household size of 3 persons per household. non-family households (2,017 | 64.5%) represent the smallest median household size with 1.09 persons per household.
| Household Type | # Households | Household Size |
| Married-Couple | 921 (29.4%) | 2.14 |
| Single Male/Father | 10 (0.3%) | 2.50 |
| Single Female/Mother | 179 (5.7%) | 3.00 |
| Non-family | 2,017 (64.5%) | 1.09 |
| Total Households | 3,127 (100.0%) | 1.52 |
Household Size by Marriage Status in South Pasadena
Out of a total of 3,127 households in South Pasadena, 1,110 (35.5%) are family households, while 2,017 (64.5%) are nonfamily households. The most numerous type of family households are 2-person households, comprising 985, and the most common type of nonfamily households are 1-person households, comprising 1,859.
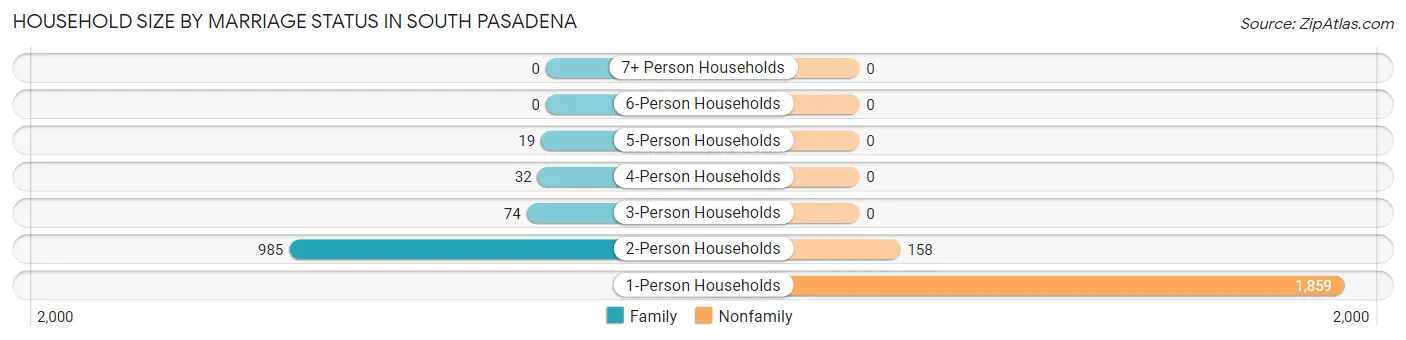
| Household Size | Family Households | Nonfamily Households |
| 1-Person Households | - | 1,859 (59.5%) |
| 2-Person Households | 985 (31.5%) | 158 (5.1%) |
| 3-Person Households | 74 (2.4%) | 0 (0.0%) |
| 4-Person Households | 32 (1.0%) | 0 (0.0%) |
| 5-Person Households | 19 (0.6%) | 0 (0.0%) |
| 6-Person Households | 0 (0.0%) | 0 (0.0%) |
| 7+ Person Households | 0 (0.0%) | 0 (0.0%) |
| Total | 1,110 (35.5%) | 2,017 (64.5%) |
Female Fertility in South Pasadena
Fertility by Age in South Pasadena
Average fertility rate in South Pasadena is 29.0 births per 1,000 women. Women in the age bracket of 20 to 34 years have the highest fertility rate with 124.0 births per 1,000 women. Women in the age bracket of 20 to 34 years acount for 100.0% of all women with births.
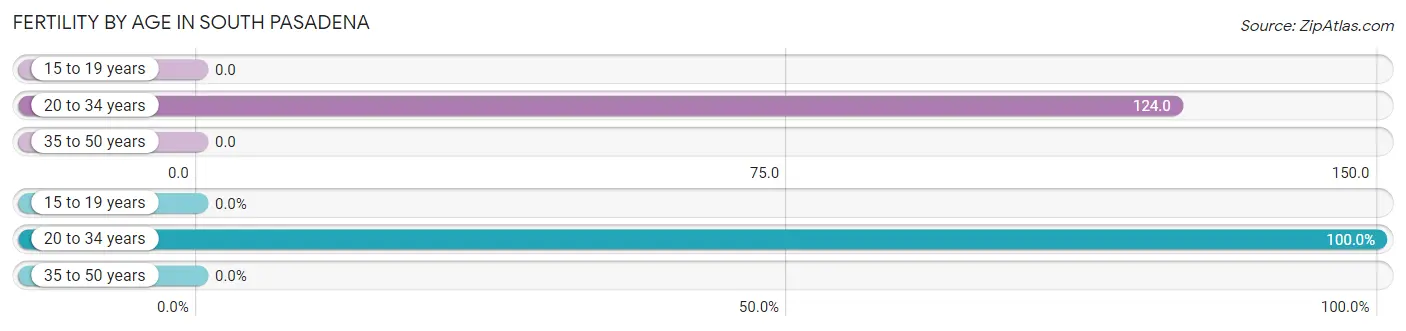
| Age Bracket | Women with Births | Births / 1,000 Women |
| 15 to 19 years | 0 (0.0%) | 0.0 |
| 20 to 34 years | 14 (100.0%) | 124.0 |
| 35 to 50 years | 0 (0.0%) | 0.0 |
| Total | 14 (100.0%) | 29.0 |
Fertility by Age by Marriage Status in South Pasadena
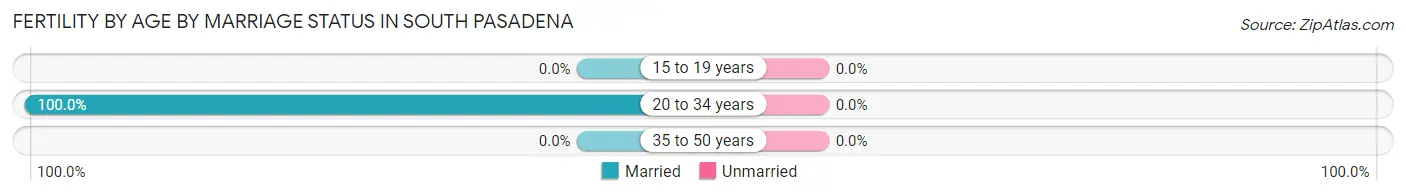
| Age Bracket | Married | Unmarried |
| 15 to 19 years | 0 (0.0%) | 0 (0.0%) |
| 20 to 34 years | 14 (100.0%) | 0 (0.0%) |
| 35 to 50 years | 0 (0.0%) | 0 (0.0%) |
| Total | 14 (100.0%) | 0 (0.0%) |
Fertility by Education in South Pasadena
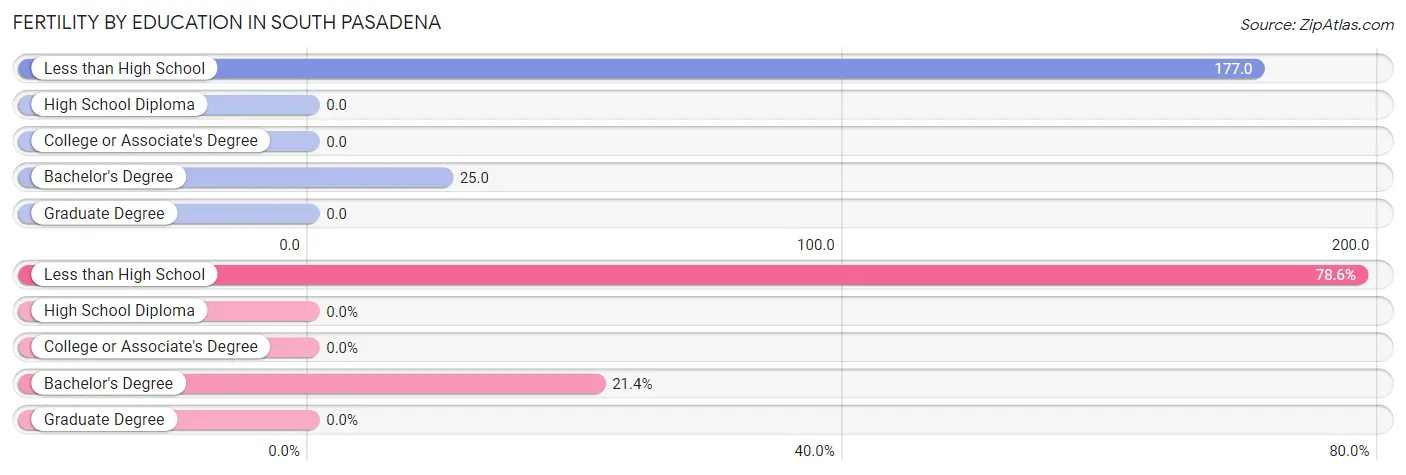
| Educational Attainment | Women with Births | Births / 1,000 Women |
| Less than High School | 11 (78.6%) | 177.0 |
| High School Diploma | 0 (0.0%) | 0.0 |
| College or Associate's Degree | 0 (0.0%) | 0.0 |
| Bachelor's Degree | 3 (21.4%) | 25.0 |
| Graduate Degree | 0 (0.0%) | 0.0 |
| Total | 14 (100.0%) | 29.0 |
Fertility by Education by Marriage Status in South Pasadena
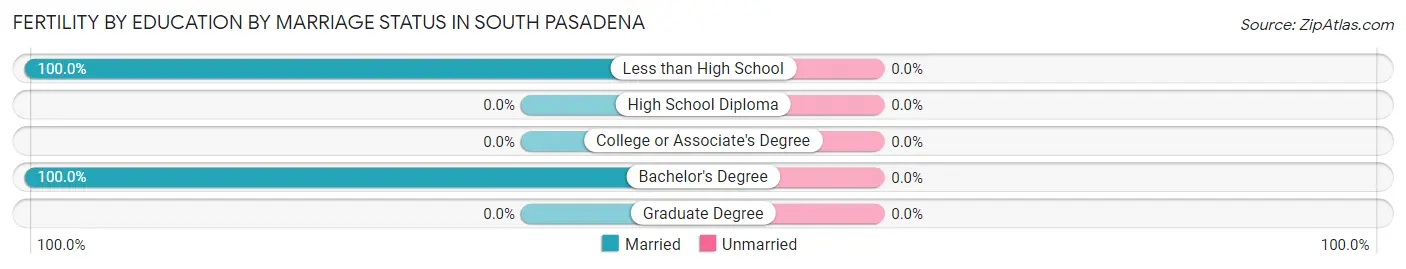
| Educational Attainment | Married | Unmarried |
| Less than High School | 11 (100.0%) | 0 (0.0%) |
| High School Diploma | 0 (0.0%) | 0 (0.0%) |
| College or Associate's Degree | 0 (0.0%) | 0 (0.0%) |
| Bachelor's Degree | 3 (100.0%) | 0 (0.0%) |
| Graduate Degree | 0 (0.0%) | 0 (0.0%) |
| Total | 14 (100.0%) | 0 (0.0%) |
Employment Characteristics in South Pasadena
Employment by Class of Employer in South Pasadena
Among the 1,512 employed individuals in South Pasadena, private company employees (1,039 | 68.7%), self-employed (incorporated) (137 | 9.1%), and local government employees (125 | 8.3%) make up the most common classes of employment.
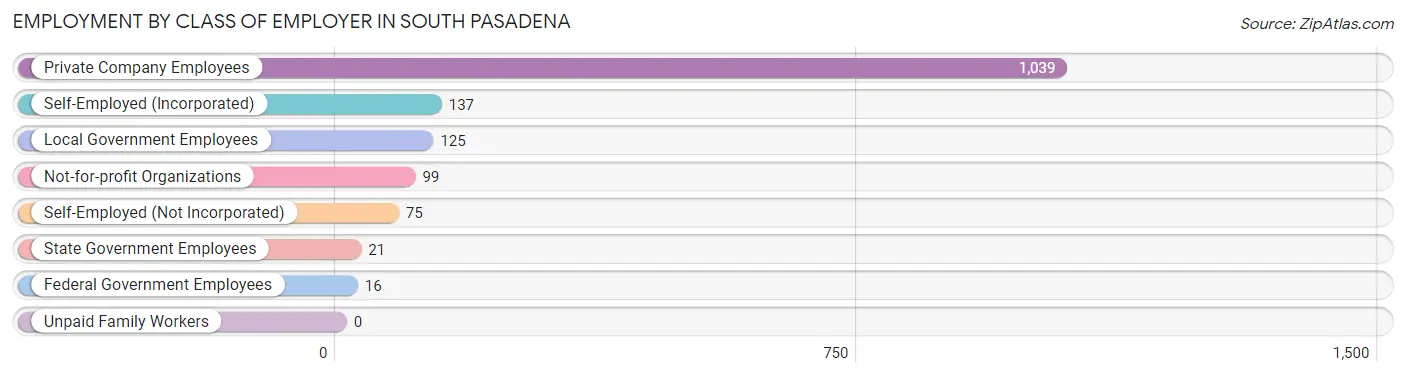
| Employer Class | # Employees | % Employees |
| Private Company Employees | 1,039 | 68.7% |
| Self-Employed (Incorporated) | 137 | 9.1% |
| Self-Employed (Not Incorporated) | 75 | 5.0% |
| Not-for-profit Organizations | 99 | 6.6% |
| Local Government Employees | 125 | 8.3% |
| State Government Employees | 21 | 1.4% |
| Federal Government Employees | 16 | 1.1% |
| Unpaid Family Workers | 0 | 0.0% |
| Total | 1,512 | 100.0% |
Employment Status by Age in South Pasadena
According to the labor force statistics for South Pasadena, out of the total population over 16 years of age (5,221), 31.7% or 1,655 individuals are in the labor force, with 6.8% or 113 of them unemployed. The age group with the highest labor force participation rate is 20 to 24 years, with 100.0% or 76 individuals in the labor force. Within the labor force, the 45 to 54 years age range has the highest percentage of unemployed individuals, with 20.1% or 39 of them being unemployed.
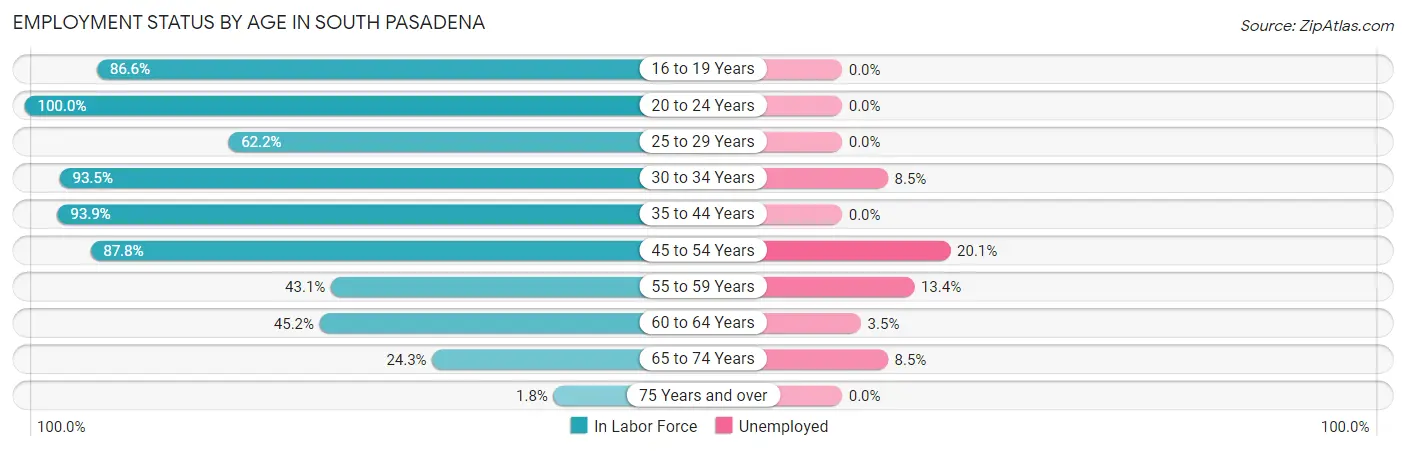
| Age Bracket | In Labor Force | Unemployed |
| 16 to 19 Years | 84 (86.6%) | 0 (0.0%) |
| 20 to 24 Years | 76 (100.0%) | 0 (0.0%) |
| 25 to 29 Years | 61 (62.2%) | 0 (0.0%) |
| 30 to 34 Years | 130 (93.5%) | 11 (8.5%) |
| 35 to 44 Years | 321 (93.9%) | 0 (0.0%) |
| 45 to 54 Years | 194 (87.8%) | 39 (20.1%) |
| 55 to 59 Years | 157 (43.1%) | 21 (13.4%) |
| 60 to 64 Years | 198 (45.2%) | 7 (3.5%) |
| 65 to 74 Years | 400 (24.3%) | 34 (8.5%) |
| 75 Years and over | 32 (1.8%) | 0 (0.0%) |
| Total | 1,655 (31.7%) | 113 (6.8%) |
Employment Status by Educational Attainment in South Pasadena
According to labor force statistics for South Pasadena, 66.2% of individuals (1,061) out of the total population between 25 and 64 years of age (1,602) are in the labor force, with 7.5% or 80 of them being unemployed. The group with the highest labor force participation rate are those with the educational attainment of high school diploma, with 71.1% or 345 individuals in the labor force. Within the labor force, individuals with college / associate degree education have the highest percentage of unemployment, with 15.7% or 46 of them being unemployed.
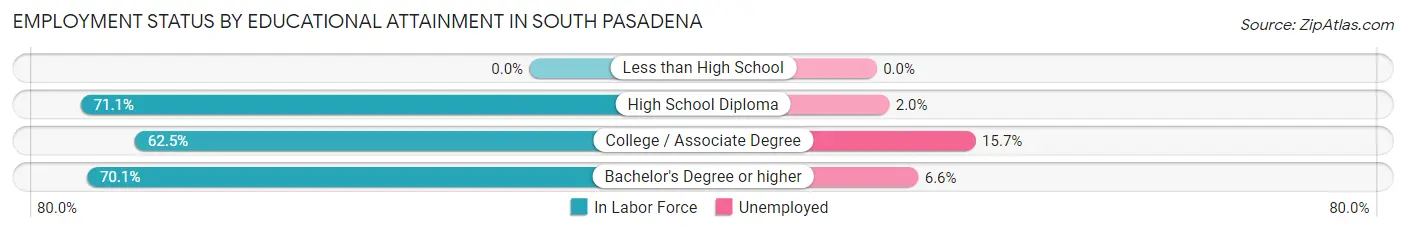
| Educational Attainment | In Labor Force | Unemployed |
| Less than High School | 0 (0.0%) | 0 (0.0%) |
| High School Diploma | 345 (71.1%) | 10 (2.0%) |
| College / Associate Degree | 290 (62.5%) | 73 (15.7%) |
| Bachelor's Degree or higher | 426 (70.1%) | 40 (6.6%) |
| Total | 1,061 (66.2%) | 120 (7.5%) |
Employment Occupations by Sex in South Pasadena
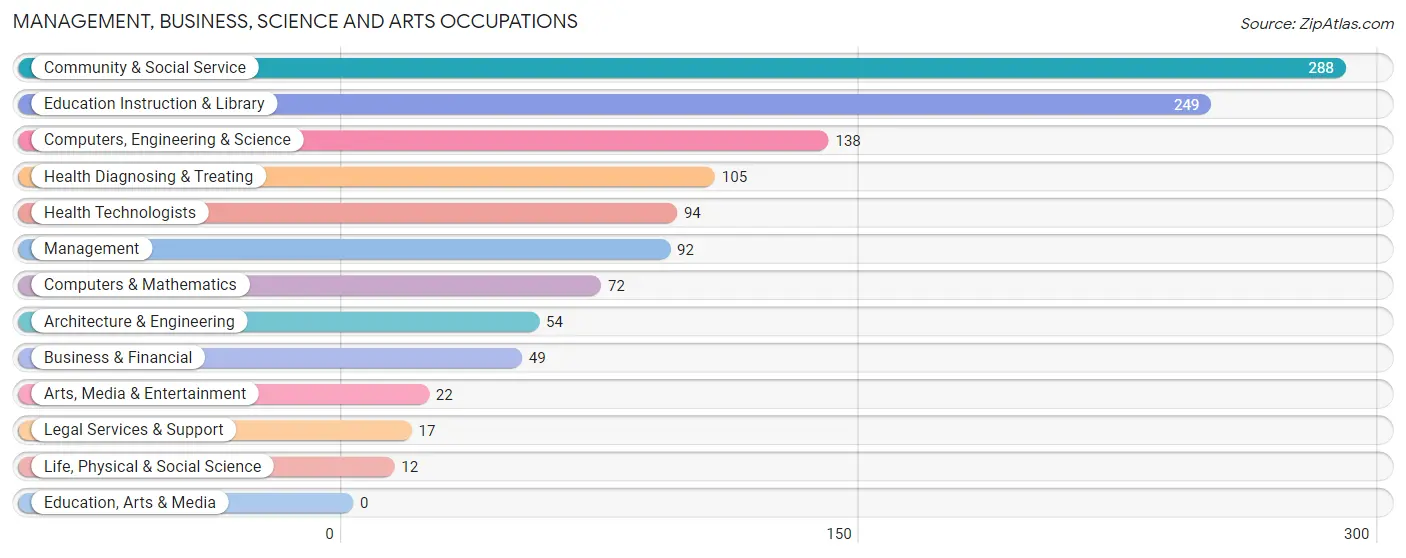
Management, Business, Science and Arts Occupations
The most common Management, Business, Science and Arts occupations in South Pasadena are Community & Social Service (288 | 18.9%), Education Instruction & Library (249 | 16.3%), Computers, Engineering & Science (138 | 9.0%), Health Diagnosing & Treating (105 | 6.9%), and Health Technologists (94 | 6.2%).
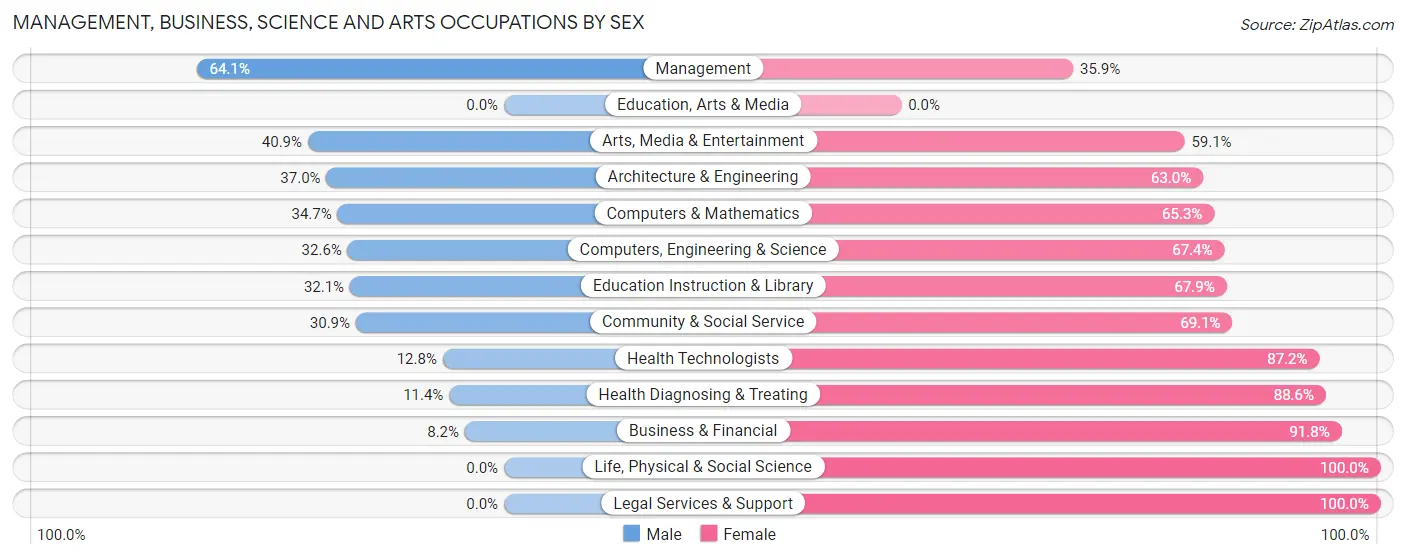
Management, Business, Science and Arts Occupations by Sex
Within the Management, Business, Science and Arts occupations in South Pasadena, the most male-oriented occupations are Management (64.1%), Arts, Media & Entertainment (40.9%), and Architecture & Engineering (37.0%), while the most female-oriented occupations are Life, Physical & Social Science (100.0%), Legal Services & Support (100.0%), and Business & Financial (91.8%).
| Occupation | Male | Female |
| Management | 59 (64.1%) | 33 (35.9%) |
| Business & Financial | 4 (8.2%) | 45 (91.8%) |
| Computers, Engineering & Science | 45 (32.6%) | 93 (67.4%) |
| Computers & Mathematics | 25 (34.7%) | 47 (65.3%) |
| Architecture & Engineering | 20 (37.0%) | 34 (63.0%) |
| Life, Physical & Social Science | 0 (0.0%) | 12 (100.0%) |
| Community & Social Service | 89 (30.9%) | 199 (69.1%) |
| Education, Arts & Media | 0 (0.0%) | 0 (0.0%) |
| Legal Services & Support | 0 (0.0%) | 17 (100.0%) |
| Education Instruction & Library | 80 (32.1%) | 169 (67.9%) |
| Arts, Media & Entertainment | 9 (40.9%) | 13 (59.1%) |
| Health Diagnosing & Treating | 12 (11.4%) | 93 (88.6%) |
| Health Technologists | 12 (12.8%) | 82 (87.2%) |
| Total (Category) | 209 (31.1%) | 463 (68.9%) |
| Total (Overall) | 691 (45.3%) | 835 (54.7%) |
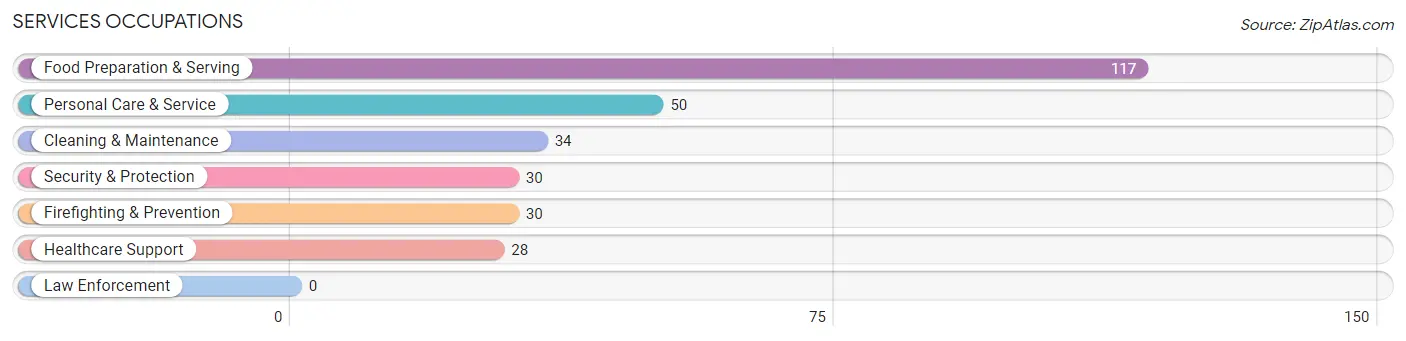
Services Occupations
The most common Services occupations in South Pasadena are Food Preparation & Serving (117 | 7.7%), Personal Care & Service (50 | 3.3%), Cleaning & Maintenance (34 | 2.2%), Security & Protection (30 | 2.0%), and Firefighting & Prevention (30 | 2.0%).
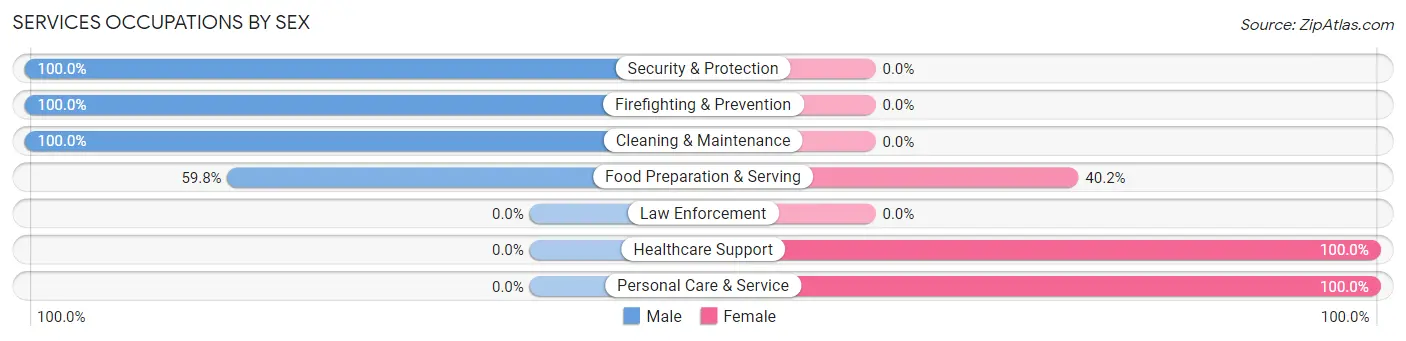
Services Occupations by Sex
Within the Services occupations in South Pasadena, the most male-oriented occupations are Security & Protection (100.0%), Firefighting & Prevention (100.0%), and Cleaning & Maintenance (100.0%), while the most female-oriented occupations are Healthcare Support (100.0%), Personal Care & Service (100.0%), and Food Preparation & Serving (40.2%).
| Occupation | Male | Female |
| Healthcare Support | 0 (0.0%) | 28 (100.0%) |
| Security & Protection | 30 (100.0%) | 0 (0.0%) |
| Firefighting & Prevention | 30 (100.0%) | 0 (0.0%) |
| Law Enforcement | 0 (0.0%) | 0 (0.0%) |
| Food Preparation & Serving | 70 (59.8%) | 47 (40.2%) |
| Cleaning & Maintenance | 34 (100.0%) | 0 (0.0%) |
| Personal Care & Service | 0 (0.0%) | 50 (100.0%) |
| Total (Category) | 134 (51.7%) | 125 (48.3%) |
| Total (Overall) | 691 (45.3%) | 835 (54.7%) |
Sales and Office Occupations
The most common Sales and Office occupations in South Pasadena are Sales & Related (254 | 16.6%), and Office & Administration (186 | 12.2%).
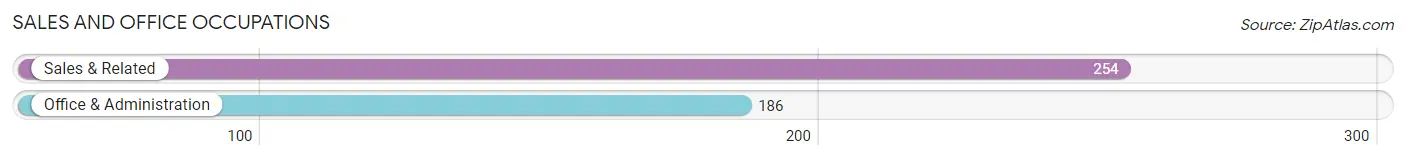
Sales and Office Occupations by Sex
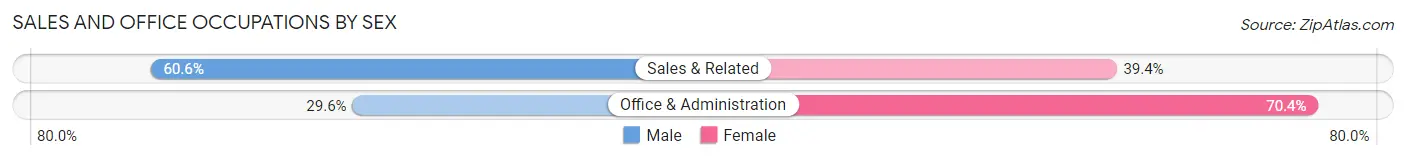
| Occupation | Male | Female |
| Sales & Related | 154 (60.6%) | 100 (39.4%) |
| Office & Administration | 55 (29.6%) | 131 (70.4%) |
| Total (Category) | 209 (47.5%) | 231 (52.5%) |
| Total (Overall) | 691 (45.3%) | 835 (54.7%) |
Natural Resources, Construction and Maintenance Occupations
The most common Natural Resources, Construction and Maintenance occupations in South Pasadena are Installation, Maintenance & Repair (29 | 1.9%), and Construction & Extraction (15 | 1.0%).
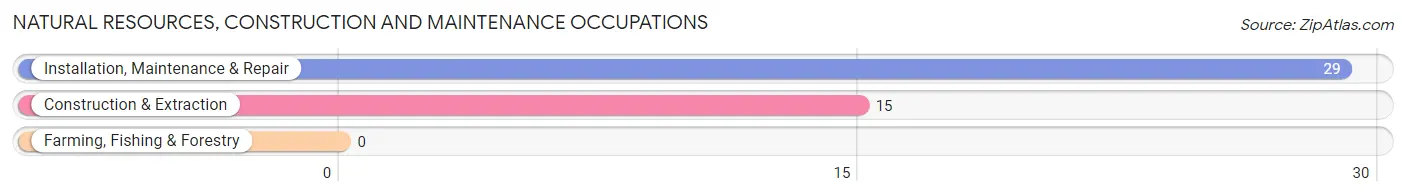
Natural Resources, Construction and Maintenance Occupations by Sex
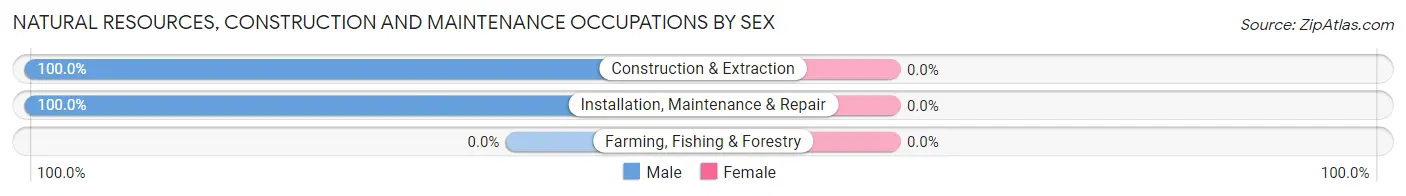
| Occupation | Male | Female |
| Farming, Fishing & Forestry | 0 (0.0%) | 0 (0.0%) |
| Construction & Extraction | 15 (100.0%) | 0 (0.0%) |
| Installation, Maintenance & Repair | 29 (100.0%) | 0 (0.0%) |
| Total (Category) | 44 (100.0%) | 0 (0.0%) |
| Total (Overall) | 691 (45.3%) | 835 (54.7%) |
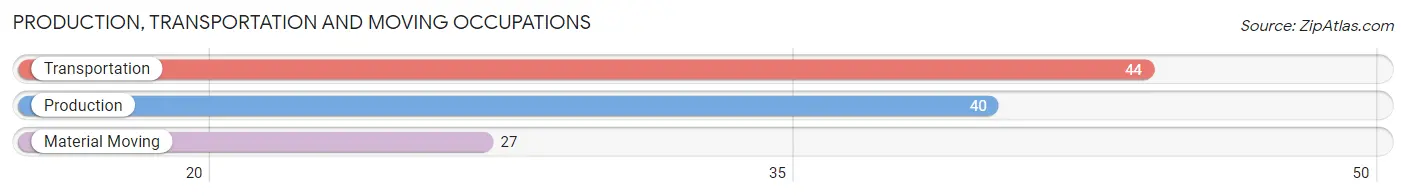
Production, Transportation and Moving Occupations
The most common Production, Transportation and Moving occupations in South Pasadena are Transportation (44 | 2.9%), Production (40 | 2.6%), and Material Moving (27 | 1.8%).
Production, Transportation and Moving Occupations by Sex
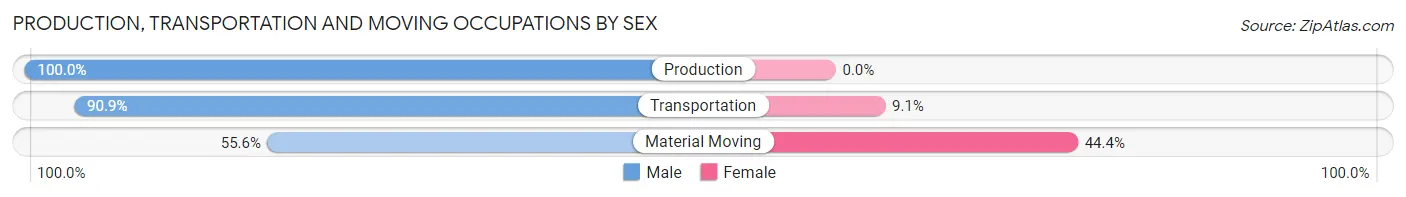
| Occupation | Male | Female |
| Production | 40 (100.0%) | 0 (0.0%) |
| Transportation | 40 (90.9%) | 4 (9.1%) |
| Material Moving | 15 (55.6%) | 12 (44.4%) |
| Total (Category) | 95 (85.6%) | 16 (14.4%) |
| Total (Overall) | 691 (45.3%) | 835 (54.7%) |
Employment Industries by Sex in South Pasadena
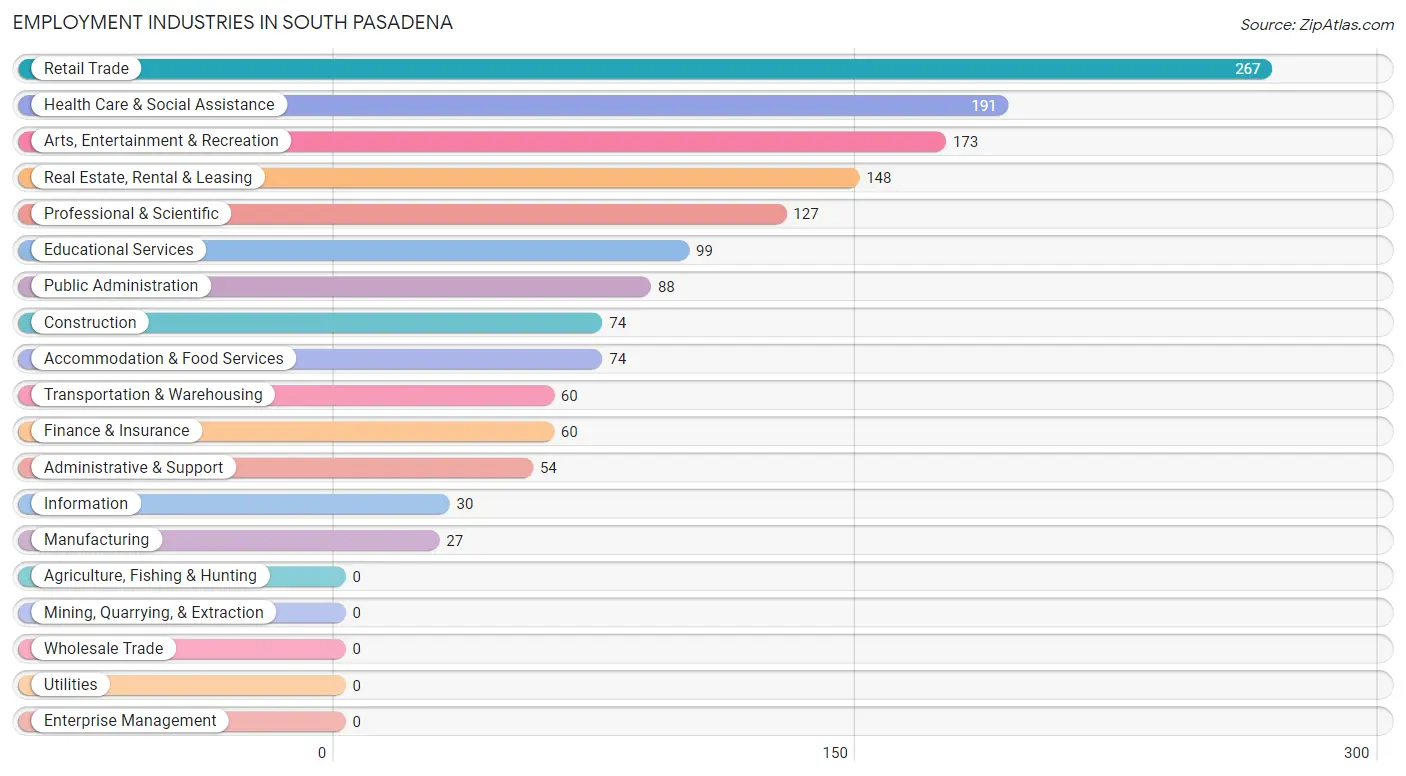
Employment Industries in South Pasadena
The major employment industries in South Pasadena include Retail Trade (267 | 17.5%), Health Care & Social Assistance (191 | 12.5%), Arts, Entertainment & Recreation (173 | 11.3%), Real Estate, Rental & Leasing (148 | 9.7%), and Professional & Scientific (127 | 8.3%).
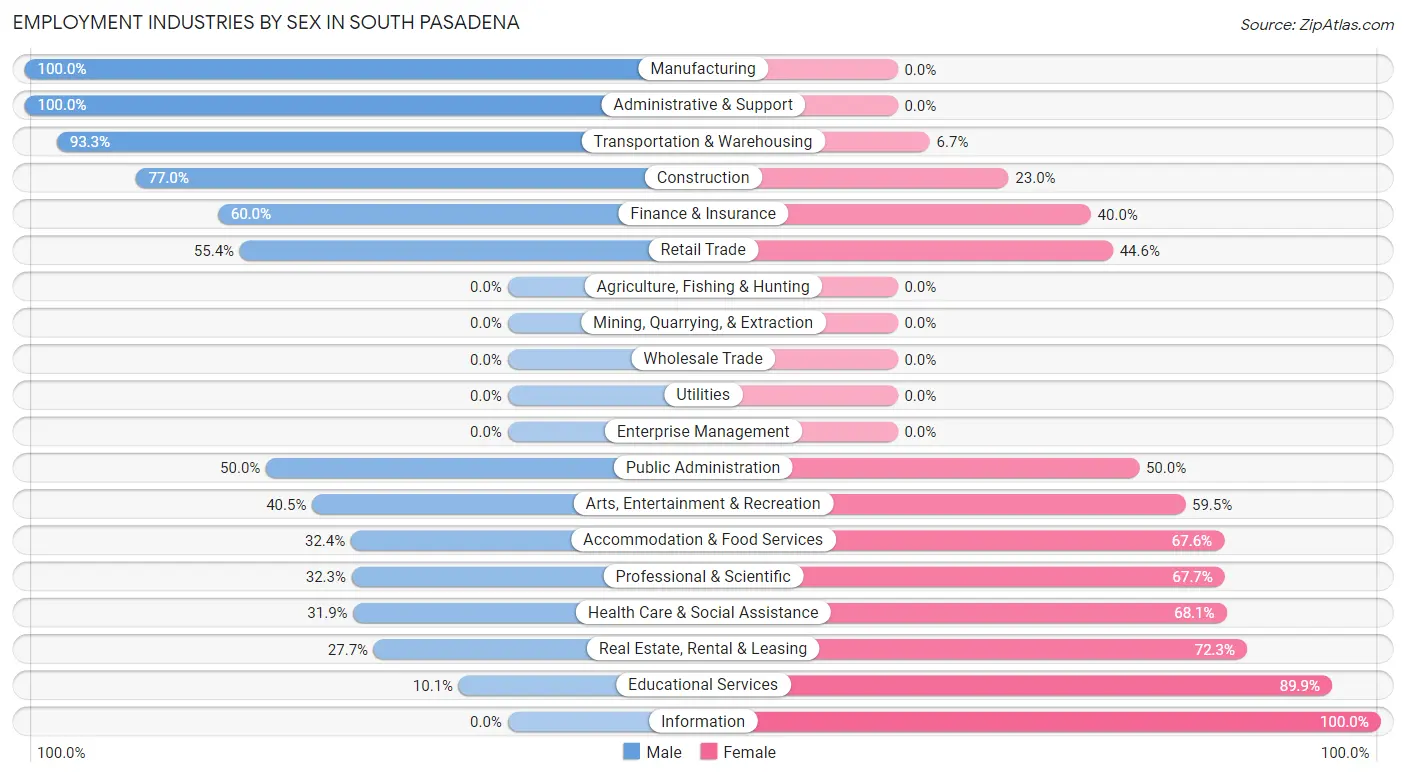
Employment Industries by Sex in South Pasadena
The South Pasadena industries that see more men than women are Manufacturing (100.0%), Administrative & Support (100.0%), and Transportation & Warehousing (93.3%), whereas the industries that tend to have a higher number of women are Information (100.0%), Educational Services (89.9%), and Real Estate, Rental & Leasing (72.3%).
| Industry | Male | Female |
| Agriculture, Fishing & Hunting | 0 (0.0%) | 0 (0.0%) |
| Mining, Quarrying, & Extraction | 0 (0.0%) | 0 (0.0%) |
| Construction | 57 (77.0%) | 17 (23.0%) |
| Manufacturing | 27 (100.0%) | 0 (0.0%) |
| Wholesale Trade | 0 (0.0%) | 0 (0.0%) |
| Retail Trade | 148 (55.4%) | 119 (44.6%) |
| Transportation & Warehousing | 56 (93.3%) | 4 (6.7%) |
| Utilities | 0 (0.0%) | 0 (0.0%) |
| Information | 0 (0.0%) | 30 (100.0%) |
| Finance & Insurance | 36 (60.0%) | 24 (40.0%) |
| Real Estate, Rental & Leasing | 41 (27.7%) | 107 (72.3%) |
| Professional & Scientific | 41 (32.3%) | 86 (67.7%) |
| Enterprise Management | 0 (0.0%) | 0 (0.0%) |
| Administrative & Support | 54 (100.0%) | 0 (0.0%) |
| Educational Services | 10 (10.1%) | 89 (89.9%) |
| Health Care & Social Assistance | 61 (31.9%) | 130 (68.1%) |
| Arts, Entertainment & Recreation | 70 (40.5%) | 103 (59.5%) |
| Accommodation & Food Services | 24 (32.4%) | 50 (67.6%) |
| Public Administration | 44 (50.0%) | 44 (50.0%) |
| Total | 691 (45.3%) | 835 (54.7%) |
Education in South Pasadena
School Enrollment in South Pasadena
The most common levels of schooling among the 206 students in South Pasadena are high school (84 | 40.8%), college / undergraduate (69 | 33.5%), and elementary school (20 | 9.7%).
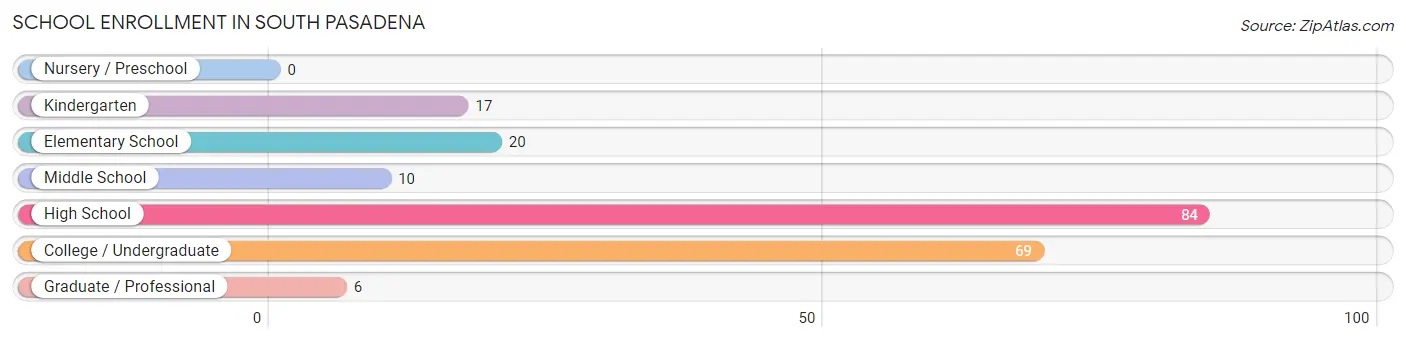
| School Level | # Students | % Students |
| Nursery / Preschool | 0 | 0.0% |
| Kindergarten | 17 | 8.3% |
| Elementary School | 20 | 9.7% |
| Middle School | 10 | 4.9% |
| High School | 84 | 40.8% |
| College / Undergraduate | 69 | 33.5% |
| Graduate / Professional | 6 | 2.9% |
| Total | 206 | 100.0% |
School Enrollment by Age by Funding Source in South Pasadena
Out of a total of 206 students who are enrolled in schools in South Pasadena, 58 (28.2%) attend a private institution, while the remaining 148 (71.8%) are enrolled in public schools. The age group of 10 to 14 year olds has the highest likelihood of being enrolled in private schools, with 10 (100.0% in the age bracket) enrolled. Conversely, the age group of 5 to 9 year old has the lowest likelihood of being enrolled in a private school, with 37 (100.0% in the age bracket) attending a public institution.
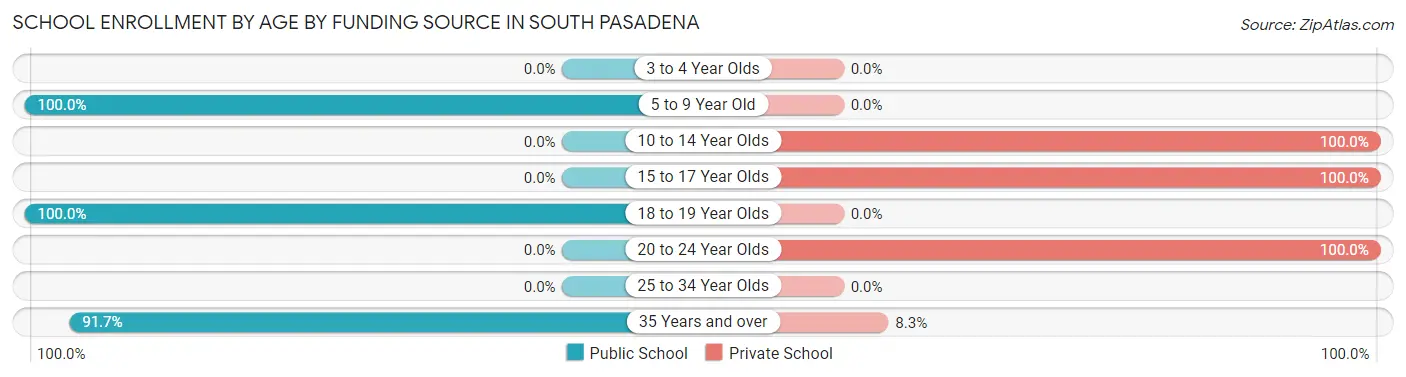
| Age Bracket | Public School | Private School |
| 3 to 4 Year Olds | 0 (0.0%) | 0 (0.0%) |
| 5 to 9 Year Old | 37 (100.0%) | 0 (0.0%) |
| 10 to 14 Year Olds | 0 (0.0%) | 10 (100.0%) |
| 15 to 17 Year Olds | 0 (0.0%) | 39 (100.0%) |
| 18 to 19 Year Olds | 45 (100.0%) | 0 (0.0%) |
| 20 to 24 Year Olds | 0 (0.0%) | 3 (100.0%) |
| 25 to 34 Year Olds | 0 (0.0%) | 0 (0.0%) |
| 35 Years and over | 66 (91.7%) | 6 (8.3%) |
| Total | 148 (71.8%) | 58 (28.2%) |
Educational Attainment by Field of Study in South Pasadena
Business (340 | 19.9%), education (319 | 18.7%), science & technology (262 | 15.4%), liberal arts & history (127 | 7.4%), and bio, nature & agricultural (125 | 7.3%) are the most common fields of study among 1,706 individuals in South Pasadena who have obtained a bachelor's degree or higher.
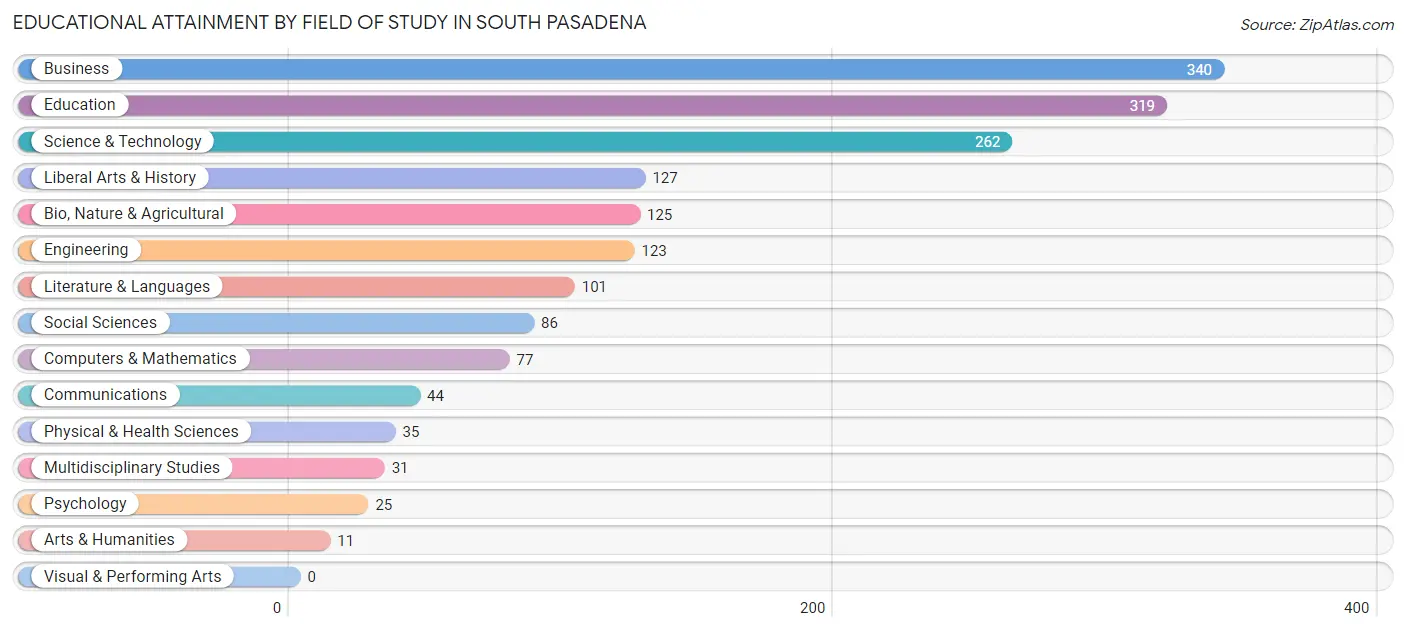
| Field of Study | # Graduates | % Graduates |
| Computers & Mathematics | 77 | 4.5% |
| Bio, Nature & Agricultural | 125 | 7.3% |
| Physical & Health Sciences | 35 | 2.1% |
| Psychology | 25 | 1.5% |
| Social Sciences | 86 | 5.0% |
| Engineering | 123 | 7.2% |
| Multidisciplinary Studies | 31 | 1.8% |
| Science & Technology | 262 | 15.4% |
| Business | 340 | 19.9% |
| Education | 319 | 18.7% |
| Literature & Languages | 101 | 5.9% |
| Liberal Arts & History | 127 | 7.4% |
| Visual & Performing Arts | 0 | 0.0% |
| Communications | 44 | 2.6% |
| Arts & Humanities | 11 | 0.6% |
| Total | 1,706 | 100.0% |
Transportation & Commute in South Pasadena
Vehicle Availability by Sex in South Pasadena
The most prevalent vehicle ownership categories in South Pasadena are males with 2 vehicles (383, accounting for 55.3%) and females with 2 vehicles (356, making up 47.6%).
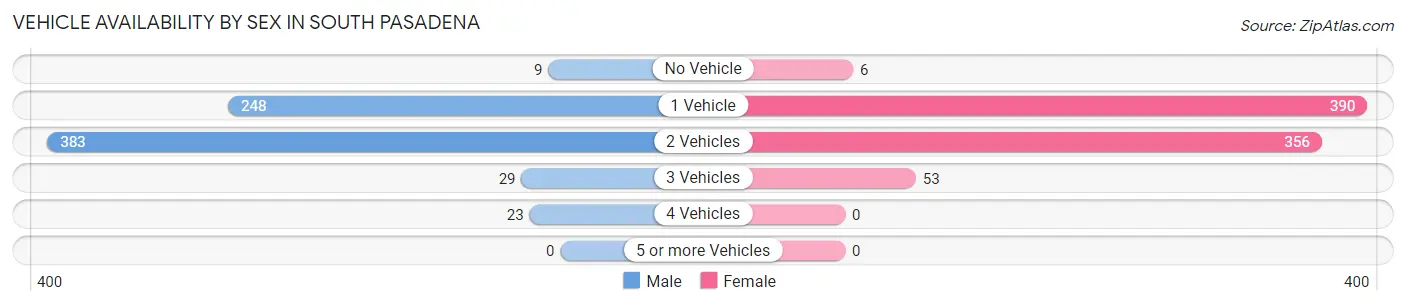
| Vehicles Available | Male | Female |
| No Vehicle | 9 (1.3%) | 6 (0.7%) |
| 1 Vehicle | 248 (35.8%) | 390 (48.4%) |
| 2 Vehicles | 383 (55.3%) | 356 (44.2%) |
| 3 Vehicles | 29 (4.2%) | 53 (6.6%) |
| 4 Vehicles | 23 (3.3%) | 0 (0.0%) |
| 5 or more Vehicles | 0 (0.0%) | 0 (0.0%) |
| Total | 692 (100.0%) | 805 (100.0%) |
Commute Time in South Pasadena
The most frequently occuring commute durations in South Pasadena are 15 to 19 minutes (280 commuters, 21.4%), 10 to 14 minutes (226 commuters, 17.3%), and 5 to 9 minutes (194 commuters, 14.8%).
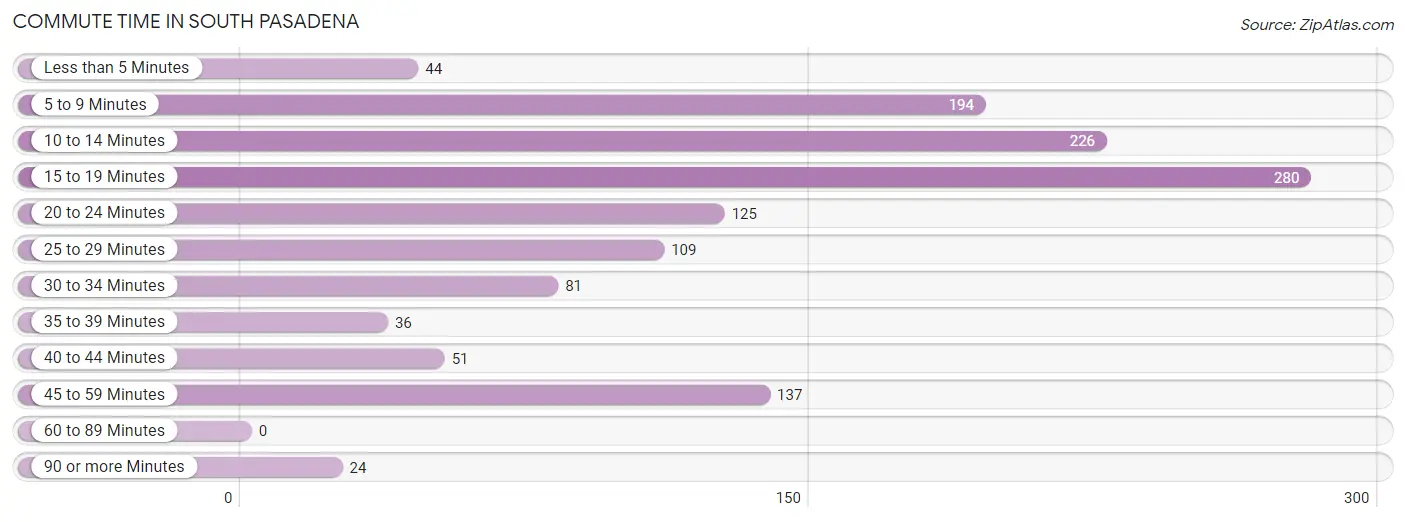
| Commute Time | # Commuters | % Commuters |
| Less than 5 Minutes | 44 | 3.4% |
| 5 to 9 Minutes | 194 | 14.8% |
| 10 to 14 Minutes | 226 | 17.3% |
| 15 to 19 Minutes | 280 | 21.4% |
| 20 to 24 Minutes | 125 | 9.6% |
| 25 to 29 Minutes | 109 | 8.3% |
| 30 to 34 Minutes | 81 | 6.2% |
| 35 to 39 Minutes | 36 | 2.8% |
| 40 to 44 Minutes | 51 | 3.9% |
| 45 to 59 Minutes | 137 | 10.5% |
| 60 to 89 Minutes | 0 | 0.0% |
| 90 or more Minutes | 24 | 1.8% |
Commute Time by Sex in South Pasadena
The most common commute times in South Pasadena are 15 to 19 minutes (164 commuters, 29.3%) for males and 5 to 9 minutes (133 commuters, 17.8%) for females.
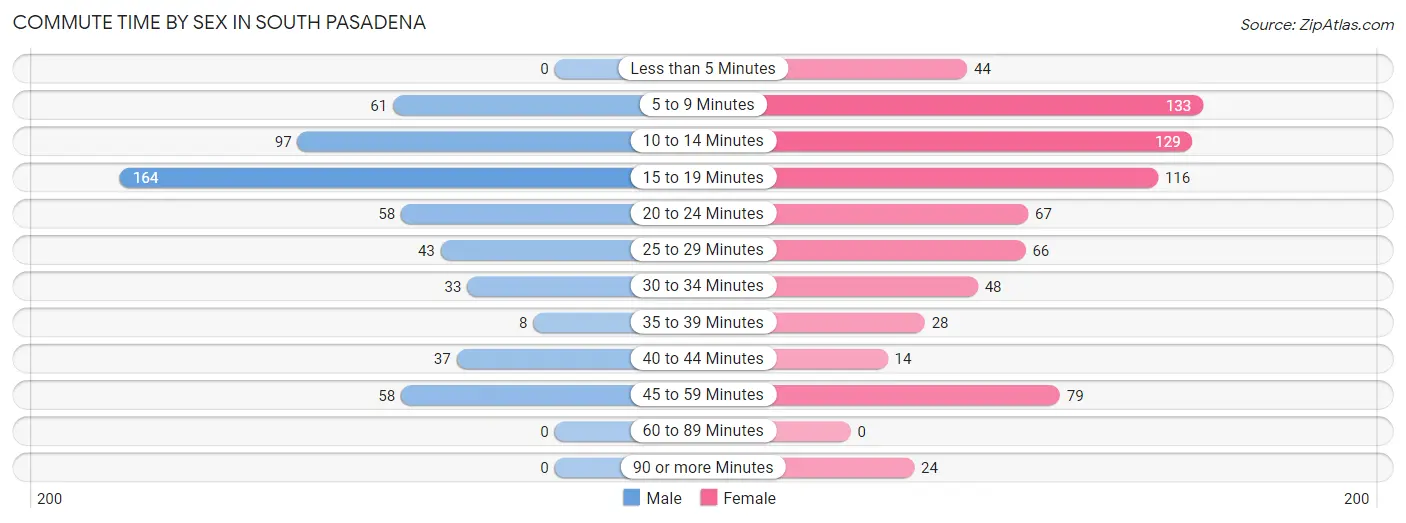
| Commute Time | Male | Female |
| Less than 5 Minutes | 0 (0.0%) | 44 (5.9%) |
| 5 to 9 Minutes | 61 (10.9%) | 133 (17.8%) |
| 10 to 14 Minutes | 97 (17.3%) | 129 (17.2%) |
| 15 to 19 Minutes | 164 (29.3%) | 116 (15.5%) |
| 20 to 24 Minutes | 58 (10.4%) | 67 (9.0%) |
| 25 to 29 Minutes | 43 (7.7%) | 66 (8.8%) |
| 30 to 34 Minutes | 33 (5.9%) | 48 (6.4%) |
| 35 to 39 Minutes | 8 (1.4%) | 28 (3.7%) |
| 40 to 44 Minutes | 37 (6.6%) | 14 (1.9%) |
| 45 to 59 Minutes | 58 (10.4%) | 79 (10.6%) |
| 60 to 89 Minutes | 0 (0.0%) | 0 (0.0%) |
| 90 or more Minutes | 0 (0.0%) | 24 (3.2%) |
Time of Departure to Work by Sex in South Pasadena
The most frequent times of departure to work in South Pasadena are 7:00 AM to 7:29 AM (163, 29.2%) for males and 7:00 AM to 7:29 AM (138, 18.4%) for females.
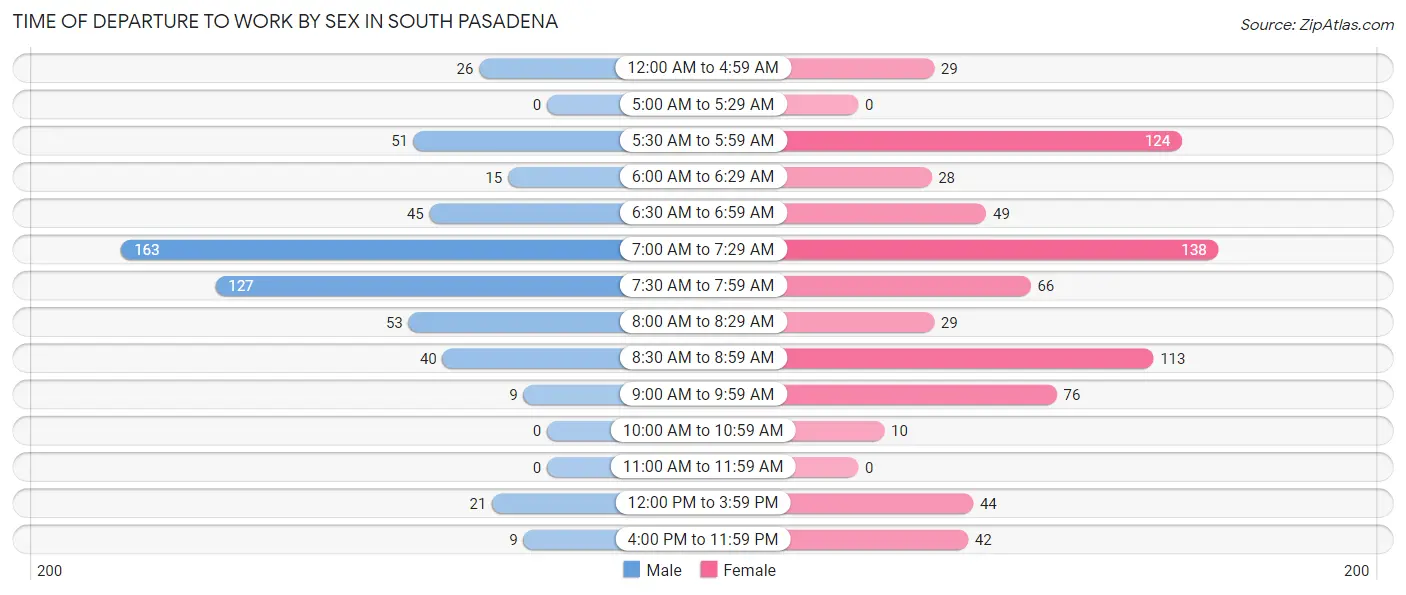
| Time of Departure | Male | Female |
| 12:00 AM to 4:59 AM | 26 (4.6%) | 29 (3.9%) |
| 5:00 AM to 5:29 AM | 0 (0.0%) | 0 (0.0%) |
| 5:30 AM to 5:59 AM | 51 (9.1%) | 124 (16.6%) |
| 6:00 AM to 6:29 AM | 15 (2.7%) | 28 (3.7%) |
| 6:30 AM to 6:59 AM | 45 (8.1%) | 49 (6.6%) |
| 7:00 AM to 7:29 AM | 163 (29.2%) | 138 (18.4%) |
| 7:30 AM to 7:59 AM | 127 (22.7%) | 66 (8.8%) |
| 8:00 AM to 8:29 AM | 53 (9.5%) | 29 (3.9%) |
| 8:30 AM to 8:59 AM | 40 (7.2%) | 113 (15.1%) |
| 9:00 AM to 9:59 AM | 9 (1.6%) | 76 (10.2%) |
| 10:00 AM to 10:59 AM | 0 (0.0%) | 10 (1.3%) |
| 11:00 AM to 11:59 AM | 0 (0.0%) | 0 (0.0%) |
| 12:00 PM to 3:59 PM | 21 (3.8%) | 44 (5.9%) |
| 4:00 PM to 11:59 PM | 9 (1.6%) | 42 (5.6%) |
| Total | 559 (100.0%) | 748 (100.0%) |
Housing Occupancy in South Pasadena
Occupancy by Ownership in South Pasadena
Of the total 3,127 dwellings in South Pasadena, owner-occupied units account for 1,760 (56.3%), while renter-occupied units make up 1,367 (43.7%).
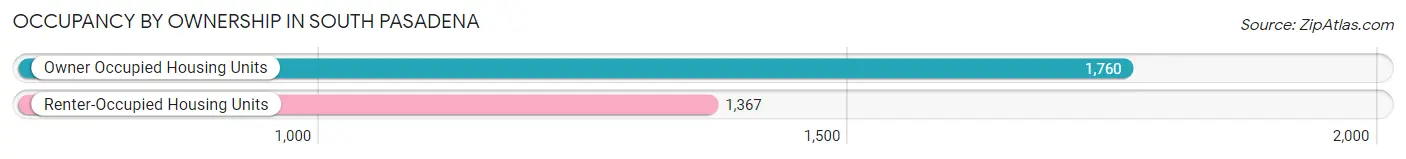
| Occupancy | # Housing Units | % Housing Units |
| Owner Occupied Housing Units | 1,760 | 56.3% |
| Renter-Occupied Housing Units | 1,367 | 43.7% |
| Total Occupied Housing Units | 3,127 | 100.0% |
Occupancy by Household Size in South Pasadena
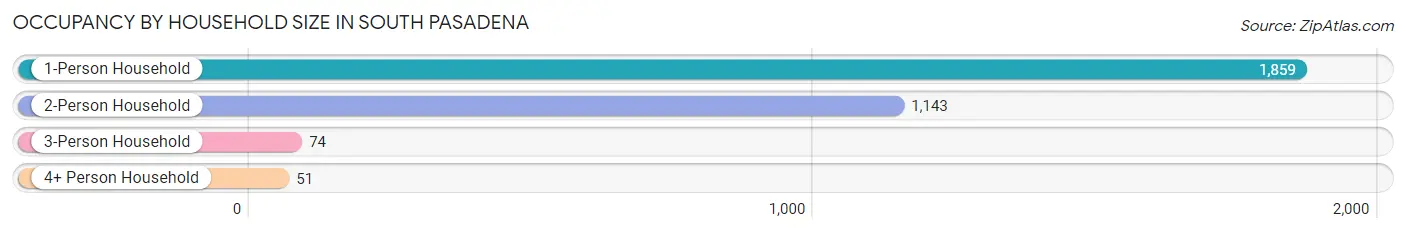
| Household Size | # Housing Units | % Housing Units |
| 1-Person Household | 1,859 | 59.5% |
| 2-Person Household | 1,143 | 36.5% |
| 3-Person Household | 74 | 2.4% |
| 4+ Person Household | 51 | 1.6% |
| Total Housing Units | 3,127 | 100.0% |
Occupancy by Ownership by Household Size in South Pasadena
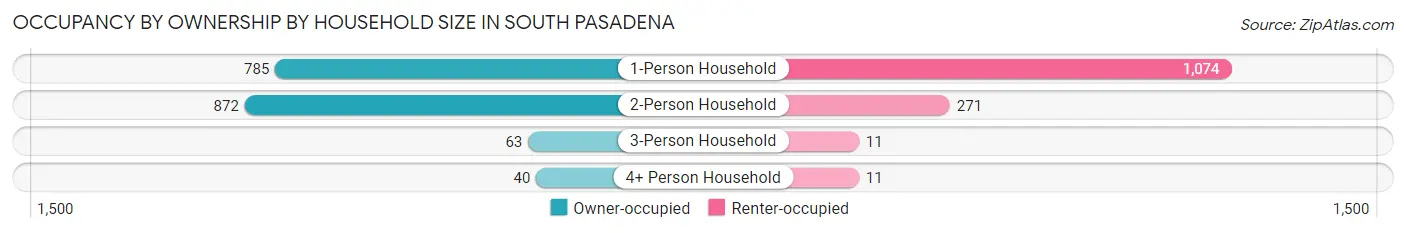
| Household Size | Owner-occupied | Renter-occupied |
| 1-Person Household | 785 (42.2%) | 1,074 (57.8%) |
| 2-Person Household | 872 (76.3%) | 271 (23.7%) |
| 3-Person Household | 63 (85.1%) | 11 (14.9%) |
| 4+ Person Household | 40 (78.4%) | 11 (21.6%) |
| Total Housing Units | 1,760 (56.3%) | 1,367 (43.7%) |
Occupancy by Educational Attainment in South Pasadena
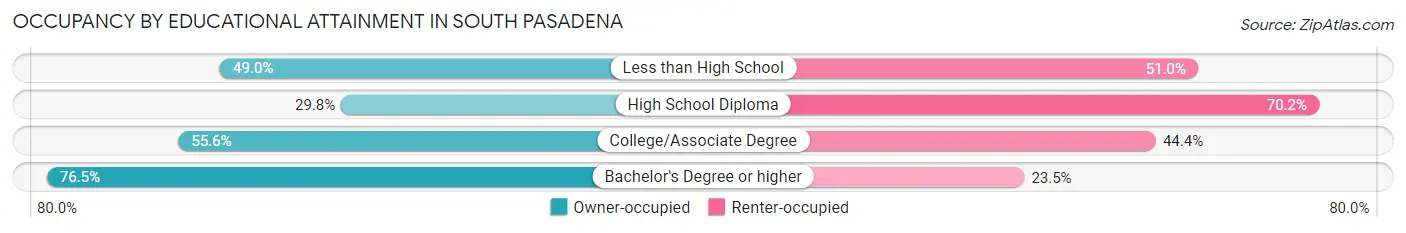
| Household Size | Owner-occupied | Renter-occupied |
| Less than High School | 73 (49.0%) | 76 (51.0%) |
| High School Diploma | 197 (29.8%) | 464 (70.2%) |
| College/Associate Degree | 752 (55.6%) | 600 (44.4%) |
| Bachelor's Degree or higher | 738 (76.5%) | 227 (23.5%) |
Occupancy by Age of Householder in South Pasadena
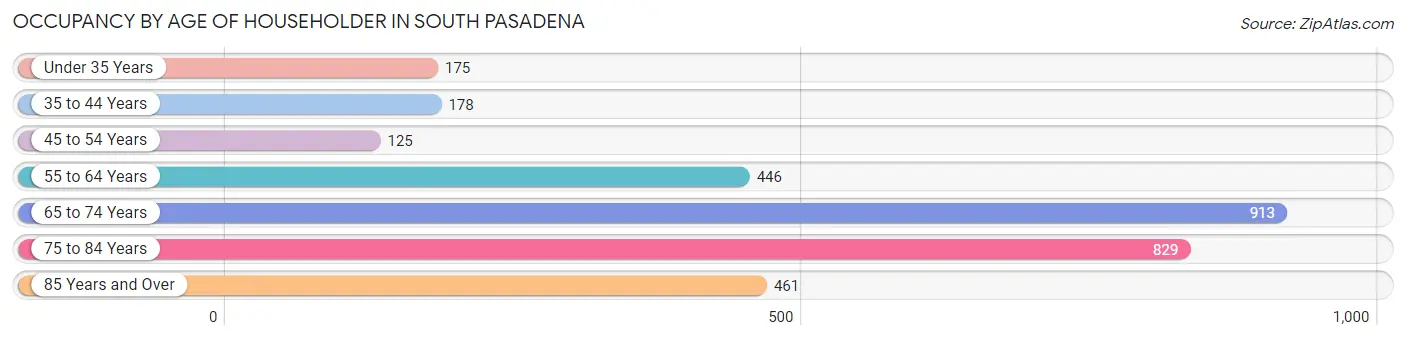
| Age Bracket | # Households | % Households |
| Under 35 Years | 175 | 5.6% |
| 35 to 44 Years | 178 | 5.7% |
| 45 to 54 Years | 125 | 4.0% |
| 55 to 64 Years | 446 | 14.3% |
| 65 to 74 Years | 913 | 29.2% |
| 75 to 84 Years | 829 | 26.5% |
| 85 Years and Over | 461 | 14.7% |
| Total | 3,127 | 100.0% |
Housing Finances in South Pasadena
Median Income by Occupancy in South Pasadena
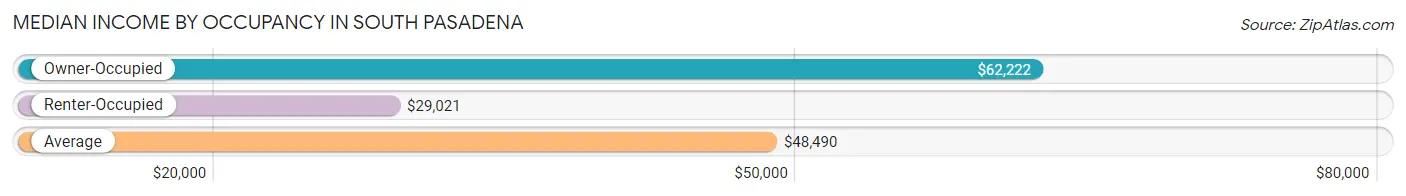
| Occupancy Type | # Households | Median Income |
| Owner-Occupied | 1,760 (56.3%) | $62,222 |
| Renter-Occupied | 1,367 (43.7%) | $29,021 |
| Average | 3,127 (100.0%) | $48,490 |
Occupancy by Householder Income Bracket in South Pasadena
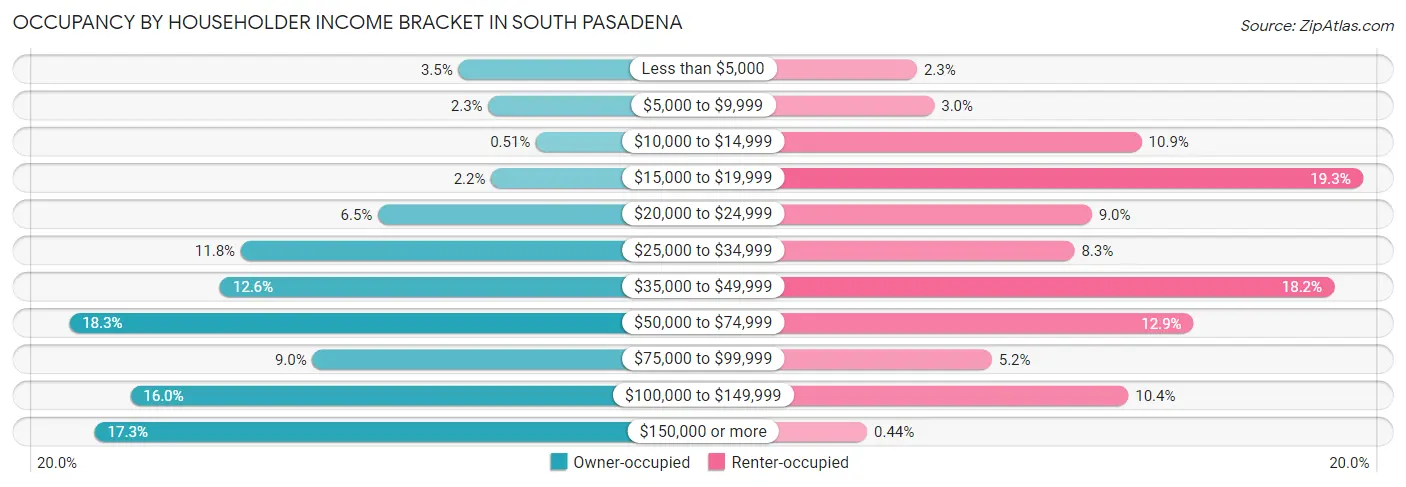
| Income Bracket | Owner-occupied | Renter-occupied |
| Less than $5,000 | 61 (3.5%) | 32 (2.3%) |
| $5,000 to $9,999 | 41 (2.3%) | 41 (3.0%) |
| $10,000 to $14,999 | 9 (0.5%) | 149 (10.9%) |
| $15,000 to $19,999 | 39 (2.2%) | 264 (19.3%) |
| $20,000 to $24,999 | 115 (6.5%) | 123 (9.0%) |
| $25,000 to $34,999 | 207 (11.8%) | 114 (8.3%) |
| $35,000 to $49,999 | 221 (12.6%) | 249 (18.2%) |
| $50,000 to $74,999 | 322 (18.3%) | 176 (12.9%) |
| $75,000 to $99,999 | 159 (9.0%) | 71 (5.2%) |
| $100,000 to $149,999 | 281 (16.0%) | 142 (10.4%) |
| $150,000 or more | 305 (17.3%) | 6 (0.4%) |
| Total | 1,760 (100.0%) | 1,367 (100.0%) |
Monthly Housing Cost Tiers in South Pasadena
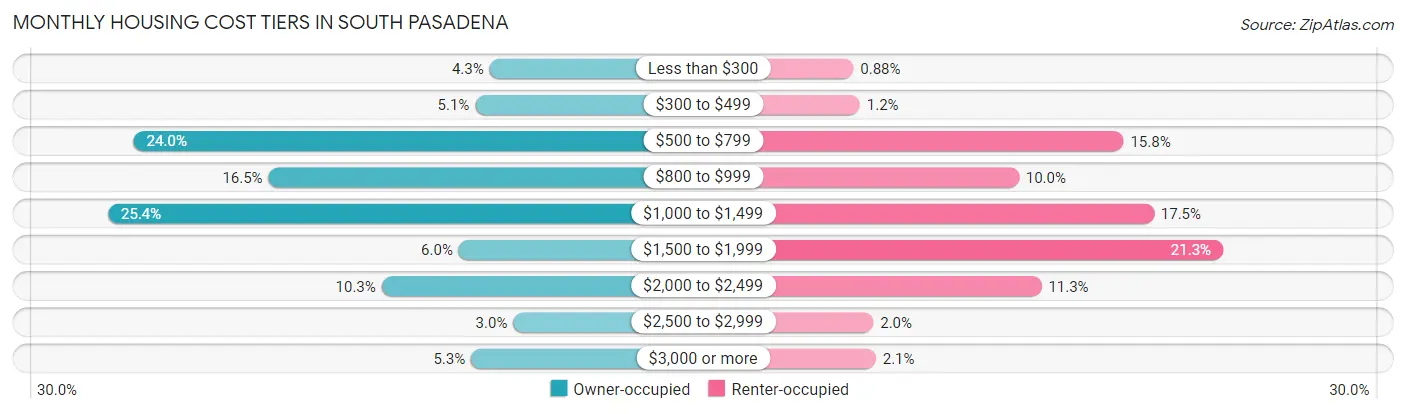
| Monthly Cost | Owner-occupied | Renter-occupied |
| Less than $300 | 76 (4.3%) | 12 (0.9%) |
| $300 to $499 | 90 (5.1%) | 17 (1.2%) |
| $500 to $799 | 422 (24.0%) | 216 (15.8%) |
| $800 to $999 | 291 (16.5%) | 137 (10.0%) |
| $1,000 to $1,499 | 447 (25.4%) | 239 (17.5%) |
| $1,500 to $1,999 | 106 (6.0%) | 291 (21.3%) |
| $2,000 to $2,499 | 181 (10.3%) | 154 (11.3%) |
| $2,500 to $2,999 | 53 (3.0%) | 27 (2.0%) |
| $3,000 or more | 94 (5.3%) | 29 (2.1%) |
| Total | 1,760 (100.0%) | 1,367 (100.0%) |
Physical Housing Characteristics in South Pasadena
Housing Structures in South Pasadena
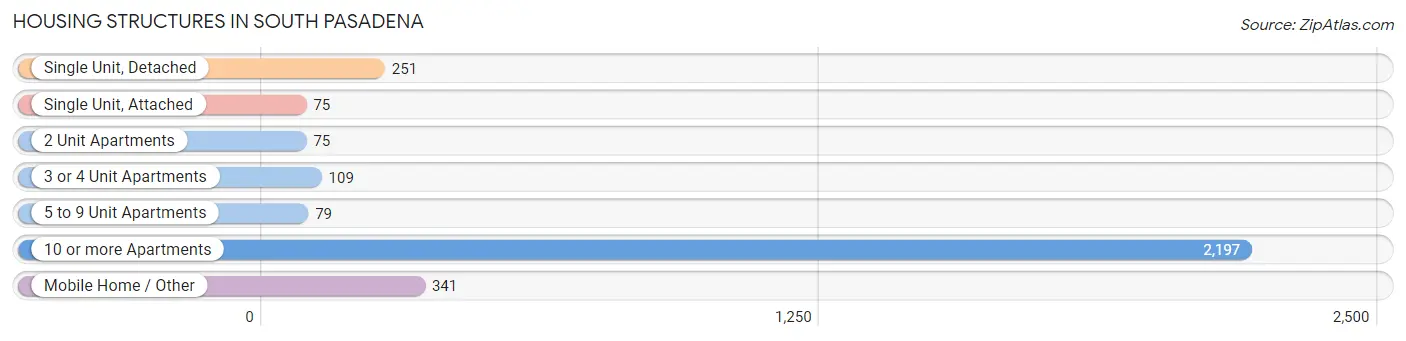
| Structure Type | # Housing Units | % Housing Units |
| Single Unit, Detached | 251 | 8.0% |
| Single Unit, Attached | 75 | 2.4% |
| 2 Unit Apartments | 75 | 2.4% |
| 3 or 4 Unit Apartments | 109 | 3.5% |
| 5 to 9 Unit Apartments | 79 | 2.5% |
| 10 or more Apartments | 2,197 | 70.3% |
| Mobile Home / Other | 341 | 10.9% |
| Total | 3,127 | 100.0% |
Housing Structures by Occupancy in South Pasadena
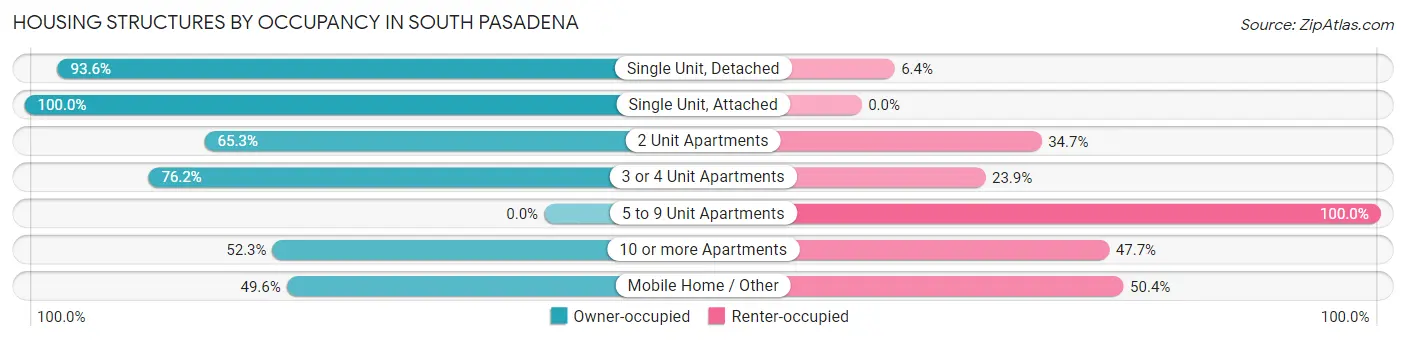
| Structure Type | Owner-occupied | Renter-occupied |
| Single Unit, Detached | 235 (93.6%) | 16 (6.4%) |
| Single Unit, Attached | 75 (100.0%) | 0 (0.0%) |
| 2 Unit Apartments | 49 (65.3%) | 26 (34.7%) |
| 3 or 4 Unit Apartments | 83 (76.1%) | 26 (23.8%) |
| 5 to 9 Unit Apartments | 0 (0.0%) | 79 (100.0%) |
| 10 or more Apartments | 1,149 (52.3%) | 1,048 (47.7%) |
| Mobile Home / Other | 169 (49.6%) | 172 (50.4%) |
| Total | 1,760 (56.3%) | 1,367 (43.7%) |
Housing Structures by Number of Rooms in South Pasadena
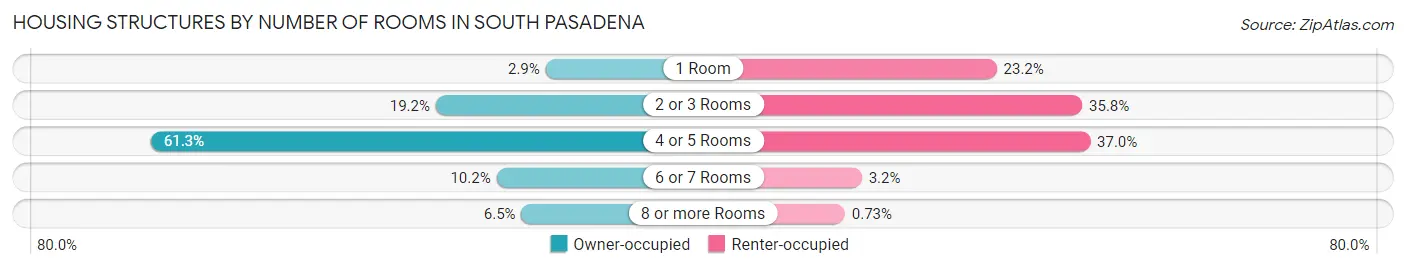
| Number of Rooms | Owner-occupied | Renter-occupied |
| 1 Room | 51 (2.9%) | 317 (23.2%) |
| 2 or 3 Rooms | 337 (19.2%) | 490 (35.8%) |
| 4 or 5 Rooms | 1,079 (61.3%) | 506 (37.0%) |
| 6 or 7 Rooms | 179 (10.2%) | 44 (3.2%) |
| 8 or more Rooms | 114 (6.5%) | 10 (0.7%) |
| Total | 1,760 (100.0%) | 1,367 (100.0%) |
Housing Structure by Heating Type in South Pasadena
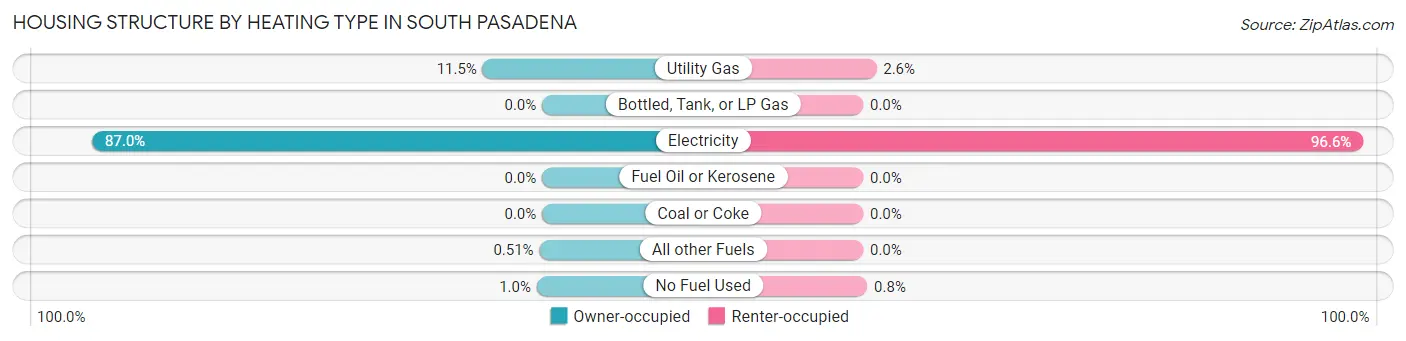
| Heating Type | Owner-occupied | Renter-occupied |
| Utility Gas | 202 (11.5%) | 35 (2.6%) |
| Bottled, Tank, or LP Gas | 0 (0.0%) | 0 (0.0%) |
| Electricity | 1,531 (87.0%) | 1,321 (96.6%) |
| Fuel Oil or Kerosene | 0 (0.0%) | 0 (0.0%) |
| Coal or Coke | 0 (0.0%) | 0 (0.0%) |
| All other Fuels | 9 (0.5%) | 0 (0.0%) |
| No Fuel Used | 18 (1.0%) | 11 (0.8%) |
| Total | 1,760 (100.0%) | 1,367 (100.0%) |
Household Vehicle Usage in South Pasadena
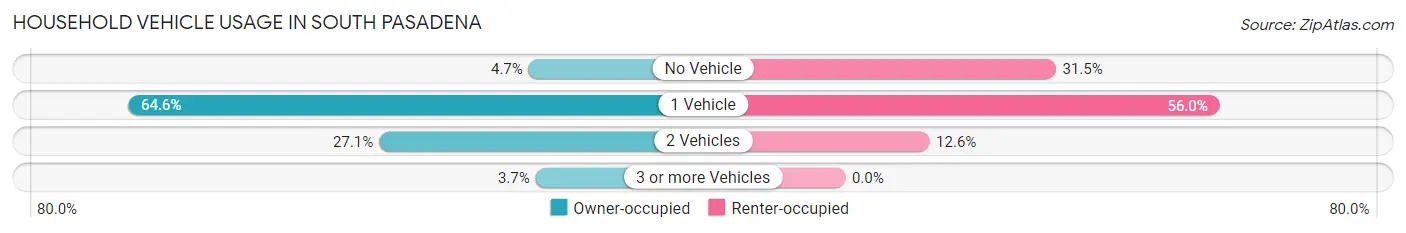
| Vehicles per Household | Owner-occupied | Renter-occupied |
| No Vehicle | 83 (4.7%) | 430 (31.5%) |
| 1 Vehicle | 1,136 (64.5%) | 765 (56.0%) |
| 2 Vehicles | 476 (27.1%) | 172 (12.6%) |
| 3 or more Vehicles | 65 (3.7%) | 0 (0.0%) |
| Total | 1,760 (100.0%) | 1,367 (100.0%) |
Real Estate & Mortgages in South Pasadena
Real Estate and Mortgage Overview in South Pasadena
| Characteristic | Without Mortgage | With Mortgage |
| Housing Units | 1,150 | 610 |
| Median Property Value | $224,800 | $328,600 |
| Median Household Income | $54,960 | $147 |
| Monthly Housing Costs | $794 | $76 |
| Real Estate Taxes | $1,967 | $0 |
Property Value by Mortgage Status in South Pasadena
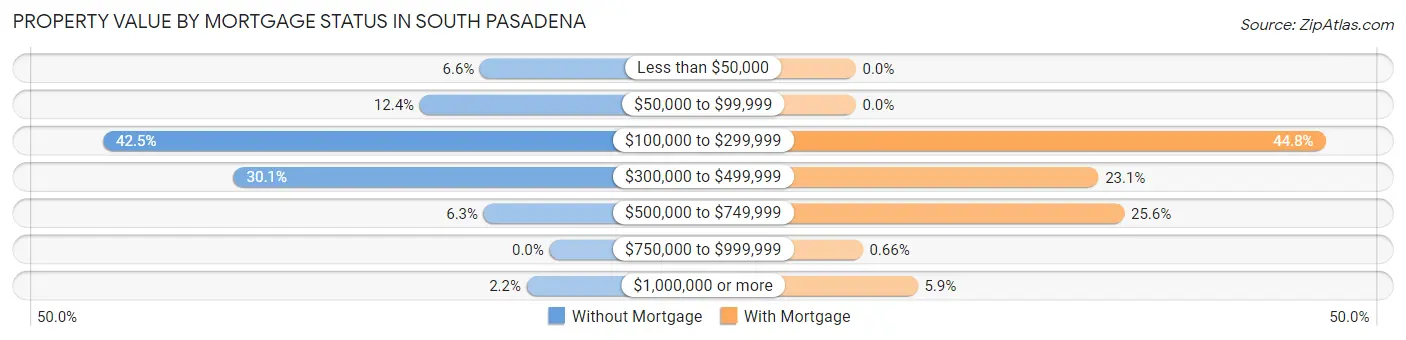
| Property Value | Without Mortgage | With Mortgage |
| Less than $50,000 | 76 (6.6%) | 0 (0.0%) |
| $50,000 to $99,999 | 142 (12.3%) | 0 (0.0%) |
| $100,000 to $299,999 | 489 (42.5%) | 273 (44.8%) |
| $300,000 to $499,999 | 346 (30.1%) | 141 (23.1%) |
| $500,000 to $749,999 | 72 (6.3%) | 156 (25.6%) |
| $750,000 to $999,999 | 0 (0.0%) | 4 (0.7%) |
| $1,000,000 or more | 25 (2.2%) | 36 (5.9%) |
| Total | 1,150 (100.0%) | 610 (100.0%) |
Household Income by Mortgage Status in South Pasadena
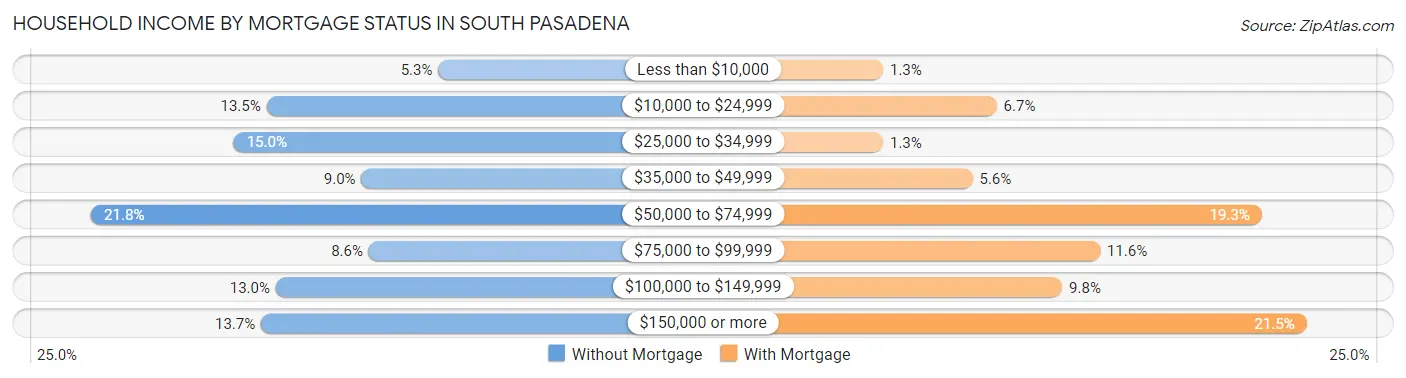
| Household Income | Without Mortgage | With Mortgage |
| Less than $10,000 | 61 (5.3%) | 8 (1.3%) |
| $10,000 to $24,999 | 155 (13.5%) | 41 (6.7%) |
| $25,000 to $34,999 | 173 (15.0%) | 8 (1.3%) |
| $35,000 to $49,999 | 103 (9.0%) | 34 (5.6%) |
| $50,000 to $74,999 | 251 (21.8%) | 118 (19.3%) |
| $75,000 to $99,999 | 99 (8.6%) | 71 (11.6%) |
| $100,000 to $149,999 | 150 (13.0%) | 60 (9.8%) |
| $150,000 or more | 158 (13.7%) | 131 (21.5%) |
| Total | 1,150 (100.0%) | 610 (100.0%) |
Property Value to Household Income Ratio in South Pasadena
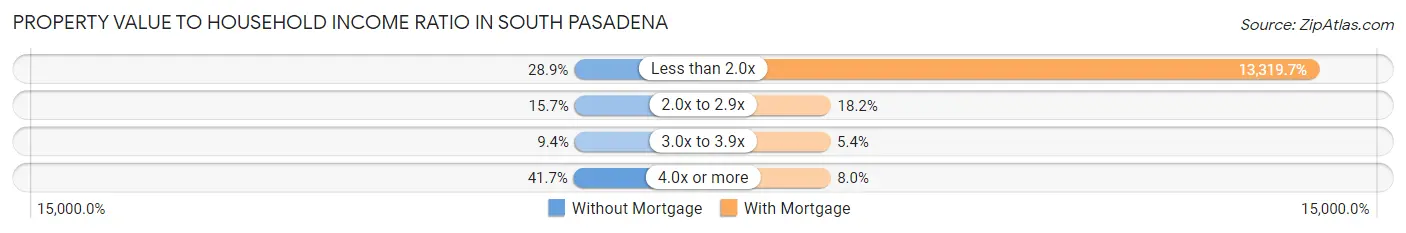
| Value-to-Income Ratio | Without Mortgage | With Mortgage |
| Less than 2.0x | 332 (28.9%) | 81,250 (13,319.7%) |
| 2.0x to 2.9x | 181 (15.7%) | 111 (18.2%) |
| 3.0x to 3.9x | 108 (9.4%) | 33 (5.4%) |
| 4.0x or more | 480 (41.7%) | 49 (8.0%) |
| Total | 1,150 (100.0%) | 610 (100.0%) |
Real Estate Taxes by Mortgage Status in South Pasadena
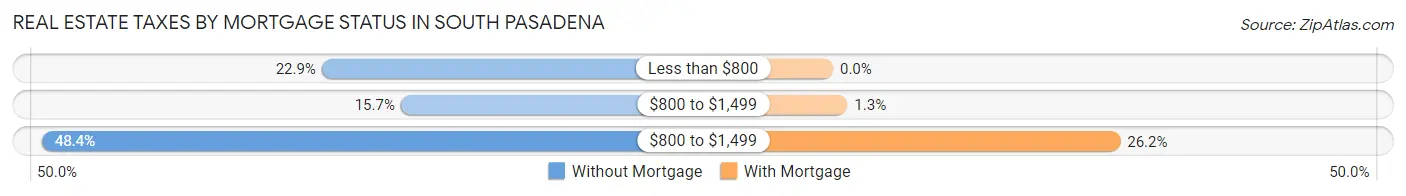
| Property Taxes | Without Mortgage | With Mortgage |
| Less than $800 | 263 (22.9%) | 0 (0.0%) |
| $800 to $1,499 | 180 (15.7%) | 8 (1.3%) |
| $800 to $1,499 | 557 (48.4%) | 160 (26.2%) |
| Total | 1,150 (100.0%) | 610 (100.0%) |
Health & Disability in South Pasadena
Health Insurance Coverage by Age in South Pasadena
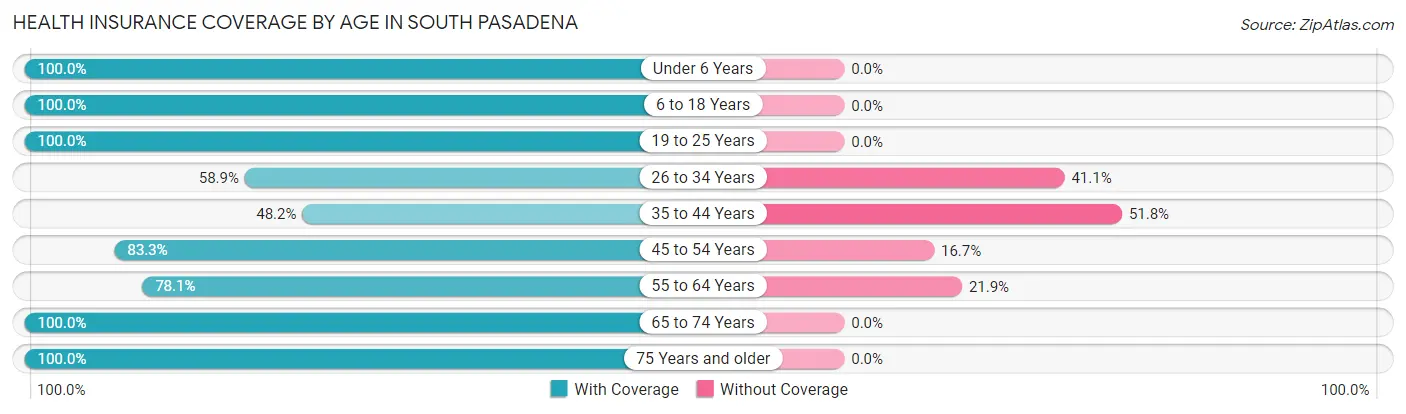
| Age Bracket | With Coverage | Without Coverage |
| Under 6 Years | 66 (100.0%) | 0 (0.0%) |
| 6 to 18 Years | 131 (100.0%) | 0 (0.0%) |
| 19 to 25 Years | 103 (100.0%) | 0 (0.0%) |
| 26 to 34 Years | 122 (58.9%) | 85 (41.1%) |
| 35 to 44 Years | 163 (48.2%) | 175 (51.8%) |
| 45 to 54 Years | 184 (83.3%) | 37 (16.7%) |
| 55 to 64 Years | 594 (78.1%) | 167 (21.9%) |
| 65 to 74 Years | 1,595 (100.0%) | 0 (0.0%) |
| 75 Years and older | 1,694 (100.0%) | 0 (0.0%) |
| Total | 4,652 (90.9%) | 464 (9.1%) |
Health Insurance Coverage by Citizenship Status in South Pasadena
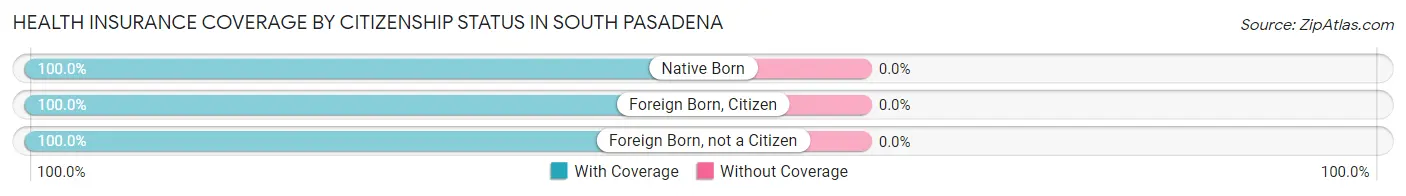
| Citizenship Status | With Coverage | Without Coverage |
| Native Born | 66 (100.0%) | 0 (0.0%) |
| Foreign Born, Citizen | 131 (100.0%) | 0 (0.0%) |
| Foreign Born, not a Citizen | 103 (100.0%) | 0 (0.0%) |
Health Insurance Coverage by Household Income in South Pasadena
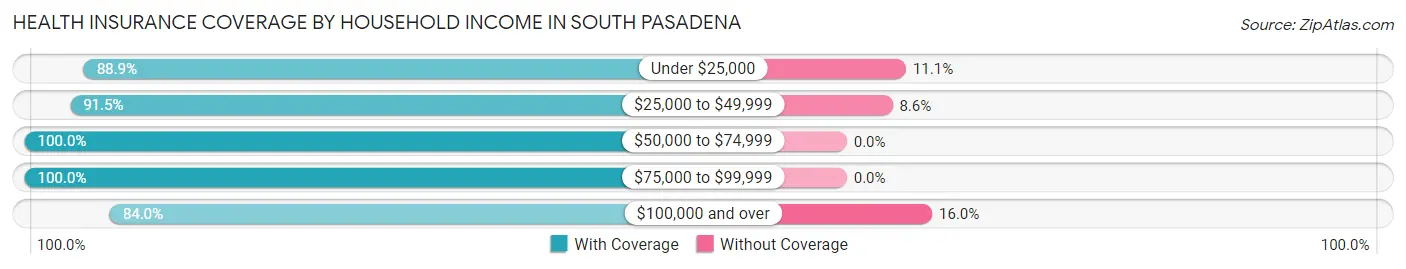
| Household Income | With Coverage | Without Coverage |
| Under $25,000 | 898 (88.9%) | 112 (11.1%) |
| $25,000 to $49,999 | 963 (91.4%) | 90 (8.6%) |
| $50,000 to $74,999 | 727 (100.0%) | 0 (0.0%) |
| $75,000 to $99,999 | 497 (100.0%) | 0 (0.0%) |
| $100,000 and over | 1,209 (84.0%) | 230 (16.0%) |
Public vs Private Health Insurance Coverage by Age in South Pasadena
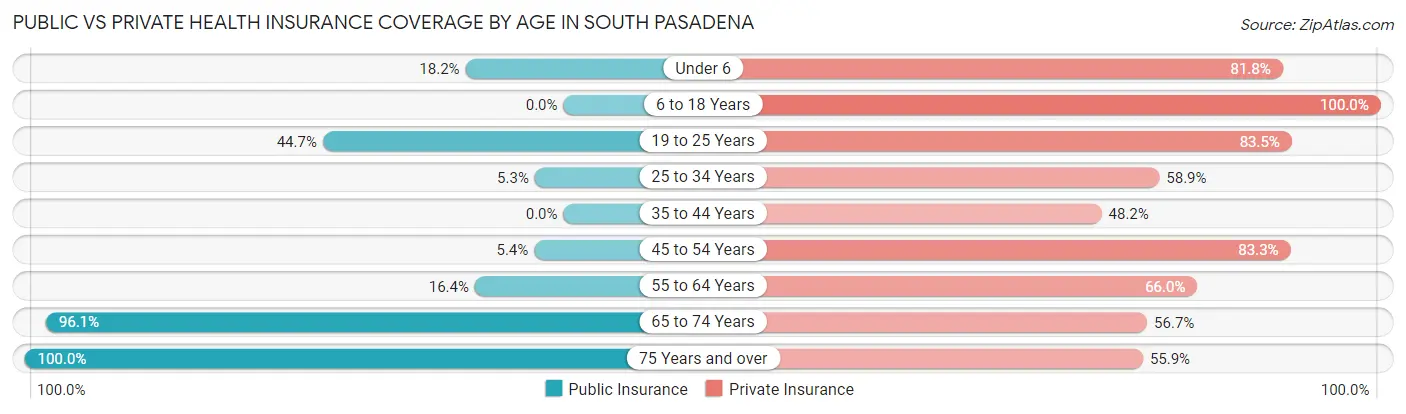
| Age Bracket | Public Insurance | Private Insurance |
| Under 6 | 12 (18.2%) | 54 (81.8%) |
| 6 to 18 Years | 0 (0.0%) | 131 (100.0%) |
| 19 to 25 Years | 46 (44.7%) | 86 (83.5%) |
| 25 to 34 Years | 11 (5.3%) | 122 (58.9%) |
| 35 to 44 Years | 0 (0.0%) | 163 (48.2%) |
| 45 to 54 Years | 12 (5.4%) | 184 (83.3%) |
| 55 to 64 Years | 125 (16.4%) | 502 (66.0%) |
| 65 to 74 Years | 1,532 (96.1%) | 904 (56.7%) |
| 75 Years and over | 1,694 (100.0%) | 947 (55.9%) |
| Total | 3,432 (67.1%) | 3,093 (60.5%) |
Disability Status by Sex by Age in South Pasadena
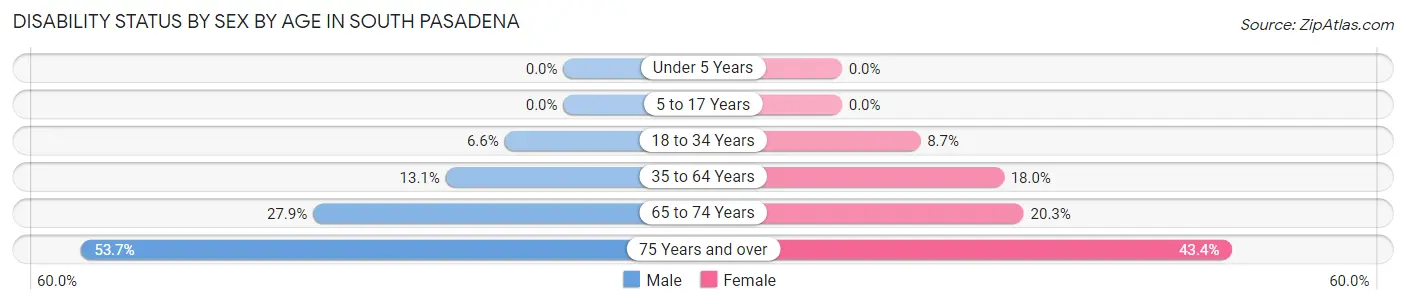
| Age Bracket | Male | Female |
| Under 5 Years | 0 (0.0%) | 0 (0.0%) |
| 5 to 17 Years | 0 (0.0%) | 0 (0.0%) |
| 18 to 34 Years | 15 (6.6%) | 11 (8.7%) |
| 35 to 64 Years | 56 (13.1%) | 161 (18.0%) |
| 65 to 74 Years | 223 (27.9%) | 161 (20.3%) |
| 75 Years and over | 314 (53.7%) | 481 (43.4%) |
Disability Class by Sex by Age in South Pasadena
Disability Class: Hearing Difficulty
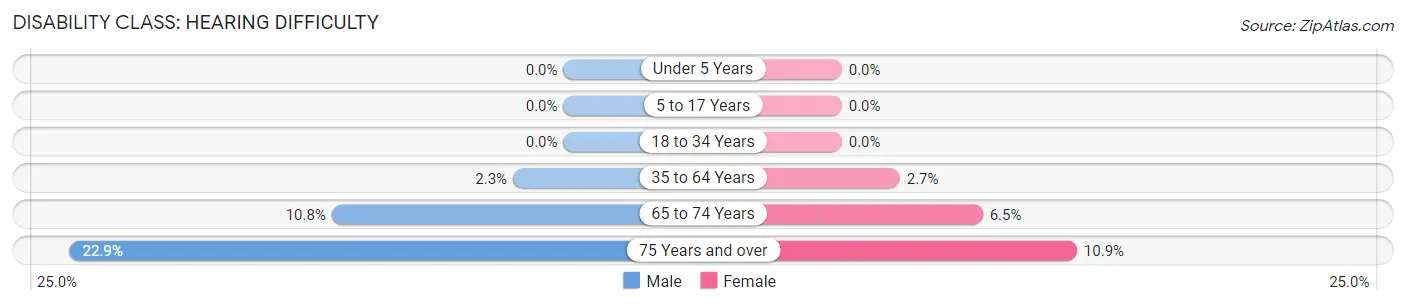
| Age Bracket | Male | Female |
| Under 5 Years | 0 (0.0%) | 0 (0.0%) |
| 5 to 17 Years | 0 (0.0%) | 0 (0.0%) |
| 18 to 34 Years | 0 (0.0%) | 0 (0.0%) |
| 35 to 64 Years | 10 (2.3%) | 24 (2.7%) |
| 65 to 74 Years | 86 (10.7%) | 52 (6.5%) |
| 75 Years and over | 134 (22.9%) | 121 (10.9%) |
Disability Class: Vision Difficulty
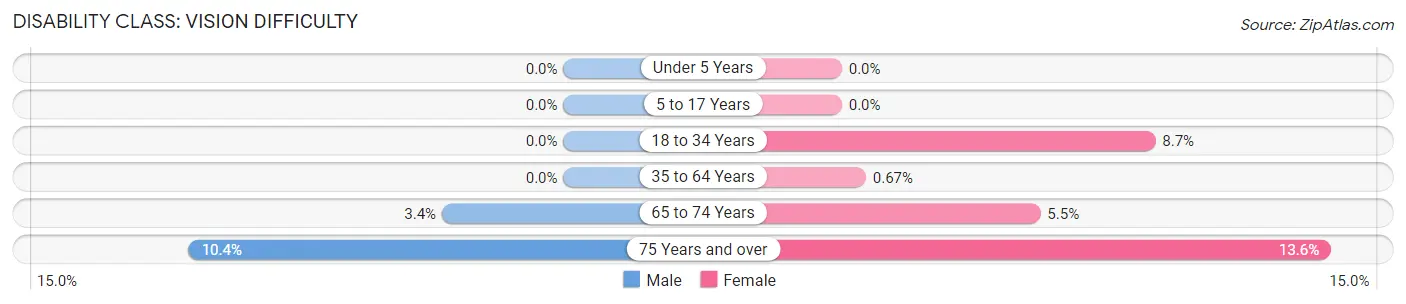
| Age Bracket | Male | Female |
| Under 5 Years | 0 (0.0%) | 0 (0.0%) |
| 5 to 17 Years | 0 (0.0%) | 0 (0.0%) |
| 18 to 34 Years | 0 (0.0%) | 11 (8.7%) |
| 35 to 64 Years | 0 (0.0%) | 6 (0.7%) |
| 65 to 74 Years | 27 (3.4%) | 44 (5.5%) |
| 75 Years and over | 61 (10.4%) | 151 (13.6%) |
Disability Class: Cognitive Difficulty
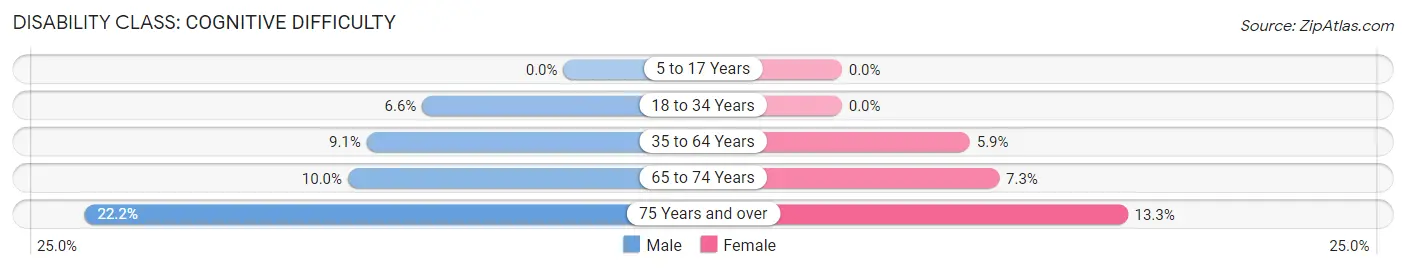
| Age Bracket | Male | Female |
| 5 to 17 Years | 0 (0.0%) | 0 (0.0%) |
| 18 to 34 Years | 15 (6.6%) | 0 (0.0%) |
| 35 to 64 Years | 39 (9.1%) | 53 (5.9%) |
| 65 to 74 Years | 80 (10.0%) | 58 (7.3%) |
| 75 Years and over | 130 (22.2%) | 147 (13.3%) |
Disability Class: Ambulatory Difficulty
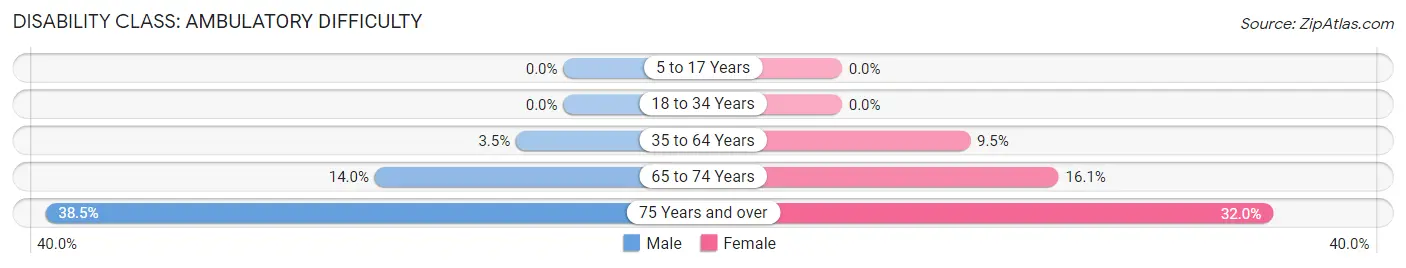
| Age Bracket | Male | Female |
| 5 to 17 Years | 0 (0.0%) | 0 (0.0%) |
| 18 to 34 Years | 0 (0.0%) | 0 (0.0%) |
| 35 to 64 Years | 15 (3.5%) | 85 (9.5%) |
| 65 to 74 Years | 112 (14.0%) | 128 (16.1%) |
| 75 Years and over | 225 (38.5%) | 355 (32.0%) |
Disability Class: Self-Care Difficulty
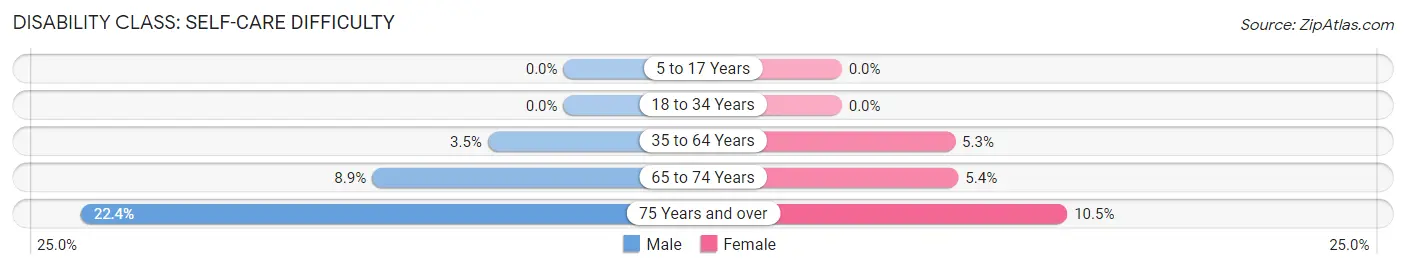
| Age Bracket | Male | Female |
| 5 to 17 Years | 0 (0.0%) | 0 (0.0%) |
| 18 to 34 Years | 0 (0.0%) | 0 (0.0%) |
| 35 to 64 Years | 15 (3.5%) | 47 (5.3%) |
| 65 to 74 Years | 71 (8.9%) | 43 (5.4%) |
| 75 Years and over | 131 (22.4%) | 116 (10.5%) |
Technology Access in South Pasadena
Computing Device Access in South Pasadena
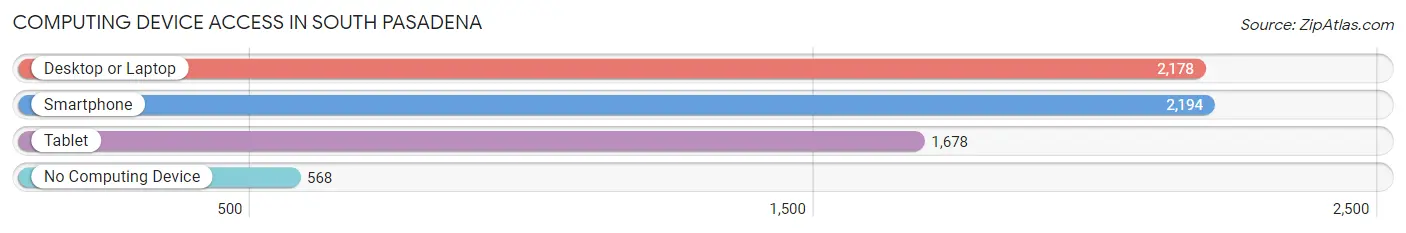
| Device Type | # Households | % Households |
| Desktop or Laptop | 2,178 | 69.7% |
| Smartphone | 2,194 | 70.2% |
| Tablet | 1,678 | 53.7% |
| No Computing Device | 568 | 18.2% |
| Total | 3,127 | 100.0% |
Internet Access in South Pasadena
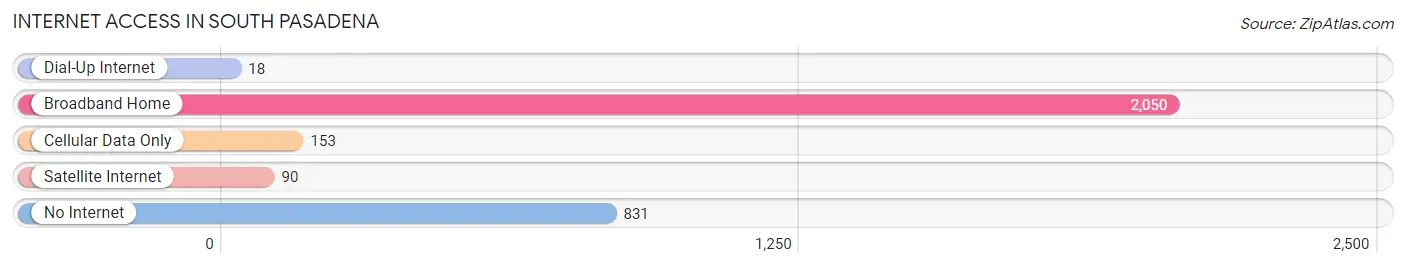
| Internet Type | # Households | % Households |
| Dial-Up Internet | 18 | 0.6% |
| Broadband Home | 2,050 | 65.6% |
| Cellular Data Only | 153 | 4.9% |
| Satellite Internet | 90 | 2.9% |
| No Internet | 831 | 26.6% |
| Total | 3,127 | 100.0% |
South Pasadena Summary
History
South Pasadena is a city located in Pinellas County, Florida. It is a suburb of St. Petersburg and is located on the Gulf of Mexico. The city was incorporated in 1925 and has a population of approximately 25,000 people.
The area that is now South Pasadena was originally inhabited by the Tocobaga Indians. The first European settlers arrived in the area in the late 1800s and the city was officially incorporated in 1925.
The city was named after Pasadena, California, which was named after the Chippewa Indian word for “crown of the valley”. The city was originally a small fishing village and was known for its beautiful beaches and fishing.
In the 1950s, the city began to grow rapidly as more people moved to the area. The city was also home to a number of resorts and hotels, which attracted tourists from all over the world.
In the 1960s, the city began to experience a decline in population as people moved away from the area. However, in the 1970s, the city began to experience a resurgence in population as people moved back to the area.
Today, South Pasadena is a vibrant city with a diverse population. The city is home to a number of businesses, restaurants, and attractions.
Geography
South Pasadena is located in Pinellas County, Florida. It is located on the Gulf of Mexico and is bordered by St. Petersburg to the north, Gulfport to the east, and Treasure Island to the south. The city is approximately 8.5 square miles in size and has a population of approximately 25,000 people.
The city is located on a peninsula and is surrounded by water on three sides. The city is home to a number of beaches, parks, and other attractions. The city is also home to a number of marinas and boat ramps.
Economy
The economy of South Pasadena is largely based on tourism and retail. The city is home to a number of hotels, restaurants, and other attractions that attract tourists from all over the world. The city is also home to a number of retail stores, including a number of national chain stores.
The city is also home to a number of businesses, including a number of medical and professional offices. The city is also home to a number of manufacturing and industrial businesses.
Demographics
As of the 2010 census, the population of South Pasadena was 24,890. The population is largely white (83.3%) and Hispanic (10.2%). The median household income is $50,945 and the median age is 44.
The city is home to a number of churches, including a number of Catholic, Protestant, and Jewish congregations. The city is also home to a number of schools, including a number of public and private schools.
Conclusion
South Pasadena is a vibrant city located in Pinellas County, Florida. The city was originally a small fishing village and has since grown into a vibrant city with a diverse population. The city is home to a number of businesses, restaurants, and attractions that attract tourists from all over the world. The city is also home to a number of churches, schools, and other institutions. The population of South Pasadena is largely white and Hispanic and the median household income is $50,945.
Common Questions
What is Per Capita Income in South Pasadena?
Per Capita income in South Pasadena is $46,038.
What is the Median Family Income in South Pasadena?
Median Family Income in South Pasadena is $78,409.
What is the Median Household income in South Pasadena?
Median Household Income in South Pasadena is $48,490.
What is Income or Wage Gap in South Pasadena?
Income or Wage Gap in South Pasadena is 3.3%.
Women in South Pasadena earn 96.7 cents for every dollar earned by a man.
What is Inequality or Gini Index in South Pasadena?
Inequality or Gini Index in South Pasadena is 0.50.
What is the Total Population of South Pasadena?
Total Population of South Pasadena is 5,334.
What is the Total Male Population of South Pasadena?
Total Male Population of South Pasadena is 2,254.
What is the Total Female Population of South Pasadena?
Total Female Population of South Pasadena is 3,080.
What is the Ratio of Males per 100 Females in South Pasadena?
There are 73.18 Males per 100 Females in South Pasadena.
What is the Ratio of Females per 100 Males in South Pasadena?
There are 136.65 Females per 100 Males in South Pasadena.
What is the Median Population Age in South Pasadena?
Median Population Age in South Pasadena is 69.2 Years.
What is the Average Family Size in South Pasadena
Average Family Size in South Pasadena is 2.3 People.
What is the Average Household Size in South Pasadena
Average Household Size in South Pasadena is 1.5 People.
How Large is the Labor Force in South Pasadena?
There are 1,655 People in the Labor Forcein in South Pasadena.
What is the Percentage of People in the Labor Force in South Pasadena?
31.7% of People are in the Labor Force in South Pasadena.
What is the Unemployment Rate in South Pasadena?
Unemployment Rate in South Pasadena is 6.8%.