Zip Codes with the Highest Percentage of Population Employed in Architecture & Engineering in Merritt Island, FL
RELATED REPORTS & OPTIONS
Architecture & Engineering
Merritt Island
Compare Zip Codes
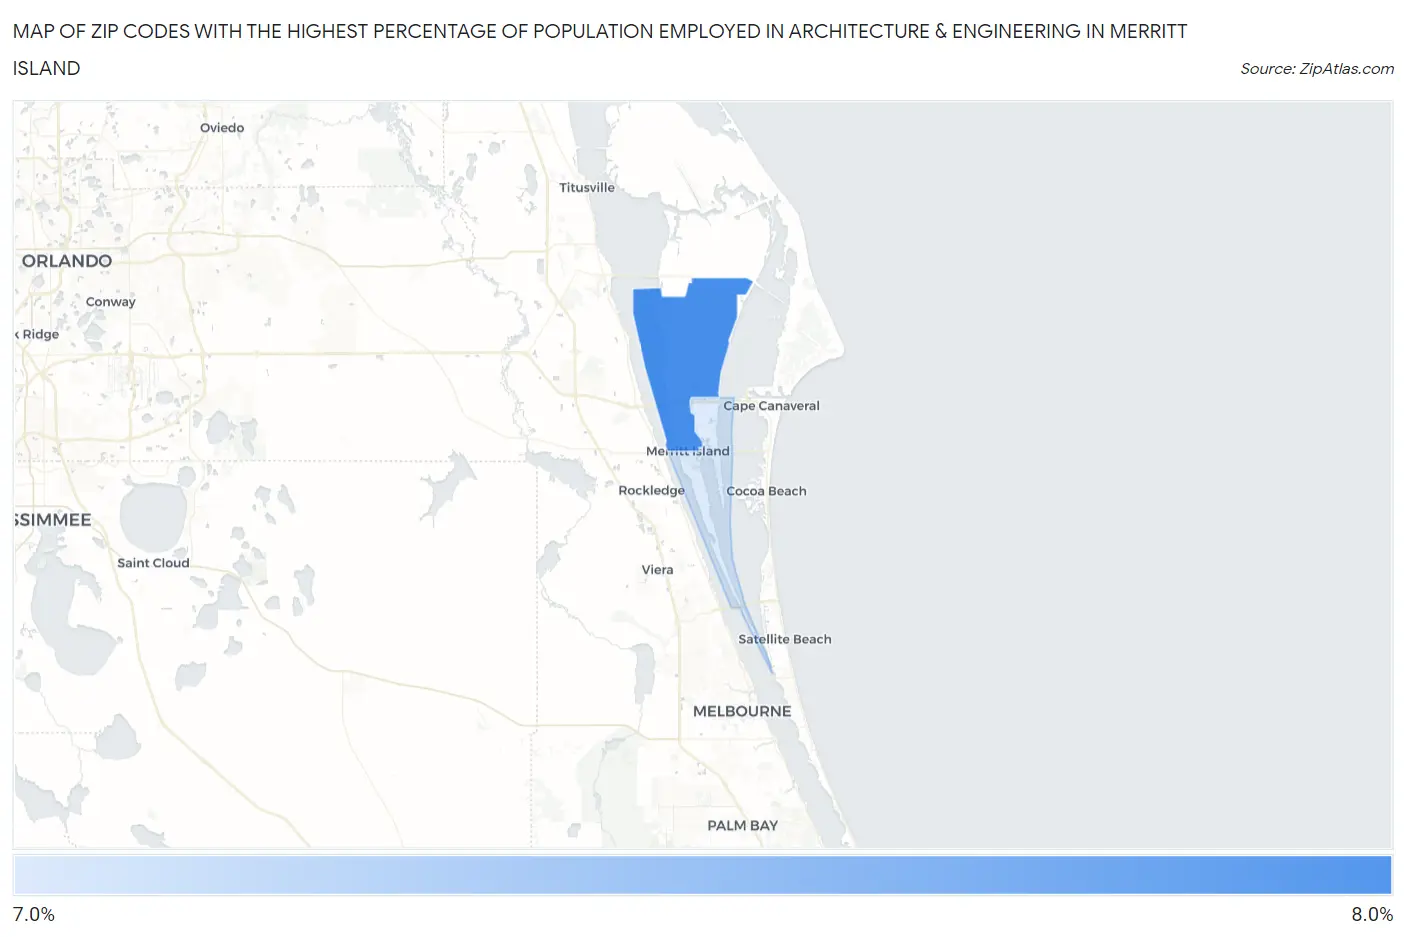
Map of Zip Codes with the Highest Percentage of Population Employed in Architecture & Engineering in Merritt Island
7.0%
7.5%
Zip Codes with the Highest Percentage of Population Employed in Architecture & Engineering in Merritt Island, FL
| Zip Code | % Employed | vs State | vs National | |
| 1. | 32953 | 7.5% | 1.6%(+5.91)#8 | 2.1%(+5.36)#653 |
| 2. | 32952 | 7.0% | 1.6%(+5.42)#11 | 2.1%(+4.87)#747 |
1
Common Questions
What are the Top Zip Codes with the Highest Percentage of Population Employed in Architecture & Engineering in Merritt Island, FL?
Top Zip Codes with the Highest Percentage of Population Employed in Architecture & Engineering in Merritt Island, FL are:
What zip code has the Highest Percentage of Population Employed in Architecture & Engineering in Merritt Island, FL?
32953 has the Highest Percentage of Population Employed in Architecture & Engineering in Merritt Island, FL with 7.5%.
What is the Percentage of Population Employed in Architecture & Engineering in Merritt Island, FL?
Percentage of Population Employed in Architecture & Engineering in Merritt Island is 6.8%.
What is the Percentage of Population Employed in Architecture & Engineering in Florida?
Percentage of Population Employed in Architecture & Engineering in Florida is 1.6%.
What is the Percentage of Population Employed in Architecture & Engineering in the United States?
Percentage of Population Employed in Architecture & Engineering in the United States is 2.1%.