Zip Codes with the Highest Percentage of Population Employed in Architecture & Engineering in Defuniak Springs, FL
RELATED REPORTS & OPTIONS
Architecture & Engineering
Defuniak Springs
Compare Zip Codes
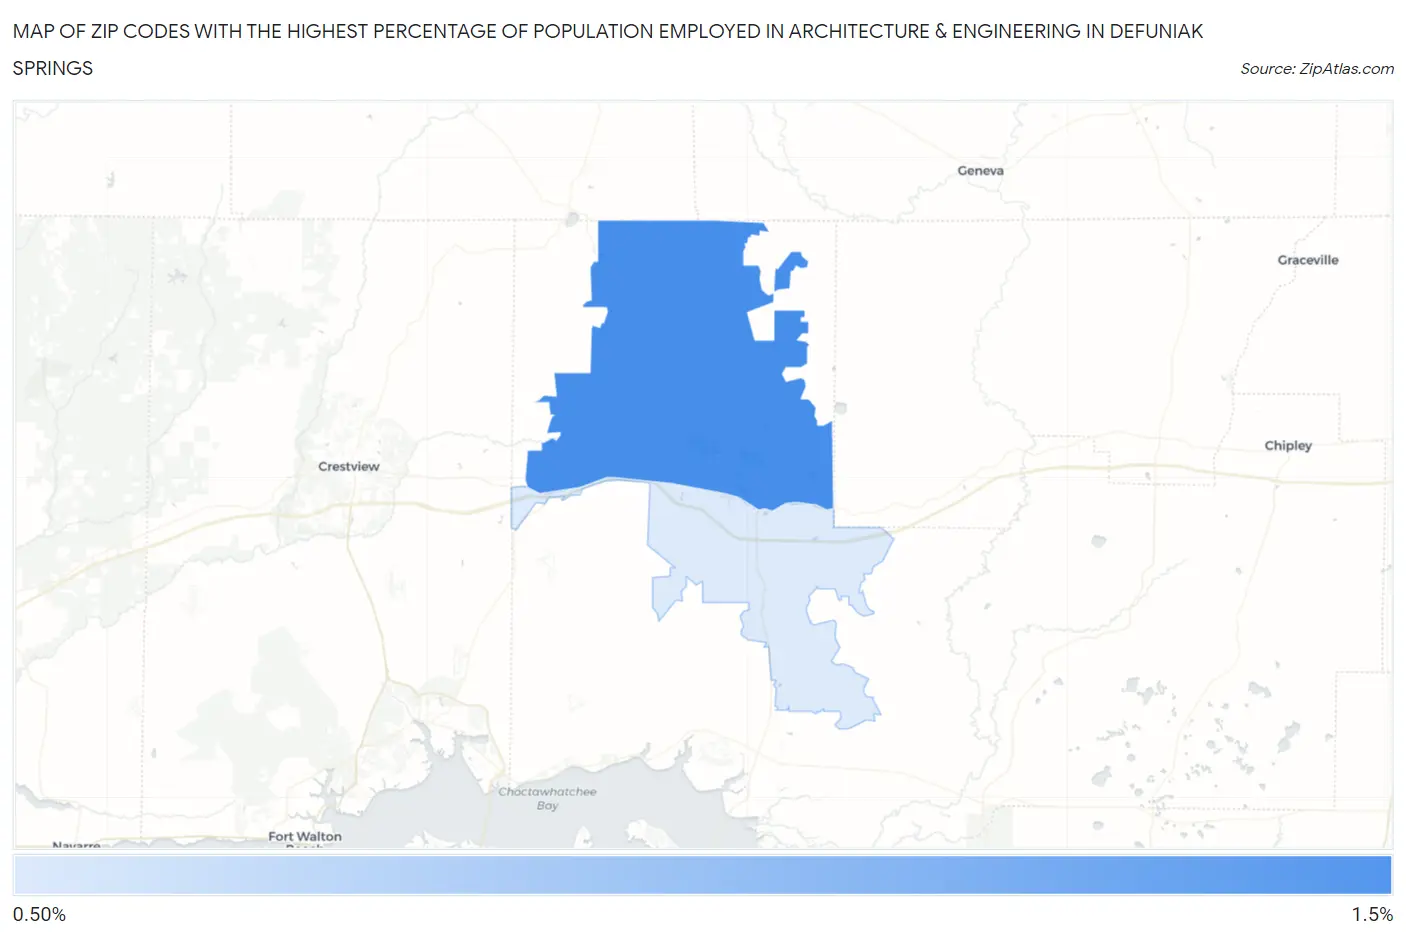
Map of Zip Codes with the Highest Percentage of Population Employed in Architecture & Engineering in Defuniak Springs
0.56%
1.5%
Zip Codes with the Highest Percentage of Population Employed in Architecture & Engineering in Defuniak Springs, FL
| Zip Code | % Employed | vs State | vs National | |
| 1. | 32433 | 1.5% | 1.6%(-0.145)#404 | 2.1%(-0.695)#13,205 |
| 2. | 32435 | 0.56% | 1.6%(-1.04)#737 | 2.1%(-1.59)#19,927 |
1
Common Questions
What are the Top Zip Codes with the Highest Percentage of Population Employed in Architecture & Engineering in Defuniak Springs, FL?
Top Zip Codes with the Highest Percentage of Population Employed in Architecture & Engineering in Defuniak Springs, FL are:
What zip code has the Highest Percentage of Population Employed in Architecture & Engineering in Defuniak Springs, FL?
32433 has the Highest Percentage of Population Employed in Architecture & Engineering in Defuniak Springs, FL with 1.5%.
What is the Percentage of Population Employed in Architecture & Engineering in Defuniak Springs, FL?
Percentage of Population Employed in Architecture & Engineering in Defuniak Springs is 0.61%.
What is the Percentage of Population Employed in Architecture & Engineering in Florida?
Percentage of Population Employed in Architecture & Engineering in Florida is 1.6%.
What is the Percentage of Population Employed in Architecture & Engineering in the United States?
Percentage of Population Employed in Architecture & Engineering in the United States is 2.1%.