Zip Codes with the Highest Percentage of Population Employed in Architecture & Engineering in Jacksonville, FL
RELATED REPORTS & OPTIONS
Architecture & Engineering
Jacksonville
Compare Zip Codes
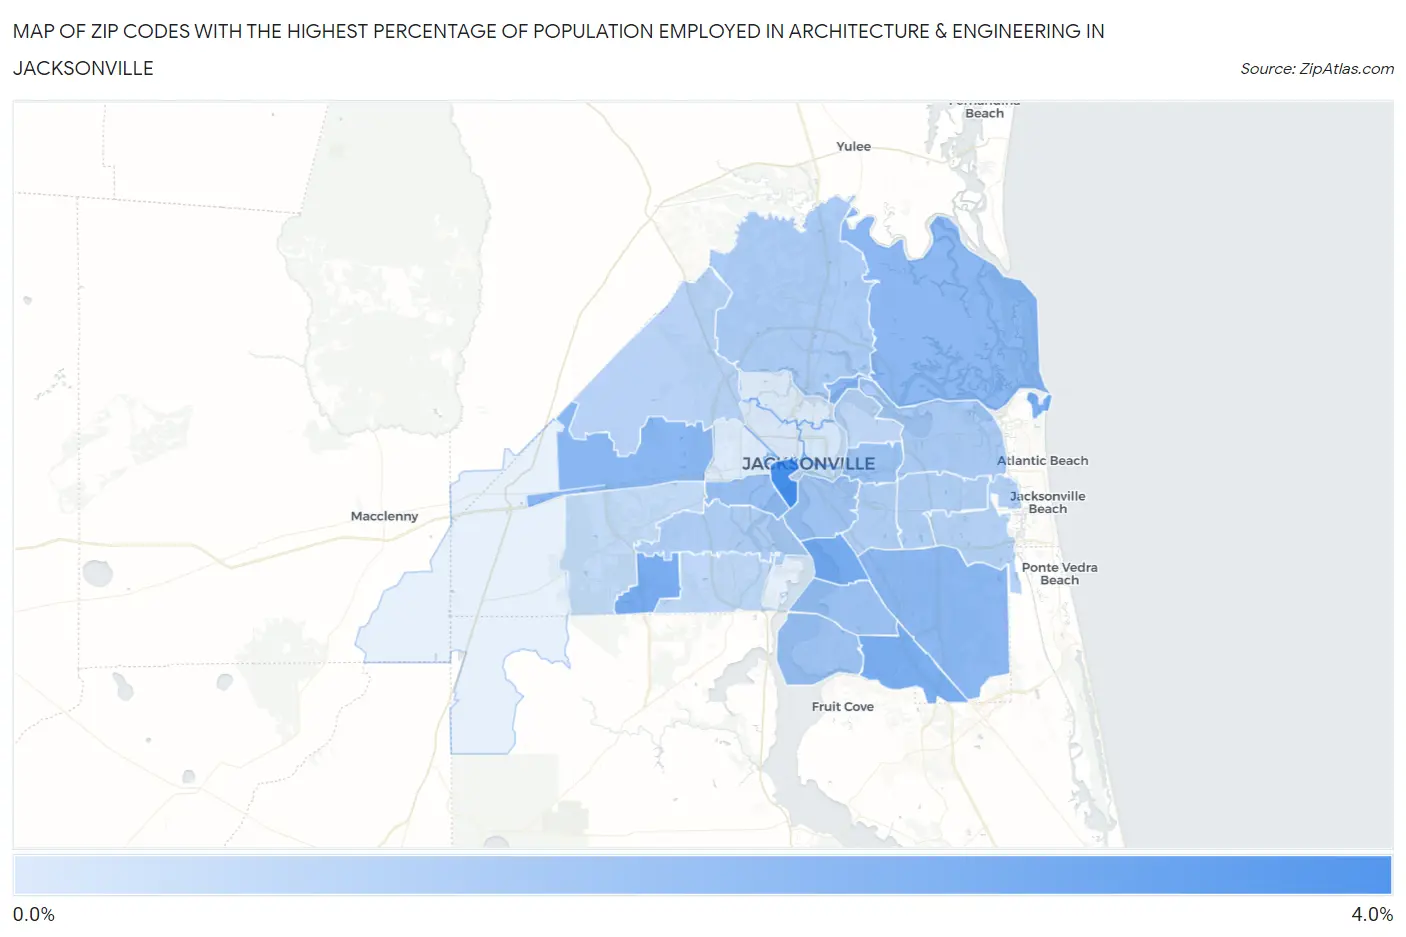
Map of Zip Codes with the Highest Percentage of Population Employed in Architecture & Engineering in Jacksonville
0.23%
3.5%
Zip Codes with the Highest Percentage of Population Employed in Architecture & Engineering in Jacksonville, FL
| Zip Code | % Employed | vs State | vs National | |
| 1. | 32204 | 3.5% | 1.6%(+1.87)#72 | 2.1%(+1.32)#3,811 |
| 2. | 32217 | 2.4% | 1.6%(+0.791)#170 | 2.1%(+0.241)#7,523 |
| 3. | 32222 | 2.3% | 1.6%(+0.744)#181 | 2.1%(+0.194)#7,749 |
| 4. | 32227 | 2.3% | 1.6%(+0.737)#182 | 2.1%(+0.187)#7,775 |
| 5. | 32258 | 2.3% | 1.6%(+0.699)#190 | 2.1%(+0.149)#7,951 |
| 6. | 32220 | 2.0% | 1.6%(+0.432)#229 | 2.1%(-0.119)#9,417 |
| 7. | 32226 | 2.0% | 1.6%(+0.368)#240 | 2.1%(-0.182)#9,812 |
| 8. | 32256 | 2.0% | 1.6%(+0.353)#243 | 2.1%(-0.197)#9,903 |
| 9. | 32205 | 1.7% | 1.6%(+0.138)#297 | 2.1%(-0.412)#11,252 |
| 10. | 32257 | 1.7% | 1.6%(+0.089)#310 | 2.1%(-0.462)#11,595 |
| 11. | 32211 | 1.6% | 1.6%(-0.045)#357 | 2.1%(-0.595)#12,480 |
| 12. | 32207 | 1.5% | 1.6%(-0.073)#370 | 2.1%(-0.624)#12,677 |
| 13. | 32223 | 1.5% | 1.6%(-0.098)#383 | 2.1%(-0.649)#12,878 |
| 14. | 32225 | 1.3% | 1.6%(-0.275)#452 | 2.1%(-0.825)#14,154 |
| 15. | 32218 | 1.2% | 1.6%(-0.352)#472 | 2.1%(-0.902)#14,704 |
| 16. | 32210 | 1.2% | 1.6%(-0.400)#498 | 2.1%(-0.950)#15,077 |
| 17. | 32216 | 1.2% | 1.6%(-0.418)#508 | 2.1%(-0.968)#15,235 |
| 18. | 32246 | 1.2% | 1.6%(-0.445)#523 | 2.1%(-0.995)#15,445 |
| 19. | 32224 | 1.1% | 1.6%(-0.517)#553 | 2.1%(-1.07)#16,010 |
| 20. | 32219 | 1.00% | 1.6%(-0.601)#573 | 2.1%(-1.15)#16,605 |
| 21. | 32244 | 0.85% | 1.6%(-0.749)#633 | 2.1%(-1.30)#17,755 |
| 22. | 32277 | 0.84% | 1.6%(-0.763)#636 | 2.1%(-1.31)#17,871 |
| 23. | 32221 | 0.77% | 1.6%(-0.832)#669 | 2.1%(-1.38)#18,386 |
| 24. | 32202 | 0.73% | 1.6%(-0.868)#679 | 2.1%(-1.42)#18,681 |
| 25. | 32206 | 0.39% | 1.6%(-1.21)#788 | 2.1%(-1.76)#21,043 |
| 26. | 32209 | 0.29% | 1.6%(-1.31)#806 | 2.1%(-1.86)#21,626 |
| 27. | 32208 | 0.24% | 1.6%(-1.36)#820 | 2.1%(-1.91)#21,862 |
| 28. | 32254 | 0.23% | 1.6%(-1.37)#824 | 2.1%(-1.92)#21,911 |
1
Common Questions
What are the Top 10 Zip Codes with the Highest Percentage of Population Employed in Architecture & Engineering in Jacksonville, FL?
Top 10 Zip Codes with the Highest Percentage of Population Employed in Architecture & Engineering in Jacksonville, FL are:
What zip code has the Highest Percentage of Population Employed in Architecture & Engineering in Jacksonville, FL?
32204 has the Highest Percentage of Population Employed in Architecture & Engineering in Jacksonville, FL with 3.5%.
What is the Percentage of Population Employed in Architecture & Engineering in Jacksonville, FL?
Percentage of Population Employed in Architecture & Engineering in Jacksonville is 1.3%.
What is the Percentage of Population Employed in Architecture & Engineering in Florida?
Percentage of Population Employed in Architecture & Engineering in Florida is 1.6%.
What is the Percentage of Population Employed in Architecture & Engineering in the United States?
Percentage of Population Employed in Architecture & Engineering in the United States is 2.1%.