Redington Beach, FL Map & Demographics
Redington Beach Map
Redington Beach Overview
$68,231
PER CAPITA INCOME
$116,607
AVG FAMILY INCOME
$104,474
AVG HOUSEHOLD INCOME
41.4%
WAGE / INCOME GAP [ % ]
58.6¢/ $1
WAGE / INCOME GAP [ $ ]
0.44
INEQUALITY / GINI INDEX
1,320
TOTAL POPULATION
667
MALE POPULATION
653
FEMALE POPULATION
102.14
MALES / 100 FEMALES
97.90
FEMALES / 100 MALES
59.7
MEDIAN AGE
2.4
AVG FAMILY SIZE
2.1
AVG HOUSEHOLD SIZE
638
LABOR FORCE [ PEOPLE ]
52.4%
PERCENT IN LABOR FORCE
3.3%
UNEMPLOYMENT RATE
Redington Beach Area Codes
Income in Redington Beach
Income Overview in Redington Beach
Per Capita Income in Redington Beach is $68,231, while median incomes of families and households are $116,607 and $104,474 respectively.
| Characteristic | Number | Measure |
| Per Capita Income | 1,320 | $68,231 |
| Median Family Income | 465 | $116,607 |
| Mean Family Income | 465 | $161,715 |
| Median Household Income | 624 | $104,474 |
| Mean Household Income | 624 | $142,129 |
| Income Deficit | 465 | $0 |
| Wage / Income Gap (%) | 1,320 | 41.43% |
| Wage / Income Gap ($) | 1,320 | 58.57¢ per $1 |
| Gini / Inequality Index | 1,320 | 0.44 |
Earnings by Sex in Redington Beach
Average Earnings in Redington Beach are $59,868, $80,833 for men and $47,344 for women, a difference of 41.4%.
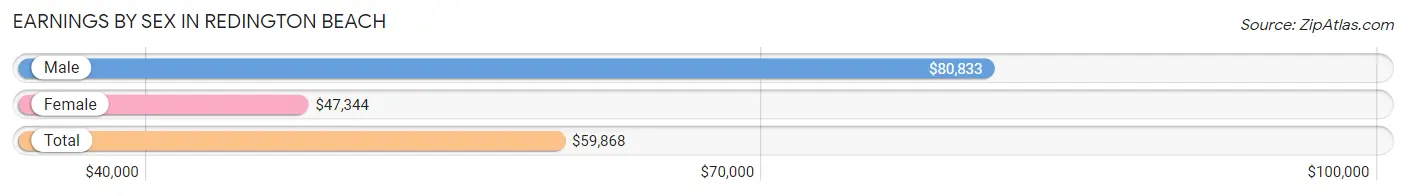
| Sex | Number | Average Earnings |
| Male | 342 (52.0%) | $80,833 |
| Female | 316 (48.0%) | $47,344 |
| Total | 658 (100.0%) | $59,868 |
Earnings by Sex by Income Bracket in Redington Beach
The most common earnings brackets in Redington Beach are $100,000+ for men (135 | 39.5%) and $100,000+ for women (74 | 23.4%).
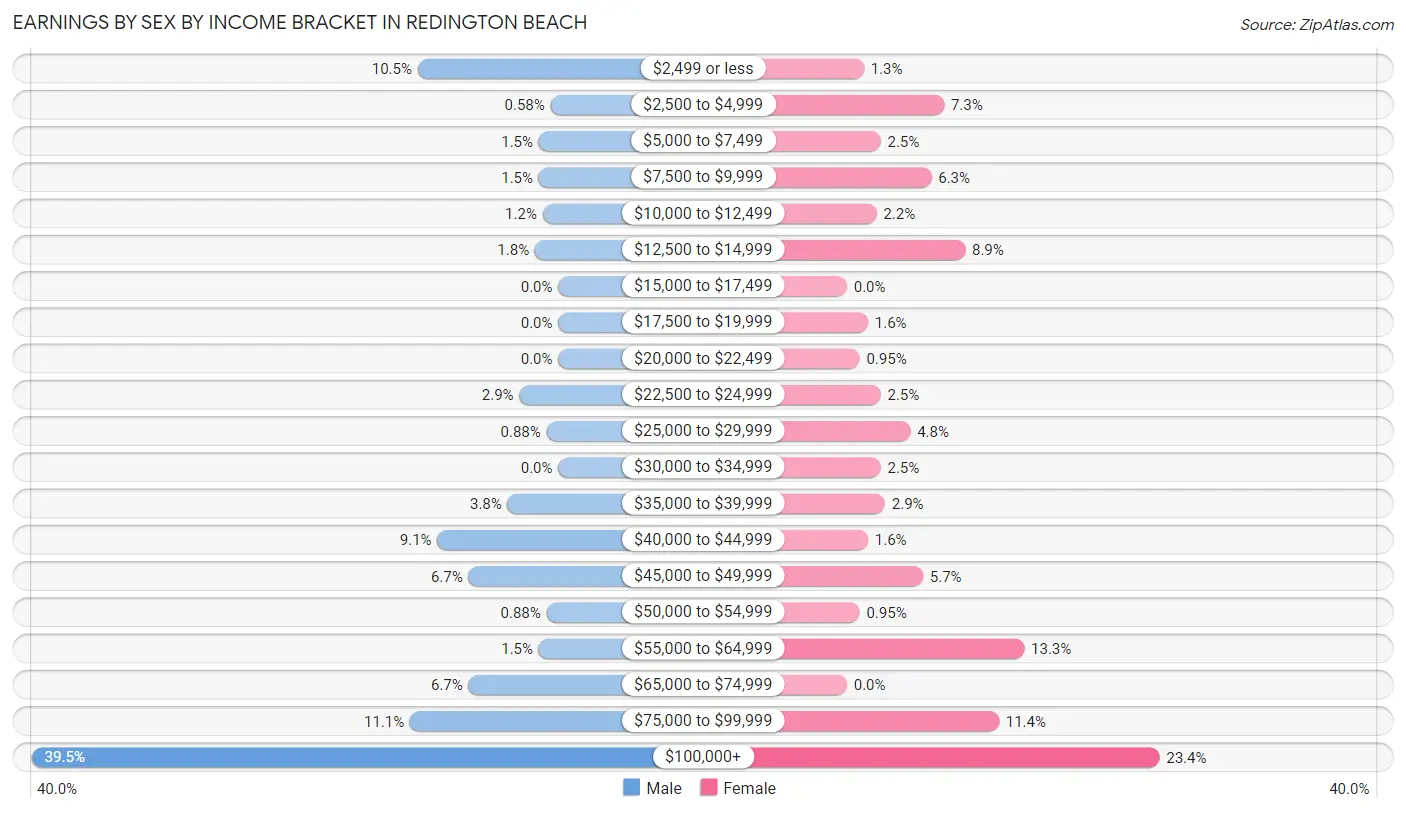
| Income | Male | Female |
| $2,499 or less | 36 (10.5%) | 4 (1.3%) |
| $2,500 to $4,999 | 2 (0.6%) | 23 (7.3%) |
| $5,000 to $7,499 | 5 (1.5%) | 8 (2.5%) |
| $7,500 to $9,999 | 5 (1.5%) | 20 (6.3%) |
| $10,000 to $12,499 | 4 (1.2%) | 7 (2.2%) |
| $12,500 to $14,999 | 6 (1.8%) | 28 (8.9%) |
| $15,000 to $17,499 | 0 (0.0%) | 0 (0.0%) |
| $17,500 to $19,999 | 0 (0.0%) | 5 (1.6%) |
| $20,000 to $22,499 | 0 (0.0%) | 3 (0.9%) |
| $22,500 to $24,999 | 10 (2.9%) | 8 (2.5%) |
| $25,000 to $29,999 | 3 (0.9%) | 15 (4.8%) |
| $30,000 to $34,999 | 0 (0.0%) | 8 (2.5%) |
| $35,000 to $39,999 | 13 (3.8%) | 9 (2.9%) |
| $40,000 to $44,999 | 31 (9.1%) | 5 (1.6%) |
| $45,000 to $49,999 | 23 (6.7%) | 18 (5.7%) |
| $50,000 to $54,999 | 3 (0.9%) | 3 (0.9%) |
| $55,000 to $64,999 | 5 (1.5%) | 42 (13.3%) |
| $65,000 to $74,999 | 23 (6.7%) | 0 (0.0%) |
| $75,000 to $99,999 | 38 (11.1%) | 36 (11.4%) |
| $100,000+ | 135 (39.5%) | 74 (23.4%) |
| Total | 342 (100.0%) | 316 (100.0%) |
Earnings by Sex by Educational Attainment in Redington Beach
Average earnings in Redington Beach are $90,556 for men and $58,309 for women, a difference of 35.6%. Men with an educational attainment of high school diploma enjoy the highest average annual earnings of $128,750, while those with college or associate's degree education earn the least with $49,821. Women with an educational attainment of bachelor's degree earn the most with the average annual earnings of $98,750, while those with graduate degree education have the smallest earnings of $56,667.
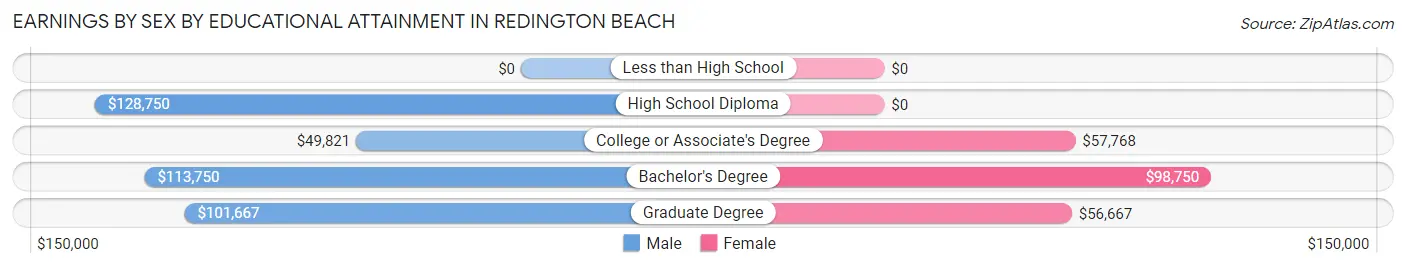
| Educational Attainment | Male Income | Female Income |
| Less than High School | - | - |
| High School Diploma | $128,750 | $0 |
| College or Associate's Degree | $49,821 | $57,768 |
| Bachelor's Degree | $113,750 | $98,750 |
| Graduate Degree | $101,667 | $56,667 |
| Total | $90,556 | $58,309 |
Family Income in Redington Beach
Family Income Brackets in Redington Beach
According to the Redington Beach family income data, there are 136 families falling into the $100,000 to $149,999 income range, which is the most common income bracket and makes up 29.2% of all families. Conversely, the $10,000 to $14,999 income bracket is the least frequent group with only 7 families (1.5%) belonging to this category.
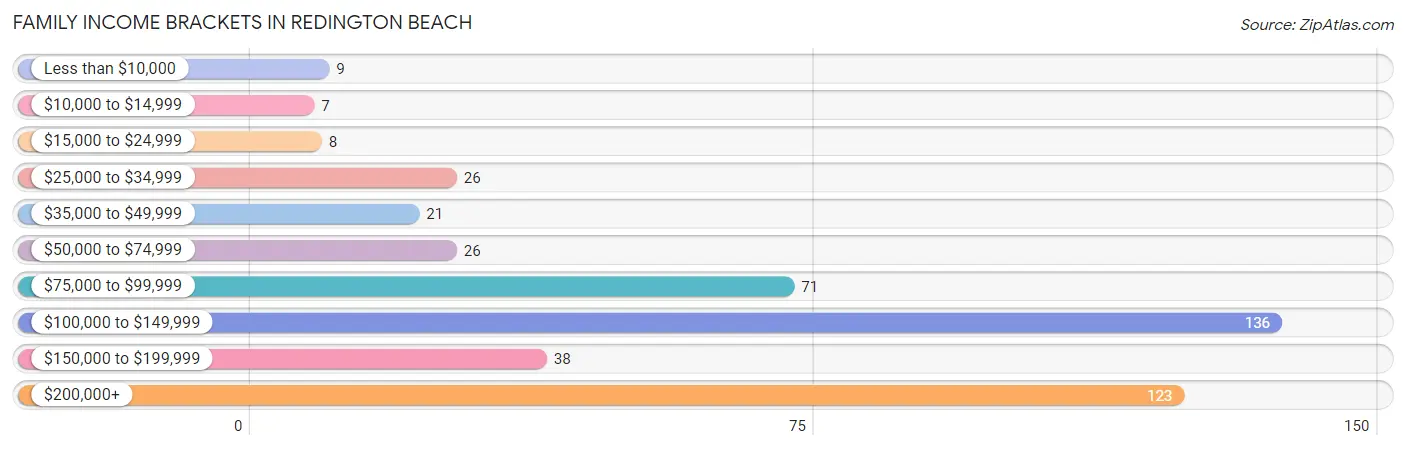
| Income Bracket | # Families | % Families |
| Less than $10,000 | 9 | 1.9% |
| $10,000 to $14,999 | 7 | 1.5% |
| $15,000 to $24,999 | 8 | 1.7% |
| $25,000 to $34,999 | 26 | 5.6% |
| $35,000 to $49,999 | 21 | 4.5% |
| $50,000 to $74,999 | 26 | 5.6% |
| $75,000 to $99,999 | 71 | 15.3% |
| $100,000 to $149,999 | 136 | 29.2% |
| $150,000 to $199,999 | 38 | 8.2% |
| $200,000+ | 123 | 26.5% |
Family Income by Famaliy Size in Redington Beach
4-person families (38 | 8.2%) account for the highest median family income in Redington Beach with $231,250 per family, while 4-person families (38 | 8.2%) have the highest median income of $57,812 per family member.
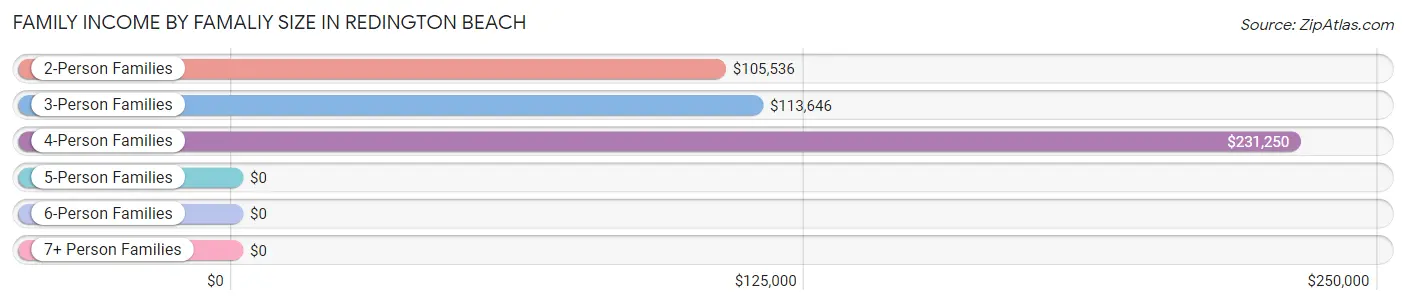
| Income Bracket | # Families | Median Income |
| 2-Person Families | 345 (74.2%) | $105,536 |
| 3-Person Families | 69 (14.8%) | $113,646 |
| 4-Person Families | 38 (8.2%) | $231,250 |
| 5-Person Families | 13 (2.8%) | $0 |
| 6-Person Families | 0 (0.0%) | $0 |
| 7+ Person Families | 0 (0.0%) | $0 |
| Total | 465 (100.0%) | $116,607 |
Family Income by Number of Earners in Redington Beach
The median family income in Redington Beach is $116,607, with families comprising 3+ earners (39) having the highest median family income of $250,001, while families with no earners (126) have the lowest median family income of $98,889, accounting for 8.4% and 27.1% of families, respectively.
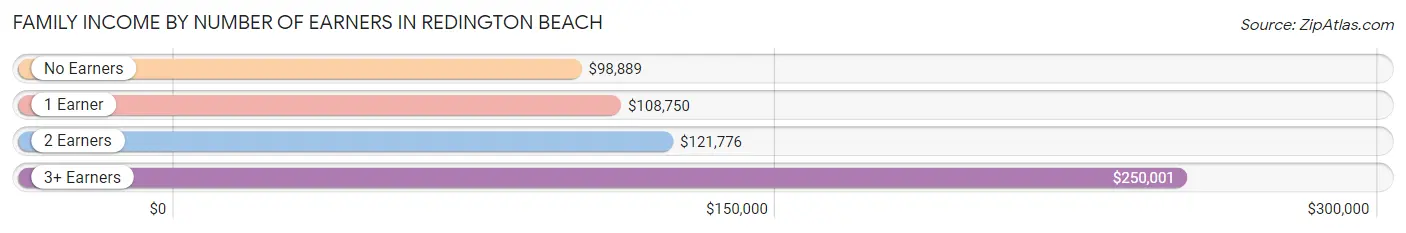
| Number of Earners | # Families | Median Income |
| No Earners | 126 (27.1%) | $98,889 |
| 1 Earner | 147 (31.6%) | $108,750 |
| 2 Earners | 153 (32.9%) | $121,776 |
| 3+ Earners | 39 (8.4%) | $250,001 |
| Total | 465 (100.0%) | $116,607 |
Household Income in Redington Beach
Household Income Brackets in Redington Beach
With 154 households falling in the category, the $100,000 to $149,999 income range is the most frequent in Redington Beach, accounting for 24.7% of all households. In contrast, only 10 households (1.6%) fall into the $10,000 to $14,999 income bracket, making it the least populous group.
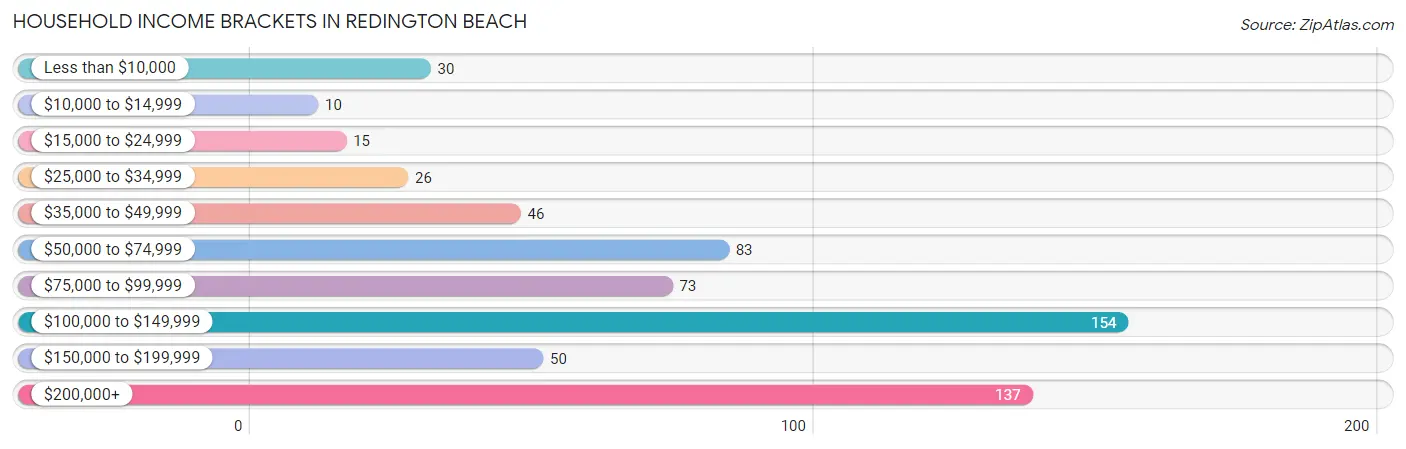
| Income Bracket | # Households | % Households |
| Less than $10,000 | 30 | 4.8% |
| $10,000 to $14,999 | 10 | 1.6% |
| $15,000 to $24,999 | 15 | 2.4% |
| $25,000 to $34,999 | 26 | 4.2% |
| $35,000 to $49,999 | 46 | 7.4% |
| $50,000 to $74,999 | 83 | 13.3% |
| $75,000 to $99,999 | 73 | 11.7% |
| $100,000 to $149,999 | 154 | 24.7% |
| $150,000 to $199,999 | 50 | 8.0% |
| $200,000+ | 137 | 22.0% |
Household Income by Householder Age in Redington Beach
The median household income in Redington Beach is $104,474, with the highest median household income of $137,917 found in the 45 to 64 years age bracket for the primary householder. A total of 259 households (41.5%) fall into this category. Meanwhile, the 15 to 24 years age bracket for the primary householder has the lowest median household income of $0, with 2 households (0.3%) in this group.
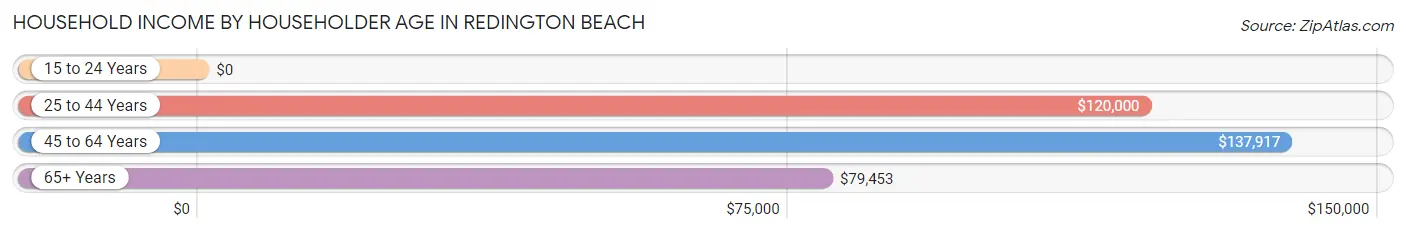
| Income Bracket | # Households | Median Income |
| 15 to 24 Years | 2 (0.3%) | $0 |
| 25 to 44 Years | 56 (9.0%) | $120,000 |
| 45 to 64 Years | 259 (41.5%) | $137,917 |
| 65+ Years | 307 (49.2%) | $79,453 |
| Total | 624 (100.0%) | $104,474 |
Poverty in Redington Beach
Income Below Poverty by Sex and Age in Redington Beach
With 4.6% poverty level for males and 7.2% for females among the residents of Redington Beach, 18 to 24 year old males and under 5 year old females are the most vulnerable to poverty, with 5 males (23.8%) and 3 females (42.9%) in their respective age groups living below the poverty level.
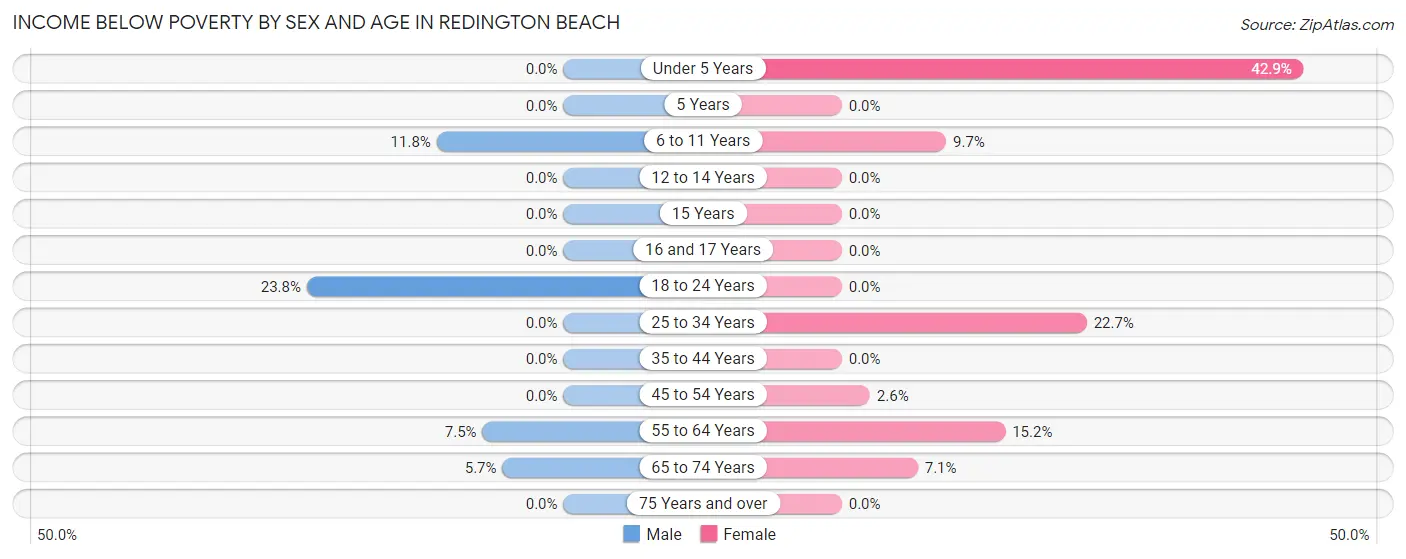
| Age Bracket | Male | Female |
| Under 5 Years | 0 (0.0%) | 3 (42.9%) |
| 5 Years | 0 (0.0%) | 0 (0.0%) |
| 6 to 11 Years | 4 (11.8%) | 3 (9.7%) |
| 12 to 14 Years | 0 (0.0%) | 0 (0.0%) |
| 15 Years | 0 (0.0%) | 0 (0.0%) |
| 16 and 17 Years | 0 (0.0%) | 0 (0.0%) |
| 18 to 24 Years | 5 (23.8%) | 0 (0.0%) |
| 25 to 34 Years | 0 (0.0%) | 5 (22.7%) |
| 35 to 44 Years | 0 (0.0%) | 0 (0.0%) |
| 45 to 54 Years | 0 (0.0%) | 3 (2.6%) |
| 55 to 64 Years | 13 (7.5%) | 22 (15.2%) |
| 65 to 74 Years | 9 (5.7%) | 11 (7.0%) |
| 75 Years and over | 0 (0.0%) | 0 (0.0%) |
| Total | 31 (4.6%) | 47 (7.2%) |
Income Above Poverty by Sex and Age in Redington Beach
According to the poverty statistics in Redington Beach, males aged 12 to 14 years and females aged 5 years are the age groups that are most secure financially, with 100.0% of males and 100.0% of females in these age groups living above the poverty line.
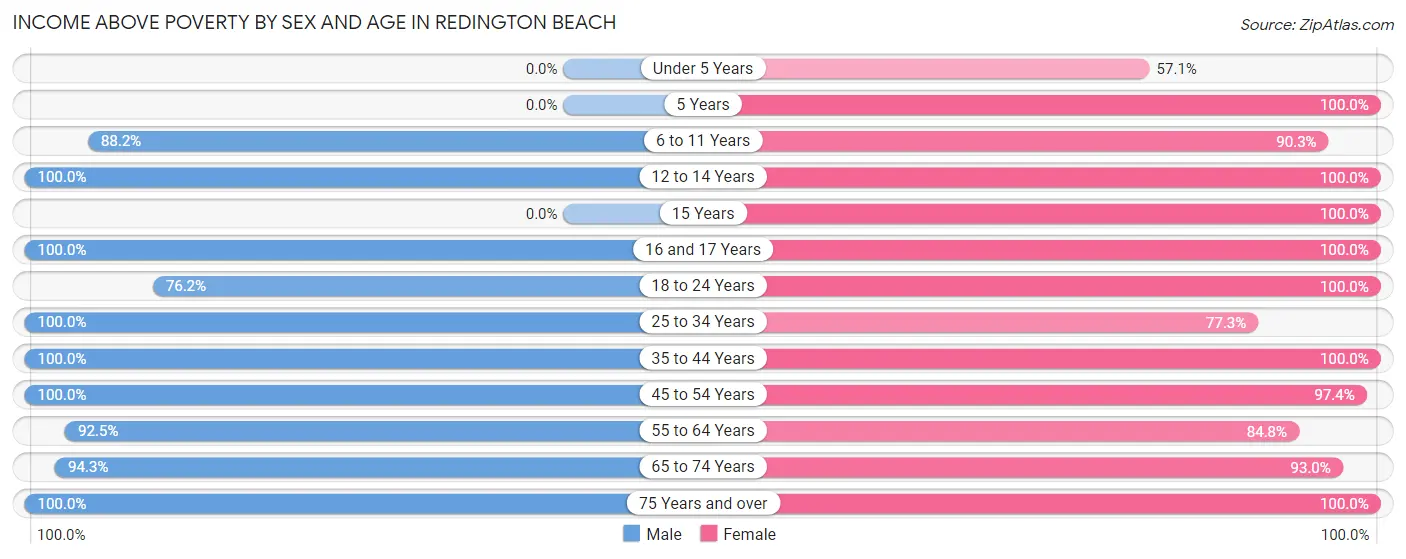
| Age Bracket | Male | Female |
| Under 5 Years | 0 (0.0%) | 4 (57.1%) |
| 5 Years | 0 (0.0%) | 6 (100.0%) |
| 6 to 11 Years | 30 (88.2%) | 28 (90.3%) |
| 12 to 14 Years | 14 (100.0%) | 7 (100.0%) |
| 15 Years | 0 (0.0%) | 3 (100.0%) |
| 16 and 17 Years | 32 (100.0%) | 13 (100.0%) |
| 18 to 24 Years | 16 (76.2%) | 26 (100.0%) |
| 25 to 34 Years | 11 (100.0%) | 17 (77.3%) |
| 35 to 44 Years | 52 (100.0%) | 35 (100.0%) |
| 45 to 54 Years | 89 (100.0%) | 112 (97.4%) |
| 55 to 64 Years | 160 (92.5%) | 123 (84.8%) |
| 65 to 74 Years | 150 (94.3%) | 145 (92.9%) |
| 75 Years and over | 82 (100.0%) | 87 (100.0%) |
| Total | 636 (95.4%) | 606 (92.8%) |
Income Below Poverty Among Married-Couple Families in Redington Beach
The poverty statistics for married-couple families in Redington Beach show that 2.9% or 12 of the total 415 families live below the poverty line. Families with no children have the highest poverty rate of 3.5%, comprising of 12 families. On the other hand, families with 1 or 2 children have the lowest poverty rate of 0.0%, which includes 0 families.
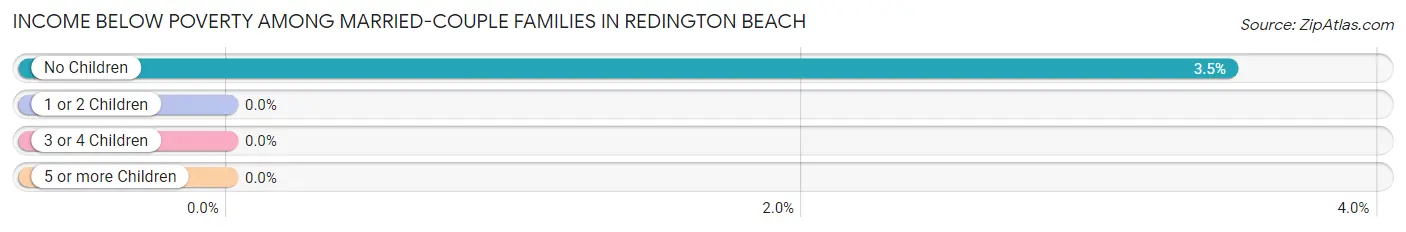
| Children | Above Poverty | Below Poverty |
| No Children | 333 (96.5%) | 12 (3.5%) |
| 1 or 2 Children | 57 (100.0%) | 0 (0.0%) |
| 3 or 4 Children | 13 (100.0%) | 0 (0.0%) |
| 5 or more Children | 0 (0.0%) | 0 (0.0%) |
| Total | 403 (97.1%) | 12 (2.9%) |
Income Below Poverty Among Single-Parent Households in Redington Beach
According to the poverty data in Redington Beach, 21.0% or 4 single-father households and 9.7% or 3 single-mother households are living below the poverty line. Among single-father households, those with 1 or 2 children have the highest poverty rate, with 4 households (100.0%) experiencing poverty. Likewise, among single-mother households, those with 1 or 2 children have the highest poverty rate, with 3 households (42.9%) falling below the poverty line.
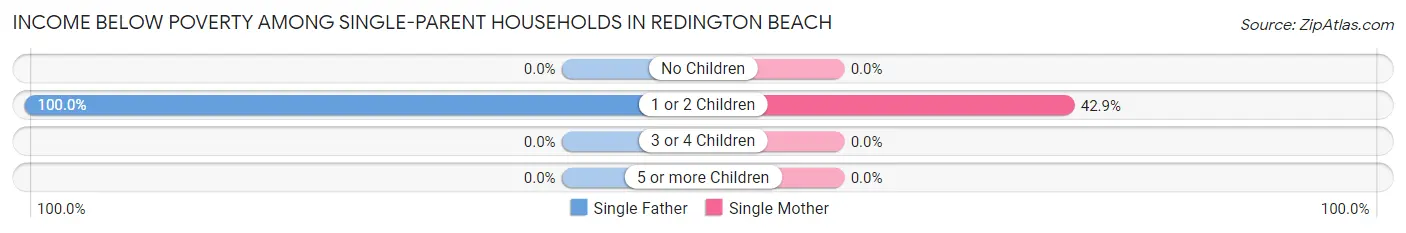
| Children | Single Father | Single Mother |
| No Children | 0 (0.0%) | 0 (0.0%) |
| 1 or 2 Children | 4 (100.0%) | 3 (42.9%) |
| 3 or 4 Children | 0 (0.0%) | 0 (0.0%) |
| 5 or more Children | 0 (0.0%) | 0 (0.0%) |
| Total | 4 (21.0%) | 3 (9.7%) |
Income Below Poverty Among Married-Couple vs Single-Parent Households in Redington Beach
The poverty data for Redington Beach shows that 12 of the married-couple family households (2.9%) and 7 of the single-parent households (14.0%) are living below the poverty level. Within the married-couple family households, those with no children have the highest poverty rate, with 12 households (3.5%) falling below the poverty line. Among the single-parent households, those with 1 or 2 children have the highest poverty rate, with 7 household (63.6%) living below poverty.
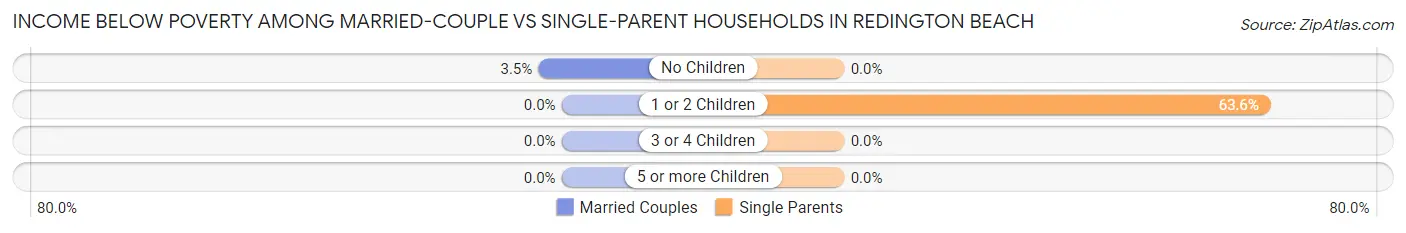
| Children | Married-Couple Families | Single-Parent Households |
| No Children | 12 (3.5%) | 0 (0.0%) |
| 1 or 2 Children | 0 (0.0%) | 7 (63.6%) |
| 3 or 4 Children | 0 (0.0%) | 0 (0.0%) |
| 5 or more Children | 0 (0.0%) | 0 (0.0%) |
| Total | 12 (2.9%) | 7 (14.0%) |
Race in Redington Beach
The most populous races in Redington Beach are White / Caucasian (1,177 | 89.2%), Two or more Races (102 | 7.7%), and Hispanic or Latino (60 | 4.5%).
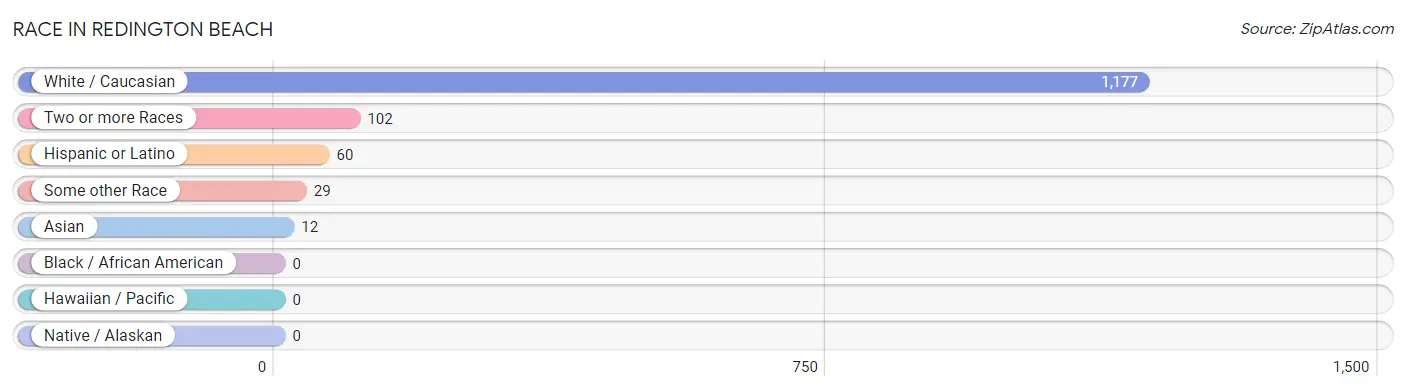
| Race | # Population | % Population |
| Asian | 12 | 0.9% |
| Black / African American | 0 | 0.0% |
| Hawaiian / Pacific | 0 | 0.0% |
| Hispanic or Latino | 60 | 4.5% |
| Native / Alaskan | 0 | 0.0% |
| White / Caucasian | 1,177 | 89.2% |
| Two or more Races | 102 | 7.7% |
| Some other Race | 29 | 2.2% |
| Total | 1,320 | 100.0% |
Ancestry in Redington Beach
The most populous ancestries reported in Redington Beach are German (274 | 20.8%), Irish (191 | 14.5%), English (182 | 13.8%), Italian (140 | 10.6%), and Polish (60 | 4.5%), together accounting for 64.2% of all Redington Beach residents.
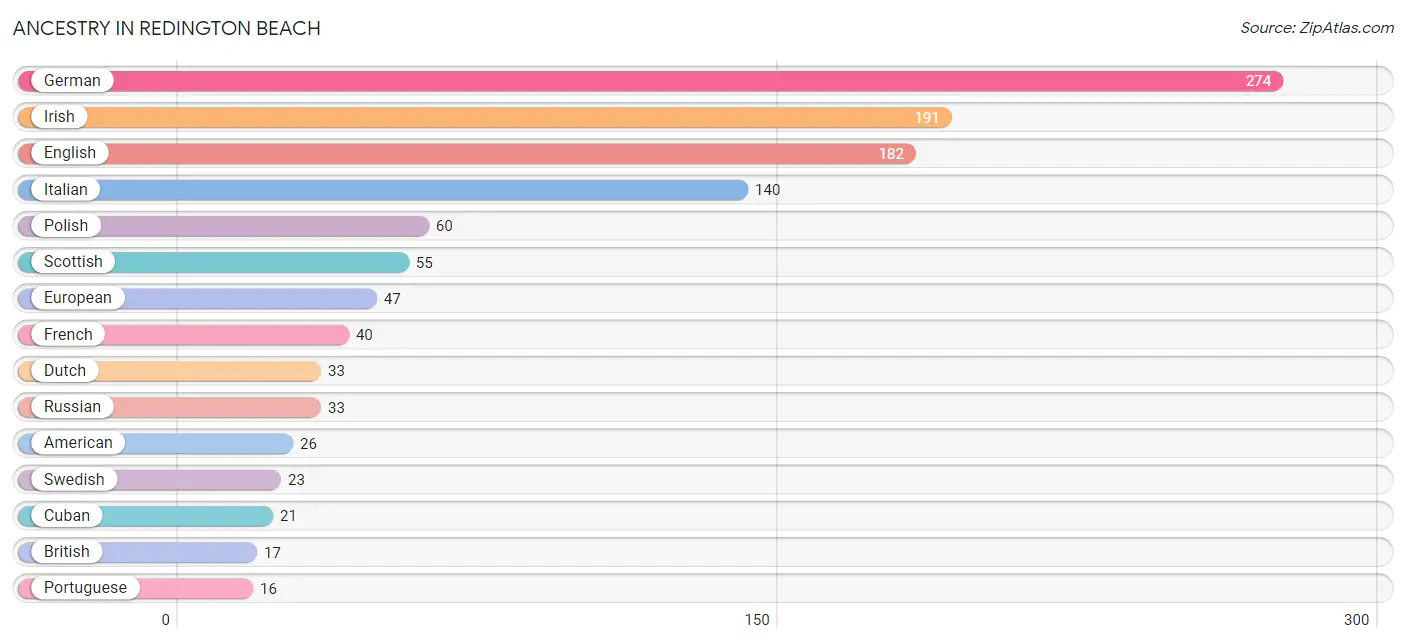
| Ancestry | # Population | % Population |
| American | 26 | 2.0% |
| Arab | 11 | 0.8% |
| Argentinean | 3 | 0.2% |
| Austrian | 6 | 0.4% |
| British | 17 | 1.3% |
| Canadian | 6 | 0.4% |
| Colombian | 4 | 0.3% |
| Croatian | 6 | 0.4% |
| Cuban | 21 | 1.6% |
| Danish | 7 | 0.5% |
| Dutch | 33 | 2.5% |
| Eastern European | 6 | 0.4% |
| Egyptian | 3 | 0.2% |
| English | 182 | 13.8% |
| European | 47 | 3.6% |
| Finnish | 2 | 0.2% |
| French | 40 | 3.0% |
| French Canadian | 6 | 0.4% |
| German | 274 | 20.8% |
| Greek | 6 | 0.4% |
| Hungarian | 7 | 0.5% |
| Irish | 191 | 14.5% |
| Italian | 140 | 10.6% |
| Korean | 10 | 0.8% |
| Lebanese | 5 | 0.4% |
| Lithuanian | 12 | 0.9% |
| Luxembourger | 2 | 0.2% |
| Norwegian | 11 | 0.8% |
| Peruvian | 2 | 0.2% |
| Polish | 60 | 4.5% |
| Portuguese | 16 | 1.2% |
| Puerto Rican | 12 | 0.9% |
| Russian | 33 | 2.5% |
| Scandinavian | 3 | 0.2% |
| Scotch-Irish | 6 | 0.4% |
| Scottish | 55 | 4.2% |
| South American | 9 | 0.7% |
| Spaniard | 9 | 0.7% |
| Spanish | 9 | 0.7% |
| Sri Lankan | 3 | 0.2% |
| Swedish | 23 | 1.7% |
| Swiss | 9 | 0.7% |
| Syrian | 3 | 0.2% |
| Thai | 9 | 0.7% |
| Ukrainian | 12 | 0.9% |
| Welsh | 10 | 0.8% | View All 46 Rows |
Immigrants in Redington Beach
The most numerous immigrant groups reported in Redington Beach came from Europe (38 | 2.9%), Canada (22 | 1.7%), Latin America (18 | 1.4%), South America (18 | 1.4%), and Northern Europe (14 | 1.1%), together accounting for 8.3% of all Redington Beach residents.
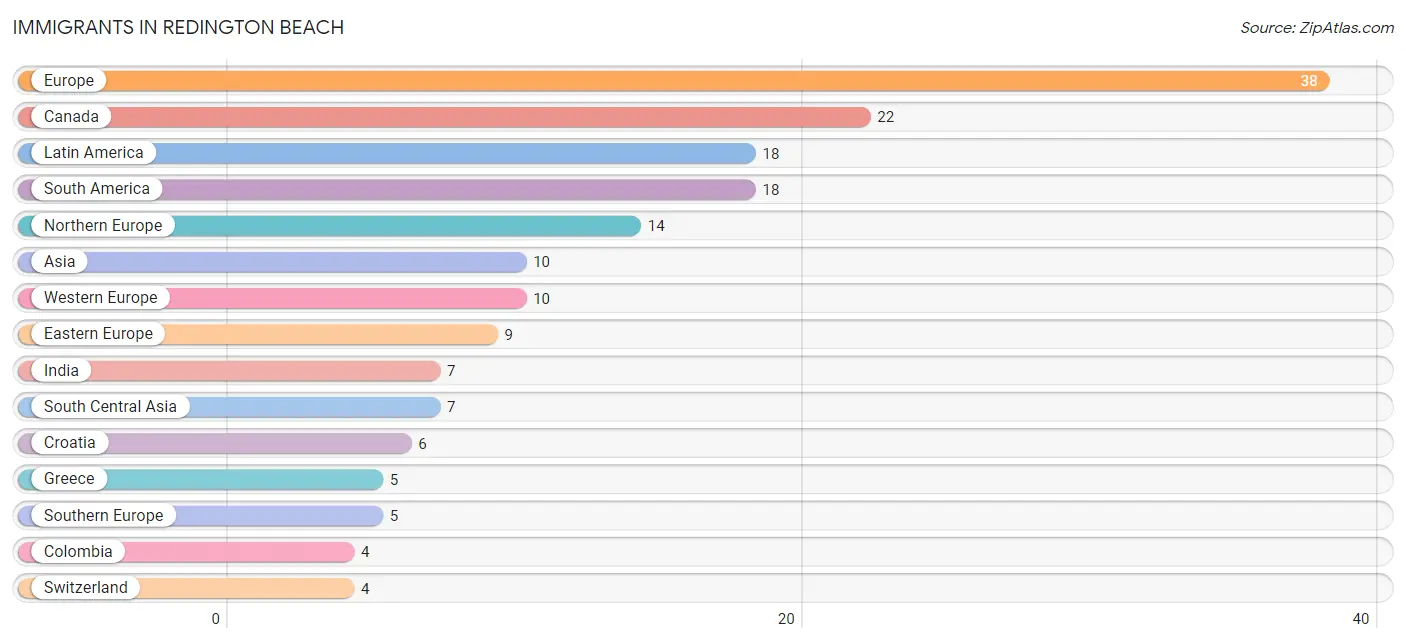
| Immigration Origin | # Population | % Population |
| Argentina | 3 | 0.2% |
| Asia | 10 | 0.8% |
| Canada | 22 | 1.7% |
| Colombia | 4 | 0.3% |
| Croatia | 6 | 0.4% |
| Eastern Europe | 9 | 0.7% |
| Europe | 38 | 2.9% |
| France | 2 | 0.2% |
| Germany | 2 | 0.2% |
| Greece | 5 | 0.4% |
| India | 7 | 0.5% |
| Israel | 3 | 0.2% |
| Latin America | 18 | 1.4% |
| Netherlands | 2 | 0.2% |
| Northern Europe | 14 | 1.1% |
| Peru | 2 | 0.2% |
| Poland | 3 | 0.2% |
| South America | 18 | 1.4% |
| South Central Asia | 7 | 0.5% |
| Southern Europe | 5 | 0.4% |
| Sweden | 2 | 0.2% |
| Switzerland | 4 | 0.3% |
| Western Asia | 3 | 0.2% |
| Western Europe | 10 | 0.8% | View All 24 Rows |
Sex and Age in Redington Beach
Sex and Age in Redington Beach
The most populous age groups in Redington Beach are 60 to 64 Years (98 | 14.7%) for men and 70 to 74 Years (86 | 13.2%) for women.
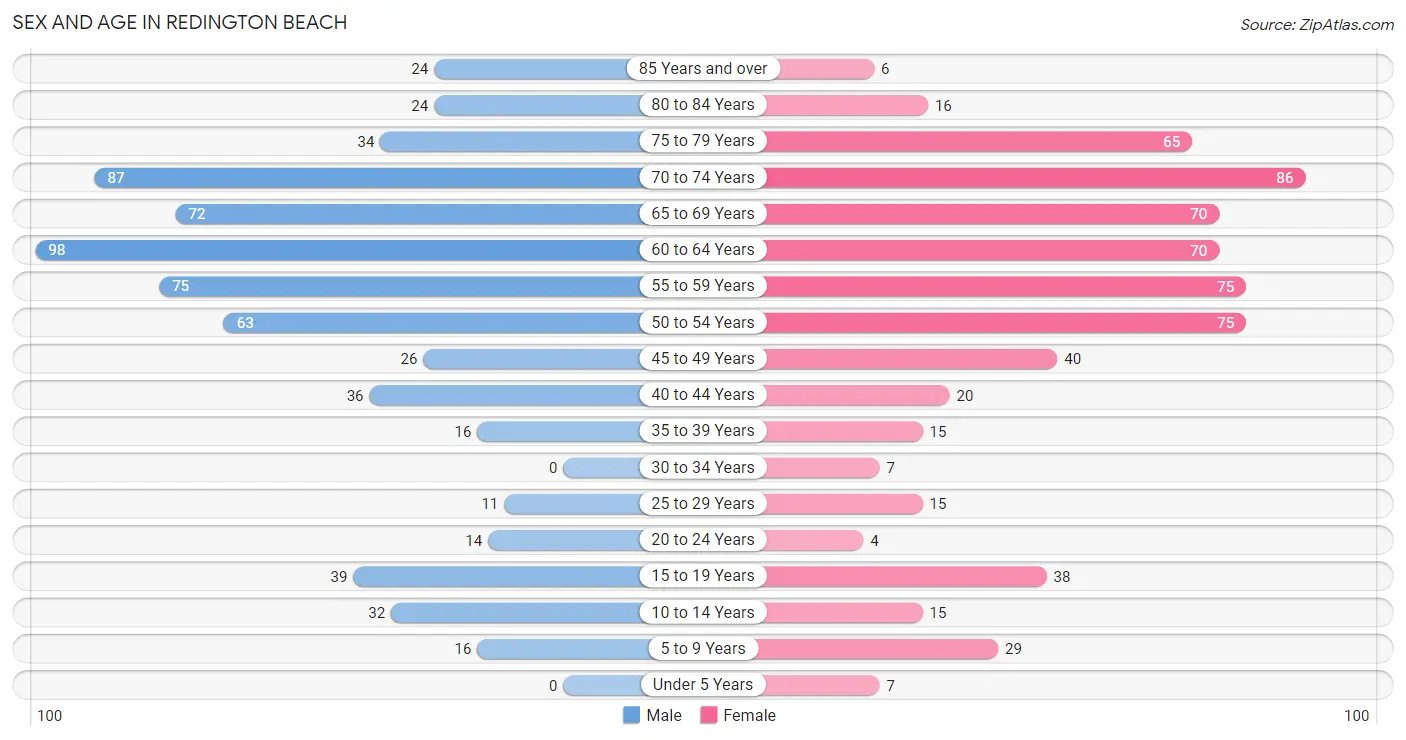
| Age Bracket | Male | Female |
| Under 5 Years | 0 (0.0%) | 7 (1.1%) |
| 5 to 9 Years | 16 (2.4%) | 29 (4.4%) |
| 10 to 14 Years | 32 (4.8%) | 15 (2.3%) |
| 15 to 19 Years | 39 (5.9%) | 38 (5.8%) |
| 20 to 24 Years | 14 (2.1%) | 4 (0.6%) |
| 25 to 29 Years | 11 (1.7%) | 15 (2.3%) |
| 30 to 34 Years | 0 (0.0%) | 7 (1.1%) |
| 35 to 39 Years | 16 (2.4%) | 15 (2.3%) |
| 40 to 44 Years | 36 (5.4%) | 20 (3.1%) |
| 45 to 49 Years | 26 (3.9%) | 40 (6.1%) |
| 50 to 54 Years | 63 (9.5%) | 75 (11.5%) |
| 55 to 59 Years | 75 (11.2%) | 75 (11.5%) |
| 60 to 64 Years | 98 (14.7%) | 70 (10.7%) |
| 65 to 69 Years | 72 (10.8%) | 70 (10.7%) |
| 70 to 74 Years | 87 (13.0%) | 86 (13.2%) |
| 75 to 79 Years | 34 (5.1%) | 65 (10.0%) |
| 80 to 84 Years | 24 (3.6%) | 16 (2.5%) |
| 85 Years and over | 24 (3.6%) | 6 (0.9%) |
| Total | 667 (100.0%) | 653 (100.0%) |
Families and Households in Redington Beach
Median Family Size in Redington Beach
The median family size in Redington Beach is 2.43 persons per family, with single female/mother families (31 | 6.7%) accounting for the largest median family size of 2.81 persons per family. On the other hand, single male/father families (19 | 4.1%) represent the smallest median family size with 2.16 persons per family.
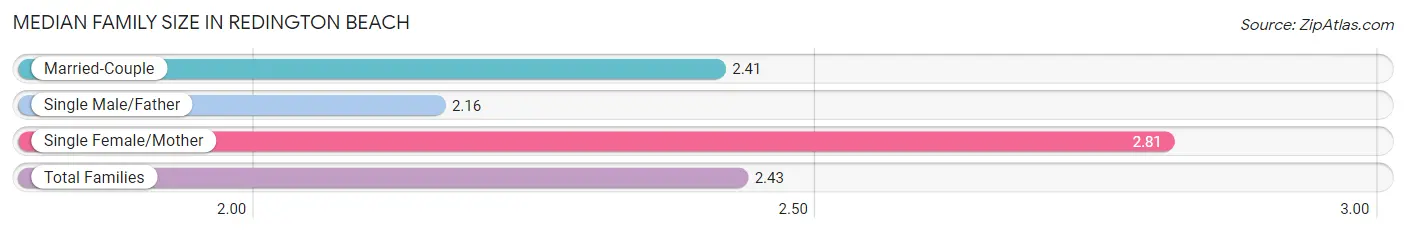
| Family Type | # Families | Family Size |
| Married-Couple | 415 (89.2%) | 2.41 |
| Single Male/Father | 19 (4.1%) | 2.16 |
| Single Female/Mother | 31 (6.7%) | 2.81 |
| Total Families | 465 (100.0%) | 2.43 |
Median Household Size in Redington Beach
The median household size in Redington Beach is 2.12 persons per household, with single female/mother households (31 | 5.0%) accounting for the largest median household size of 3.03 persons per household. non-family households (159 | 25.5%) represent the smallest median household size with 1.13 persons per household.
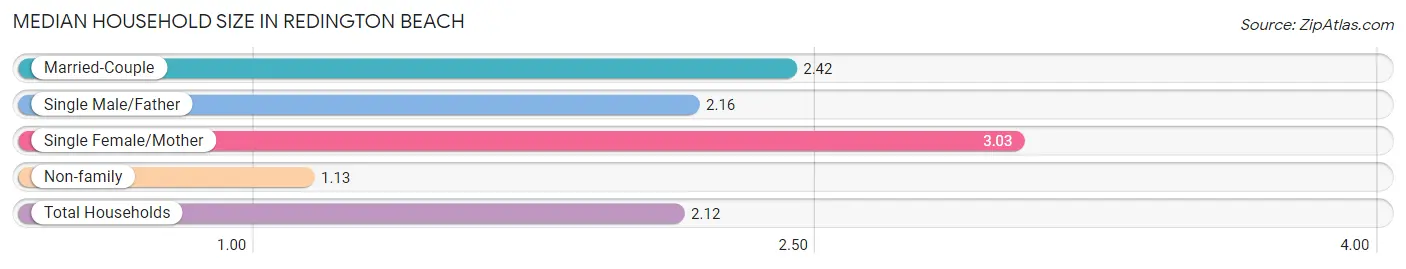
| Household Type | # Households | Household Size |
| Married-Couple | 415 (66.5%) | 2.42 |
| Single Male/Father | 19 (3.0%) | 2.16 |
| Single Female/Mother | 31 (5.0%) | 3.03 |
| Non-family | 159 (25.5%) | 1.13 |
| Total Households | 624 (100.0%) | 2.12 |
Household Size by Marriage Status in Redington Beach
Out of a total of 624 households in Redington Beach, 465 (74.5%) are family households, while 159 (25.5%) are nonfamily households. The most numerous type of family households are 2-person households, comprising 339, and the most common type of nonfamily households are 1-person households, comprising 136.
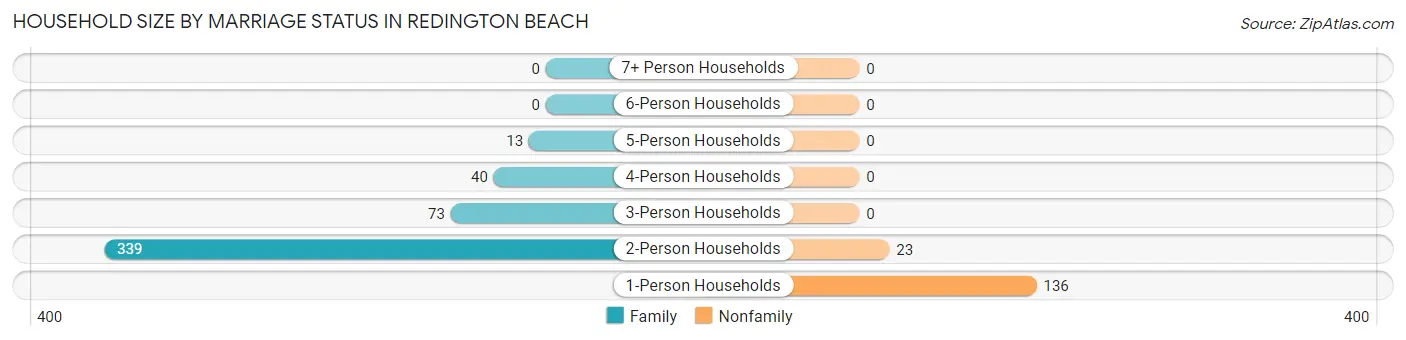
| Household Size | Family Households | Nonfamily Households |
| 1-Person Households | - | 136 (21.8%) |
| 2-Person Households | 339 (54.3%) | 23 (3.7%) |
| 3-Person Households | 73 (11.7%) | 0 (0.0%) |
| 4-Person Households | 40 (6.4%) | 0 (0.0%) |
| 5-Person Households | 13 (2.1%) | 0 (0.0%) |
| 6-Person Households | 0 (0.0%) | 0 (0.0%) |
| 7+ Person Households | 0 (0.0%) | 0 (0.0%) |
| Total | 465 (74.5%) | 159 (25.5%) |
Female Fertility in Redington Beach
Fertility by Age in Redington Beach
| Age Bracket | Women with Births | Births / 1,000 Women |
| 15 to 19 years | 0 (0.0%) | 0.0 |
| 20 to 34 years | 0 (0.0%) | 0.0 |
| 35 to 50 years | 0 (0.0%) | 0.0 |
| Total | 0 (0.0%) | 0.0 |
Fertility by Age by Marriage Status in Redington Beach
| Age Bracket | Married | Unmarried |
| 15 to 19 years | 0 (0.0%) | 0 (0.0%) |
| 20 to 34 years | 0 (0.0%) | 0 (0.0%) |
| 35 to 50 years | 0 (0.0%) | 0 (0.0%) |
| Total | 0 (0.0%) | 0 (0.0%) |
Fertility by Education in Redington Beach
| Educational Attainment | Women with Births | Births / 1,000 Women |
| Less than High School | 0 (0.0%) | 0.0 |
| High School Diploma | 0 (0.0%) | 0.0 |
| College or Associate's Degree | 0 (0.0%) | 0.0 |
| Bachelor's Degree | 0 (0.0%) | 0.0 |
| Graduate Degree | 0 (0.0%) | 0.0 |
| Total | 0 (0.0%) | 0.0 |
Fertility by Education by Marriage Status in Redington Beach
| Educational Attainment | Married | Unmarried |
| Less than High School | 0 (0.0%) | 0 (0.0%) |
| High School Diploma | 0 (0.0%) | 0 (0.0%) |
| College or Associate's Degree | 0 (0.0%) | 0 (0.0%) |
| Bachelor's Degree | 0 (0.0%) | 0 (0.0%) |
| Graduate Degree | 0 (0.0%) | 0 (0.0%) |
| Total | 0 (0.0%) | 0 (0.0%) |
Employment Characteristics in Redington Beach
Employment by Class of Employer in Redington Beach
Among the 610 employed individuals in Redington Beach, private company employees (393 | 64.4%), self-employed (incorporated) (92 | 15.1%), and self-employed (not incorporated) (41 | 6.7%) make up the most common classes of employment.
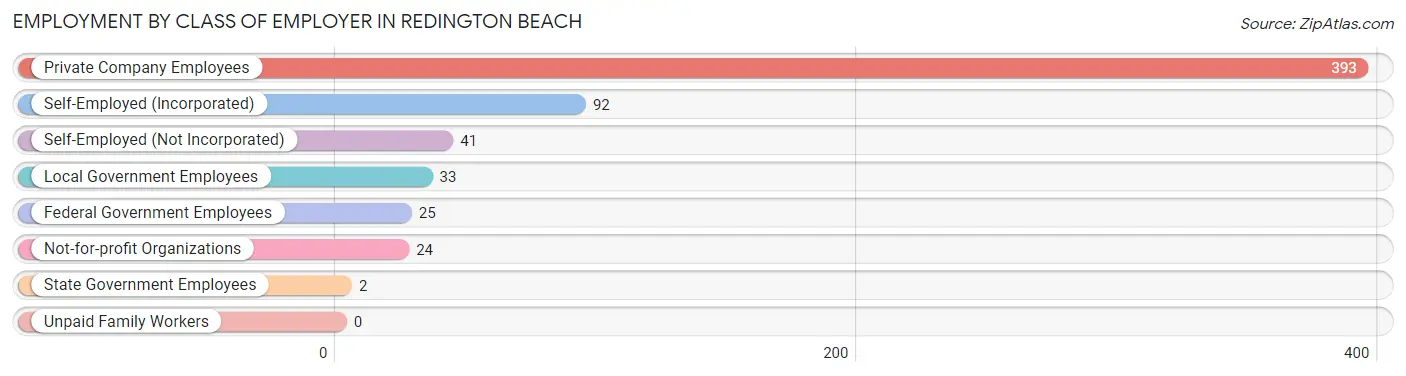
| Employer Class | # Employees | % Employees |
| Private Company Employees | 393 | 64.4% |
| Self-Employed (Incorporated) | 92 | 15.1% |
| Self-Employed (Not Incorporated) | 41 | 6.7% |
| Not-for-profit Organizations | 24 | 3.9% |
| Local Government Employees | 33 | 5.4% |
| State Government Employees | 2 | 0.3% |
| Federal Government Employees | 25 | 4.1% |
| Unpaid Family Workers | 0 | 0.0% |
| Total | 610 | 100.0% |
Employment Status by Age in Redington Beach
According to the labor force statistics for Redington Beach, out of the total population over 16 years of age (1,218), 52.4% or 638 individuals are in the labor force, with 3.3% or 21 of them unemployed. The age group with the highest labor force participation rate is 30 to 34 years, with 100.0% or 7 individuals in the labor force. Within the labor force, the 20 to 24 years age range has the highest percentage of unemployed individuals, with 30.8% or 4 of them being unemployed.
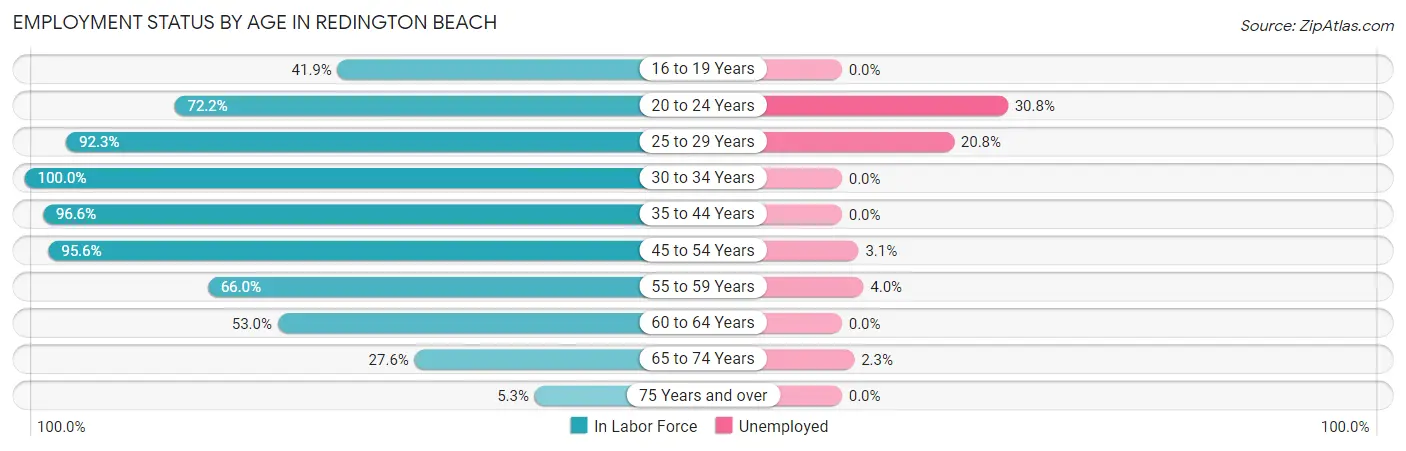
| Age Bracket | In Labor Force | Unemployed |
| 16 to 19 Years | 31 (41.9%) | 0 (0.0%) |
| 20 to 24 Years | 13 (72.2%) | 4 (30.8%) |
| 25 to 29 Years | 24 (92.3%) | 5 (20.8%) |
| 30 to 34 Years | 7 (100.0%) | 0 (0.0%) |
| 35 to 44 Years | 84 (96.6%) | 0 (0.0%) |
| 45 to 54 Years | 195 (95.6%) | 6 (3.1%) |
| 55 to 59 Years | 99 (66.0%) | 4 (4.0%) |
| 60 to 64 Years | 89 (53.0%) | 0 (0.0%) |
| 65 to 74 Years | 87 (27.6%) | 2 (2.3%) |
| 75 Years and over | 9 (5.3%) | 0 (0.0%) |
| Total | 638 (52.4%) | 21 (3.3%) |
Employment Status by Educational Attainment in Redington Beach
According to labor force statistics for Redington Beach, 77.6% of individuals (498) out of the total population between 25 and 64 years of age (642) are in the labor force, with 3.0% or 15 of them being unemployed. The group with the highest labor force participation rate are those with the educational attainment of bachelor's degree or higher, with 80.3% or 244 individuals in the labor force. Within the labor force, individuals with college / associate degree education have the highest percentage of unemployment, with 5.9% or 11 of them being unemployed.
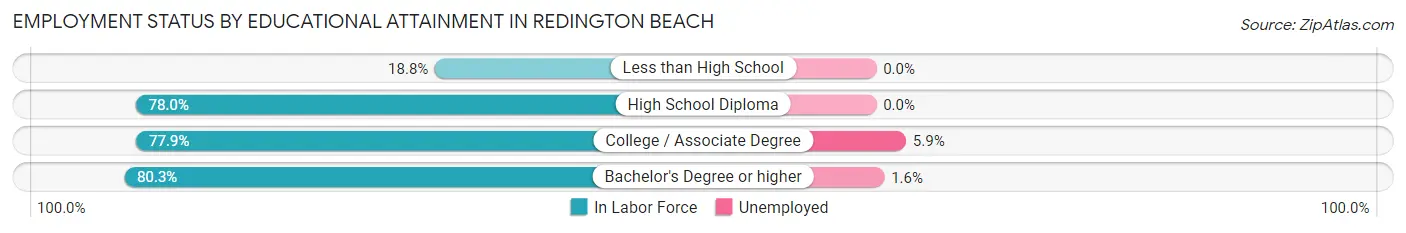
| Educational Attainment | In Labor Force | Unemployed |
| Less than High School | 3 (18.8%) | 0 (0.0%) |
| High School Diploma | 64 (78.0%) | 0 (0.0%) |
| College / Associate Degree | 187 (77.9%) | 14 (5.9%) |
| Bachelor's Degree or higher | 244 (80.3%) | 5 (1.6%) |
| Total | 498 (77.6%) | 19 (3.0%) |
Employment Occupations by Sex in Redington Beach
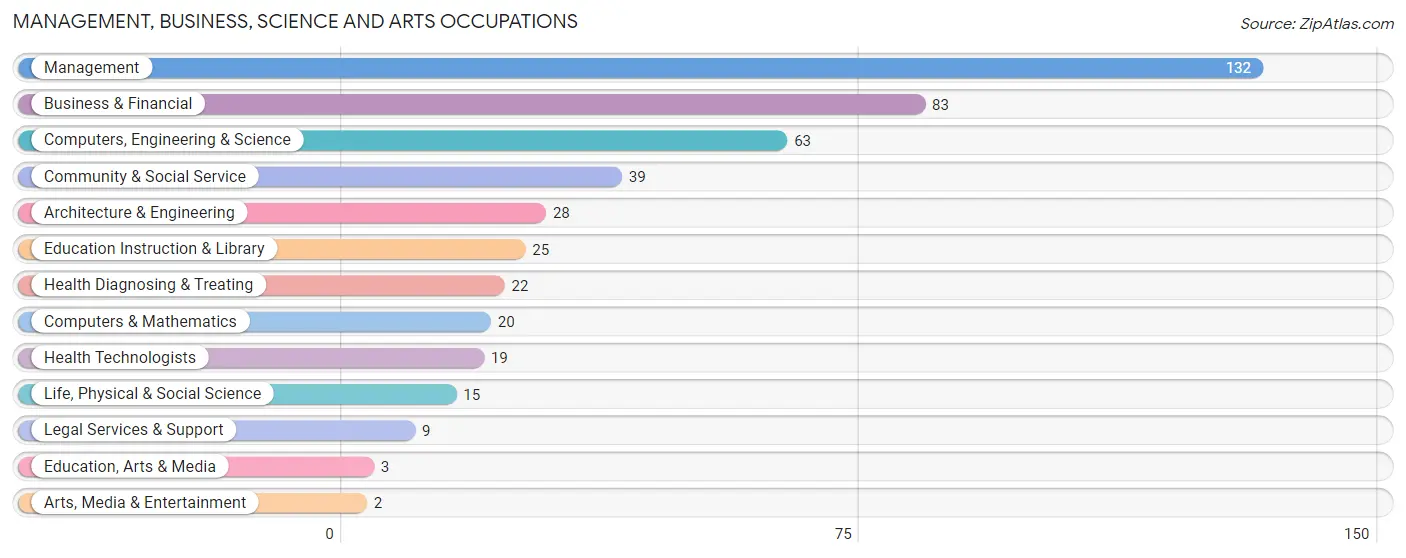
Management, Business, Science and Arts Occupations
The most common Management, Business, Science and Arts occupations in Redington Beach are Management (132 | 21.4%), Business & Financial (83 | 13.5%), Computers, Engineering & Science (63 | 10.2%), Community & Social Service (39 | 6.3%), and Architecture & Engineering (28 | 4.5%).
Management, Business, Science and Arts Occupations by Sex
Within the Management, Business, Science and Arts occupations in Redington Beach, the most male-oriented occupations are Arts, Media & Entertainment (100.0%), Computers & Mathematics (90.0%), and Architecture & Engineering (89.3%), while the most female-oriented occupations are Education, Arts & Media (100.0%), Health Diagnosing & Treating (81.8%), and Health Technologists (78.9%).
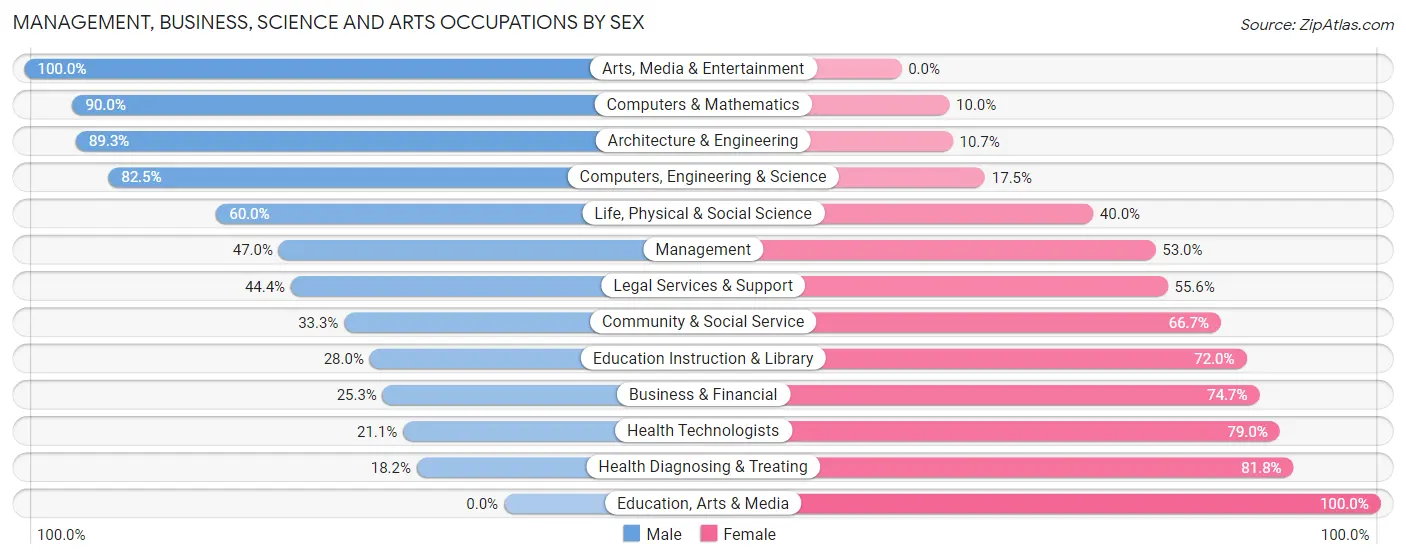
| Occupation | Male | Female |
| Management | 62 (47.0%) | 70 (53.0%) |
| Business & Financial | 21 (25.3%) | 62 (74.7%) |
| Computers, Engineering & Science | 52 (82.5%) | 11 (17.5%) |
| Computers & Mathematics | 18 (90.0%) | 2 (10.0%) |
| Architecture & Engineering | 25 (89.3%) | 3 (10.7%) |
| Life, Physical & Social Science | 9 (60.0%) | 6 (40.0%) |
| Community & Social Service | 13 (33.3%) | 26 (66.7%) |
| Education, Arts & Media | 0 (0.0%) | 3 (100.0%) |
| Legal Services & Support | 4 (44.4%) | 5 (55.6%) |
| Education Instruction & Library | 7 (28.0%) | 18 (72.0%) |
| Arts, Media & Entertainment | 2 (100.0%) | 0 (0.0%) |
| Health Diagnosing & Treating | 4 (18.2%) | 18 (81.8%) |
| Health Technologists | 4 (21.0%) | 15 (78.9%) |
| Total (Category) | 152 (44.8%) | 187 (55.2%) |
| Total (Overall) | 319 (51.7%) | 298 (48.3%) |
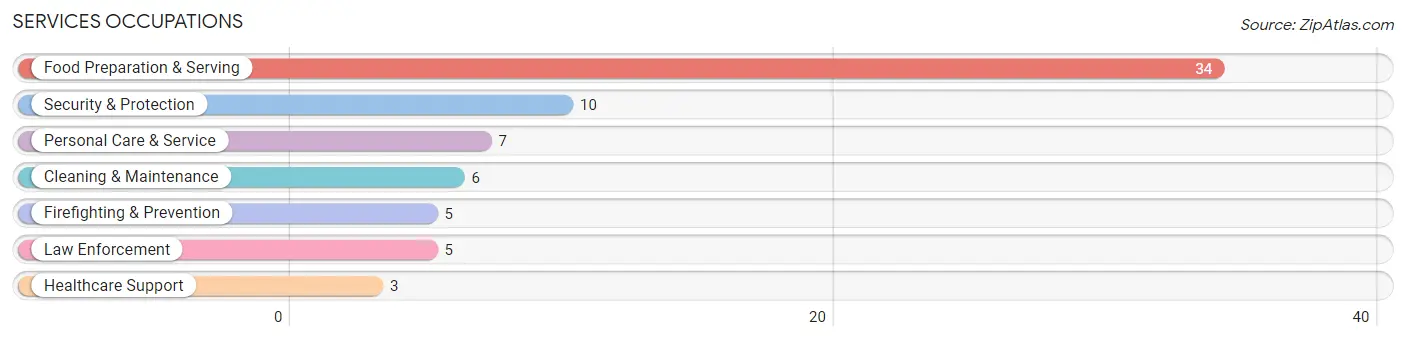
Services Occupations
The most common Services occupations in Redington Beach are Food Preparation & Serving (34 | 5.5%), Security & Protection (10 | 1.6%), Personal Care & Service (7 | 1.1%), Cleaning & Maintenance (6 | 1.0%), and Firefighting & Prevention (5 | 0.8%).
Services Occupations by Sex
Within the Services occupations in Redington Beach, the most male-oriented occupations are Security & Protection (100.0%), Firefighting & Prevention (100.0%), and Law Enforcement (100.0%), while the most female-oriented occupations are Healthcare Support (100.0%), Cleaning & Maintenance (100.0%), and Personal Care & Service (100.0%).
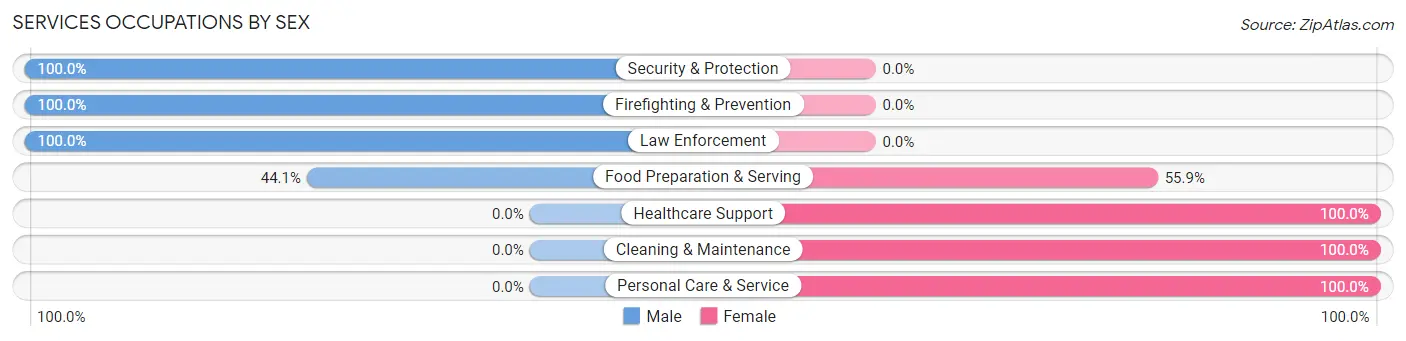
| Occupation | Male | Female |
| Healthcare Support | 0 (0.0%) | 3 (100.0%) |
| Security & Protection | 10 (100.0%) | 0 (0.0%) |
| Firefighting & Prevention | 5 (100.0%) | 0 (0.0%) |
| Law Enforcement | 5 (100.0%) | 0 (0.0%) |
| Food Preparation & Serving | 15 (44.1%) | 19 (55.9%) |
| Cleaning & Maintenance | 0 (0.0%) | 6 (100.0%) |
| Personal Care & Service | 0 (0.0%) | 7 (100.0%) |
| Total (Category) | 25 (41.7%) | 35 (58.3%) |
| Total (Overall) | 319 (51.7%) | 298 (48.3%) |
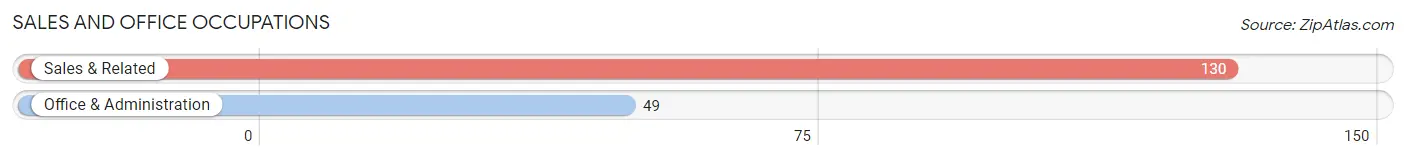
Sales and Office Occupations
The most common Sales and Office occupations in Redington Beach are Sales & Related (130 | 21.1%), and Office & Administration (49 | 7.9%).
Sales and Office Occupations by Sex
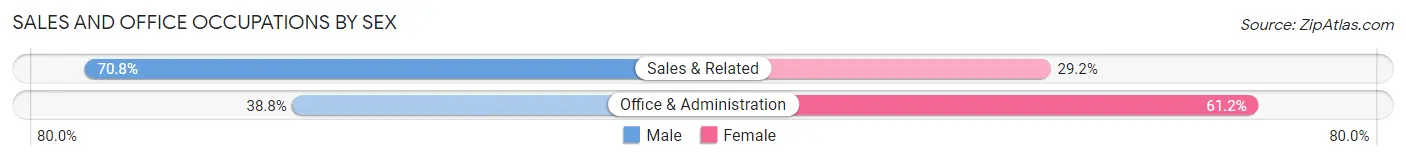
| Occupation | Male | Female |
| Sales & Related | 92 (70.8%) | 38 (29.2%) |
| Office & Administration | 19 (38.8%) | 30 (61.2%) |
| Total (Category) | 111 (62.0%) | 68 (38.0%) |
| Total (Overall) | 319 (51.7%) | 298 (48.3%) |
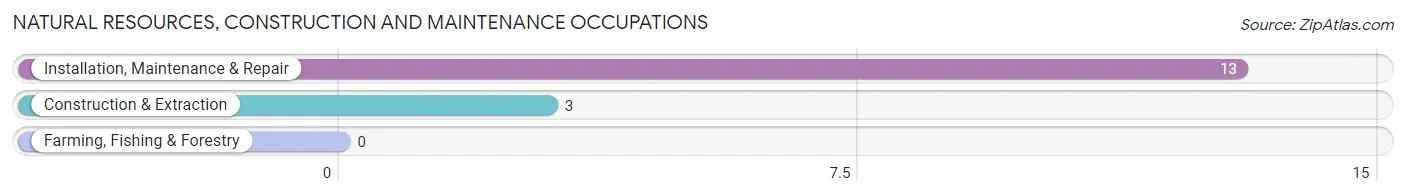
Natural Resources, Construction and Maintenance Occupations
The most common Natural Resources, Construction and Maintenance occupations in Redington Beach are Installation, Maintenance & Repair (13 | 2.1%), and Construction & Extraction (3 | 0.5%).
Natural Resources, Construction and Maintenance Occupations by Sex
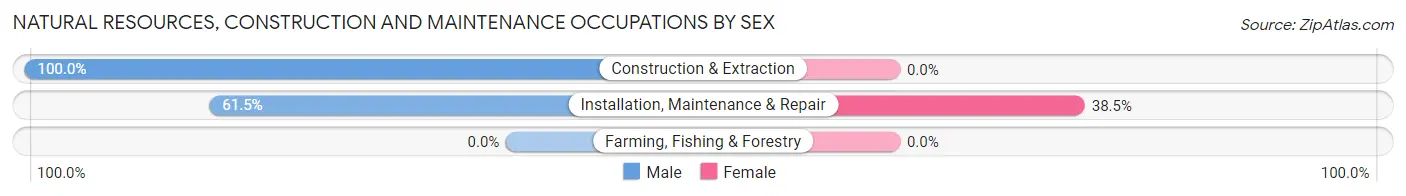
| Occupation | Male | Female |
| Farming, Fishing & Forestry | 0 (0.0%) | 0 (0.0%) |
| Construction & Extraction | 3 (100.0%) | 0 (0.0%) |
| Installation, Maintenance & Repair | 8 (61.5%) | 5 (38.5%) |
| Total (Category) | 11 (68.8%) | 5 (31.2%) |
| Total (Overall) | 319 (51.7%) | 298 (48.3%) |
Production, Transportation and Moving Occupations
The most common Production, Transportation and Moving occupations in Redington Beach are Material Moving (9 | 1.5%), Production (7 | 1.1%), and Transportation (7 | 1.1%).
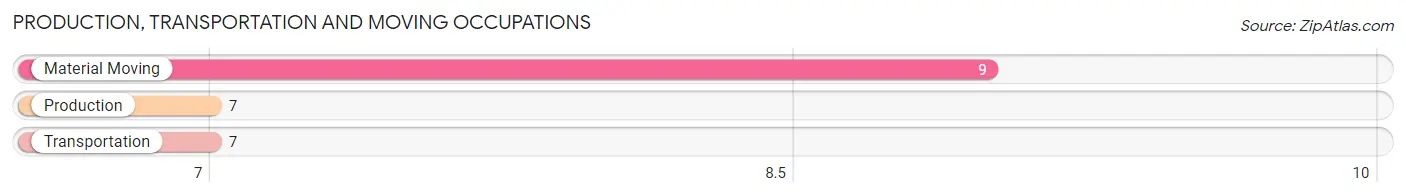
Production, Transportation and Moving Occupations by Sex
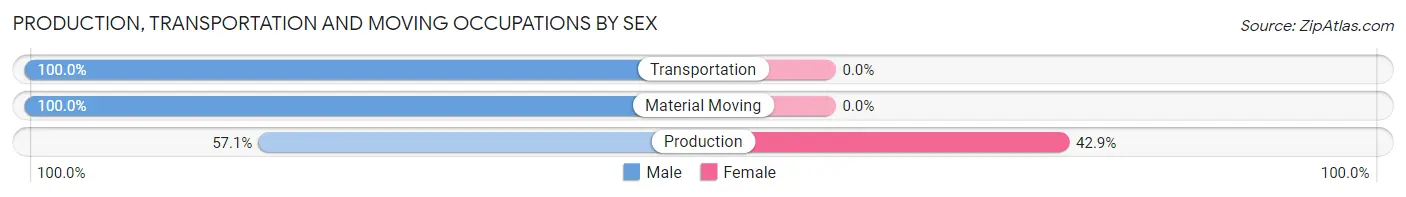
| Occupation | Male | Female |
| Production | 4 (57.1%) | 3 (42.9%) |
| Transportation | 7 (100.0%) | 0 (0.0%) |
| Material Moving | 9 (100.0%) | 0 (0.0%) |
| Total (Category) | 20 (87.0%) | 3 (13.0%) |
| Total (Overall) | 319 (51.7%) | 298 (48.3%) |
Employment Industries by Sex in Redington Beach
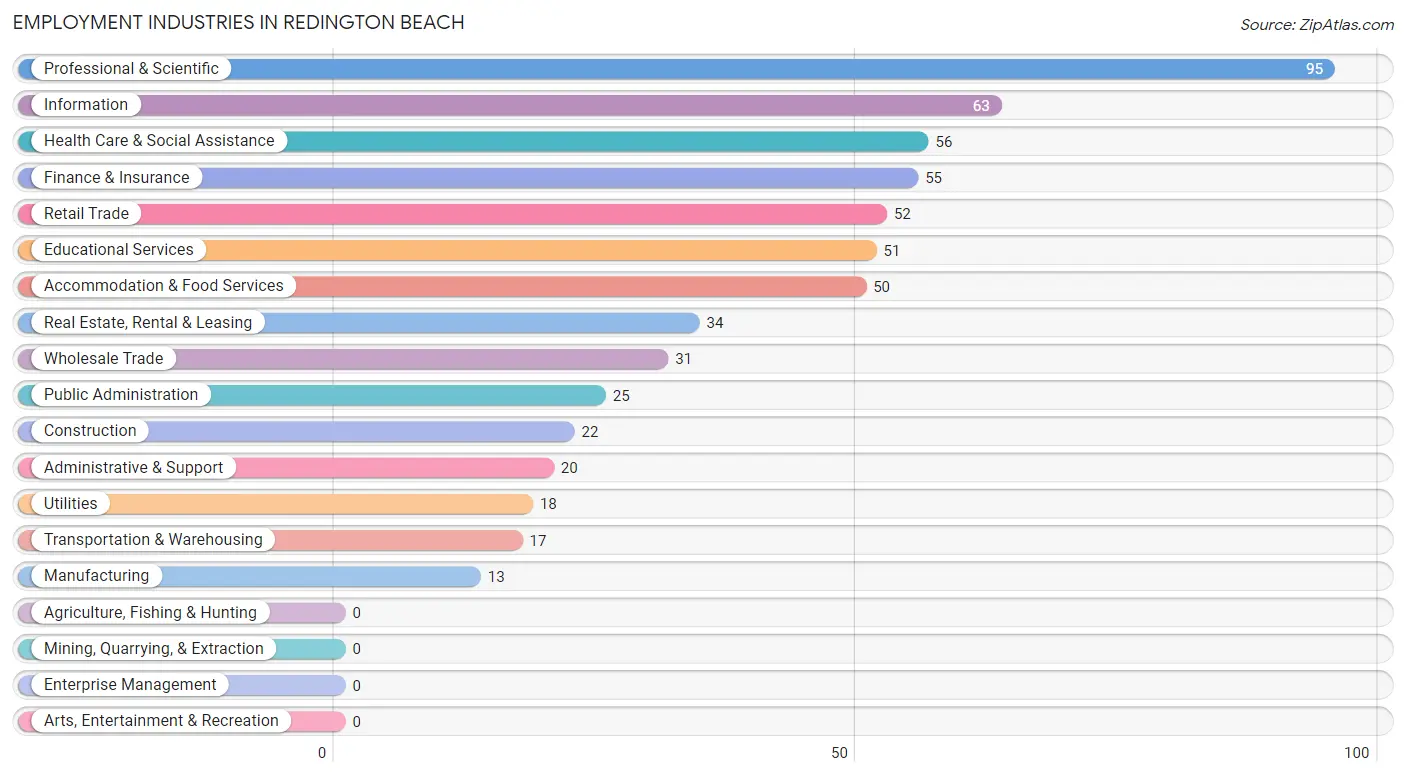
Employment Industries in Redington Beach
The major employment industries in Redington Beach include Professional & Scientific (95 | 15.4%), Information (63 | 10.2%), Health Care & Social Assistance (56 | 9.1%), Finance & Insurance (55 | 8.9%), and Retail Trade (52 | 8.4%).
Employment Industries by Sex in Redington Beach
The Redington Beach industries that see more men than women are Utilities (100.0%), Transportation & Warehousing (88.2%), and Construction (72.7%), whereas the industries that tend to have a higher number of women are Educational Services (72.6%), Accommodation & Food Services (70.0%), and Finance & Insurance (65.4%).
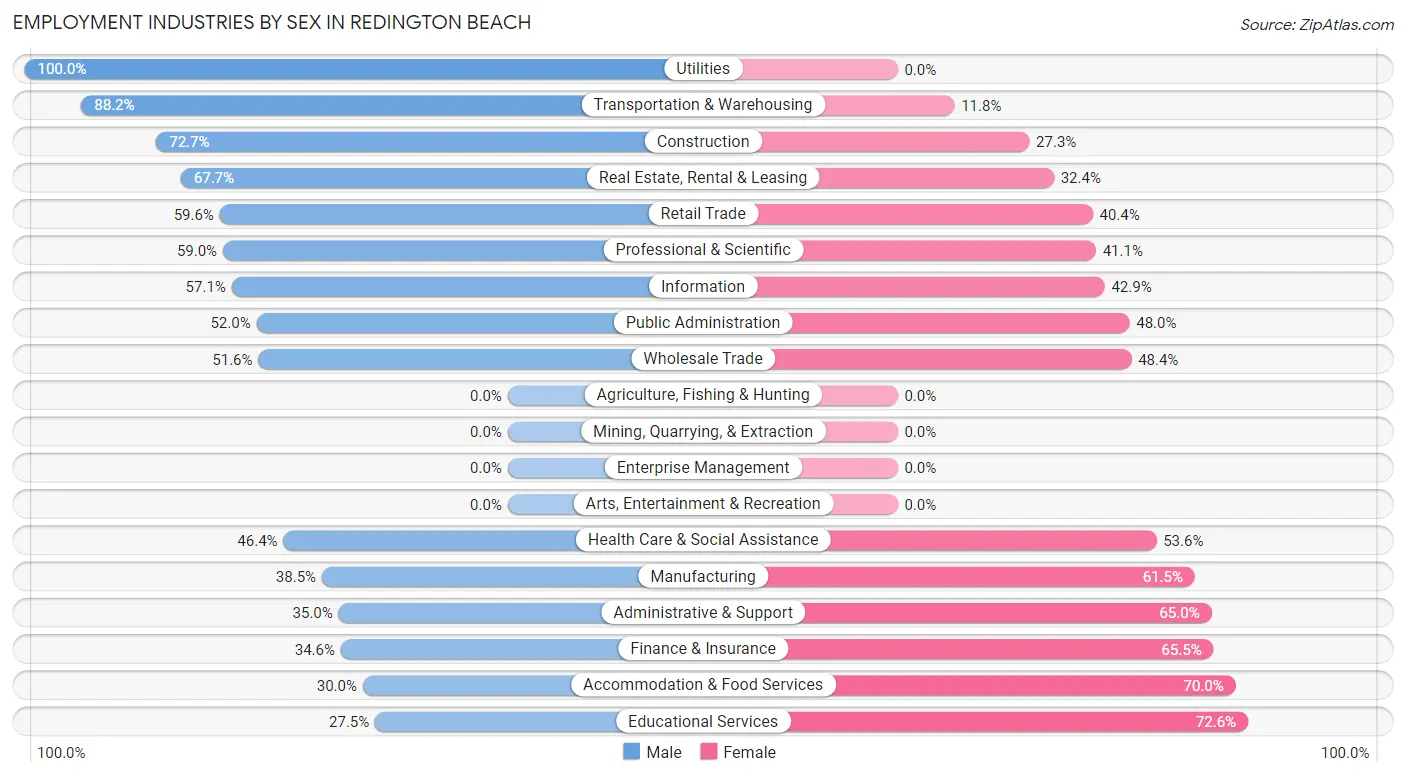
| Industry | Male | Female |
| Agriculture, Fishing & Hunting | 0 (0.0%) | 0 (0.0%) |
| Mining, Quarrying, & Extraction | 0 (0.0%) | 0 (0.0%) |
| Construction | 16 (72.7%) | 6 (27.3%) |
| Manufacturing | 5 (38.5%) | 8 (61.5%) |
| Wholesale Trade | 16 (51.6%) | 15 (48.4%) |
| Retail Trade | 31 (59.6%) | 21 (40.4%) |
| Transportation & Warehousing | 15 (88.2%) | 2 (11.8%) |
| Utilities | 18 (100.0%) | 0 (0.0%) |
| Information | 36 (57.1%) | 27 (42.9%) |
| Finance & Insurance | 19 (34.5%) | 36 (65.4%) |
| Real Estate, Rental & Leasing | 23 (67.6%) | 11 (32.4%) |
| Professional & Scientific | 56 (59.0%) | 39 (41.0%) |
| Enterprise Management | 0 (0.0%) | 0 (0.0%) |
| Administrative & Support | 7 (35.0%) | 13 (65.0%) |
| Educational Services | 14 (27.5%) | 37 (72.6%) |
| Health Care & Social Assistance | 26 (46.4%) | 30 (53.6%) |
| Arts, Entertainment & Recreation | 0 (0.0%) | 0 (0.0%) |
| Accommodation & Food Services | 15 (30.0%) | 35 (70.0%) |
| Public Administration | 13 (52.0%) | 12 (48.0%) |
| Total | 319 (51.7%) | 298 (48.3%) |
Education in Redington Beach
School Enrollment in Redington Beach
The most common levels of schooling among the 205 students in Redington Beach are high school (51 | 24.9%), elementary school (49 | 23.9%), and college / undergraduate (42 | 20.5%).
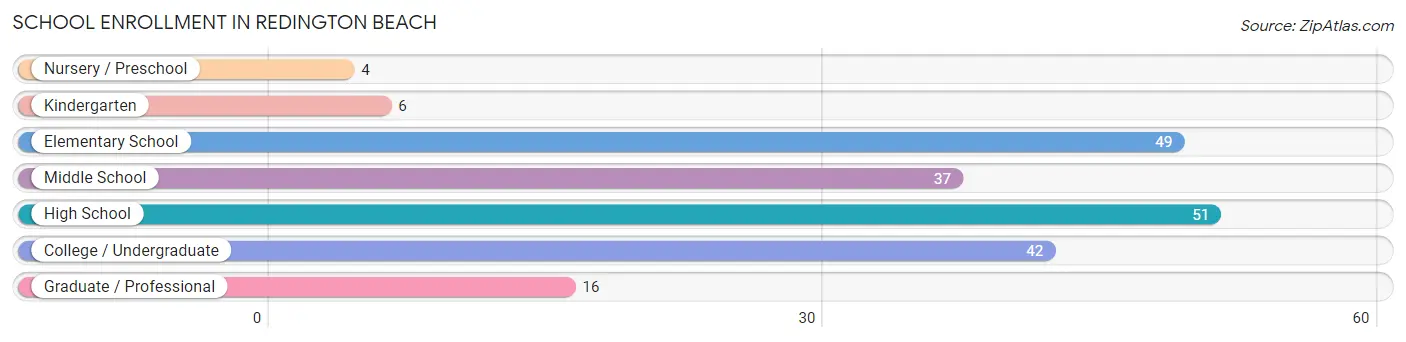
| School Level | # Students | % Students |
| Nursery / Preschool | 4 | 1.9% |
| Kindergarten | 6 | 2.9% |
| Elementary School | 49 | 23.9% |
| Middle School | 37 | 18.0% |
| High School | 51 | 24.9% |
| College / Undergraduate | 42 | 20.5% |
| Graduate / Professional | 16 | 7.8% |
| Total | 205 | 100.0% |
School Enrollment by Age by Funding Source in Redington Beach
Out of a total of 205 students who are enrolled in schools in Redington Beach, 45 (22.0%) attend a private institution, while the remaining 160 (78.0%) are enrolled in public schools. The age group of 20 to 24 year olds has the highest likelihood of being enrolled in private schools, with 5 (55.6% in the age bracket) enrolled. Conversely, the age group of 3 to 4 year olds has the lowest likelihood of being enrolled in a private school, with 4 (100.0% in the age bracket) attending a public institution.
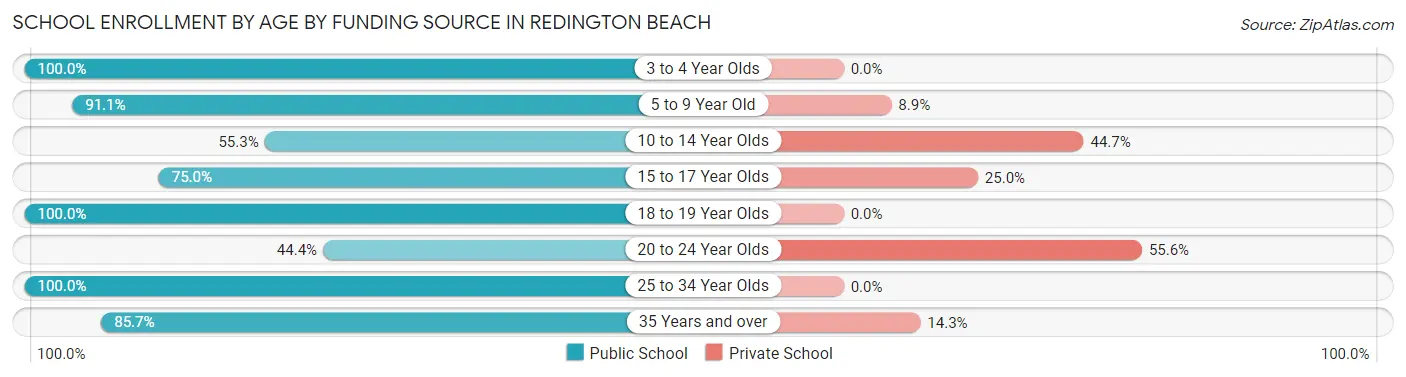
| Age Bracket | Public School | Private School |
| 3 to 4 Year Olds | 4 (100.0%) | 0 (0.0%) |
| 5 to 9 Year Old | 41 (91.1%) | 4 (8.9%) |
| 10 to 14 Year Olds | 26 (55.3%) | 21 (44.7%) |
| 15 to 17 Year Olds | 36 (75.0%) | 12 (25.0%) |
| 18 to 19 Year Olds | 29 (100.0%) | 0 (0.0%) |
| 20 to 24 Year Olds | 4 (44.4%) | 5 (55.6%) |
| 25 to 34 Year Olds | 2 (100.0%) | 0 (0.0%) |
| 35 Years and over | 18 (85.7%) | 3 (14.3%) |
| Total | 160 (78.0%) | 45 (22.0%) |
Educational Attainment by Field of Study in Redington Beach
Business (228 | 34.8%), education (66 | 10.1%), science & technology (56 | 8.5%), social sciences (55 | 8.4%), and engineering (44 | 6.7%) are the most common fields of study among 656 individuals in Redington Beach who have obtained a bachelor's degree or higher.
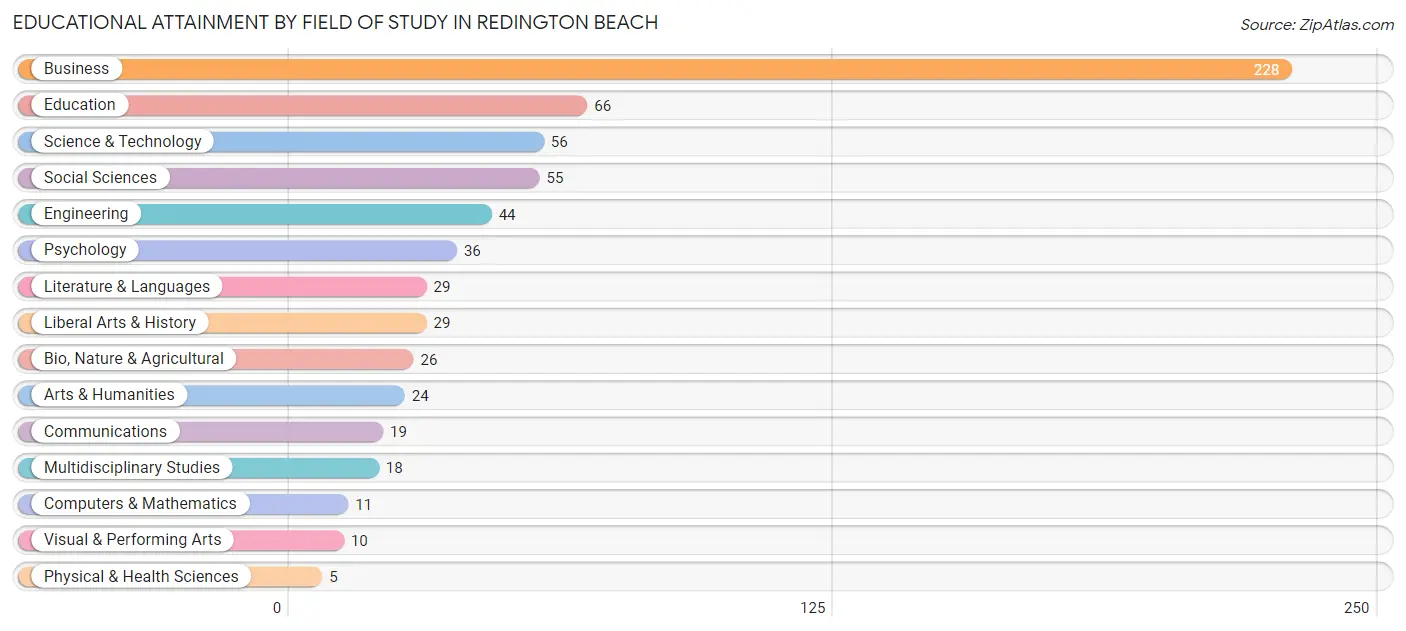
| Field of Study | # Graduates | % Graduates |
| Computers & Mathematics | 11 | 1.7% |
| Bio, Nature & Agricultural | 26 | 4.0% |
| Physical & Health Sciences | 5 | 0.8% |
| Psychology | 36 | 5.5% |
| Social Sciences | 55 | 8.4% |
| Engineering | 44 | 6.7% |
| Multidisciplinary Studies | 18 | 2.7% |
| Science & Technology | 56 | 8.5% |
| Business | 228 | 34.8% |
| Education | 66 | 10.1% |
| Literature & Languages | 29 | 4.4% |
| Liberal Arts & History | 29 | 4.4% |
| Visual & Performing Arts | 10 | 1.5% |
| Communications | 19 | 2.9% |
| Arts & Humanities | 24 | 3.7% |
| Total | 656 | 100.0% |
Transportation & Commute in Redington Beach
Vehicle Availability by Sex in Redington Beach
The most prevalent vehicle ownership categories in Redington Beach are males with 2 vehicles (161, accounting for 51.6%) and females with 2 vehicles (138, making up 54.0%).
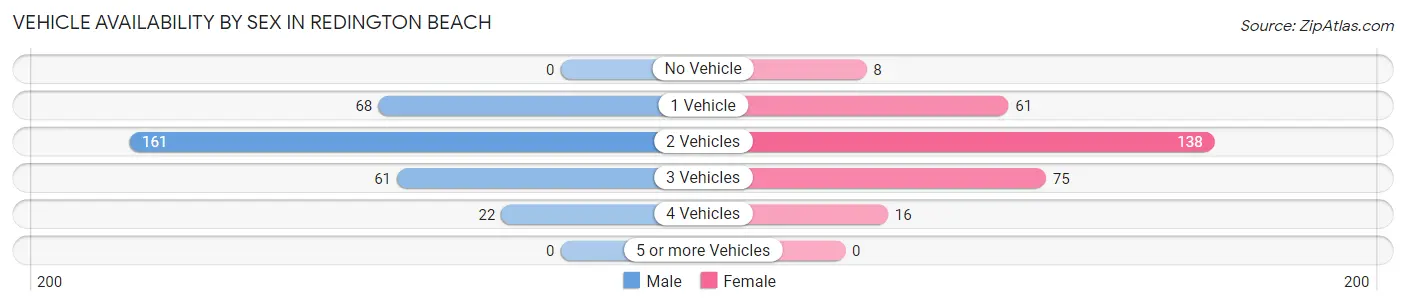
| Vehicles Available | Male | Female |
| No Vehicle | 0 (0.0%) | 8 (2.7%) |
| 1 Vehicle | 68 (21.8%) | 61 (20.5%) |
| 2 Vehicles | 161 (51.6%) | 138 (46.3%) |
| 3 Vehicles | 61 (19.6%) | 75 (25.2%) |
| 4 Vehicles | 22 (7.0%) | 16 (5.4%) |
| 5 or more Vehicles | 0 (0.0%) | 0 (0.0%) |
| Total | 312 (100.0%) | 298 (100.0%) |
Commute Time in Redington Beach
The most frequently occuring commute durations in Redington Beach are 30 to 34 minutes (103 commuters, 25.8%), 5 to 9 minutes (52 commuters, 13.0%), and 15 to 19 minutes (51 commuters, 12.8%).
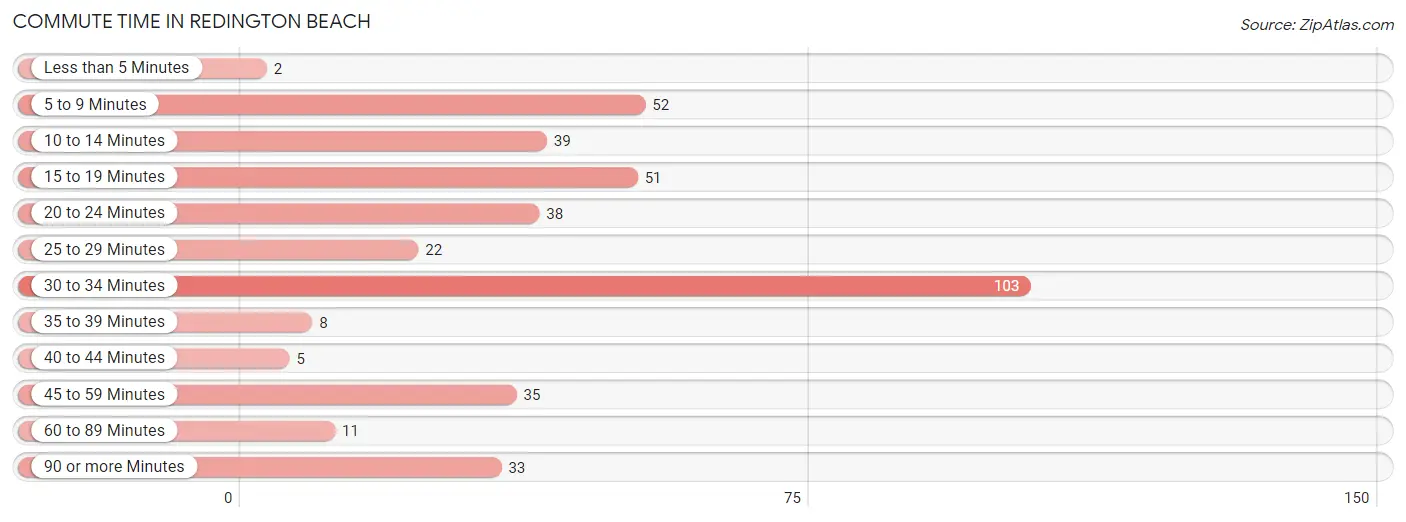
| Commute Time | # Commuters | % Commuters |
| Less than 5 Minutes | 2 | 0.5% |
| 5 to 9 Minutes | 52 | 13.0% |
| 10 to 14 Minutes | 39 | 9.8% |
| 15 to 19 Minutes | 51 | 12.8% |
| 20 to 24 Minutes | 38 | 9.5% |
| 25 to 29 Minutes | 22 | 5.5% |
| 30 to 34 Minutes | 103 | 25.8% |
| 35 to 39 Minutes | 8 | 2.0% |
| 40 to 44 Minutes | 5 | 1.3% |
| 45 to 59 Minutes | 35 | 8.8% |
| 60 to 89 Minutes | 11 | 2.8% |
| 90 or more Minutes | 33 | 8.3% |
Commute Time by Sex in Redington Beach
The most common commute times in Redington Beach are 30 to 34 minutes (55 commuters, 25.8%) for males and 30 to 34 minutes (48 commuters, 25.8%) for females.
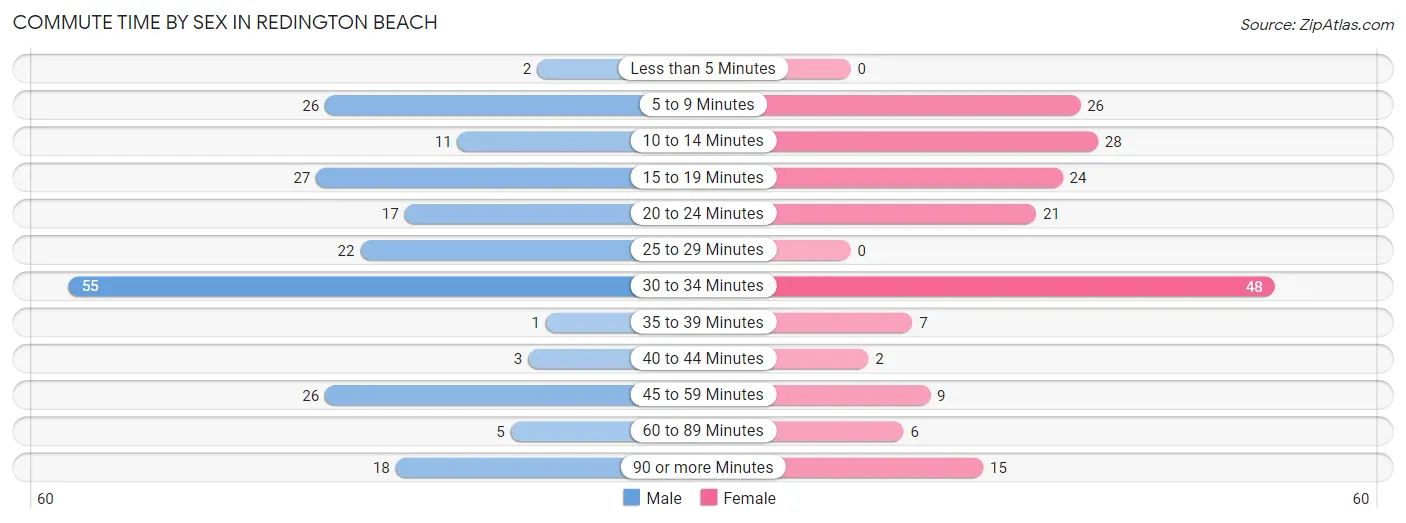
| Commute Time | Male | Female |
| Less than 5 Minutes | 2 (0.9%) | 0 (0.0%) |
| 5 to 9 Minutes | 26 (12.2%) | 26 (14.0%) |
| 10 to 14 Minutes | 11 (5.2%) | 28 (15.0%) |
| 15 to 19 Minutes | 27 (12.7%) | 24 (12.9%) |
| 20 to 24 Minutes | 17 (8.0%) | 21 (11.3%) |
| 25 to 29 Minutes | 22 (10.3%) | 0 (0.0%) |
| 30 to 34 Minutes | 55 (25.8%) | 48 (25.8%) |
| 35 to 39 Minutes | 1 (0.5%) | 7 (3.8%) |
| 40 to 44 Minutes | 3 (1.4%) | 2 (1.1%) |
| 45 to 59 Minutes | 26 (12.2%) | 9 (4.8%) |
| 60 to 89 Minutes | 5 (2.4%) | 6 (3.2%) |
| 90 or more Minutes | 18 (8.5%) | 15 (8.1%) |
Time of Departure to Work by Sex in Redington Beach
The most frequent times of departure to work in Redington Beach are 9:00 AM to 9:59 AM (46, 21.6%) for males and 8:30 AM to 8:59 AM (41, 22.0%) for females.
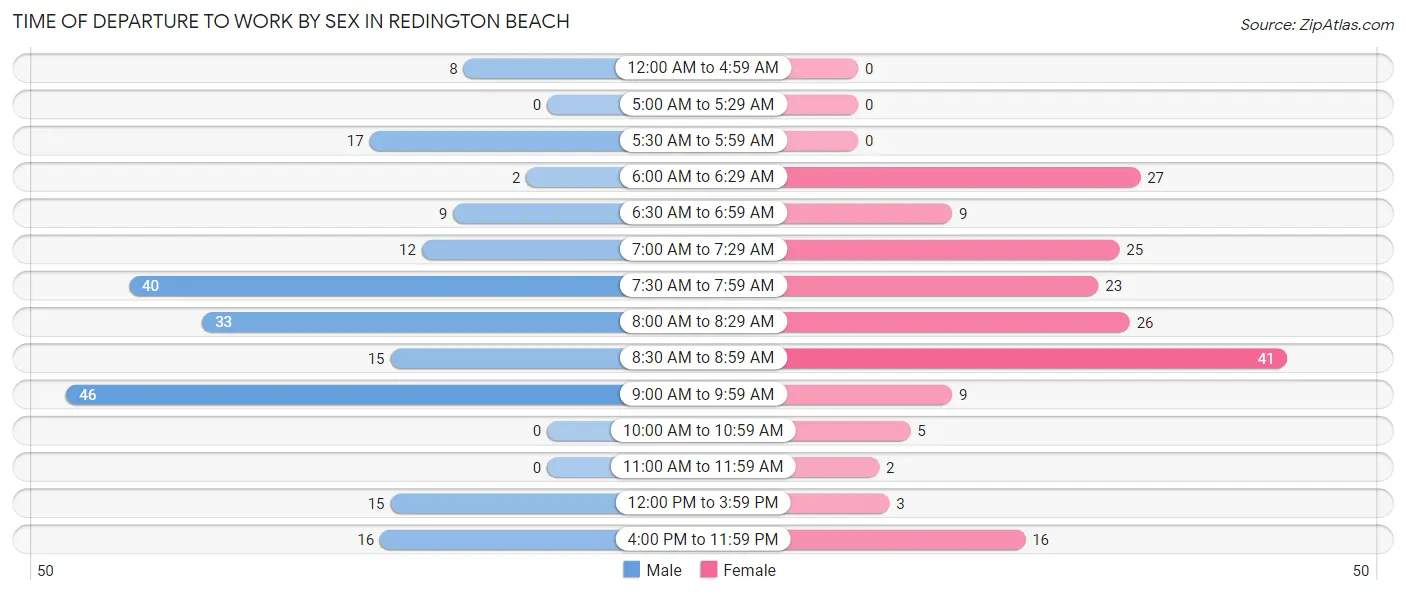
| Time of Departure | Male | Female |
| 12:00 AM to 4:59 AM | 8 (3.8%) | 0 (0.0%) |
| 5:00 AM to 5:29 AM | 0 (0.0%) | 0 (0.0%) |
| 5:30 AM to 5:59 AM | 17 (8.0%) | 0 (0.0%) |
| 6:00 AM to 6:29 AM | 2 (0.9%) | 27 (14.5%) |
| 6:30 AM to 6:59 AM | 9 (4.2%) | 9 (4.8%) |
| 7:00 AM to 7:29 AM | 12 (5.6%) | 25 (13.4%) |
| 7:30 AM to 7:59 AM | 40 (18.8%) | 23 (12.4%) |
| 8:00 AM to 8:29 AM | 33 (15.5%) | 26 (14.0%) |
| 8:30 AM to 8:59 AM | 15 (7.0%) | 41 (22.0%) |
| 9:00 AM to 9:59 AM | 46 (21.6%) | 9 (4.8%) |
| 10:00 AM to 10:59 AM | 0 (0.0%) | 5 (2.7%) |
| 11:00 AM to 11:59 AM | 0 (0.0%) | 2 (1.1%) |
| 12:00 PM to 3:59 PM | 15 (7.0%) | 3 (1.6%) |
| 4:00 PM to 11:59 PM | 16 (7.5%) | 16 (8.6%) |
| Total | 213 (100.0%) | 186 (100.0%) |
Housing Occupancy in Redington Beach
Occupancy by Ownership in Redington Beach
Of the total 624 dwellings in Redington Beach, owner-occupied units account for 578 (92.6%), while renter-occupied units make up 46 (7.4%).
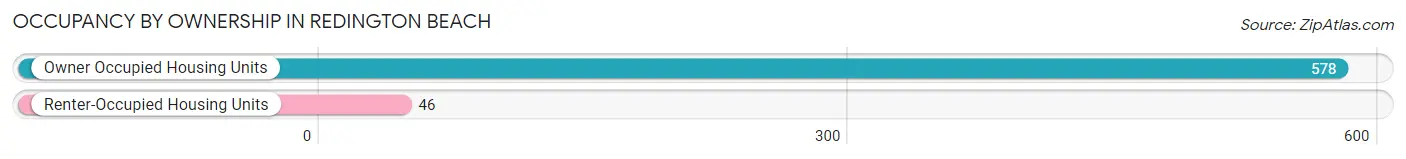
| Occupancy | # Housing Units | % Housing Units |
| Owner Occupied Housing Units | 578 | 92.6% |
| Renter-Occupied Housing Units | 46 | 7.4% |
| Total Occupied Housing Units | 624 | 100.0% |
Occupancy by Household Size in Redington Beach
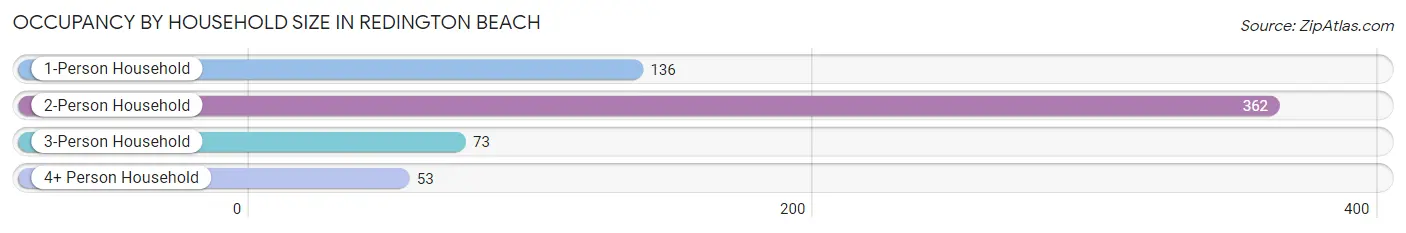
| Household Size | # Housing Units | % Housing Units |
| 1-Person Household | 136 | 21.8% |
| 2-Person Household | 362 | 58.0% |
| 3-Person Household | 73 | 11.7% |
| 4+ Person Household | 53 | 8.5% |
| Total Housing Units | 624 | 100.0% |
Occupancy by Ownership by Household Size in Redington Beach
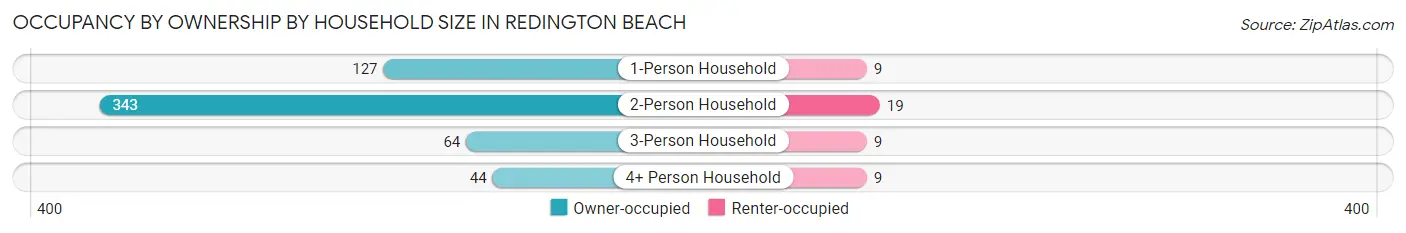
| Household Size | Owner-occupied | Renter-occupied |
| 1-Person Household | 127 (93.4%) | 9 (6.6%) |
| 2-Person Household | 343 (94.8%) | 19 (5.2%) |
| 3-Person Household | 64 (87.7%) | 9 (12.3%) |
| 4+ Person Household | 44 (83.0%) | 9 (17.0%) |
| Total Housing Units | 578 (92.6%) | 46 (7.4%) |
Occupancy by Educational Attainment in Redington Beach
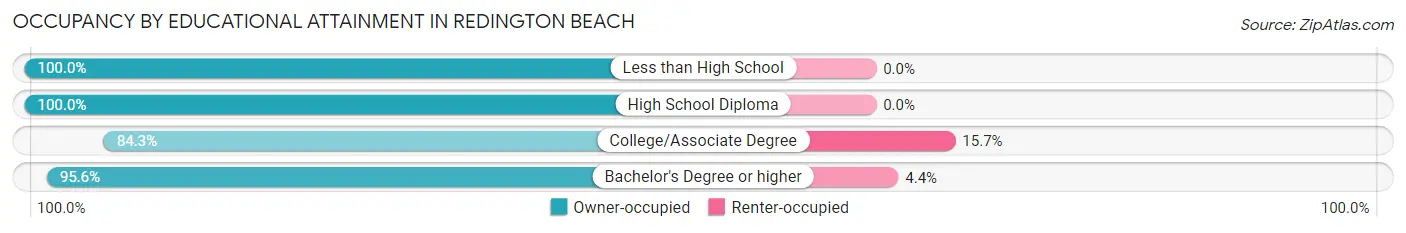
| Household Size | Owner-occupied | Renter-occupied |
| Less than High School | 13 (100.0%) | 0 (0.0%) |
| High School Diploma | 56 (100.0%) | 0 (0.0%) |
| College/Associate Degree | 161 (84.3%) | 30 (15.7%) |
| Bachelor's Degree or higher | 348 (95.6%) | 16 (4.4%) |
Occupancy by Age of Householder in Redington Beach
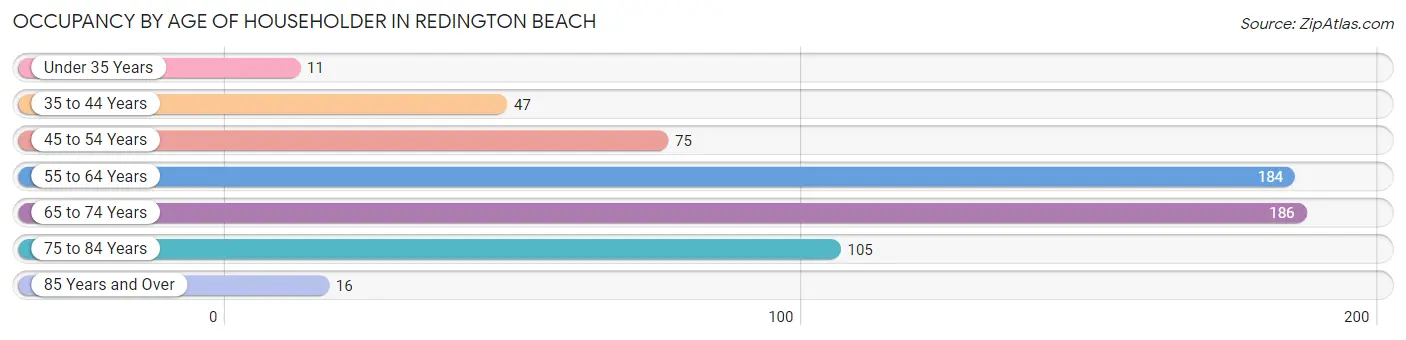
| Age Bracket | # Households | % Households |
| Under 35 Years | 11 | 1.8% |
| 35 to 44 Years | 47 | 7.5% |
| 45 to 54 Years | 75 | 12.0% |
| 55 to 64 Years | 184 | 29.5% |
| 65 to 74 Years | 186 | 29.8% |
| 75 to 84 Years | 105 | 16.8% |
| 85 Years and Over | 16 | 2.6% |
| Total | 624 | 100.0% |
Housing Finances in Redington Beach
Median Income by Occupancy in Redington Beach
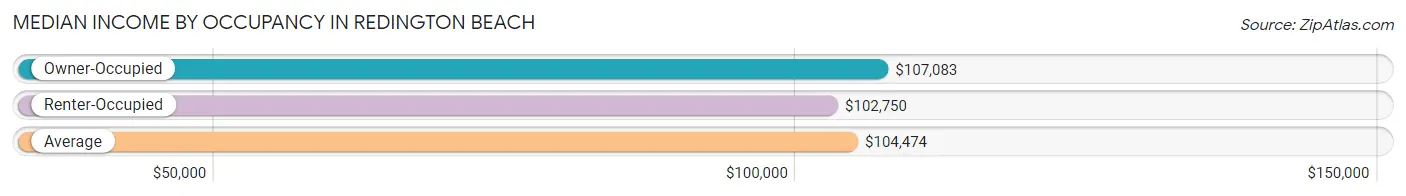
| Occupancy Type | # Households | Median Income |
| Owner-Occupied | 578 (92.6%) | $107,083 |
| Renter-Occupied | 46 (7.4%) | $102,750 |
| Average | 624 (100.0%) | $104,474 |
Occupancy by Householder Income Bracket in Redington Beach
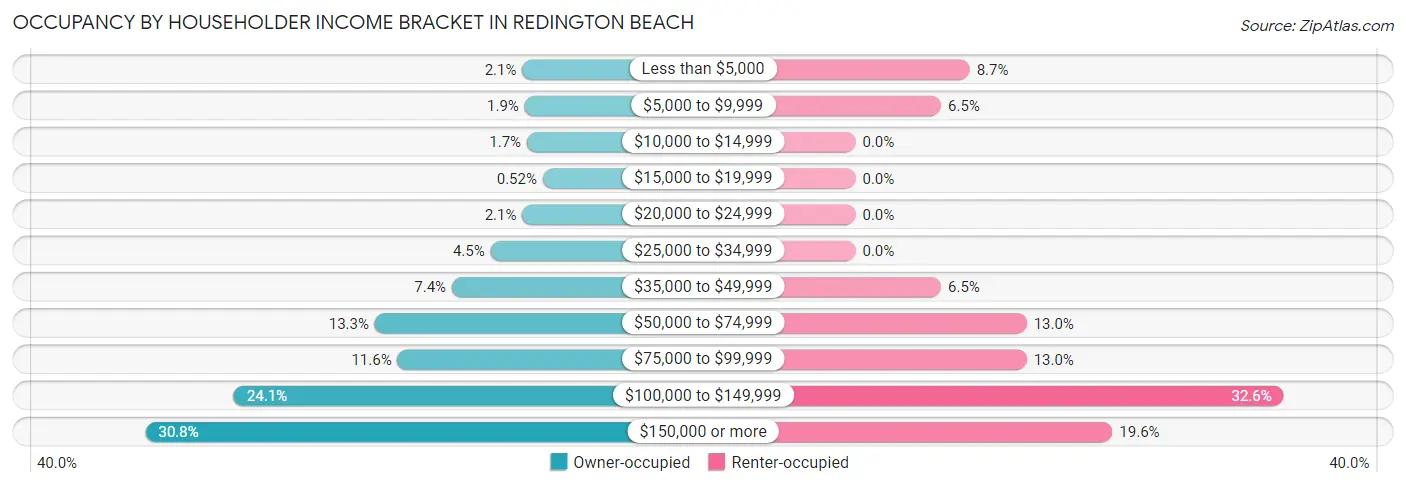
| Income Bracket | Owner-occupied | Renter-occupied |
| Less than $5,000 | 12 (2.1%) | 4 (8.7%) |
| $5,000 to $9,999 | 11 (1.9%) | 3 (6.5%) |
| $10,000 to $14,999 | 10 (1.7%) | 0 (0.0%) |
| $15,000 to $19,999 | 3 (0.5%) | 0 (0.0%) |
| $20,000 to $24,999 | 12 (2.1%) | 0 (0.0%) |
| $25,000 to $34,999 | 26 (4.5%) | 0 (0.0%) |
| $35,000 to $49,999 | 43 (7.4%) | 3 (6.5%) |
| $50,000 to $74,999 | 77 (13.3%) | 6 (13.0%) |
| $75,000 to $99,999 | 67 (11.6%) | 6 (13.0%) |
| $100,000 to $149,999 | 139 (24.0%) | 15 (32.6%) |
| $150,000 or more | 178 (30.8%) | 9 (19.6%) |
| Total | 578 (100.0%) | 46 (100.0%) |
Monthly Housing Cost Tiers in Redington Beach
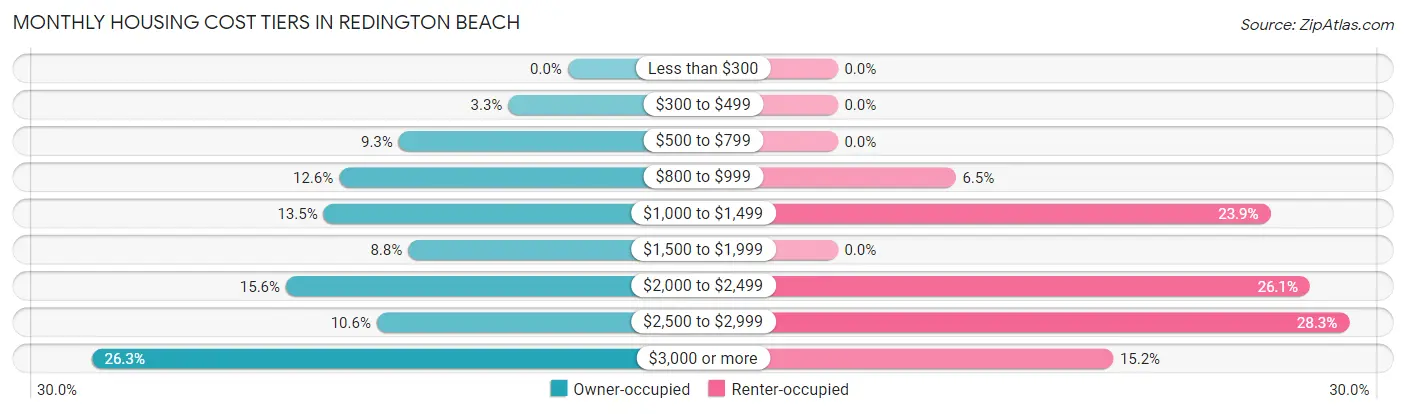
| Monthly Cost | Owner-occupied | Renter-occupied |
| Less than $300 | 0 (0.0%) | 0 (0.0%) |
| $300 to $499 | 19 (3.3%) | 0 (0.0%) |
| $500 to $799 | 54 (9.3%) | 0 (0.0%) |
| $800 to $999 | 73 (12.6%) | 3 (6.5%) |
| $1,000 to $1,499 | 78 (13.5%) | 11 (23.9%) |
| $1,500 to $1,999 | 51 (8.8%) | 0 (0.0%) |
| $2,000 to $2,499 | 90 (15.6%) | 12 (26.1%) |
| $2,500 to $2,999 | 61 (10.5%) | 13 (28.3%) |
| $3,000 or more | 152 (26.3%) | 7 (15.2%) |
| Total | 578 (100.0%) | 46 (100.0%) |
Physical Housing Characteristics in Redington Beach
Housing Structures in Redington Beach
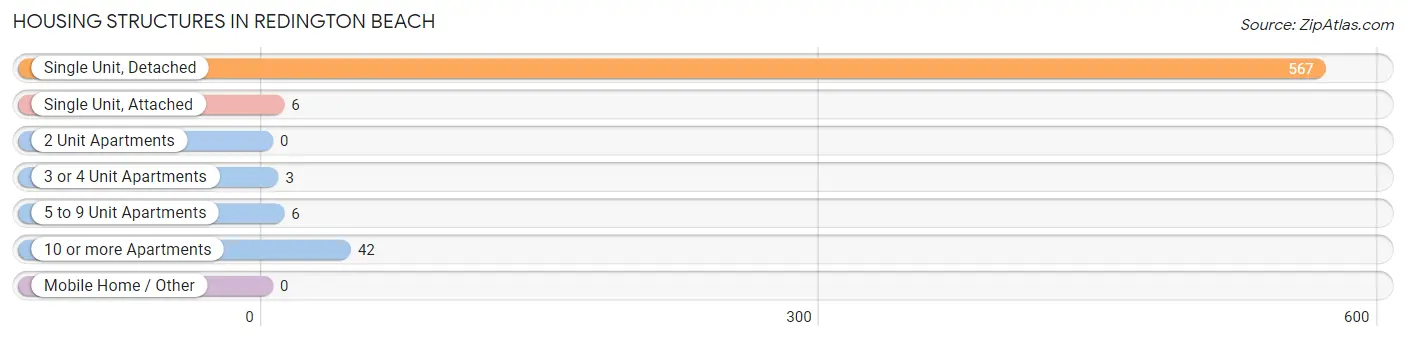
| Structure Type | # Housing Units | % Housing Units |
| Single Unit, Detached | 567 | 90.9% |
| Single Unit, Attached | 6 | 1.0% |
| 2 Unit Apartments | 0 | 0.0% |
| 3 or 4 Unit Apartments | 3 | 0.5% |
| 5 to 9 Unit Apartments | 6 | 1.0% |
| 10 or more Apartments | 42 | 6.7% |
| Mobile Home / Other | 0 | 0.0% |
| Total | 624 | 100.0% |
Housing Structures by Occupancy in Redington Beach
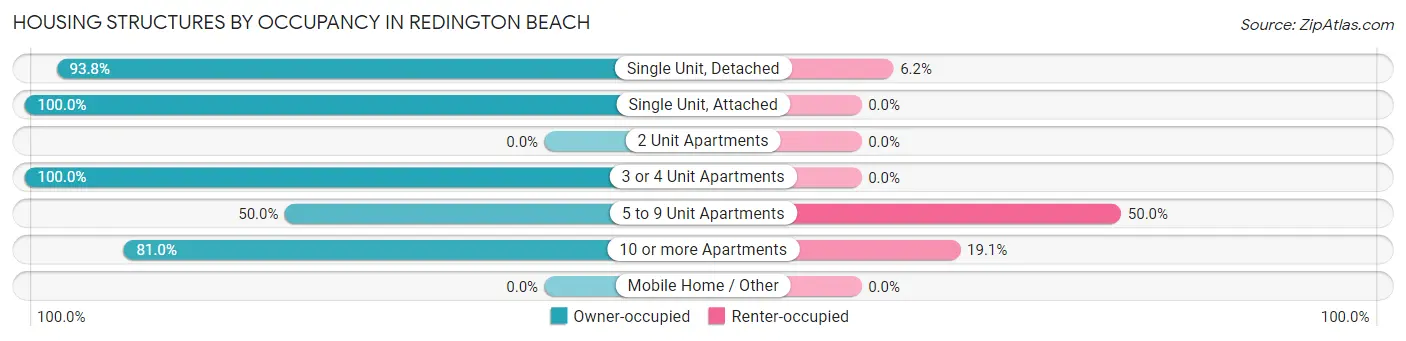
| Structure Type | Owner-occupied | Renter-occupied |
| Single Unit, Detached | 532 (93.8%) | 35 (6.2%) |
| Single Unit, Attached | 6 (100.0%) | 0 (0.0%) |
| 2 Unit Apartments | 0 (0.0%) | 0 (0.0%) |
| 3 or 4 Unit Apartments | 3 (100.0%) | 0 (0.0%) |
| 5 to 9 Unit Apartments | 3 (50.0%) | 3 (50.0%) |
| 10 or more Apartments | 34 (80.9%) | 8 (19.1%) |
| Mobile Home / Other | 0 (0.0%) | 0 (0.0%) |
| Total | 578 (92.6%) | 46 (7.4%) |
Housing Structures by Number of Rooms in Redington Beach
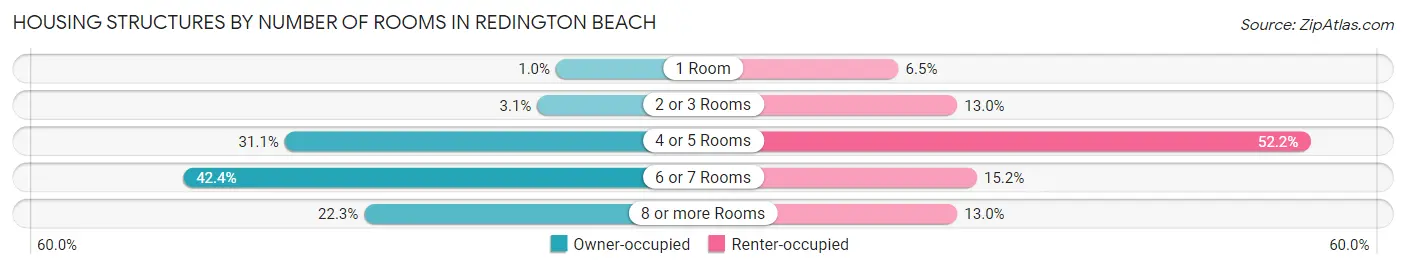
| Number of Rooms | Owner-occupied | Renter-occupied |
| 1 Room | 6 (1.0%) | 3 (6.5%) |
| 2 or 3 Rooms | 18 (3.1%) | 6 (13.0%) |
| 4 or 5 Rooms | 180 (31.1%) | 24 (52.2%) |
| 6 or 7 Rooms | 245 (42.4%) | 7 (15.2%) |
| 8 or more Rooms | 129 (22.3%) | 6 (13.0%) |
| Total | 578 (100.0%) | 46 (100.0%) |
Housing Structure by Heating Type in Redington Beach
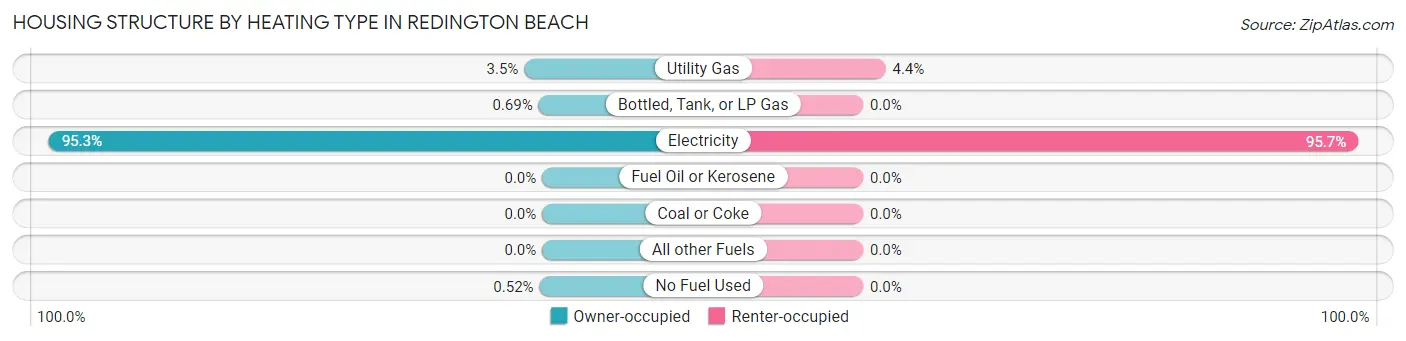
| Heating Type | Owner-occupied | Renter-occupied |
| Utility Gas | 20 (3.5%) | 2 (4.3%) |
| Bottled, Tank, or LP Gas | 4 (0.7%) | 0 (0.0%) |
| Electricity | 551 (95.3%) | 44 (95.7%) |
| Fuel Oil or Kerosene | 0 (0.0%) | 0 (0.0%) |
| Coal or Coke | 0 (0.0%) | 0 (0.0%) |
| All other Fuels | 0 (0.0%) | 0 (0.0%) |
| No Fuel Used | 3 (0.5%) | 0 (0.0%) |
| Total | 578 (100.0%) | 46 (100.0%) |
Household Vehicle Usage in Redington Beach
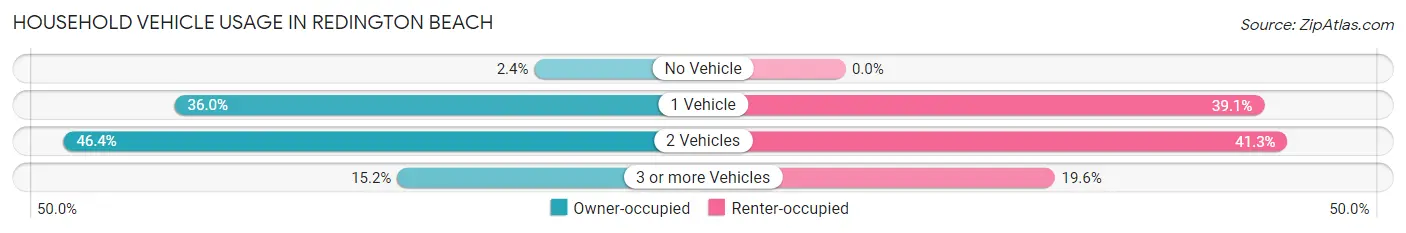
| Vehicles per Household | Owner-occupied | Renter-occupied |
| No Vehicle | 14 (2.4%) | 0 (0.0%) |
| 1 Vehicle | 208 (36.0%) | 18 (39.1%) |
| 2 Vehicles | 268 (46.4%) | 19 (41.3%) |
| 3 or more Vehicles | 88 (15.2%) | 9 (19.6%) |
| Total | 578 (100.0%) | 46 (100.0%) |
Real Estate & Mortgages in Redington Beach
Real Estate and Mortgage Overview in Redington Beach
| Characteristic | Without Mortgage | With Mortgage |
| Housing Units | 279 | 299 |
| Median Property Value | $653,700 | $712,600 |
| Median Household Income | $79,583 | $122 |
| Monthly Housing Costs | $993 | $131 |
| Real Estate Taxes | $4,500 | $7 |
Property Value by Mortgage Status in Redington Beach
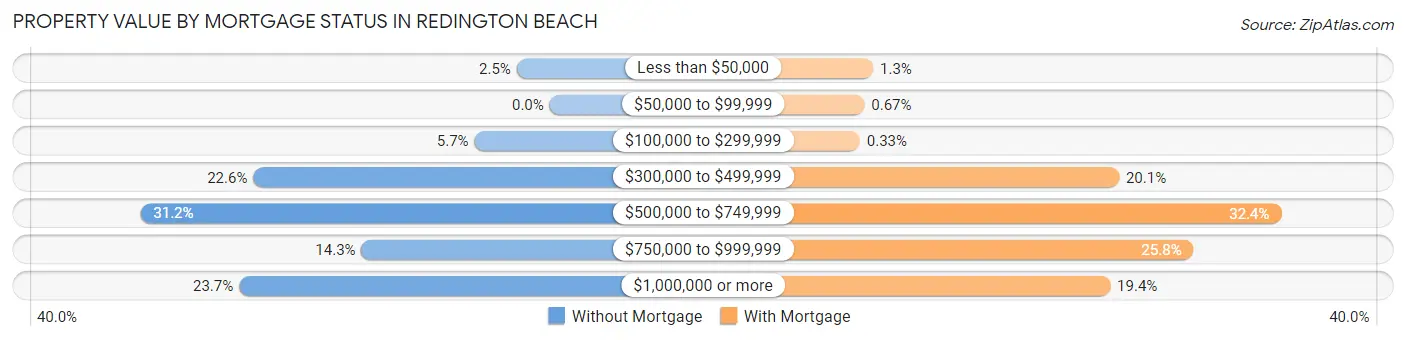
| Property Value | Without Mortgage | With Mortgage |
| Less than $50,000 | 7 (2.5%) | 4 (1.3%) |
| $50,000 to $99,999 | 0 (0.0%) | 2 (0.7%) |
| $100,000 to $299,999 | 16 (5.7%) | 1 (0.3%) |
| $300,000 to $499,999 | 63 (22.6%) | 60 (20.1%) |
| $500,000 to $749,999 | 87 (31.2%) | 97 (32.4%) |
| $750,000 to $999,999 | 40 (14.3%) | 77 (25.8%) |
| $1,000,000 or more | 66 (23.7%) | 58 (19.4%) |
| Total | 279 (100.0%) | 299 (100.0%) |
Household Income by Mortgage Status in Redington Beach
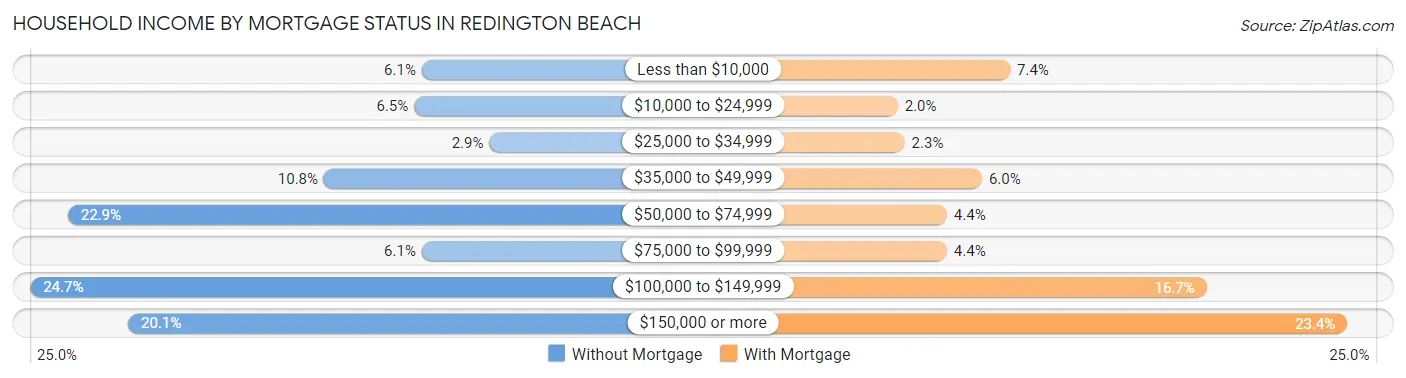
| Household Income | Without Mortgage | With Mortgage |
| Less than $10,000 | 17 (6.1%) | 22 (7.4%) |
| $10,000 to $24,999 | 18 (6.5%) | 6 (2.0%) |
| $25,000 to $34,999 | 8 (2.9%) | 7 (2.3%) |
| $35,000 to $49,999 | 30 (10.7%) | 18 (6.0%) |
| $50,000 to $74,999 | 64 (22.9%) | 13 (4.3%) |
| $75,000 to $99,999 | 17 (6.1%) | 13 (4.3%) |
| $100,000 to $149,999 | 69 (24.7%) | 50 (16.7%) |
| $150,000 or more | 56 (20.1%) | 70 (23.4%) |
| Total | 279 (100.0%) | 299 (100.0%) |
Property Value to Household Income Ratio in Redington Beach
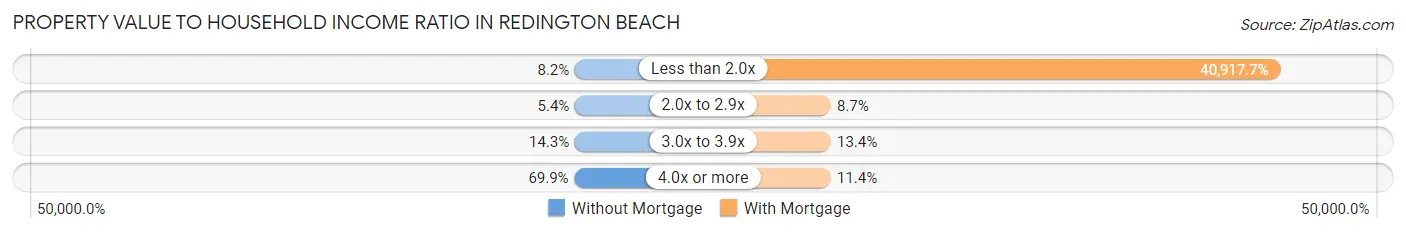
| Value-to-Income Ratio | Without Mortgage | With Mortgage |
| Less than 2.0x | 23 (8.2%) | 122,344 (40,917.7%) |
| 2.0x to 2.9x | 15 (5.4%) | 26 (8.7%) |
| 3.0x to 3.9x | 40 (14.3%) | 40 (13.4%) |
| 4.0x or more | 195 (69.9%) | 34 (11.4%) |
| Total | 279 (100.0%) | 299 (100.0%) |
Real Estate Taxes by Mortgage Status in Redington Beach
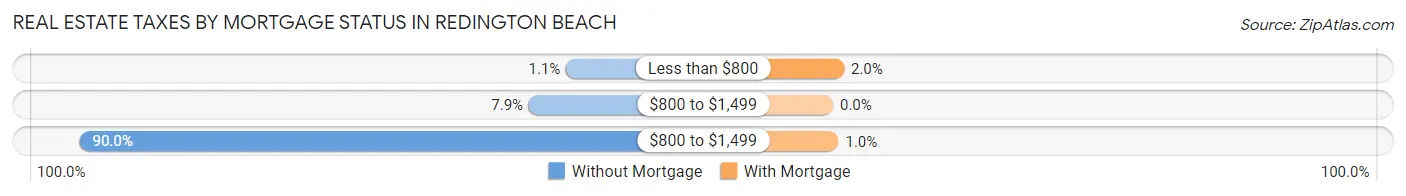
| Property Taxes | Without Mortgage | With Mortgage |
| Less than $800 | 3 (1.1%) | 6 (2.0%) |
| $800 to $1,499 | 22 (7.9%) | 0 (0.0%) |
| $800 to $1,499 | 251 (90.0%) | 3 (1.0%) |
| Total | 279 (100.0%) | 299 (100.0%) |
Health & Disability in Redington Beach
Health Insurance Coverage by Age in Redington Beach
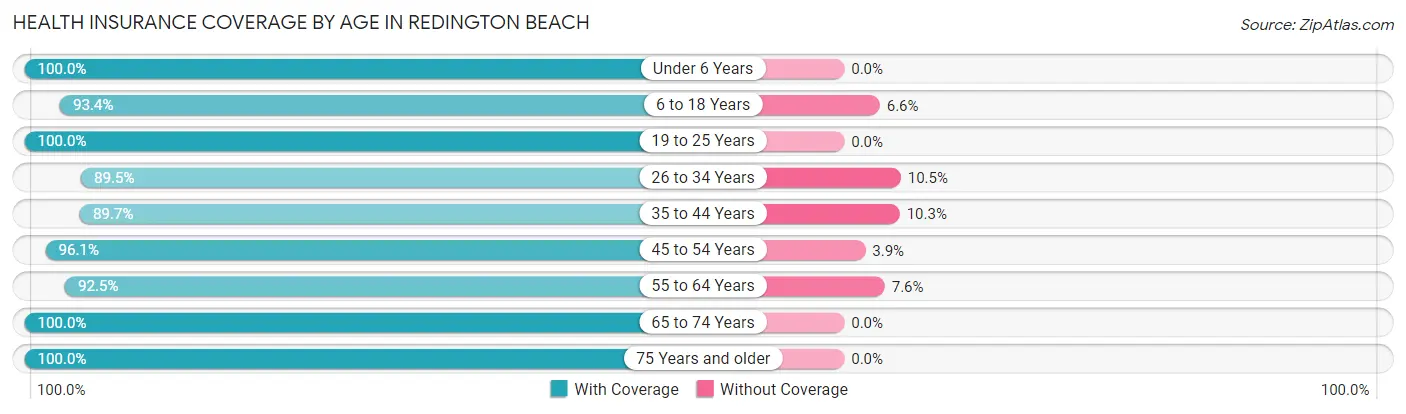
| Age Bracket | With Coverage | Without Coverage |
| Under 6 Years | 13 (100.0%) | 0 (0.0%) |
| 6 to 18 Years | 141 (93.4%) | 10 (6.6%) |
| 19 to 25 Years | 44 (100.0%) | 0 (0.0%) |
| 26 to 34 Years | 17 (89.5%) | 2 (10.5%) |
| 35 to 44 Years | 78 (89.7%) | 9 (10.3%) |
| 45 to 54 Years | 196 (96.1%) | 8 (3.9%) |
| 55 to 64 Years | 294 (92.4%) | 24 (7.5%) |
| 65 to 74 Years | 315 (100.0%) | 0 (0.0%) |
| 75 Years and older | 169 (100.0%) | 0 (0.0%) |
| Total | 1,267 (96.0%) | 53 (4.0%) |
Health Insurance Coverage by Citizenship Status in Redington Beach
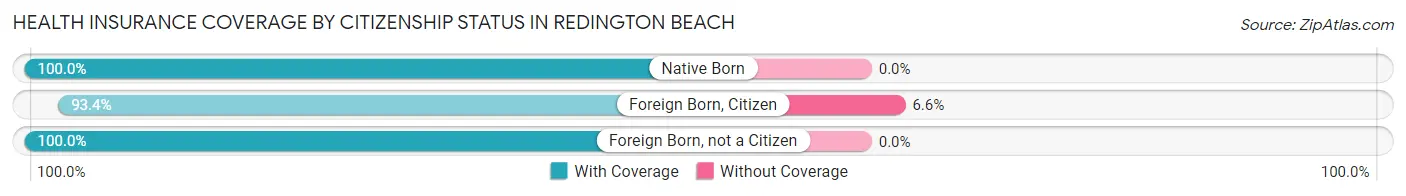
| Citizenship Status | With Coverage | Without Coverage |
| Native Born | 13 (100.0%) | 0 (0.0%) |
| Foreign Born, Citizen | 141 (93.4%) | 10 (6.6%) |
| Foreign Born, not a Citizen | 44 (100.0%) | 0 (0.0%) |
Health Insurance Coverage by Household Income in Redington Beach
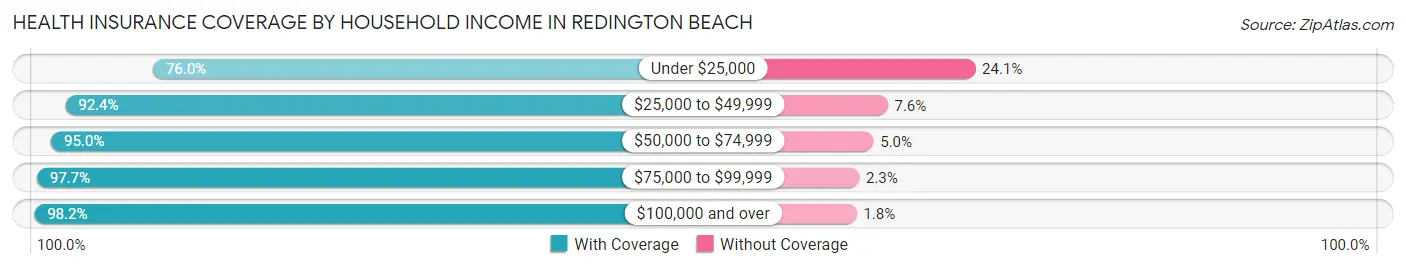
| Household Income | With Coverage | Without Coverage |
| Under $25,000 | 60 (75.9%) | 19 (24.0%) |
| $25,000 to $49,999 | 109 (92.4%) | 9 (7.6%) |
| $50,000 to $74,999 | 115 (95.0%) | 6 (5.0%) |
| $75,000 to $99,999 | 171 (97.7%) | 4 (2.3%) |
| $100,000 and over | 812 (98.2%) | 15 (1.8%) |
Public vs Private Health Insurance Coverage by Age in Redington Beach
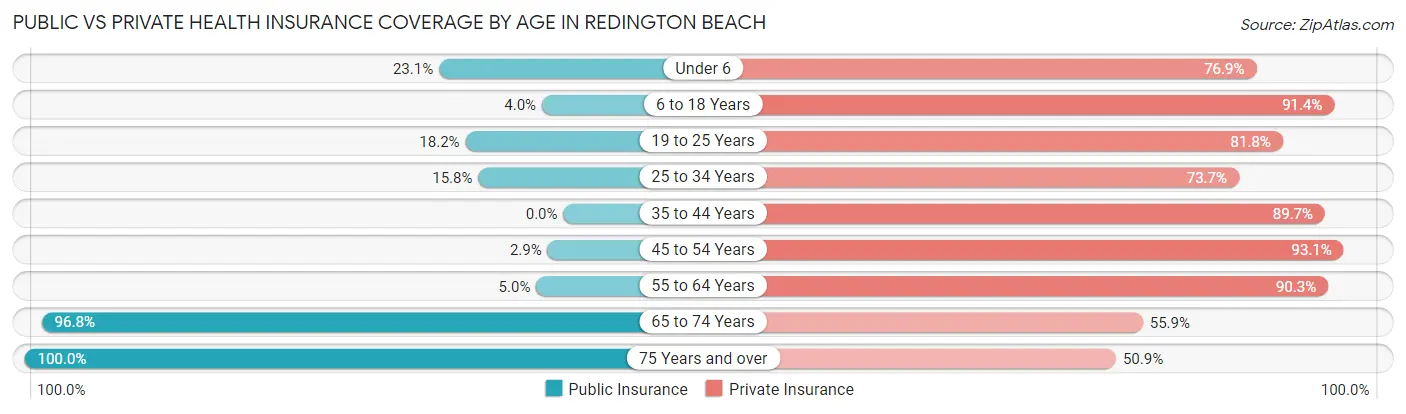
| Age Bracket | Public Insurance | Private Insurance |
| Under 6 | 3 (23.1%) | 10 (76.9%) |
| 6 to 18 Years | 6 (4.0%) | 138 (91.4%) |
| 19 to 25 Years | 8 (18.2%) | 36 (81.8%) |
| 25 to 34 Years | 3 (15.8%) | 14 (73.7%) |
| 35 to 44 Years | 0 (0.0%) | 78 (89.7%) |
| 45 to 54 Years | 6 (2.9%) | 190 (93.1%) |
| 55 to 64 Years | 16 (5.0%) | 287 (90.2%) |
| 65 to 74 Years | 305 (96.8%) | 176 (55.9%) |
| 75 Years and over | 169 (100.0%) | 86 (50.9%) |
| Total | 516 (39.1%) | 1,015 (76.9%) |
Disability Status by Sex by Age in Redington Beach
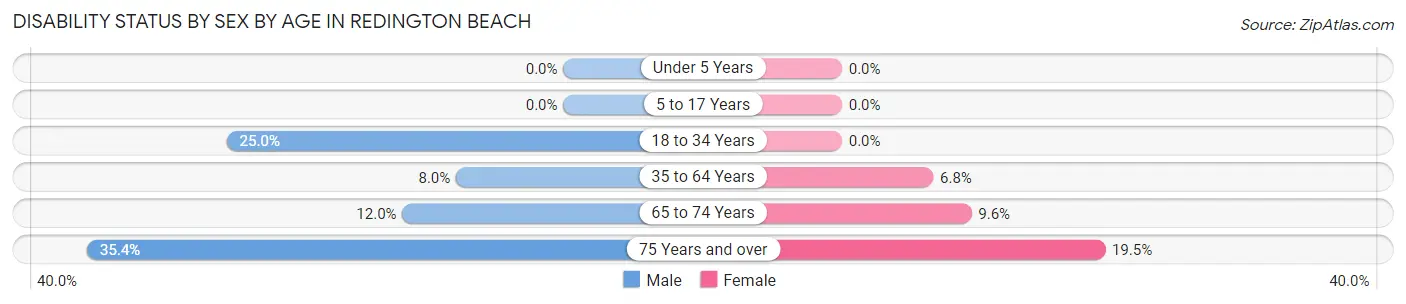
| Age Bracket | Male | Female |
| Under 5 Years | 0 (0.0%) | 0 (0.0%) |
| 5 to 17 Years | 0 (0.0%) | 0 (0.0%) |
| 18 to 34 Years | 8 (25.0%) | 0 (0.0%) |
| 35 to 64 Years | 25 (8.0%) | 20 (6.8%) |
| 65 to 74 Years | 19 (11.9%) | 15 (9.6%) |
| 75 Years and over | 29 (35.4%) | 17 (19.5%) |
Disability Class by Sex by Age in Redington Beach
Disability Class: Hearing Difficulty
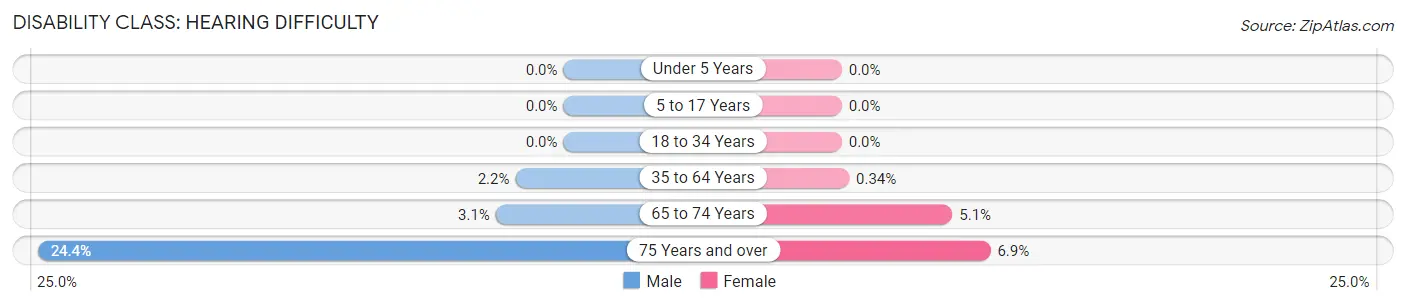
| Age Bracket | Male | Female |
| Under 5 Years | 0 (0.0%) | 0 (0.0%) |
| 5 to 17 Years | 0 (0.0%) | 0 (0.0%) |
| 18 to 34 Years | 0 (0.0%) | 0 (0.0%) |
| 35 to 64 Years | 7 (2.2%) | 1 (0.3%) |
| 65 to 74 Years | 5 (3.1%) | 8 (5.1%) |
| 75 Years and over | 20 (24.4%) | 6 (6.9%) |
Disability Class: Vision Difficulty
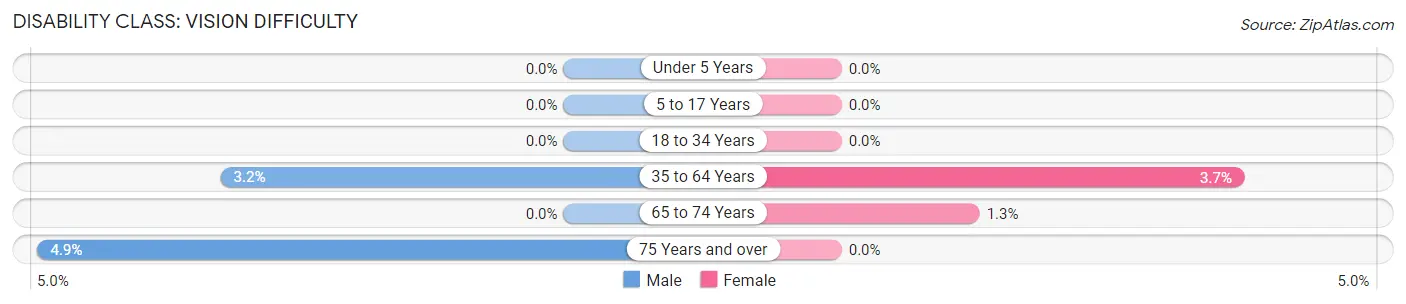
| Age Bracket | Male | Female |
| Under 5 Years | 0 (0.0%) | 0 (0.0%) |
| 5 to 17 Years | 0 (0.0%) | 0 (0.0%) |
| 18 to 34 Years | 0 (0.0%) | 0 (0.0%) |
| 35 to 64 Years | 10 (3.2%) | 11 (3.7%) |
| 65 to 74 Years | 0 (0.0%) | 2 (1.3%) |
| 75 Years and over | 4 (4.9%) | 0 (0.0%) |
Disability Class: Cognitive Difficulty
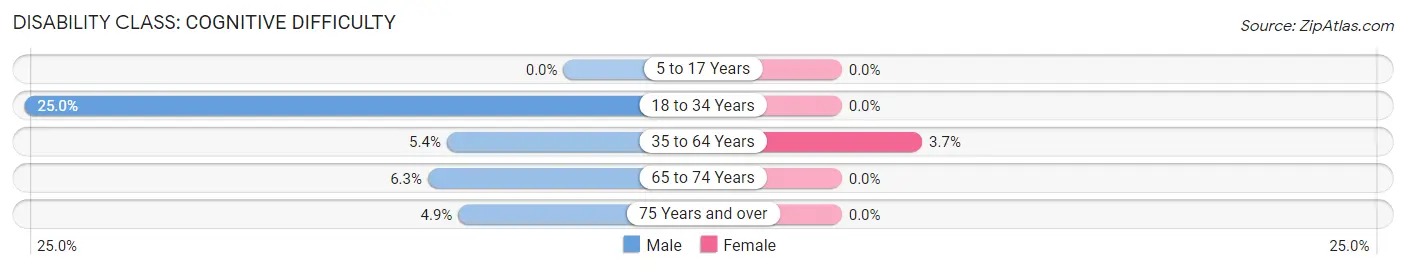
| Age Bracket | Male | Female |
| 5 to 17 Years | 0 (0.0%) | 0 (0.0%) |
| 18 to 34 Years | 8 (25.0%) | 0 (0.0%) |
| 35 to 64 Years | 17 (5.4%) | 11 (3.7%) |
| 65 to 74 Years | 10 (6.3%) | 0 (0.0%) |
| 75 Years and over | 4 (4.9%) | 0 (0.0%) |
Disability Class: Ambulatory Difficulty
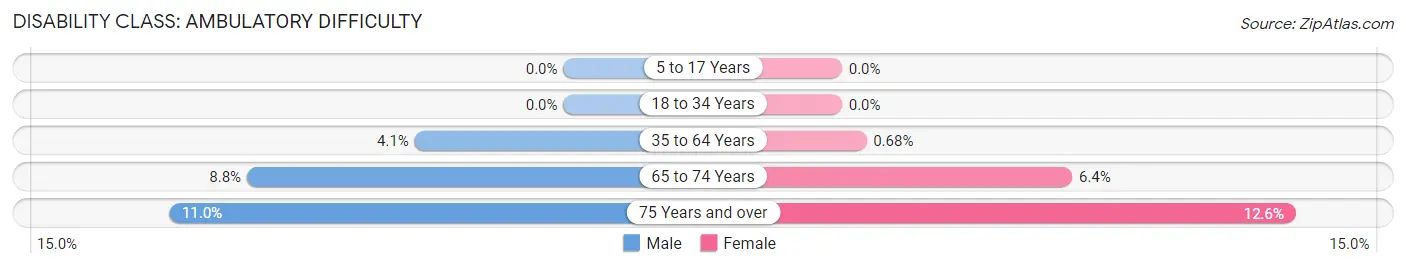
| Age Bracket | Male | Female |
| 5 to 17 Years | 0 (0.0%) | 0 (0.0%) |
| 18 to 34 Years | 0 (0.0%) | 0 (0.0%) |
| 35 to 64 Years | 13 (4.1%) | 2 (0.7%) |
| 65 to 74 Years | 14 (8.8%) | 10 (6.4%) |
| 75 Years and over | 9 (11.0%) | 11 (12.6%) |
Disability Class: Self-Care Difficulty
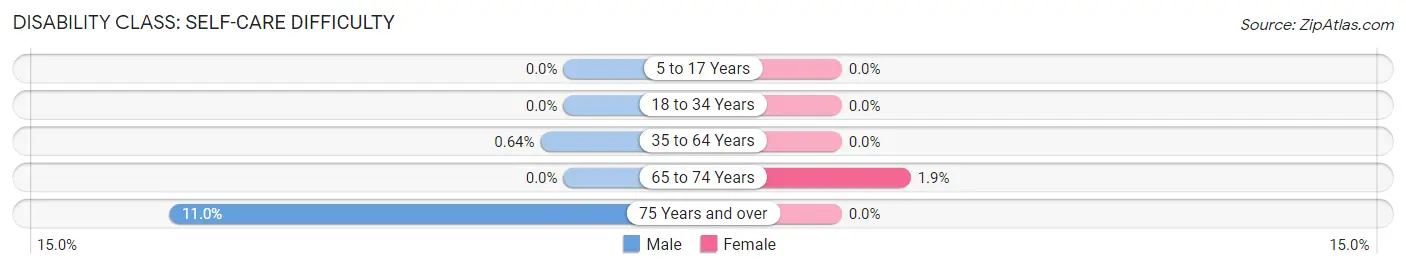
| Age Bracket | Male | Female |
| 5 to 17 Years | 0 (0.0%) | 0 (0.0%) |
| 18 to 34 Years | 0 (0.0%) | 0 (0.0%) |
| 35 to 64 Years | 2 (0.6%) | 0 (0.0%) |
| 65 to 74 Years | 0 (0.0%) | 3 (1.9%) |
| 75 Years and over | 9 (11.0%) | 0 (0.0%) |
Technology Access in Redington Beach
Computing Device Access in Redington Beach
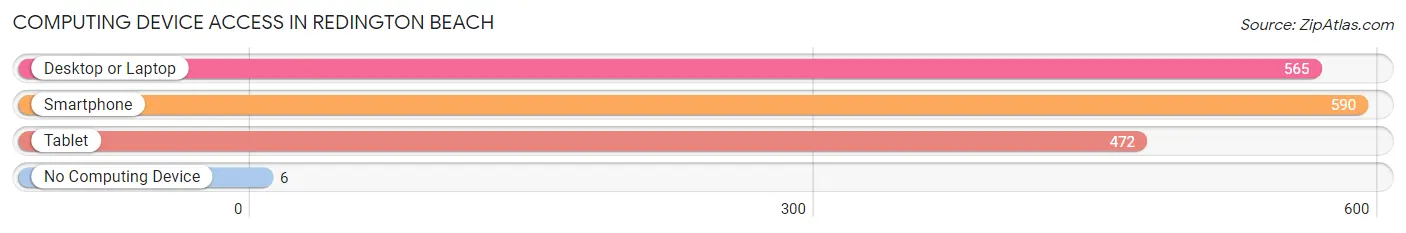
| Device Type | # Households | % Households |
| Desktop or Laptop | 565 | 90.5% |
| Smartphone | 590 | 94.6% |
| Tablet | 472 | 75.6% |
| No Computing Device | 6 | 1.0% |
| Total | 624 | 100.0% |
Internet Access in Redington Beach
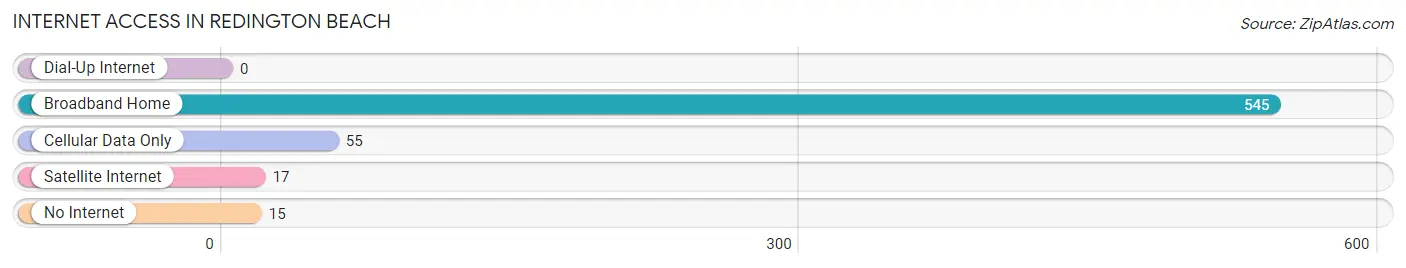
| Internet Type | # Households | % Households |
| Dial-Up Internet | 0 | 0.0% |
| Broadband Home | 545 | 87.3% |
| Cellular Data Only | 55 | 8.8% |
| Satellite Internet | 17 | 2.7% |
| No Internet | 15 | 2.4% |
| Total | 624 | 100.0% |
Redington Beach Summary
Redington Beach is a small town located in Pinellas County, Florida. It is situated on the Gulf of Mexico, just north of St. Petersburg and south of Clearwater. The town is part of the Tampa Bay Area and is known for its beautiful beaches and laid-back atmosphere.
Geography
Redington Beach is located on the Gulf of Mexico, just north of St. Petersburg and south of Clearwater. The town is situated on a barrier island, which is bordered by the Intracoastal Waterway to the east and the Gulf of Mexico to the west. The town is approximately 2.5 miles long and 0.5 miles wide. The town is divided into two sections, North Redington Beach and South Redington Beach. The town is home to several parks, including Redington Beach Park, which features a playground, picnic area, and beach access.
Economy
Redington Beach is a popular tourist destination, and the town’s economy is largely driven by tourism. The town is home to several hotels, restaurants, and shops, which cater to visitors. The town is also home to several marinas, which provide boat rentals and fishing charters. Additionally, the town is home to several real estate offices, which specialize in beachfront properties.
Demographics
As of the 2010 census, Redington Beach had a population of 1,427. The population is predominantly white (94.3%), with a small percentage of African Americans (2.2%) and Hispanics (2.2%). The median household income is $63,958, and the median age is 57.
History
Redington Beach was first settled in the late 1800s by a group of fishermen from the Bahamas. The town was officially incorporated in 1925, and the first mayor was elected in 1926. The town was named after the Redington family, who owned a large tract of land in the area. In the 1950s, the town began to develop as a tourist destination, and several hotels and restaurants were built. In the 1970s, the town was hit hard by a series of hurricanes, which caused extensive damage to the town’s infrastructure. In the 1980s, the town began to rebuild, and the town’s economy began to recover. Today, Redington Beach is a popular tourist destination, and the town’s economy is largely driven by tourism.
Common Questions
What is Per Capita Income in Redington Beach?
Per Capita income in Redington Beach is $68,231.
What is the Median Family Income in Redington Beach?
Median Family Income in Redington Beach is $116,607.
What is the Median Household income in Redington Beach?
Median Household Income in Redington Beach is $104,474.
What is Income or Wage Gap in Redington Beach?
Income or Wage Gap in Redington Beach is 41.4%.
Women in Redington Beach earn 58.6 cents for every dollar earned by a man.
What is Inequality or Gini Index in Redington Beach?
Inequality or Gini Index in Redington Beach is 0.44.
What is the Total Population of Redington Beach?
Total Population of Redington Beach is 1,320.
What is the Total Male Population of Redington Beach?
Total Male Population of Redington Beach is 667.
What is the Total Female Population of Redington Beach?
Total Female Population of Redington Beach is 653.
What is the Ratio of Males per 100 Females in Redington Beach?
There are 102.14 Males per 100 Females in Redington Beach.
What is the Ratio of Females per 100 Males in Redington Beach?
There are 97.90 Females per 100 Males in Redington Beach.
What is the Median Population Age in Redington Beach?
Median Population Age in Redington Beach is 59.7 Years.
What is the Average Family Size in Redington Beach
Average Family Size in Redington Beach is 2.4 People.
What is the Average Household Size in Redington Beach
Average Household Size in Redington Beach is 2.1 People.
How Large is the Labor Force in Redington Beach?
There are 638 People in the Labor Forcein in Redington Beach.
What is the Percentage of People in the Labor Force in Redington Beach?
52.4% of People are in the Labor Force in Redington Beach.
What is the Unemployment Rate in Redington Beach?
Unemployment Rate in Redington Beach is 3.3%.