Pretty Bayou, FL Map & Demographics
Pretty Bayou Map
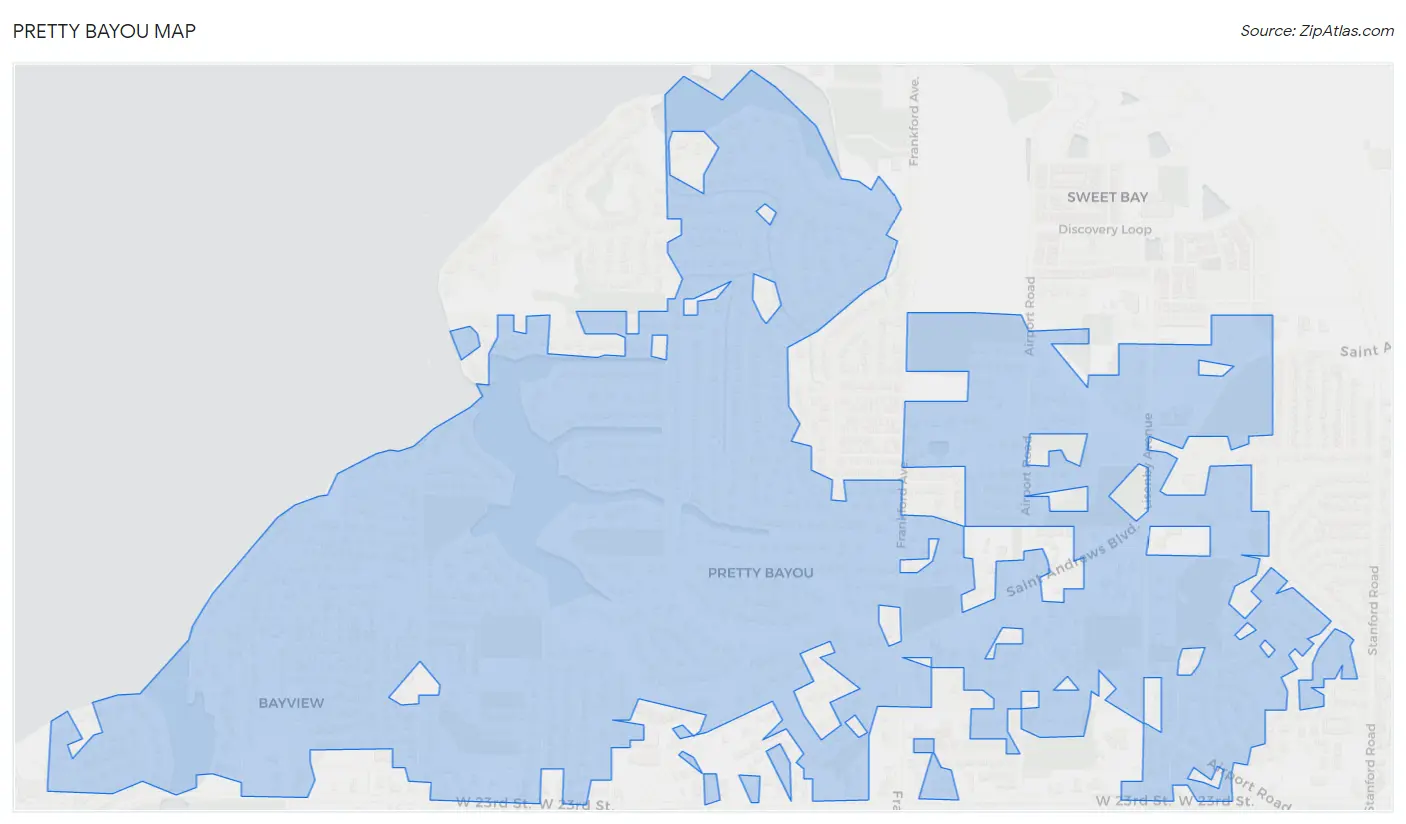
Pretty Bayou Overview
$41,101
PER CAPITA INCOME
$102,452
AVG FAMILY INCOME
$78,008
AVG HOUSEHOLD INCOME
5.8%
WAGE / INCOME GAP [ % ]
94.2¢/ $1
WAGE / INCOME GAP [ $ ]
0.33
INEQUALITY / GINI INDEX
2,469
TOTAL POPULATION
1,112
MALE POPULATION
1,357
FEMALE POPULATION
81.95
MALES / 100 FEMALES
122.03
FEMALES / 100 MALES
55.2
MEDIAN AGE
2.9
AVG FAMILY SIZE
2.1
AVG HOUSEHOLD SIZE
1,105
LABOR FORCE [ PEOPLE ]
48.9%
PERCENT IN LABOR FORCE
8.4%
UNEMPLOYMENT RATE
Income in Pretty Bayou
Income Overview in Pretty Bayou
Per Capita Income in Pretty Bayou is $41,101, while median incomes of families and households are $102,452 and $78,008 respectively.
| Characteristic | Number | Measure |
| Per Capita Income | 2,469 | $41,101 |
| Median Family Income | 611 | $102,452 |
| Mean Family Income | 611 | $114,602 |
| Median Household Income | 1,102 | $78,008 |
| Mean Household Income | 1,102 | $86,789 |
| Income Deficit | 611 | $0 |
| Wage / Income Gap (%) | 2,469 | 5.76% |
| Wage / Income Gap ($) | 2,469 | 94.24¢ per $1 |
| Gini / Inequality Index | 2,469 | 0.33 |
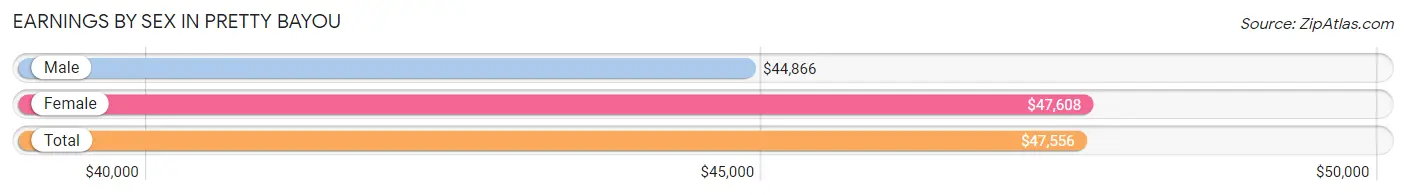
Earnings by Sex in Pretty Bayou
Average Earnings in Pretty Bayou are $47,556, $44,866 for men and $47,608 for women, a difference of 5.8%.
| Sex | Number | Average Earnings |
| Male | 665 (54.5%) | $44,866 |
| Female | 554 (45.5%) | $47,608 |
| Total | 1,219 (100.0%) | $47,556 |
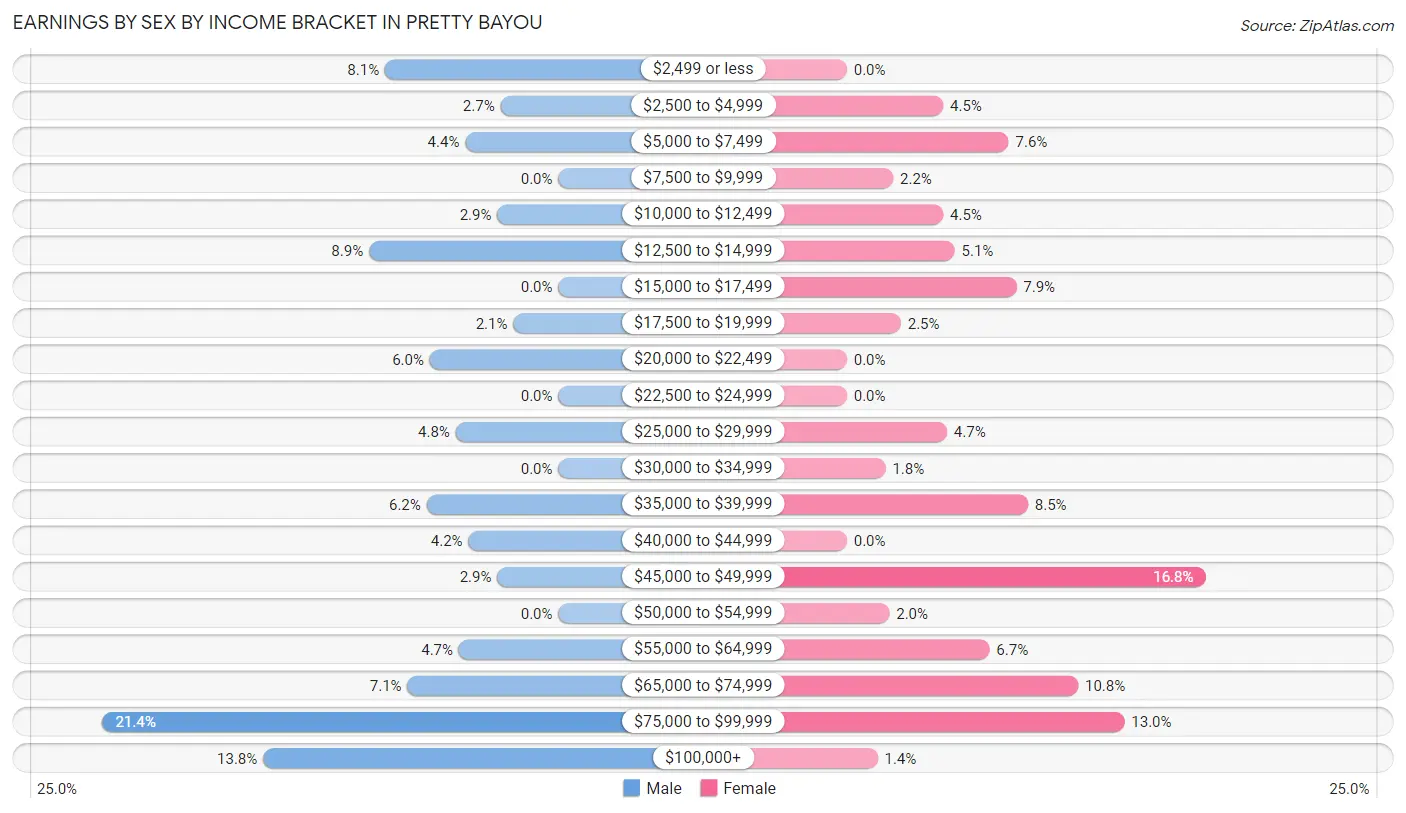
Earnings by Sex by Income Bracket in Pretty Bayou
The most common earnings brackets in Pretty Bayou are $75,000 to $99,999 for men (142 | 21.3%) and $45,000 to $49,999 for women (93 | 16.8%).
| Income | Male | Female |
| $2,499 or less | 54 (8.1%) | 0 (0.0%) |
| $2,500 to $4,999 | 18 (2.7%) | 25 (4.5%) |
| $5,000 to $7,499 | 29 (4.4%) | 42 (7.6%) |
| $7,500 to $9,999 | 0 (0.0%) | 12 (2.2%) |
| $10,000 to $12,499 | 19 (2.9%) | 25 (4.5%) |
| $12,500 to $14,999 | 59 (8.9%) | 28 (5.1%) |
| $15,000 to $17,499 | 0 (0.0%) | 44 (7.9%) |
| $17,500 to $19,999 | 14 (2.1%) | 14 (2.5%) |
| $20,000 to $22,499 | 40 (6.0%) | 0 (0.0%) |
| $22,500 to $24,999 | 0 (0.0%) | 0 (0.0%) |
| $25,000 to $29,999 | 32 (4.8%) | 26 (4.7%) |
| $30,000 to $34,999 | 0 (0.0%) | 10 (1.8%) |
| $35,000 to $39,999 | 41 (6.2%) | 47 (8.5%) |
| $40,000 to $44,999 | 28 (4.2%) | 0 (0.0%) |
| $45,000 to $49,999 | 19 (2.9%) | 93 (16.8%) |
| $50,000 to $54,999 | 0 (0.0%) | 11 (2.0%) |
| $55,000 to $64,999 | 31 (4.7%) | 37 (6.7%) |
| $65,000 to $74,999 | 47 (7.1%) | 60 (10.8%) |
| $75,000 to $99,999 | 142 (21.3%) | 72 (13.0%) |
| $100,000+ | 92 (13.8%) | 8 (1.4%) |
| Total | 665 (100.0%) | 554 (100.0%) |
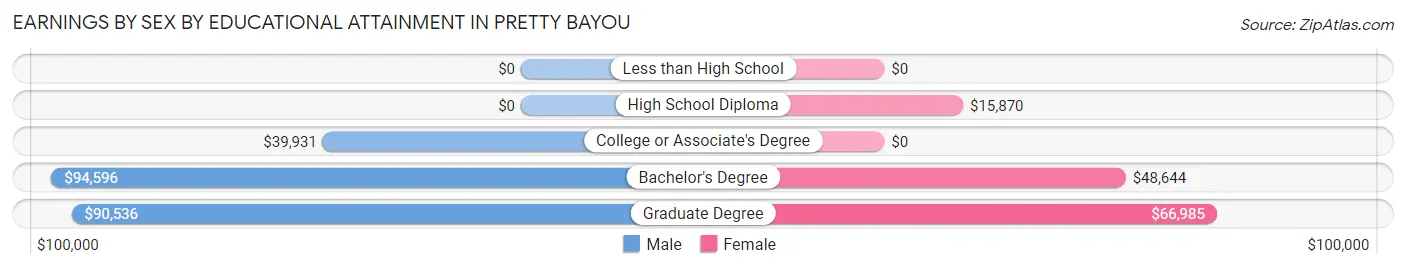
Earnings by Sex by Educational Attainment in Pretty Bayou
Average earnings in Pretty Bayou are $67,663 for men and $48,347 for women, a difference of 28.5%. Men with an educational attainment of bachelor's degree enjoy the highest average annual earnings of $94,596, while those with college or associate's degree education earn the least with $39,931. Women with an educational attainment of graduate degree earn the most with the average annual earnings of $66,985, while those with high school diploma education have the smallest earnings of $15,870.
| Educational Attainment | Male Income | Female Income |
| Less than High School | - | - |
| High School Diploma | - | - |
| College or Associate's Degree | $39,931 | $0 |
| Bachelor's Degree | $94,596 | $48,644 |
| Graduate Degree | $90,536 | $66,985 |
| Total | $67,663 | $48,347 |
Family Income in Pretty Bayou
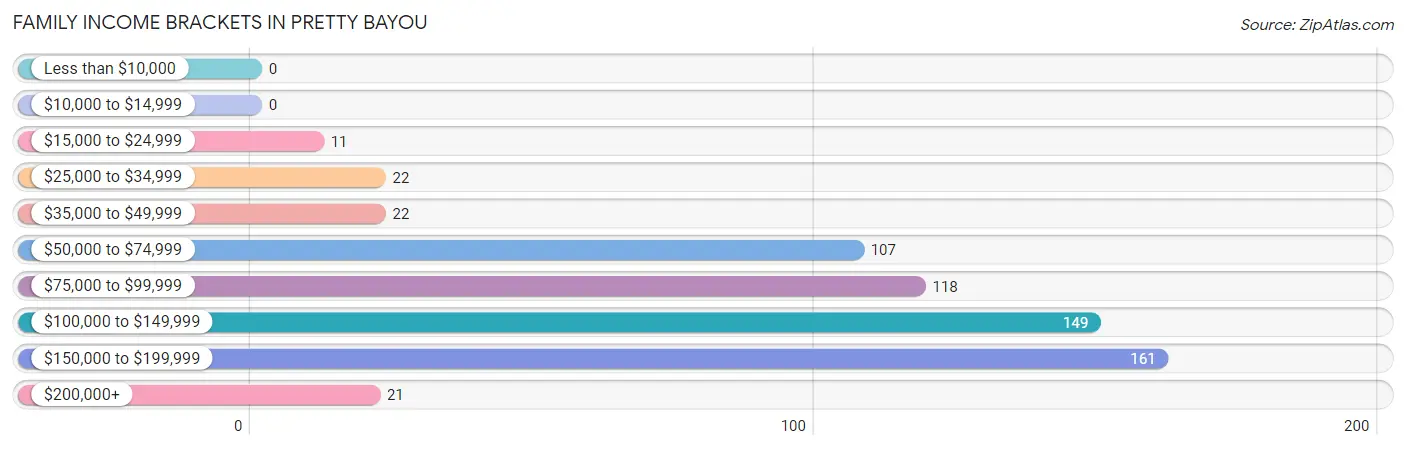
Family Income Brackets in Pretty Bayou
According to the Pretty Bayou family income data, there are 161 families falling into the $150,000 to $199,999 income range, which is the most common income bracket and makes up 26.4% of all families.
| Income Bracket | # Families | % Families |
| Less than $10,000 | 0 | 0.0% |
| $10,000 to $14,999 | 0 | 0.0% |
| $15,000 to $24,999 | 11 | 1.8% |
| $25,000 to $34,999 | 22 | 3.6% |
| $35,000 to $49,999 | 22 | 3.6% |
| $50,000 to $74,999 | 107 | 17.5% |
| $75,000 to $99,999 | 118 | 19.3% |
| $100,000 to $149,999 | 149 | 24.4% |
| $150,000 to $199,999 | 161 | 26.4% |
| $200,000+ | 21 | 3.4% |
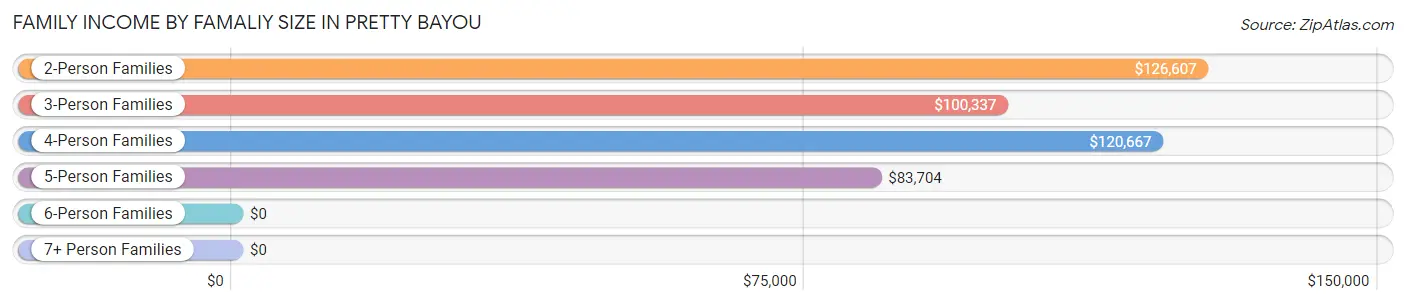
Family Income by Famaliy Size in Pretty Bayou
2-person families (356 | 58.3%) account for the highest median family income in Pretty Bayou with $126,607 per family, while 2-person families (356 | 58.3%) have the highest median income of $63,304 per family member.
| Income Bracket | # Families | Median Income |
| 2-Person Families | 356 (58.3%) | $126,607 |
| 3-Person Families | 105 (17.2%) | $100,337 |
| 4-Person Families | 72 (11.8%) | $120,667 |
| 5-Person Families | 78 (12.8%) | $83,704 |
| 6-Person Families | 0 (0.0%) | $0 |
| 7+ Person Families | 0 (0.0%) | $0 |
| Total | 611 (100.0%) | $102,452 |
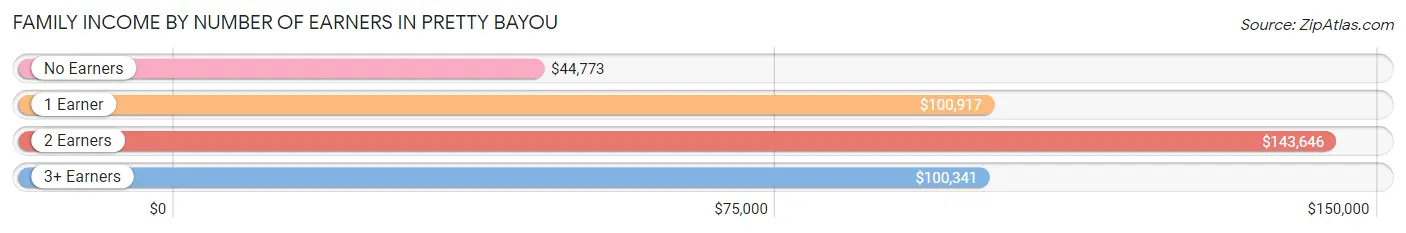
Family Income by Number of Earners in Pretty Bayou
The median family income in Pretty Bayou is $102,452, with families comprising 2 earners (265) having the highest median family income of $143,646, while families with no earners (102) have the lowest median family income of $44,773, accounting for 43.4% and 16.7% of families, respectively.
| Number of Earners | # Families | Median Income |
| No Earners | 102 (16.7%) | $44,773 |
| 1 Earner | 187 (30.6%) | $100,917 |
| 2 Earners | 265 (43.4%) | $143,646 |
| 3+ Earners | 57 (9.3%) | $100,341 |
| Total | 611 (100.0%) | $102,452 |
Household Income in Pretty Bayou
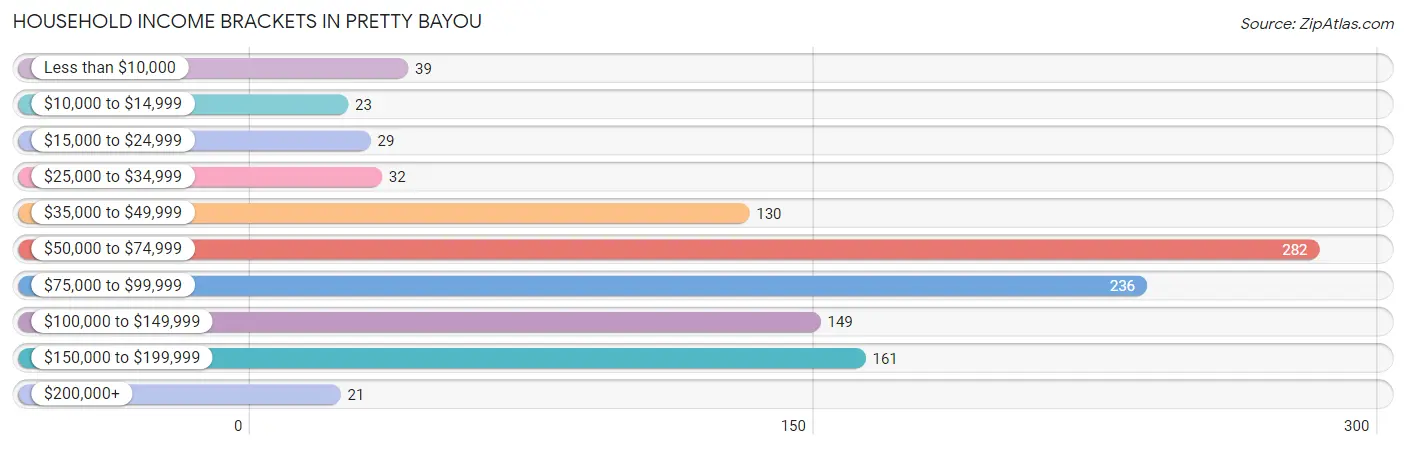
Household Income Brackets in Pretty Bayou
With 282 households falling in the category, the $50,000 to $74,999 income range is the most frequent in Pretty Bayou, accounting for 25.6% of all households. In contrast, only 21 households (1.9%) fall into the $200,000+ income bracket, making it the least populous group.
| Income Bracket | # Households | % Households |
| Less than $10,000 | 39 | 3.5% |
| $10,000 to $14,999 | 23 | 2.1% |
| $15,000 to $24,999 | 29 | 2.6% |
| $25,000 to $34,999 | 32 | 2.9% |
| $35,000 to $49,999 | 130 | 11.8% |
| $50,000 to $74,999 | 282 | 25.6% |
| $75,000 to $99,999 | 236 | 21.4% |
| $100,000 to $149,999 | 149 | 13.5% |
| $150,000 to $199,999 | 161 | 14.6% |
| $200,000+ | 21 | 1.9% |
Household Income by Householder Age in Pretty Bayou
The median household income in Pretty Bayou is $78,008, with the highest median household income of $93,625 found in the 25 to 44 years age bracket for the primary householder. A total of 199 households (18.1%) fall into this category. Meanwhile, the 15 to 24 years age bracket for the primary householder has the lowest median household income of $0, with 25 households (2.3%) in this group.
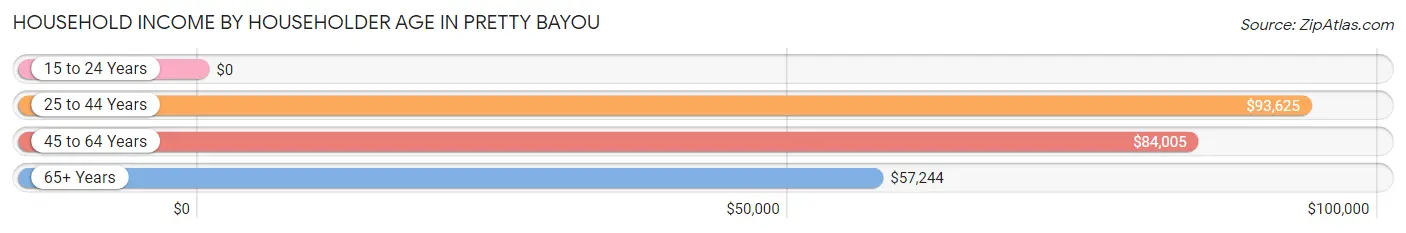
| Income Bracket | # Households | Median Income |
| 15 to 24 Years | 25 (2.3%) | $0 |
| 25 to 44 Years | 199 (18.1%) | $93,625 |
| 45 to 64 Years | 341 (30.9%) | $84,005 |
| 65+ Years | 537 (48.7%) | $57,244 |
| Total | 1,102 (100.0%) | $78,008 |
Poverty in Pretty Bayou
Income Below Poverty by Sex and Age in Pretty Bayou
With 1.7% poverty level for males and 7.5% for females among the residents of Pretty Bayou, 65 to 74 year old males and 65 to 74 year old females are the most vulnerable to poverty, with 11 males (6.7%) and 38 females (17.8%) in their respective age groups living below the poverty level.
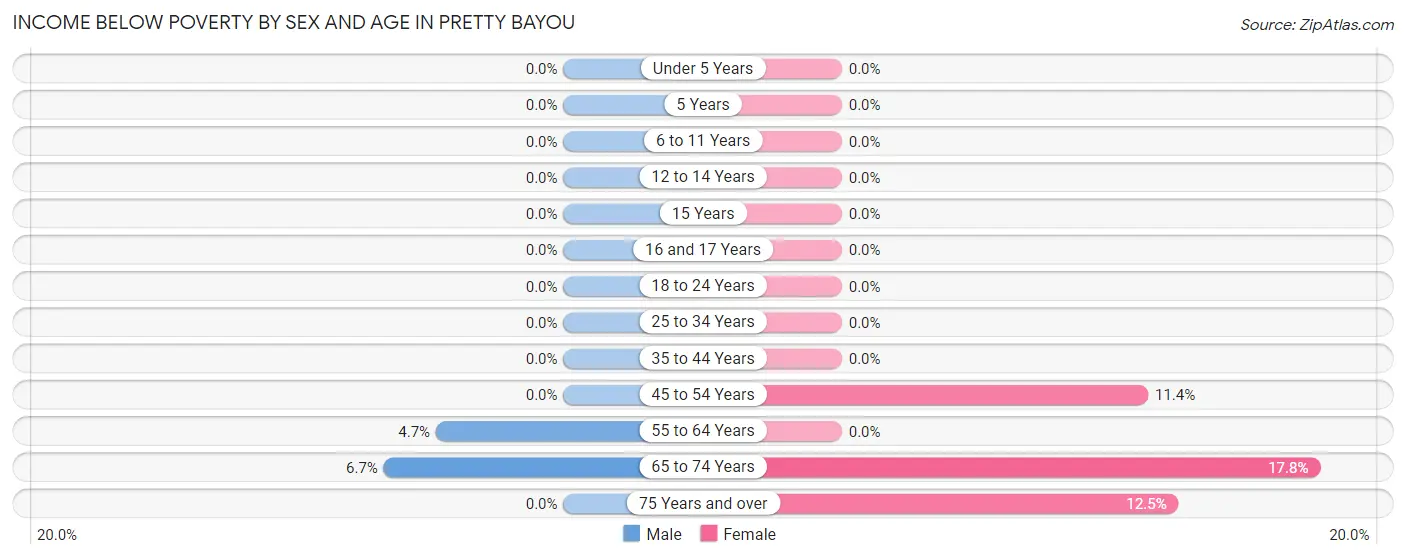
| Age Bracket | Male | Female |
| Under 5 Years | 0 (0.0%) | 0 (0.0%) |
| 5 Years | 0 (0.0%) | 0 (0.0%) |
| 6 to 11 Years | 0 (0.0%) | 0 (0.0%) |
| 12 to 14 Years | 0 (0.0%) | 0 (0.0%) |
| 15 Years | 0 (0.0%) | 0 (0.0%) |
| 16 and 17 Years | 0 (0.0%) | 0 (0.0%) |
| 18 to 24 Years | 0 (0.0%) | 0 (0.0%) |
| 25 to 34 Years | 0 (0.0%) | 0 (0.0%) |
| 35 to 44 Years | 0 (0.0%) | 0 (0.0%) |
| 45 to 54 Years | 0 (0.0%) | 24 (11.4%) |
| 55 to 64 Years | 7 (4.7%) | 0 (0.0%) |
| 65 to 74 Years | 11 (6.7%) | 38 (17.8%) |
| 75 Years and over | 0 (0.0%) | 34 (12.5%) |
| Total | 18 (1.7%) | 96 (7.5%) |
Income Above Poverty by Sex and Age in Pretty Bayou
According to the poverty statistics in Pretty Bayou, males aged under 5 years and females aged under 5 years are the age groups that are most secure financially, with 100.0% of males and 100.0% of females in these age groups living above the poverty line.
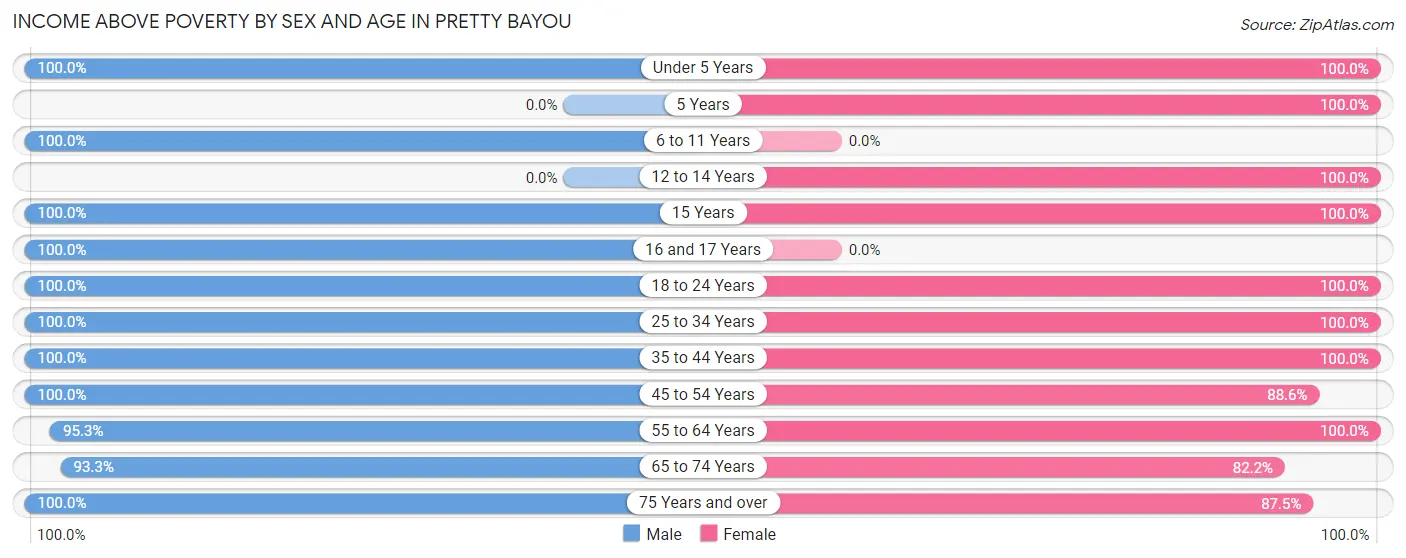
| Age Bracket | Male | Female |
| Under 5 Years | 46 (100.0%) | 77 (100.0%) |
| 5 Years | 0 (0.0%) | 13 (100.0%) |
| 6 to 11 Years | 13 (100.0%) | 0 (0.0%) |
| 12 to 14 Years | 0 (0.0%) | 13 (100.0%) |
| 15 Years | 21 (100.0%) | 27 (100.0%) |
| 16 and 17 Years | 8 (100.0%) | 0 (0.0%) |
| 18 to 24 Years | 98 (100.0%) | 86 (100.0%) |
| 25 to 34 Years | 117 (100.0%) | 72 (100.0%) |
| 35 to 44 Years | 110 (100.0%) | 152 (100.0%) |
| 45 to 54 Years | 168 (100.0%) | 187 (88.6%) |
| 55 to 64 Years | 141 (95.3%) | 138 (100.0%) |
| 65 to 74 Years | 154 (93.3%) | 176 (82.2%) |
| 75 Years and over | 194 (100.0%) | 238 (87.5%) |
| Total | 1,070 (98.4%) | 1,179 (92.5%) |
Income Below Poverty Among Married-Couple Families in Pretty Bayou
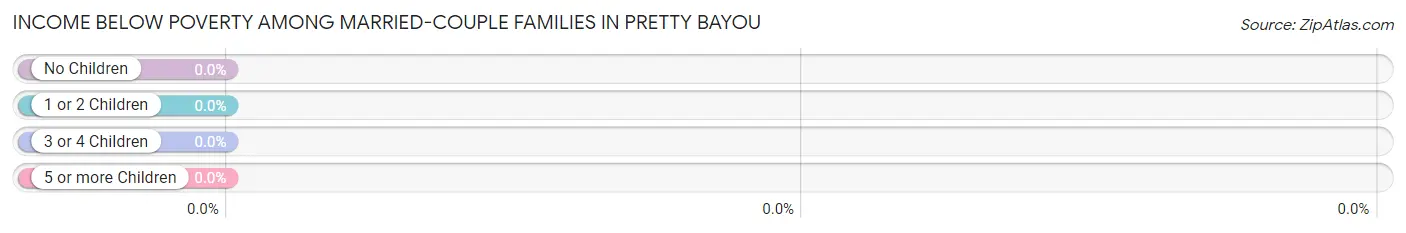
| Children | Above Poverty | Below Poverty |
| No Children | 358 (100.0%) | 0 (0.0%) |
| 1 or 2 Children | 155 (100.0%) | 0 (0.0%) |
| 3 or 4 Children | 0 (0.0%) | 0 (0.0%) |
| 5 or more Children | 0 (0.0%) | 0 (0.0%) |
| Total | 513 (100.0%) | 0 (0.0%) |
Income Below Poverty Among Single-Parent Households in Pretty Bayou
| Children | Single Father | Single Mother |
| No Children | 0 (0.0%) | 0 (0.0%) |
| 1 or 2 Children | 0 (0.0%) | 0 (0.0%) |
| 3 or 4 Children | 0 (0.0%) | 0 (0.0%) |
| 5 or more Children | 0 (0.0%) | 0 (0.0%) |
| Total | 0 (0.0%) | 0 (0.0%) |
Income Below Poverty Among Married-Couple vs Single-Parent Households in Pretty Bayou
| Children | Married-Couple Families | Single-Parent Households |
| No Children | 0 (0.0%) | 0 (0.0%) |
| 1 or 2 Children | 0 (0.0%) | 0 (0.0%) |
| 3 or 4 Children | 0 (0.0%) | 0 (0.0%) |
| 5 or more Children | 0 (0.0%) | 0 (0.0%) |
| Total | 0 (0.0%) | 0 (0.0%) |
Race in Pretty Bayou
The most populous races in Pretty Bayou are White / Caucasian (2,176 | 88.1%), Asian (126 | 5.1%), and Two or more Races (126 | 5.1%).
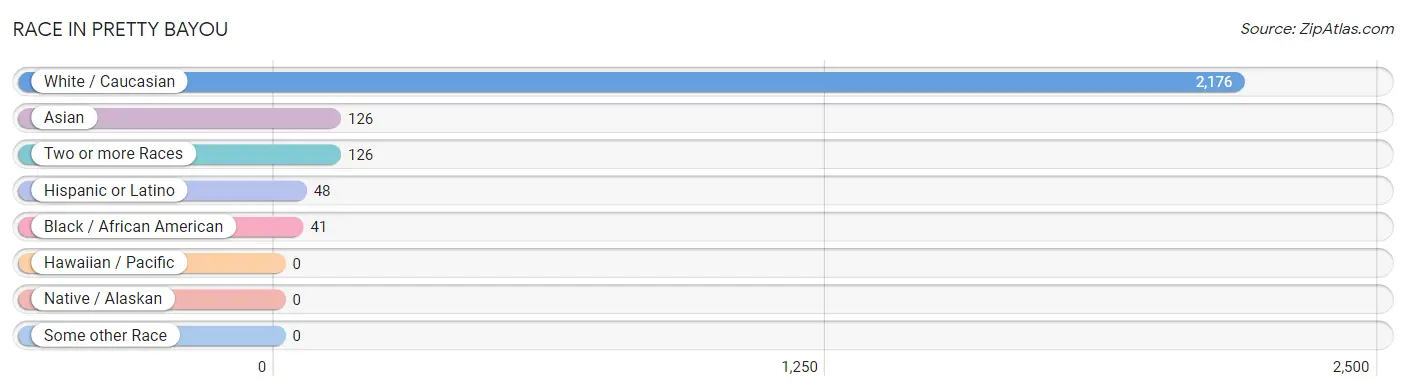
| Race | # Population | % Population |
| Asian | 126 | 5.1% |
| Black / African American | 41 | 1.7% |
| Hawaiian / Pacific | 0 | 0.0% |
| Hispanic or Latino | 48 | 1.9% |
| Native / Alaskan | 0 | 0.0% |
| White / Caucasian | 2,176 | 88.1% |
| Two or more Races | 126 | 5.1% |
| Some other Race | 0 | 0.0% |
| Total | 2,469 | 100.0% |
Ancestry in Pretty Bayou
The most populous ancestries reported in Pretty Bayou are English (556 | 22.5%), Irish (391 | 15.8%), Scottish (212 | 8.6%), American (183 | 7.4%), and German (179 | 7.2%), together accounting for 61.6% of all Pretty Bayou residents.
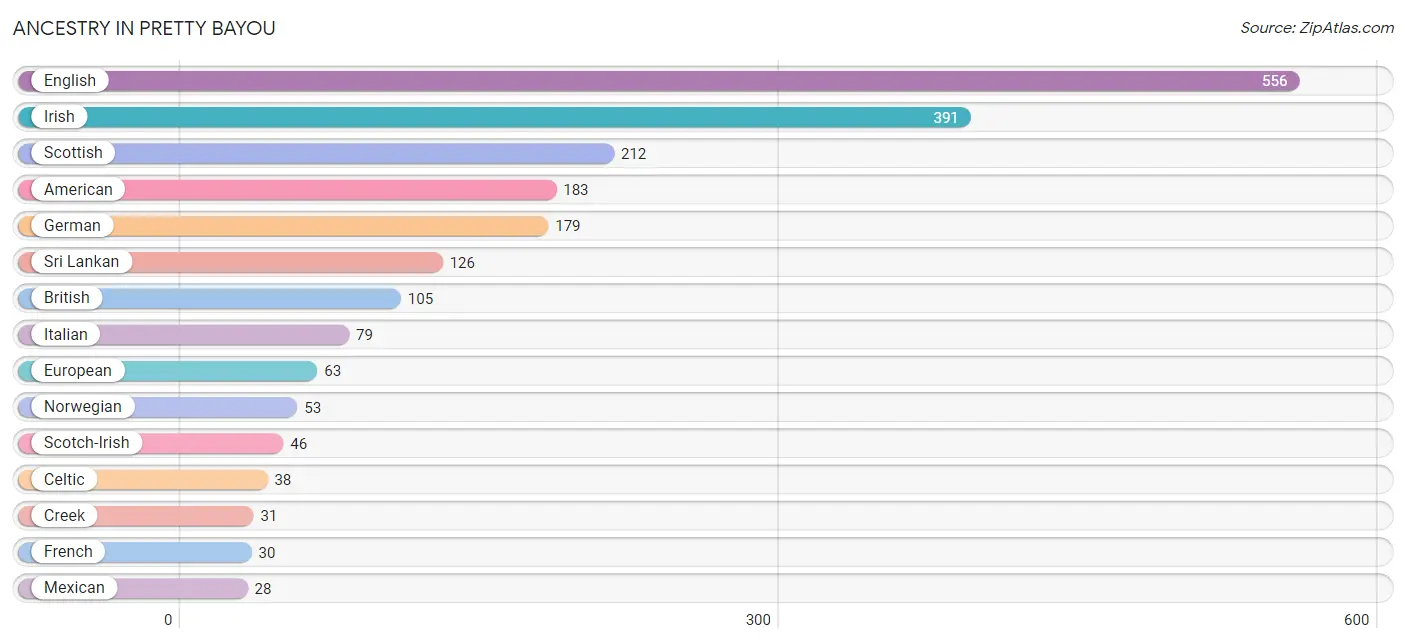
| Ancestry | # Population | % Population |
| African | 25 | 1.0% |
| American | 183 | 7.4% |
| Australian | 10 | 0.4% |
| Austrian | 11 | 0.4% |
| British | 105 | 4.3% |
| Celtic | 38 | 1.5% |
| Creek | 31 | 1.3% |
| Danish | 10 | 0.4% |
| Dutch | 11 | 0.4% |
| English | 556 | 22.5% |
| European | 63 | 2.5% |
| French | 30 | 1.2% |
| French American Indian | 3 | 0.1% |
| French Canadian | 14 | 0.6% |
| German | 179 | 7.2% |
| Indian (Asian) | 25 | 1.0% |
| Irish | 391 | 15.8% |
| Italian | 79 | 3.2% |
| Mexican | 28 | 1.1% |
| Northern European | 19 | 0.8% |
| Norwegian | 53 | 2.1% |
| Puerto Rican | 20 | 0.8% |
| Russian | 28 | 1.1% |
| Scotch-Irish | 46 | 1.9% |
| Scottish | 212 | 8.6% |
| Sri Lankan | 126 | 5.1% |
| Subsaharan African | 25 | 1.0% |
| Swedish | 9 | 0.4% |
| Ukrainian | 20 | 0.8% |
| Welsh | 18 | 0.7% | View All 30 Rows |
Immigrants in Pretty Bayou
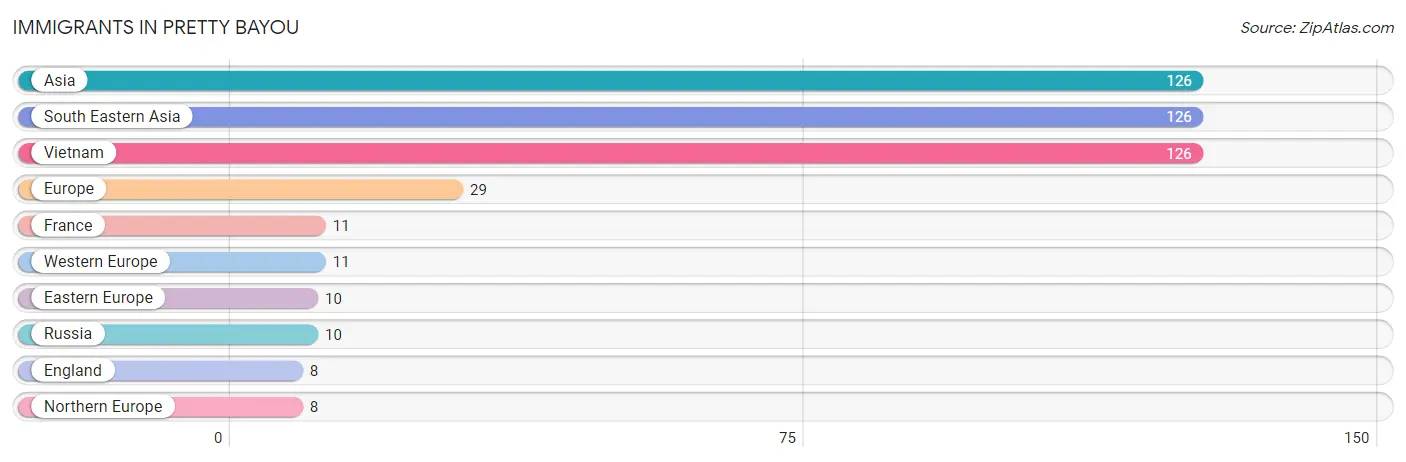
The most numerous immigrant groups reported in Pretty Bayou came from Asia (126 | 5.1%), South Eastern Asia (126 | 5.1%), Vietnam (126 | 5.1%), Europe (29 | 1.2%), and France (11 | 0.4%), together accounting for 16.9% of all Pretty Bayou residents.
| Immigration Origin | # Population | % Population |
| Asia | 126 | 5.1% |
| Eastern Europe | 10 | 0.4% |
| England | 8 | 0.3% |
| Europe | 29 | 1.2% |
| France | 11 | 0.4% |
| Northern Europe | 8 | 0.3% |
| Russia | 10 | 0.4% |
| South Eastern Asia | 126 | 5.1% |
| Vietnam | 126 | 5.1% |
| Western Europe | 11 | 0.4% | View All 10 Rows |
Sex and Age in Pretty Bayou
Sex and Age in Pretty Bayou
The most populous age groups in Pretty Bayou are 45 to 49 Years (94 | 8.5%) for men and 80 to 84 Years (168 | 12.4%) for women.
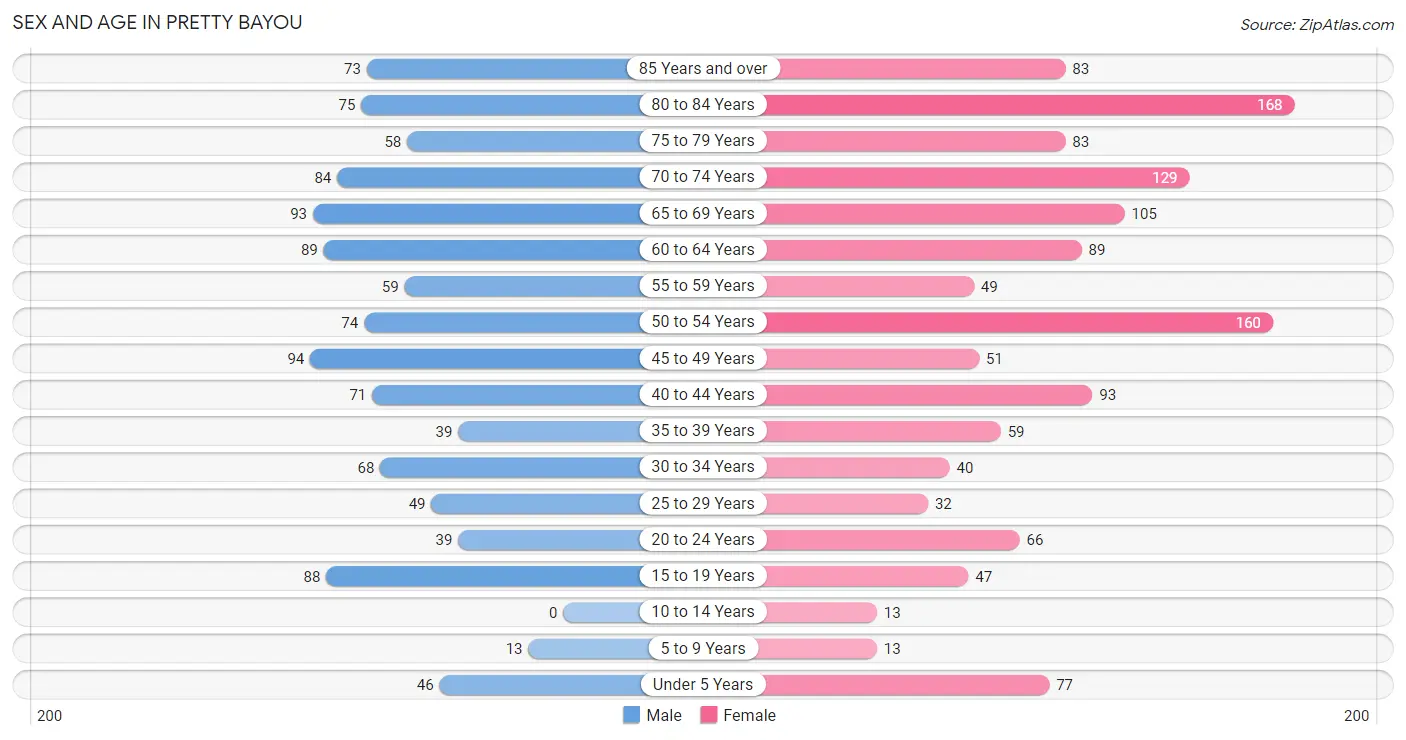
| Age Bracket | Male | Female |
| Under 5 Years | 46 (4.1%) | 77 (5.7%) |
| 5 to 9 Years | 13 (1.2%) | 13 (1.0%) |
| 10 to 14 Years | 0 (0.0%) | 13 (1.0%) |
| 15 to 19 Years | 88 (7.9%) | 47 (3.5%) |
| 20 to 24 Years | 39 (3.5%) | 66 (4.9%) |
| 25 to 29 Years | 49 (4.4%) | 32 (2.4%) |
| 30 to 34 Years | 68 (6.1%) | 40 (2.9%) |
| 35 to 39 Years | 39 (3.5%) | 59 (4.3%) |
| 40 to 44 Years | 71 (6.4%) | 93 (6.9%) |
| 45 to 49 Years | 94 (8.5%) | 51 (3.8%) |
| 50 to 54 Years | 74 (6.7%) | 160 (11.8%) |
| 55 to 59 Years | 59 (5.3%) | 49 (3.6%) |
| 60 to 64 Years | 89 (8.0%) | 89 (6.6%) |
| 65 to 69 Years | 93 (8.4%) | 105 (7.7%) |
| 70 to 74 Years | 84 (7.5%) | 129 (9.5%) |
| 75 to 79 Years | 58 (5.2%) | 83 (6.1%) |
| 80 to 84 Years | 75 (6.7%) | 168 (12.4%) |
| 85 Years and over | 73 (6.6%) | 83 (6.1%) |
| Total | 1,112 (100.0%) | 1,357 (100.0%) |
Families and Households in Pretty Bayou
Median Family Size in Pretty Bayou
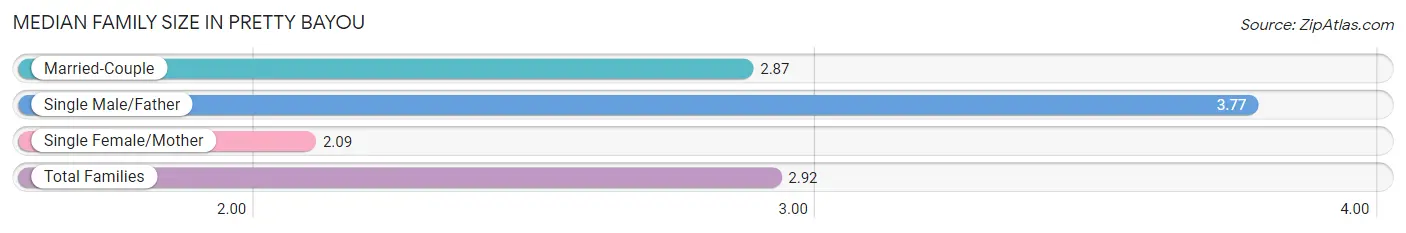
The median family size in Pretty Bayou is 2.92 persons per family, with single male/father families (64 | 10.5%) accounting for the largest median family size of 3.77 persons per family. On the other hand, single female/mother families (34 | 5.6%) represent the smallest median family size with 2.09 persons per family.
| Family Type | # Families | Family Size |
| Married-Couple | 513 (84.0%) | 2.87 |
| Single Male/Father | 64 (10.5%) | 3.77 |
| Single Female/Mother | 34 (5.6%) | 2.09 |
| Total Families | 611 (100.0%) | 2.92 |
Median Household Size in Pretty Bayou
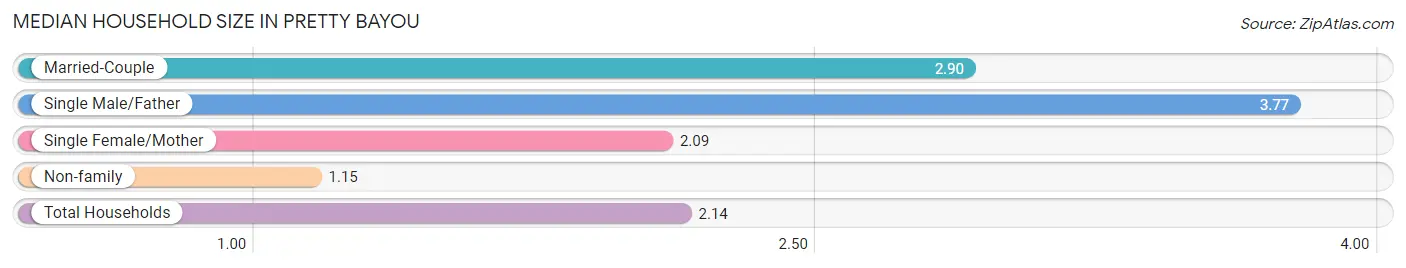
The median household size in Pretty Bayou is 2.14 persons per household, with single male/father households (64 | 5.8%) accounting for the largest median household size of 3.77 persons per household. non-family households (491 | 44.6%) represent the smallest median household size with 1.15 persons per household.
| Household Type | # Households | Household Size |
| Married-Couple | 513 (46.6%) | 2.90 |
| Single Male/Father | 64 (5.8%) | 3.77 |
| Single Female/Mother | 34 (3.1%) | 2.09 |
| Non-family | 491 (44.6%) | 1.15 |
| Total Households | 1,102 (100.0%) | 2.14 |
Household Size by Marriage Status in Pretty Bayou
Out of a total of 1,102 households in Pretty Bayou, 611 (55.4%) are family households, while 491 (44.6%) are nonfamily households. The most numerous type of family households are 2-person households, comprising 356, and the most common type of nonfamily households are 1-person households, comprising 455.
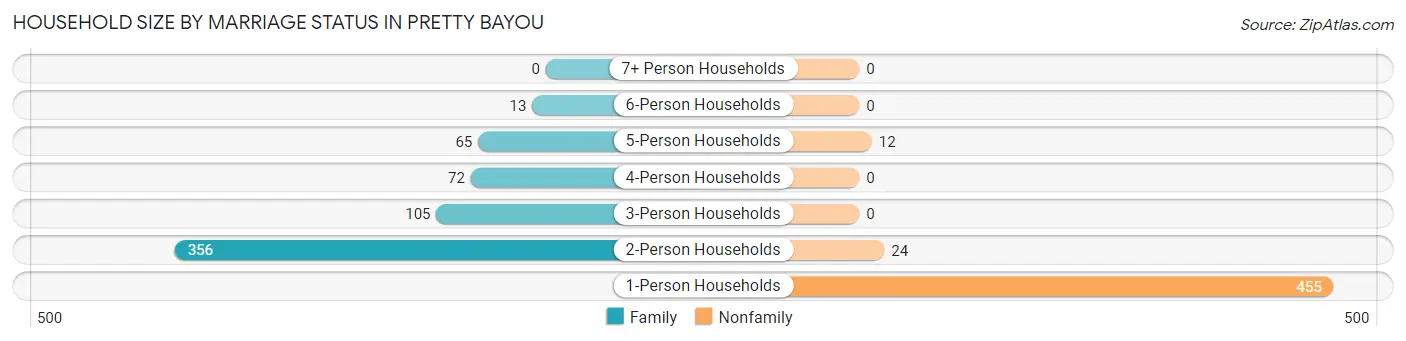
| Household Size | Family Households | Nonfamily Households |
| 1-Person Households | - | 455 (41.3%) |
| 2-Person Households | 356 (32.3%) | 24 (2.2%) |
| 3-Person Households | 105 (9.5%) | 0 (0.0%) |
| 4-Person Households | 72 (6.5%) | 0 (0.0%) |
| 5-Person Households | 65 (5.9%) | 12 (1.1%) |
| 6-Person Households | 13 (1.2%) | 0 (0.0%) |
| 7+ Person Households | 0 (0.0%) | 0 (0.0%) |
| Total | 611 (55.4%) | 491 (44.6%) |
Female Fertility in Pretty Bayou
Fertility by Age in Pretty Bayou
Average fertility rate in Pretty Bayou is 93.0 births per 1,000 women. Women in the age bracket of 20 to 34 years have the highest fertility rate with 261.0 births per 1,000 women. Women in the age bracket of 20 to 34 years acount for 100.0% of all women with births.
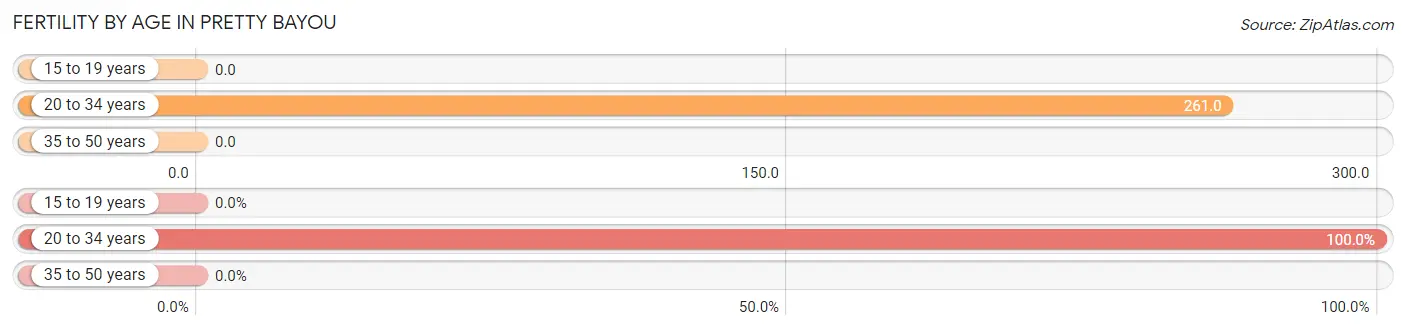
| Age Bracket | Women with Births | Births / 1,000 Women |
| 15 to 19 years | 0 (0.0%) | 0.0 |
| 20 to 34 years | 36 (100.0%) | 261.0 |
| 35 to 50 years | 0 (0.0%) | 0.0 |
| Total | 36 (100.0%) | 93.0 |
Fertility by Age by Marriage Status in Pretty Bayou
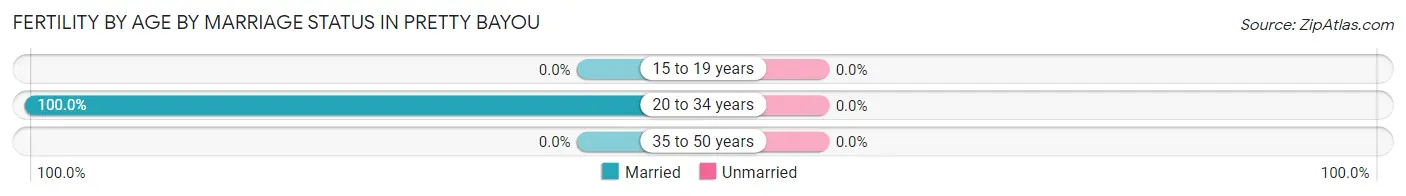
| Age Bracket | Married | Unmarried |
| 15 to 19 years | 0 (0.0%) | 0 (0.0%) |
| 20 to 34 years | 36 (100.0%) | 0 (0.0%) |
| 35 to 50 years | 0 (0.0%) | 0 (0.0%) |
| Total | 36 (100.0%) | 0 (0.0%) |
Fertility by Education in Pretty Bayou
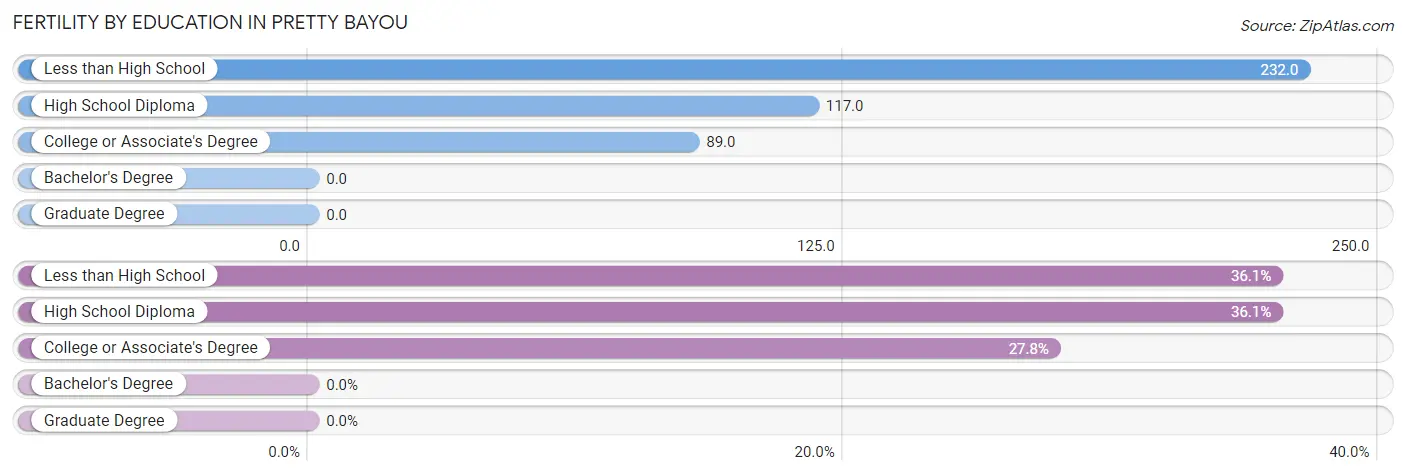
| Educational Attainment | Women with Births | Births / 1,000 Women |
| Less than High School | 13 (36.1%) | 232.0 |
| High School Diploma | 13 (36.1%) | 117.0 |
| College or Associate's Degree | 10 (27.8%) | 89.0 |
| Bachelor's Degree | 0 (0.0%) | 0.0 |
| Graduate Degree | 0 (0.0%) | 0.0 |
| Total | 36 (100.0%) | 93.0 |
Fertility by Education by Marriage Status in Pretty Bayou
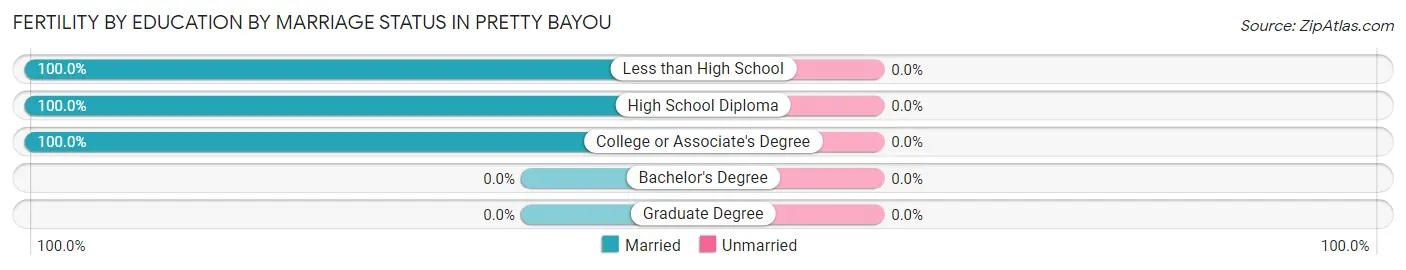
| Educational Attainment | Married | Unmarried |
| Less than High School | 13 (100.0%) | 0 (0.0%) |
| High School Diploma | 13 (100.0%) | 0 (0.0%) |
| College or Associate's Degree | 10 (100.0%) | 0 (0.0%) |
| Bachelor's Degree | 0 (0.0%) | 0 (0.0%) |
| Graduate Degree | 0 (0.0%) | 0 (0.0%) |
| Total | 36 (100.0%) | 0 (0.0%) |
Employment Characteristics in Pretty Bayou
Employment by Class of Employer in Pretty Bayou
Among the 1,015 employed individuals in Pretty Bayou, private company employees (559 | 55.1%), federal government employees (276 | 27.2%), and state government employees (48 | 4.7%) make up the most common classes of employment.
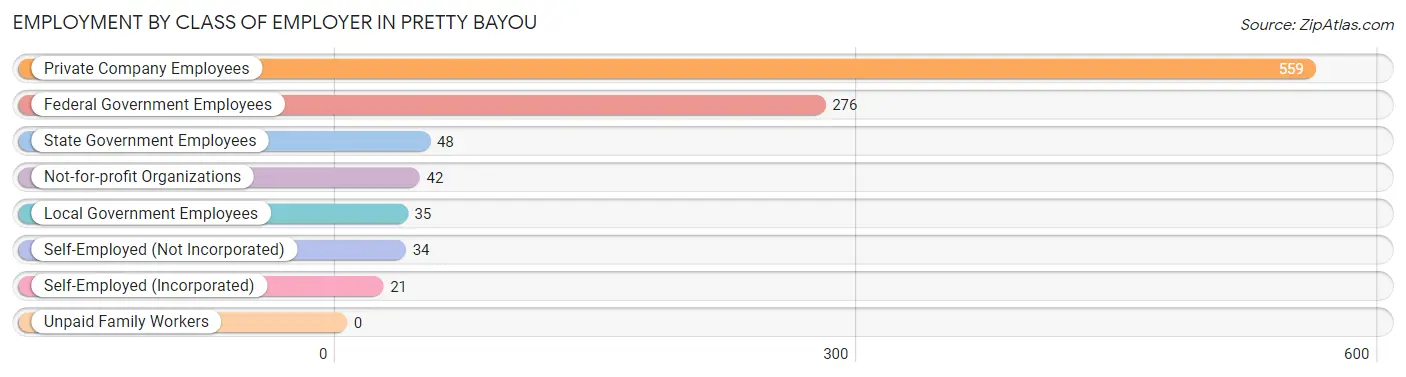
| Employer Class | # Employees | % Employees |
| Private Company Employees | 559 | 55.1% |
| Self-Employed (Incorporated) | 21 | 2.1% |
| Self-Employed (Not Incorporated) | 34 | 3.4% |
| Not-for-profit Organizations | 42 | 4.1% |
| Local Government Employees | 35 | 3.5% |
| State Government Employees | 48 | 4.7% |
| Federal Government Employees | 276 | 27.2% |
| Unpaid Family Workers | 0 | 0.0% |
| Total | 1,015 | 100.0% |
Employment Status by Age in Pretty Bayou
According to the labor force statistics for Pretty Bayou, out of the total population over 16 years of age (2,259), 48.9% or 1,105 individuals are in the labor force, with 8.4% or 93 of them unemployed. The age group with the highest labor force participation rate is 20 to 24 years, with 89.5% or 94 individuals in the labor force. Within the labor force, the 35 to 44 years age range has the highest percentage of unemployed individuals, with 20.2% or 44 of them being unemployed.
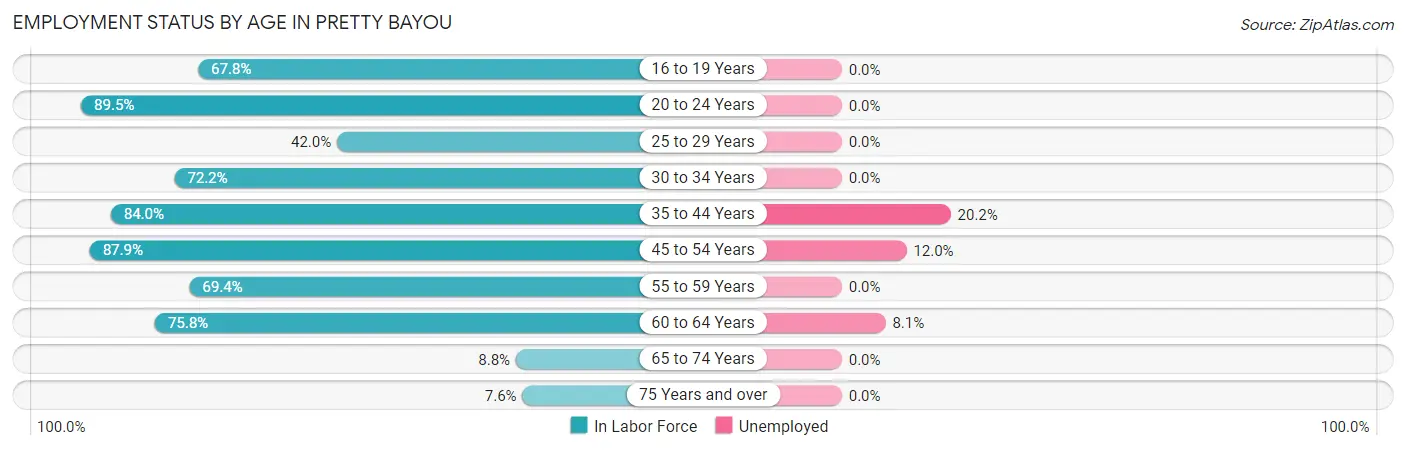
| Age Bracket | In Labor Force | Unemployed |
| 16 to 19 Years | 59 (67.8%) | 0 (0.0%) |
| 20 to 24 Years | 94 (89.5%) | 0 (0.0%) |
| 25 to 29 Years | 34 (42.0%) | 0 (0.0%) |
| 30 to 34 Years | 78 (72.2%) | 0 (0.0%) |
| 35 to 44 Years | 220 (84.0%) | 44 (20.2%) |
| 45 to 54 Years | 333 (87.9%) | 40 (12.0%) |
| 55 to 59 Years | 75 (69.4%) | 0 (0.0%) |
| 60 to 64 Years | 135 (75.8%) | 11 (8.1%) |
| 65 to 74 Years | 36 (8.8%) | 0 (0.0%) |
| 75 Years and over | 41 (7.6%) | 0 (0.0%) |
| Total | 1,105 (48.9%) | 93 (8.4%) |
Employment Status by Educational Attainment in Pretty Bayou
According to labor force statistics for Pretty Bayou, 78.4% of individuals (875) out of the total population between 25 and 64 years of age (1,116) are in the labor force, with 10.7% or 94 of them being unemployed. The group with the highest labor force participation rate are those with the educational attainment of less than high school, with 100.0% or 16 individuals in the labor force. Within the labor force, individuals with college / associate degree education have the highest percentage of unemployment, with 12.7% or 54 of them being unemployed.
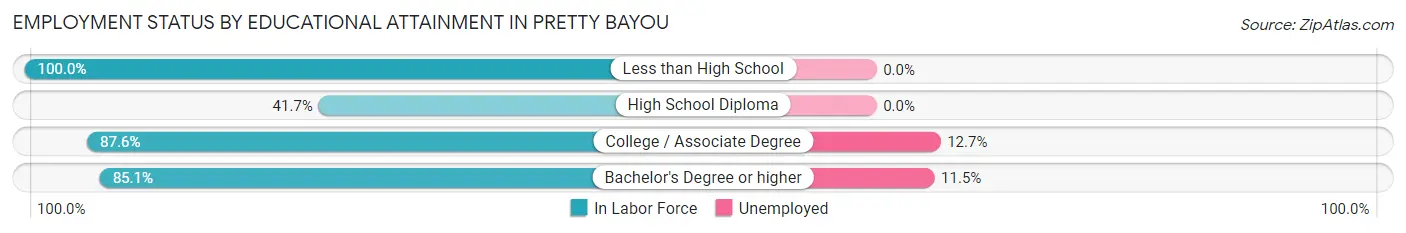
| Educational Attainment | In Labor Force | Unemployed |
| Less than High School | 16 (100.0%) | 0 (0.0%) |
| High School Diploma | 86 (41.7%) | 0 (0.0%) |
| College / Associate Degree | 425 (87.6%) | 62 (12.7%) |
| Bachelor's Degree or higher | 348 (85.1%) | 47 (11.5%) |
| Total | 875 (78.4%) | 119 (10.7%) |
Employment Occupations by Sex in Pretty Bayou
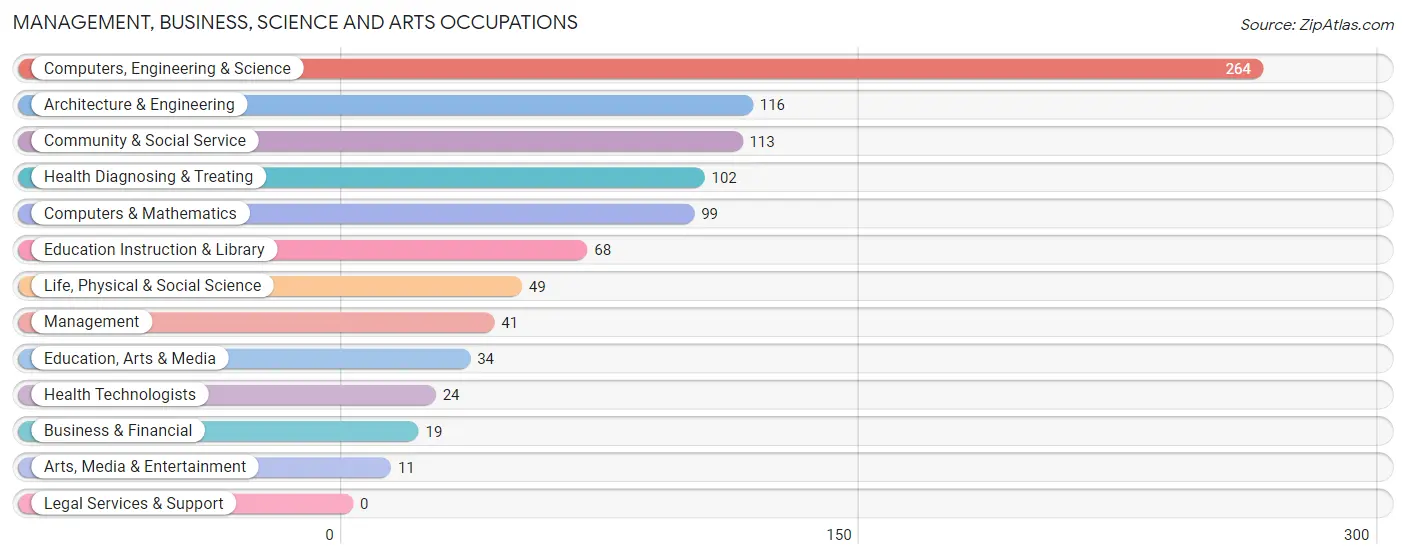
Management, Business, Science and Arts Occupations
The most common Management, Business, Science and Arts occupations in Pretty Bayou are Computers, Engineering & Science (264 | 26.8%), Architecture & Engineering (116 | 11.8%), Community & Social Service (113 | 11.5%), Health Diagnosing & Treating (102 | 10.4%), and Computers & Mathematics (99 | 10.1%).
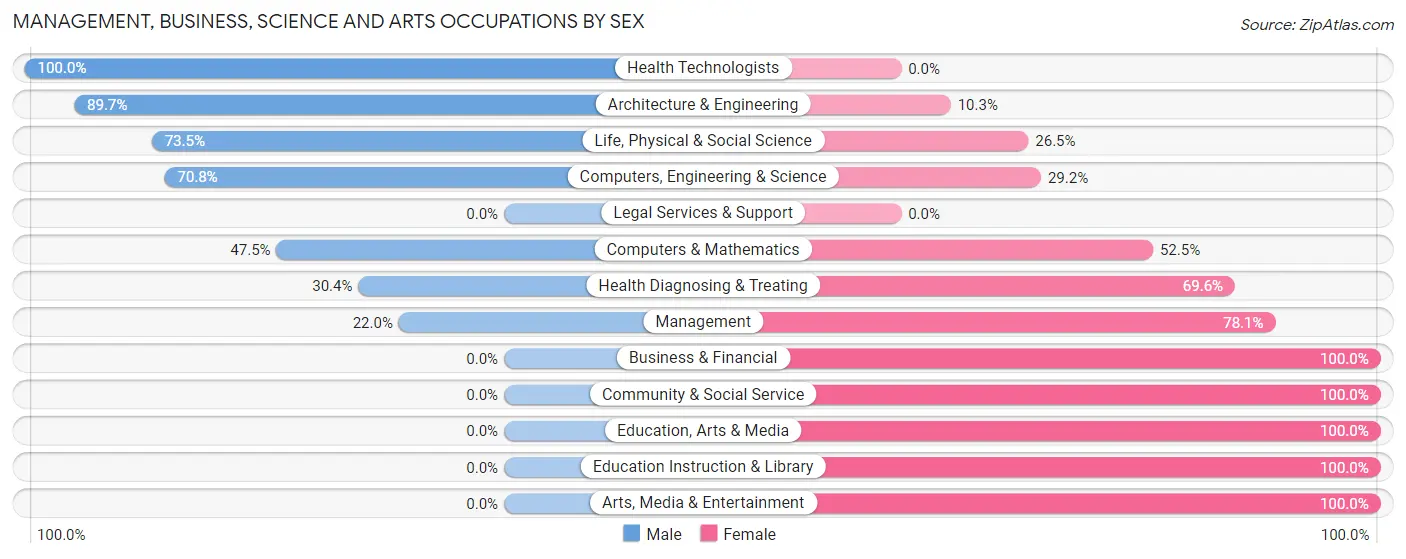
Management, Business, Science and Arts Occupations by Sex
Within the Management, Business, Science and Arts occupations in Pretty Bayou, the most male-oriented occupations are Health Technologists (100.0%), Architecture & Engineering (89.7%), and Life, Physical & Social Science (73.5%), while the most female-oriented occupations are Business & Financial (100.0%), Community & Social Service (100.0%), and Education, Arts & Media (100.0%).
| Occupation | Male | Female |
| Management | 9 (22.0%) | 32 (78.0%) |
| Business & Financial | 0 (0.0%) | 19 (100.0%) |
| Computers, Engineering & Science | 187 (70.8%) | 77 (29.2%) |
| Computers & Mathematics | 47 (47.5%) | 52 (52.5%) |
| Architecture & Engineering | 104 (89.7%) | 12 (10.3%) |
| Life, Physical & Social Science | 36 (73.5%) | 13 (26.5%) |
| Community & Social Service | 0 (0.0%) | 113 (100.0%) |
| Education, Arts & Media | 0 (0.0%) | 34 (100.0%) |
| Legal Services & Support | 0 (0.0%) | 0 (0.0%) |
| Education Instruction & Library | 0 (0.0%) | 68 (100.0%) |
| Arts, Media & Entertainment | 0 (0.0%) | 11 (100.0%) |
| Health Diagnosing & Treating | 31 (30.4%) | 71 (69.6%) |
| Health Technologists | 24 (100.0%) | 0 (0.0%) |
| Total (Category) | 227 (42.1%) | 312 (57.9%) |
| Total (Overall) | 448 (45.5%) | 537 (54.5%) |
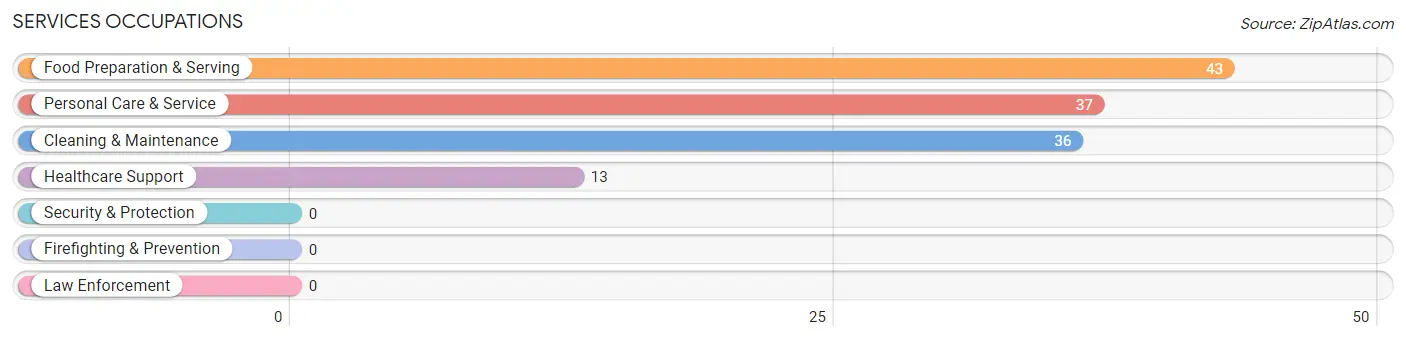
Services Occupations
The most common Services occupations in Pretty Bayou are Food Preparation & Serving (43 | 4.4%), Personal Care & Service (37 | 3.8%), Cleaning & Maintenance (36 | 3.6%), and Healthcare Support (13 | 1.3%).
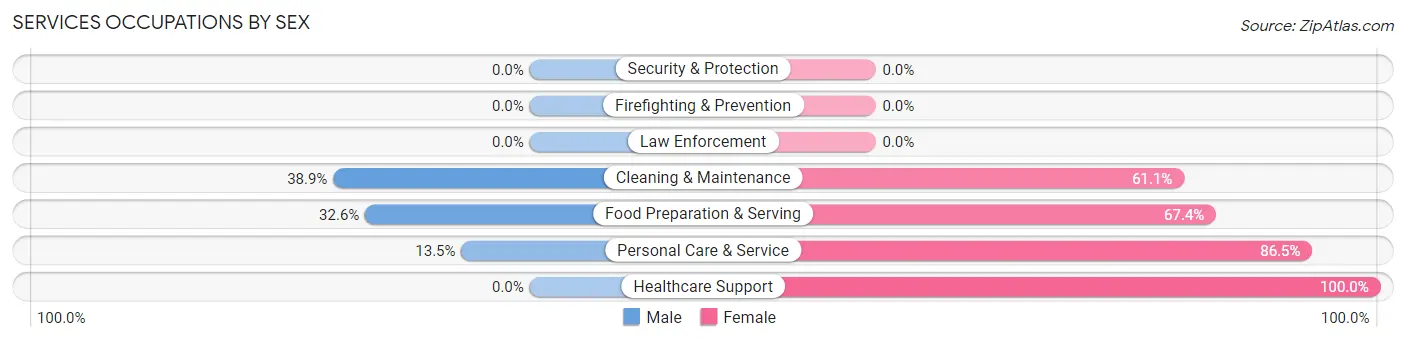
Services Occupations by Sex
Within the Services occupations in Pretty Bayou, the most male-oriented occupations are Cleaning & Maintenance (38.9%), Food Preparation & Serving (32.6%), and Personal Care & Service (13.5%), while the most female-oriented occupations are Healthcare Support (100.0%), Personal Care & Service (86.5%), and Food Preparation & Serving (67.4%).
| Occupation | Male | Female |
| Healthcare Support | 0 (0.0%) | 13 (100.0%) |
| Security & Protection | 0 (0.0%) | 0 (0.0%) |
| Firefighting & Prevention | 0 (0.0%) | 0 (0.0%) |
| Law Enforcement | 0 (0.0%) | 0 (0.0%) |
| Food Preparation & Serving | 14 (32.6%) | 29 (67.4%) |
| Cleaning & Maintenance | 14 (38.9%) | 22 (61.1%) |
| Personal Care & Service | 5 (13.5%) | 32 (86.5%) |
| Total (Category) | 33 (25.6%) | 96 (74.4%) |
| Total (Overall) | 448 (45.5%) | 537 (54.5%) |
Sales and Office Occupations
The most common Sales and Office occupations in Pretty Bayou are Office & Administration (90 | 9.1%), and Sales & Related (47 | 4.8%).
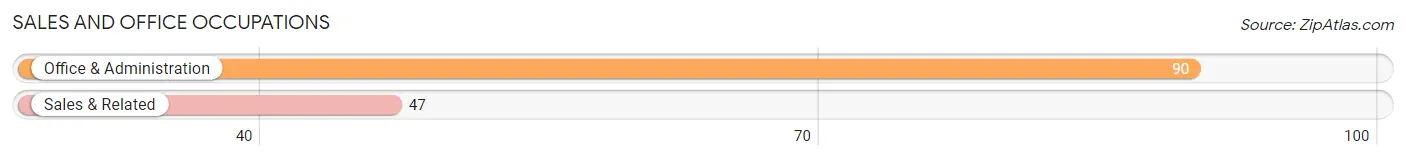
Sales and Office Occupations by Sex
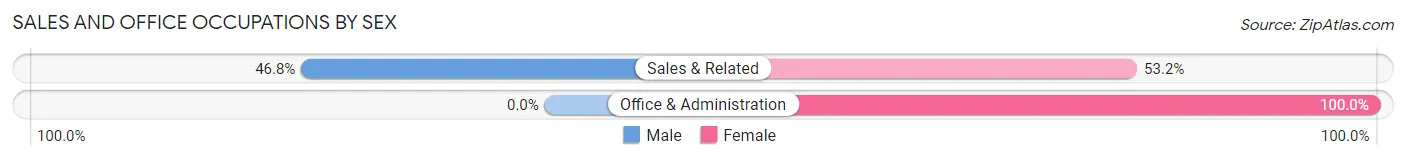
| Occupation | Male | Female |
| Sales & Related | 22 (46.8%) | 25 (53.2%) |
| Office & Administration | 0 (0.0%) | 90 (100.0%) |
| Total (Category) | 22 (16.1%) | 115 (83.9%) |
| Total (Overall) | 448 (45.5%) | 537 (54.5%) |
Natural Resources, Construction and Maintenance Occupations
The most common Natural Resources, Construction and Maintenance occupations in Pretty Bayou are Construction & Extraction (20 | 2.0%), Installation, Maintenance & Repair (19 | 1.9%), and Farming, Fishing & Forestry (5 | 0.5%).
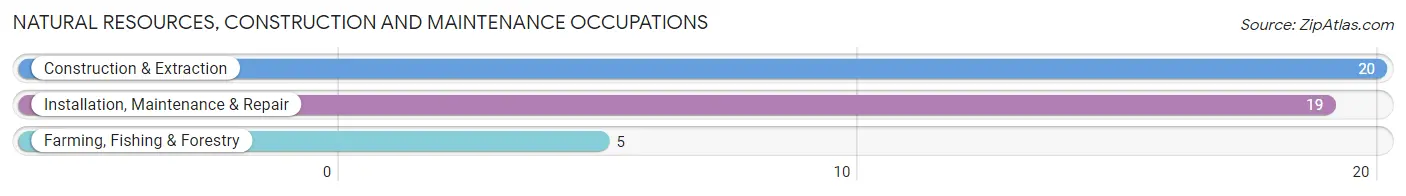
Natural Resources, Construction and Maintenance Occupations by Sex
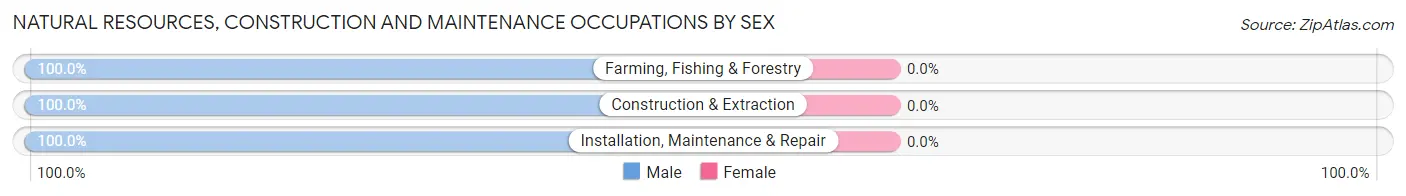
| Occupation | Male | Female |
| Farming, Fishing & Forestry | 5 (100.0%) | 0 (0.0%) |
| Construction & Extraction | 20 (100.0%) | 0 (0.0%) |
| Installation, Maintenance & Repair | 19 (100.0%) | 0 (0.0%) |
| Total (Category) | 44 (100.0%) | 0 (0.0%) |
| Total (Overall) | 448 (45.5%) | 537 (54.5%) |
Production, Transportation and Moving Occupations
The most common Production, Transportation and Moving occupations in Pretty Bayou are Material Moving (105 | 10.7%), and Transportation (31 | 3.2%).
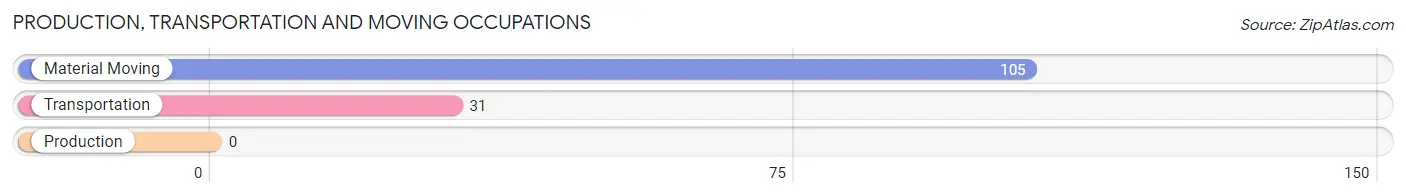
Production, Transportation and Moving Occupations by Sex
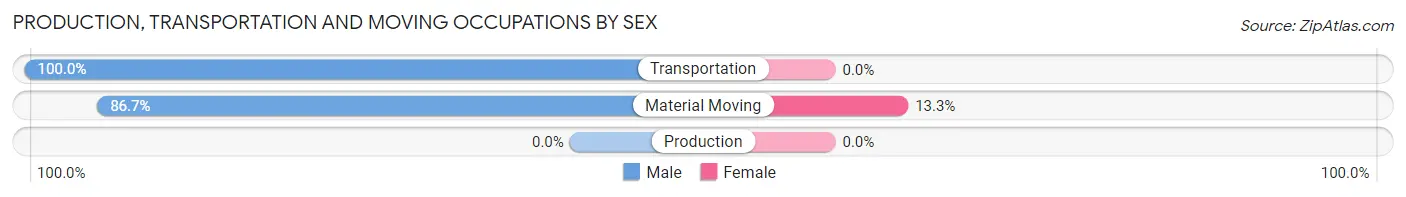
| Occupation | Male | Female |
| Production | 0 (0.0%) | 0 (0.0%) |
| Transportation | 31 (100.0%) | 0 (0.0%) |
| Material Moving | 91 (86.7%) | 14 (13.3%) |
| Total (Category) | 122 (89.7%) | 14 (10.3%) |
| Total (Overall) | 448 (45.5%) | 537 (54.5%) |
Employment Industries by Sex in Pretty Bayou
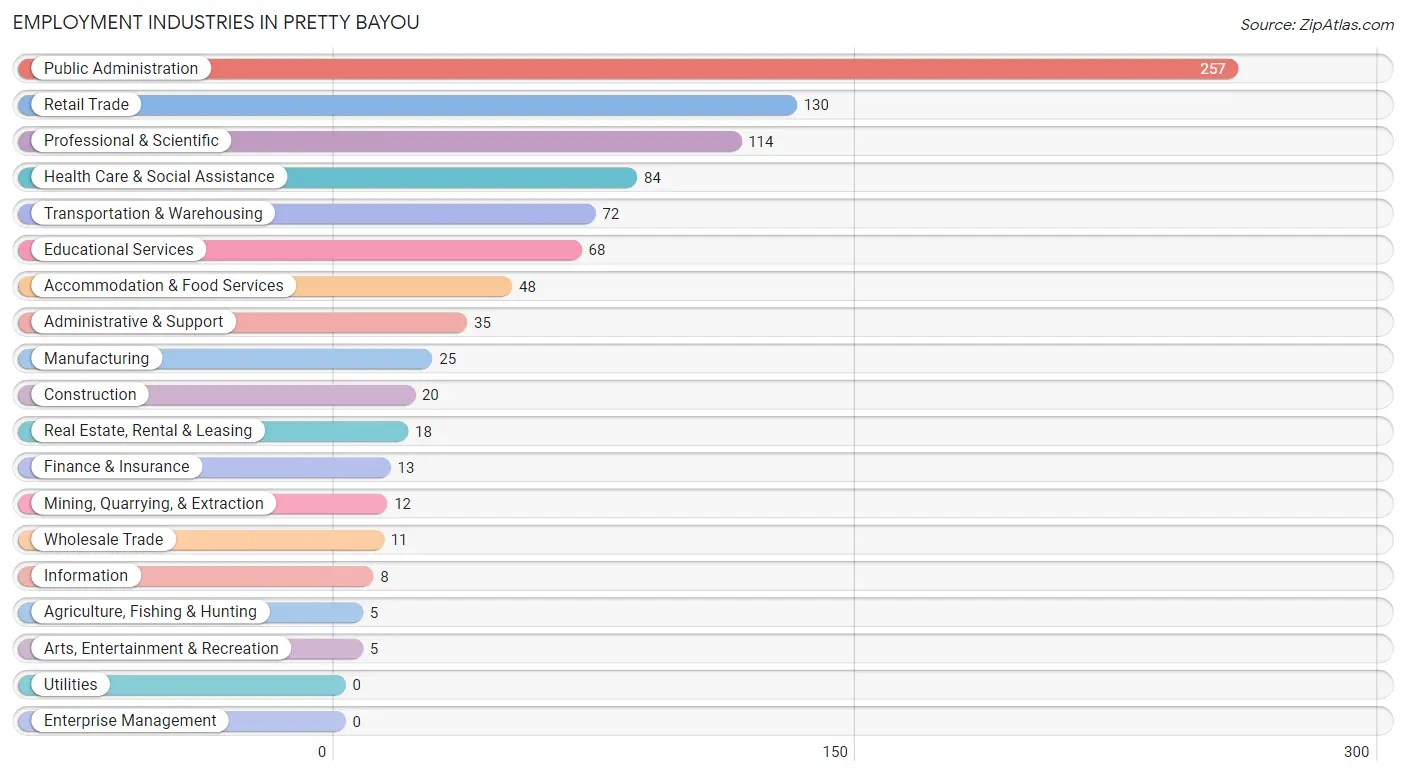
Employment Industries in Pretty Bayou
The major employment industries in Pretty Bayou include Public Administration (257 | 26.1%), Retail Trade (130 | 13.2%), Professional & Scientific (114 | 11.6%), Health Care & Social Assistance (84 | 8.5%), and Transportation & Warehousing (72 | 7.3%).
Employment Industries by Sex in Pretty Bayou
The Pretty Bayou industries that see more men than women are Agriculture, Fishing & Hunting (100.0%), Mining, Quarrying, & Extraction (100.0%), and Construction (100.0%), whereas the industries that tend to have a higher number of women are Information (100.0%), Finance & Insurance (100.0%), and Educational Services (100.0%).
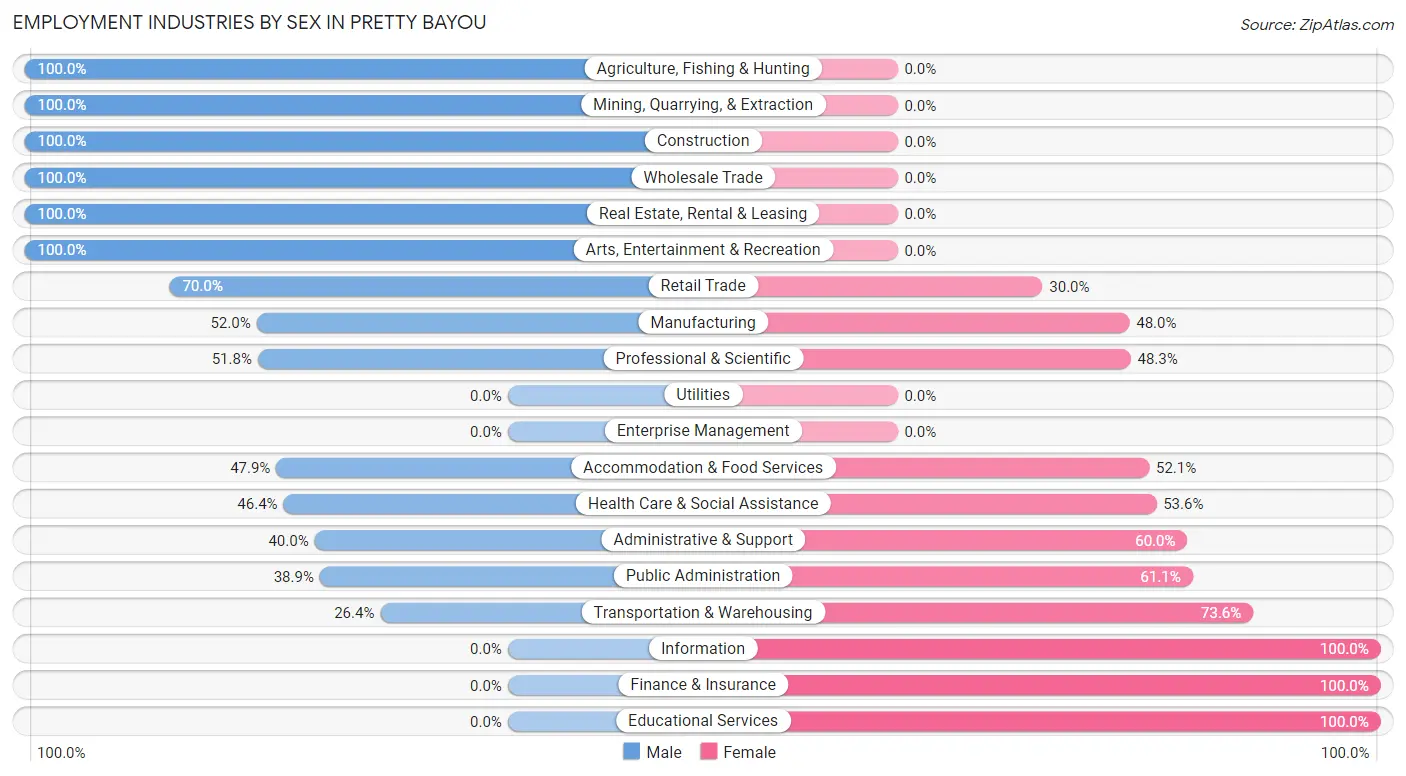
| Industry | Male | Female |
| Agriculture, Fishing & Hunting | 5 (100.0%) | 0 (0.0%) |
| Mining, Quarrying, & Extraction | 12 (100.0%) | 0 (0.0%) |
| Construction | 20 (100.0%) | 0 (0.0%) |
| Manufacturing | 13 (52.0%) | 12 (48.0%) |
| Wholesale Trade | 11 (100.0%) | 0 (0.0%) |
| Retail Trade | 91 (70.0%) | 39 (30.0%) |
| Transportation & Warehousing | 19 (26.4%) | 53 (73.6%) |
| Utilities | 0 (0.0%) | 0 (0.0%) |
| Information | 0 (0.0%) | 8 (100.0%) |
| Finance & Insurance | 0 (0.0%) | 13 (100.0%) |
| Real Estate, Rental & Leasing | 18 (100.0%) | 0 (0.0%) |
| Professional & Scientific | 59 (51.7%) | 55 (48.2%) |
| Enterprise Management | 0 (0.0%) | 0 (0.0%) |
| Administrative & Support | 14 (40.0%) | 21 (60.0%) |
| Educational Services | 0 (0.0%) | 68 (100.0%) |
| Health Care & Social Assistance | 39 (46.4%) | 45 (53.6%) |
| Arts, Entertainment & Recreation | 5 (100.0%) | 0 (0.0%) |
| Accommodation & Food Services | 23 (47.9%) | 25 (52.1%) |
| Public Administration | 100 (38.9%) | 157 (61.1%) |
| Total | 448 (45.5%) | 537 (54.5%) |
Education in Pretty Bayou
School Enrollment in Pretty Bayou
The most common levels of schooling among the 241 students in Pretty Bayou are high school (100 | 41.5%), college / undergraduate (61 | 25.3%), and middle school (28 | 11.6%).
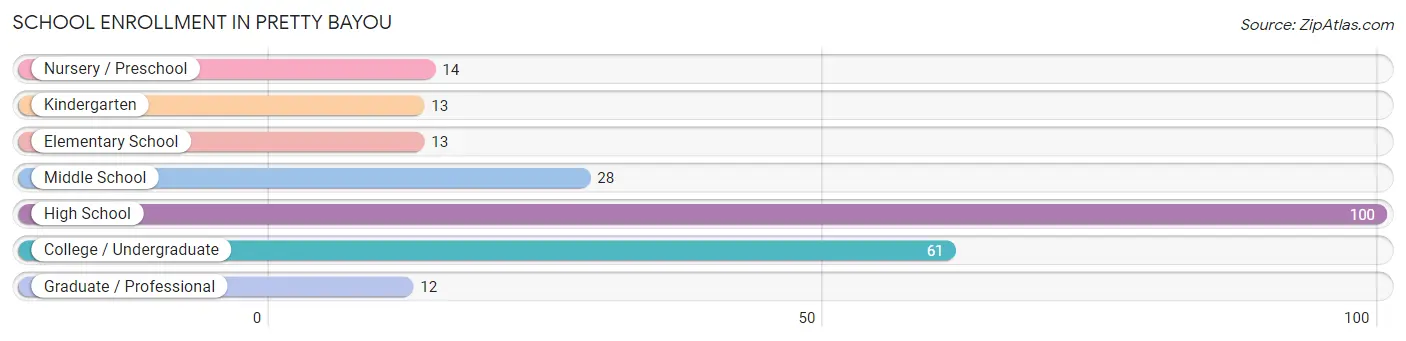
| School Level | # Students | % Students |
| Nursery / Preschool | 14 | 5.8% |
| Kindergarten | 13 | 5.4% |
| Elementary School | 13 | 5.4% |
| Middle School | 28 | 11.6% |
| High School | 100 | 41.5% |
| College / Undergraduate | 61 | 25.3% |
| Graduate / Professional | 12 | 5.0% |
| Total | 241 | 100.0% |
School Enrollment by Age by Funding Source in Pretty Bayou
Out of a total of 241 students who are enrolled in schools in Pretty Bayou, 85 (35.3%) attend a private institution, while the remaining 156 (64.7%) are enrolled in public schools. The age group of 3 to 4 year olds has the highest likelihood of being enrolled in private schools, with 14 (100.0% in the age bracket) enrolled. Conversely, the age group of 5 to 9 year old has the lowest likelihood of being enrolled in a private school, with 26 (100.0% in the age bracket) attending a public institution.
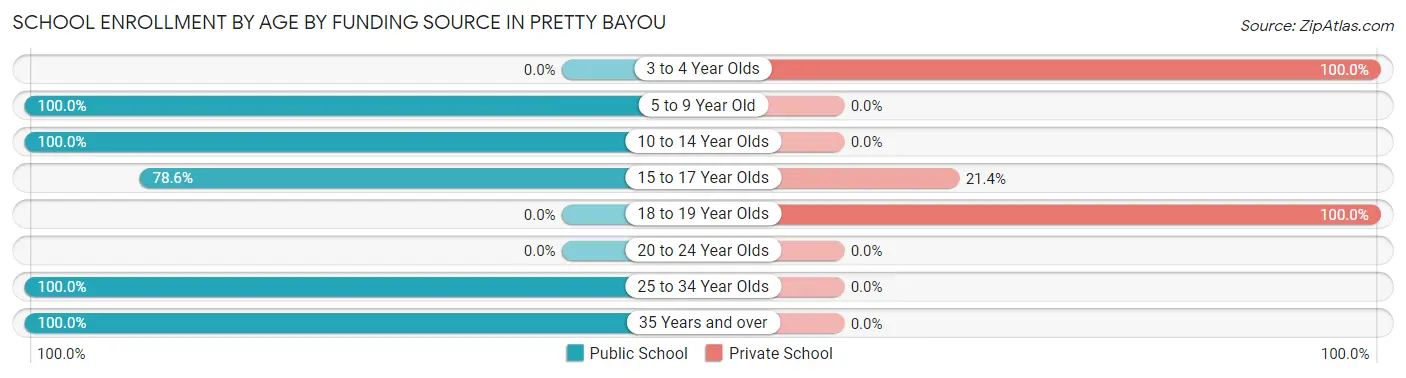
| Age Bracket | Public School | Private School |
| 3 to 4 Year Olds | 0 (0.0%) | 14 (100.0%) |
| 5 to 9 Year Old | 26 (100.0%) | 0 (0.0%) |
| 10 to 14 Year Olds | 13 (100.0%) | 0 (0.0%) |
| 15 to 17 Year Olds | 44 (78.6%) | 12 (21.4%) |
| 18 to 19 Year Olds | 0 (0.0%) | 59 (100.0%) |
| 20 to 24 Year Olds | 0 (0.0%) | 0 (0.0%) |
| 25 to 34 Year Olds | 25 (100.0%) | 0 (0.0%) |
| 35 Years and over | 48 (100.0%) | 0 (0.0%) |
| Total | 156 (64.7%) | 85 (35.3%) |
Educational Attainment by Field of Study in Pretty Bayou
Education (184 | 24.0%), science & technology (182 | 23.8%), engineering (87 | 11.4%), psychology (70 | 9.1%), and business (70 | 9.1%) are the most common fields of study among 766 individuals in Pretty Bayou who have obtained a bachelor's degree or higher.
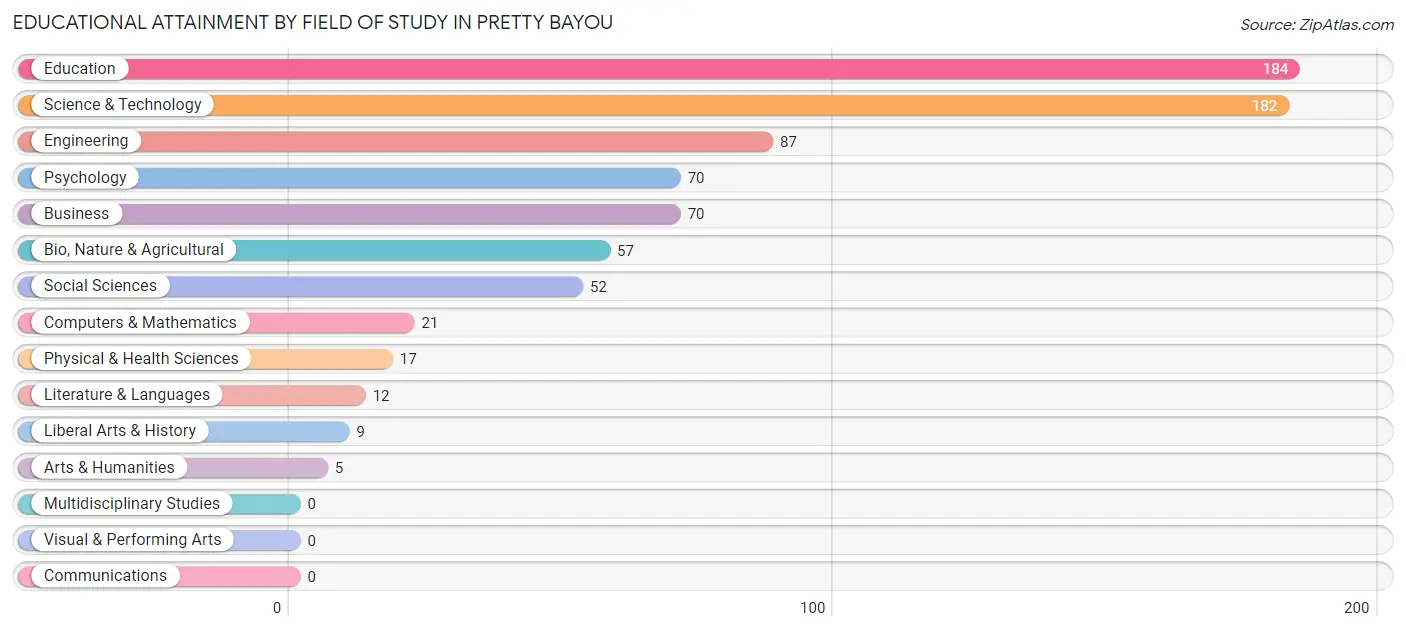
| Field of Study | # Graduates | % Graduates |
| Computers & Mathematics | 21 | 2.7% |
| Bio, Nature & Agricultural | 57 | 7.4% |
| Physical & Health Sciences | 17 | 2.2% |
| Psychology | 70 | 9.1% |
| Social Sciences | 52 | 6.8% |
| Engineering | 87 | 11.4% |
| Multidisciplinary Studies | 0 | 0.0% |
| Science & Technology | 182 | 23.8% |
| Business | 70 | 9.1% |
| Education | 184 | 24.0% |
| Literature & Languages | 12 | 1.6% |
| Liberal Arts & History | 9 | 1.2% |
| Visual & Performing Arts | 0 | 0.0% |
| Communications | 0 | 0.0% |
| Arts & Humanities | 5 | 0.6% |
| Total | 766 | 100.0% |
Transportation & Commute in Pretty Bayou
Vehicle Availability by Sex in Pretty Bayou
The most prevalent vehicle ownership categories in Pretty Bayou are males with 2 vehicles (213, accounting for 44.6%) and females with 2 vehicles (185, making up 39.7%).
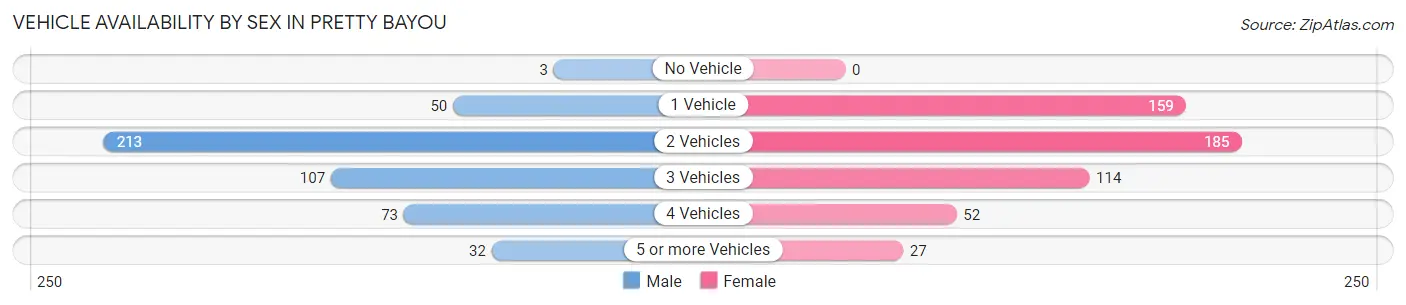
| Vehicles Available | Male | Female |
| No Vehicle | 3 (0.6%) | 0 (0.0%) |
| 1 Vehicle | 50 (10.5%) | 159 (29.6%) |
| 2 Vehicles | 213 (44.6%) | 185 (34.4%) |
| 3 Vehicles | 107 (22.4%) | 114 (21.2%) |
| 4 Vehicles | 73 (15.3%) | 52 (9.7%) |
| 5 or more Vehicles | 32 (6.7%) | 27 (5.0%) |
| Total | 478 (100.0%) | 537 (100.0%) |
Commute Time in Pretty Bayou
The most frequently occuring commute durations in Pretty Bayou are 15 to 19 minutes (290 commuters, 29.2%), 10 to 14 minutes (211 commuters, 21.3%), and 45 to 59 minutes (139 commuters, 14.0%).
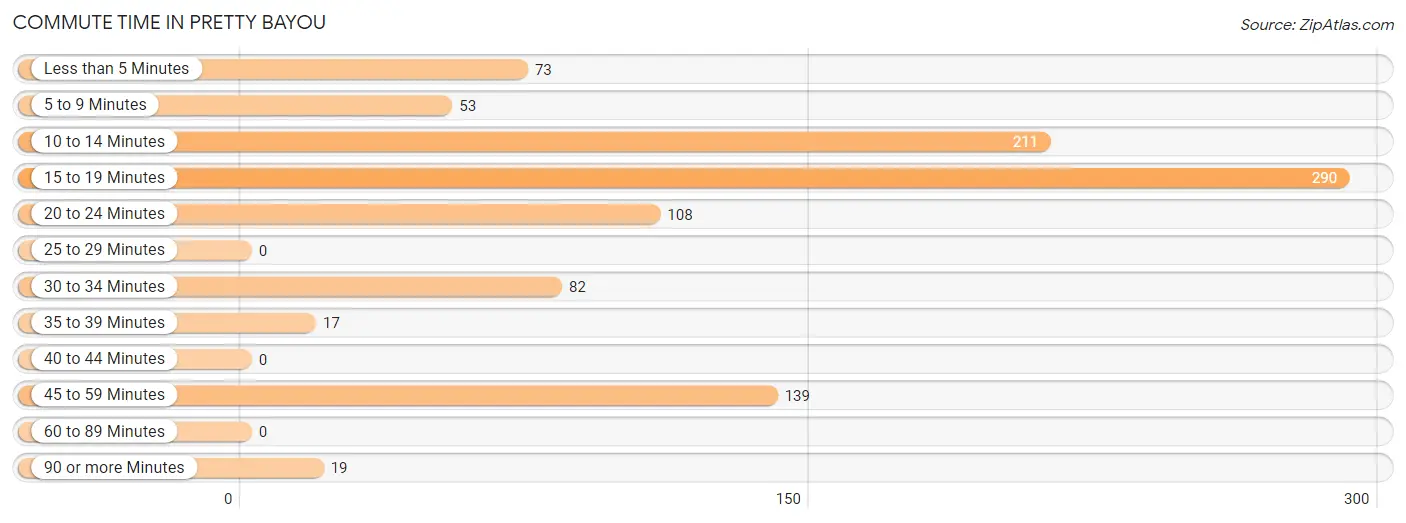
| Commute Time | # Commuters | % Commuters |
| Less than 5 Minutes | 73 | 7.4% |
| 5 to 9 Minutes | 53 | 5.3% |
| 10 to 14 Minutes | 211 | 21.3% |
| 15 to 19 Minutes | 290 | 29.2% |
| 20 to 24 Minutes | 108 | 10.9% |
| 25 to 29 Minutes | 0 | 0.0% |
| 30 to 34 Minutes | 82 | 8.3% |
| 35 to 39 Minutes | 17 | 1.7% |
| 40 to 44 Minutes | 0 | 0.0% |
| 45 to 59 Minutes | 139 | 14.0% |
| 60 to 89 Minutes | 0 | 0.0% |
| 90 or more Minutes | 19 | 1.9% |
Commute Time by Sex in Pretty Bayou
The most common commute times in Pretty Bayou are 15 to 19 minutes (119 commuters, 24.9%) for males and 15 to 19 minutes (171 commuters, 33.3%) for females.
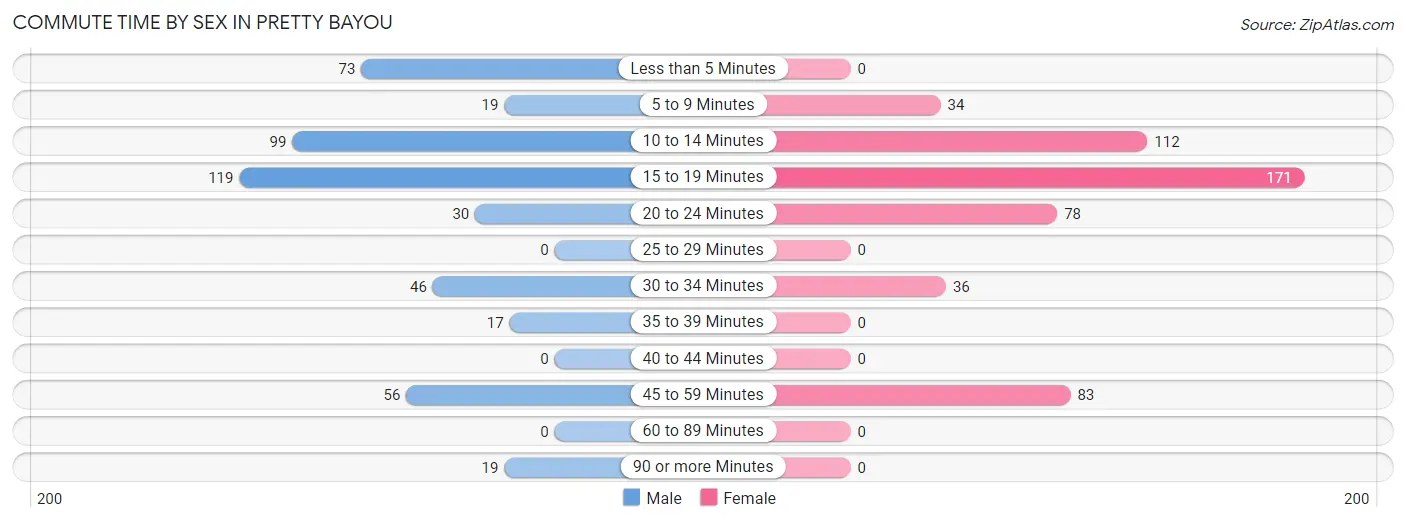
| Commute Time | Male | Female |
| Less than 5 Minutes | 73 (15.3%) | 0 (0.0%) |
| 5 to 9 Minutes | 19 (4.0%) | 34 (6.6%) |
| 10 to 14 Minutes | 99 (20.7%) | 112 (21.8%) |
| 15 to 19 Minutes | 119 (24.9%) | 171 (33.3%) |
| 20 to 24 Minutes | 30 (6.3%) | 78 (15.2%) |
| 25 to 29 Minutes | 0 (0.0%) | 0 (0.0%) |
| 30 to 34 Minutes | 46 (9.6%) | 36 (7.0%) |
| 35 to 39 Minutes | 17 (3.6%) | 0 (0.0%) |
| 40 to 44 Minutes | 0 (0.0%) | 0 (0.0%) |
| 45 to 59 Minutes | 56 (11.7%) | 83 (16.2%) |
| 60 to 89 Minutes | 0 (0.0%) | 0 (0.0%) |
| 90 or more Minutes | 19 (4.0%) | 0 (0.0%) |
Time of Departure to Work by Sex in Pretty Bayou
The most frequent times of departure to work in Pretty Bayou are 7:30 AM to 7:59 AM (134, 28.0%) for males and 6:30 AM to 6:59 AM (209, 40.7%) for females.
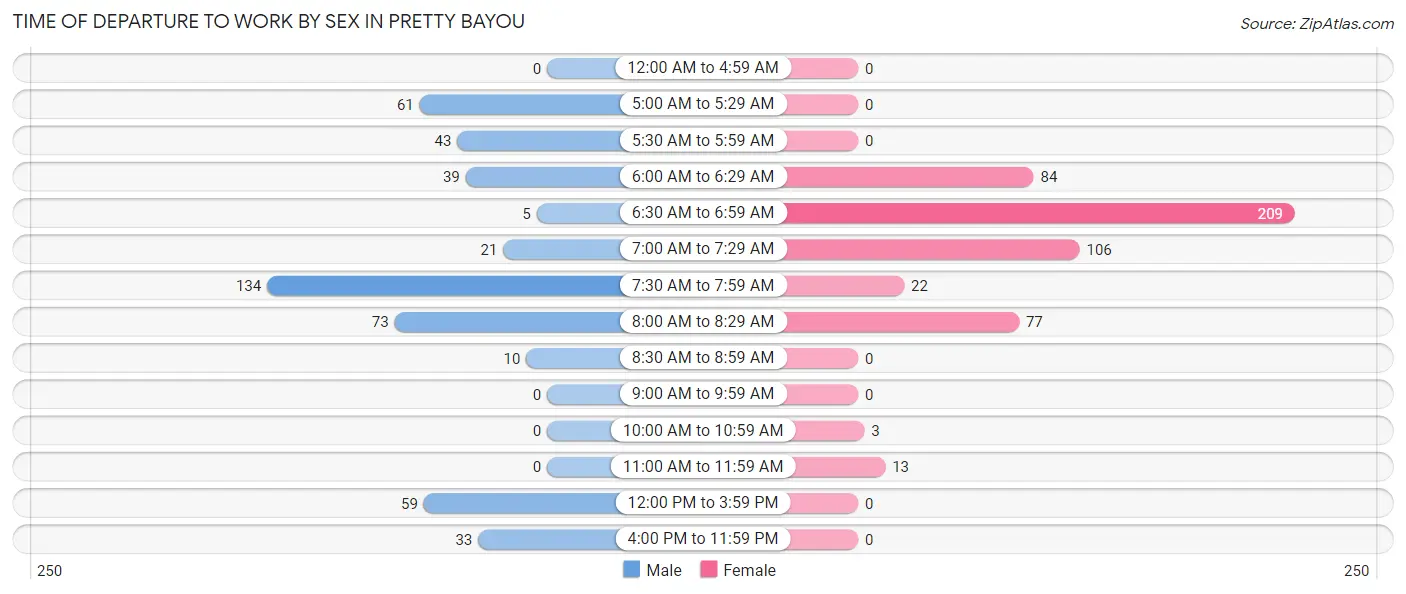
| Time of Departure | Male | Female |
| 12:00 AM to 4:59 AM | 0 (0.0%) | 0 (0.0%) |
| 5:00 AM to 5:29 AM | 61 (12.8%) | 0 (0.0%) |
| 5:30 AM to 5:59 AM | 43 (9.0%) | 0 (0.0%) |
| 6:00 AM to 6:29 AM | 39 (8.2%) | 84 (16.3%) |
| 6:30 AM to 6:59 AM | 5 (1.1%) | 209 (40.7%) |
| 7:00 AM to 7:29 AM | 21 (4.4%) | 106 (20.6%) |
| 7:30 AM to 7:59 AM | 134 (28.0%) | 22 (4.3%) |
| 8:00 AM to 8:29 AM | 73 (15.3%) | 77 (15.0%) |
| 8:30 AM to 8:59 AM | 10 (2.1%) | 0 (0.0%) |
| 9:00 AM to 9:59 AM | 0 (0.0%) | 0 (0.0%) |
| 10:00 AM to 10:59 AM | 0 (0.0%) | 3 (0.6%) |
| 11:00 AM to 11:59 AM | 0 (0.0%) | 13 (2.5%) |
| 12:00 PM to 3:59 PM | 59 (12.3%) | 0 (0.0%) |
| 4:00 PM to 11:59 PM | 33 (6.9%) | 0 (0.0%) |
| Total | 478 (100.0%) | 514 (100.0%) |
Housing Occupancy in Pretty Bayou
Occupancy by Ownership in Pretty Bayou
Of the total 1,102 dwellings in Pretty Bayou, owner-occupied units account for 899 (81.6%), while renter-occupied units make up 203 (18.4%).
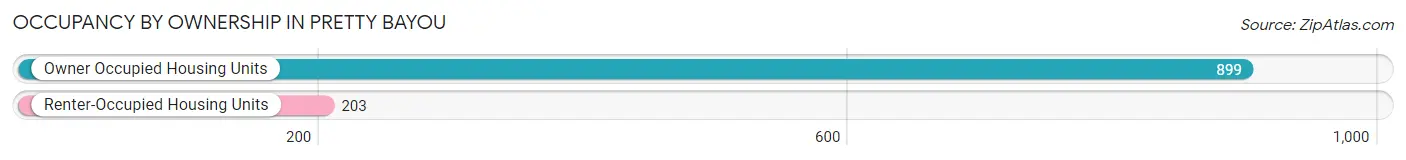
| Occupancy | # Housing Units | % Housing Units |
| Owner Occupied Housing Units | 899 | 81.6% |
| Renter-Occupied Housing Units | 203 | 18.4% |
| Total Occupied Housing Units | 1,102 | 100.0% |
Occupancy by Household Size in Pretty Bayou
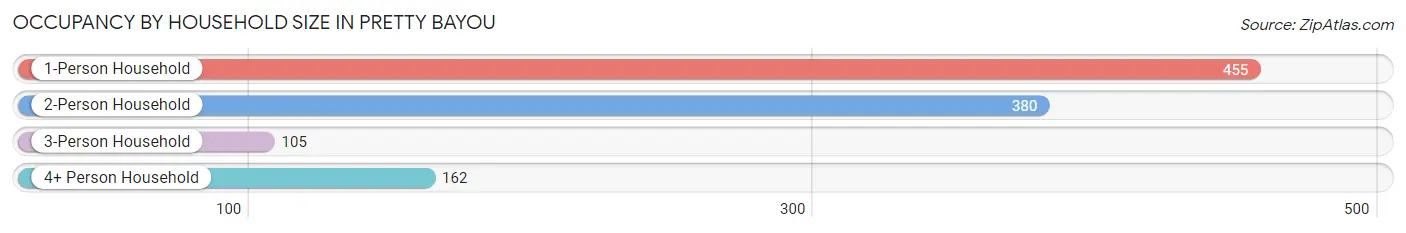
| Household Size | # Housing Units | % Housing Units |
| 1-Person Household | 455 | 41.3% |
| 2-Person Household | 380 | 34.5% |
| 3-Person Household | 105 | 9.5% |
| 4+ Person Household | 162 | 14.7% |
| Total Housing Units | 1,102 | 100.0% |
Occupancy by Ownership by Household Size in Pretty Bayou
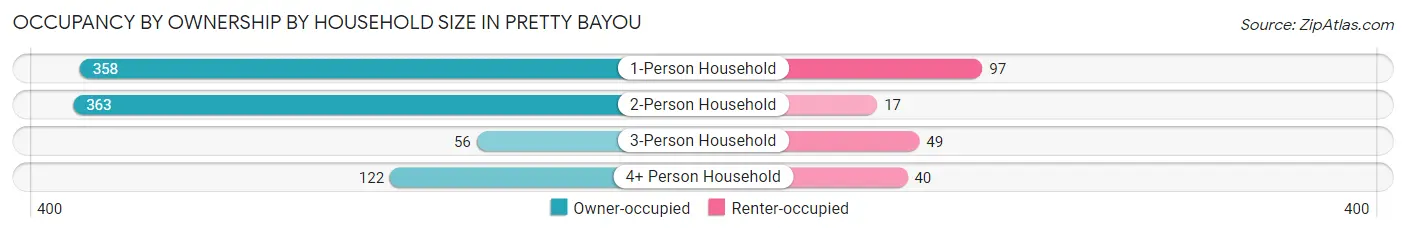
| Household Size | Owner-occupied | Renter-occupied |
| 1-Person Household | 358 (78.7%) | 97 (21.3%) |
| 2-Person Household | 363 (95.5%) | 17 (4.5%) |
| 3-Person Household | 56 (53.3%) | 49 (46.7%) |
| 4+ Person Household | 122 (75.3%) | 40 (24.7%) |
| Total Housing Units | 899 (81.6%) | 203 (18.4%) |
Occupancy by Educational Attainment in Pretty Bayou
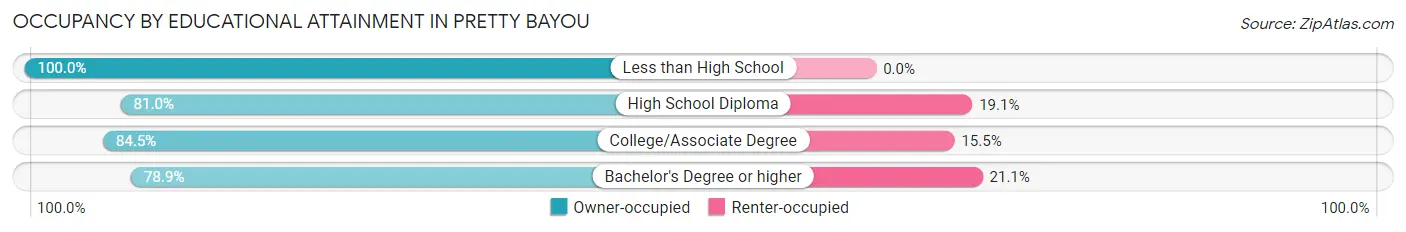
| Household Size | Owner-occupied | Renter-occupied |
| Less than High School | 19 (100.0%) | 0 (0.0%) |
| High School Diploma | 170 (80.9%) | 40 (19.1%) |
| College/Associate Degree | 321 (84.5%) | 59 (15.5%) |
| Bachelor's Degree or higher | 389 (78.9%) | 104 (21.1%) |
Occupancy by Age of Householder in Pretty Bayou
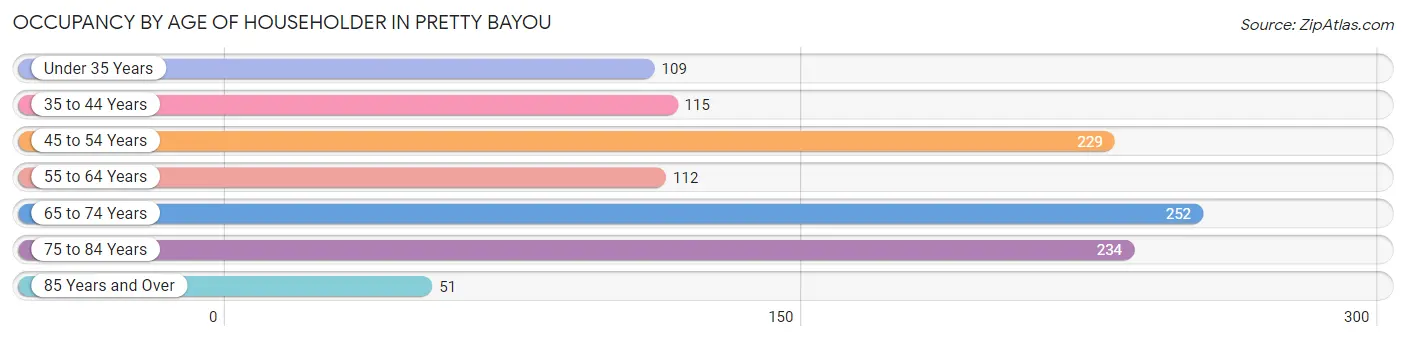
| Age Bracket | # Households | % Households |
| Under 35 Years | 109 | 9.9% |
| 35 to 44 Years | 115 | 10.4% |
| 45 to 54 Years | 229 | 20.8% |
| 55 to 64 Years | 112 | 10.2% |
| 65 to 74 Years | 252 | 22.9% |
| 75 to 84 Years | 234 | 21.2% |
| 85 Years and Over | 51 | 4.6% |
| Total | 1,102 | 100.0% |
Housing Finances in Pretty Bayou
Median Income by Occupancy in Pretty Bayou
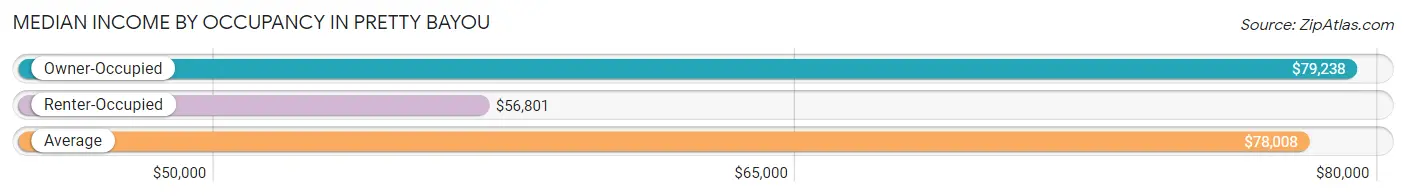
| Occupancy Type | # Households | Median Income |
| Owner-Occupied | 899 (81.6%) | $79,238 |
| Renter-Occupied | 203 (18.4%) | $56,801 |
| Average | 1,102 (100.0%) | $78,008 |
Occupancy by Householder Income Bracket in Pretty Bayou
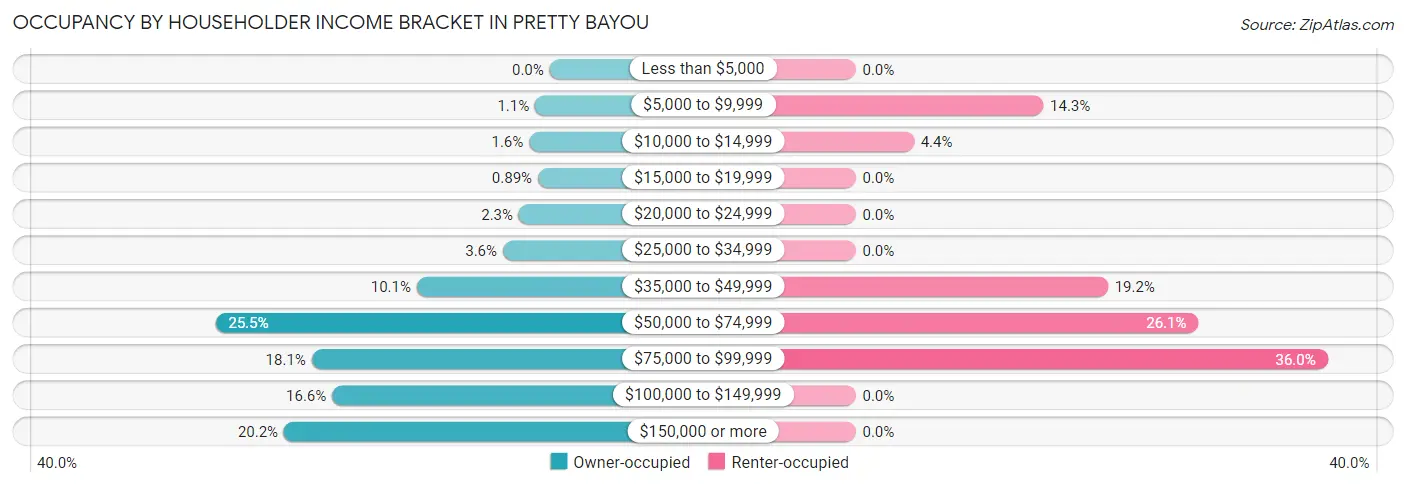
| Income Bracket | Owner-occupied | Renter-occupied |
| Less than $5,000 | 0 (0.0%) | 0 (0.0%) |
| $5,000 to $9,999 | 10 (1.1%) | 29 (14.3%) |
| $10,000 to $14,999 | 14 (1.6%) | 9 (4.4%) |
| $15,000 to $19,999 | 8 (0.9%) | 0 (0.0%) |
| $20,000 to $24,999 | 21 (2.3%) | 0 (0.0%) |
| $25,000 to $34,999 | 32 (3.6%) | 0 (0.0%) |
| $35,000 to $49,999 | 91 (10.1%) | 39 (19.2%) |
| $50,000 to $74,999 | 229 (25.5%) | 53 (26.1%) |
| $75,000 to $99,999 | 163 (18.1%) | 73 (36.0%) |
| $100,000 to $149,999 | 149 (16.6%) | 0 (0.0%) |
| $150,000 or more | 182 (20.2%) | 0 (0.0%) |
| Total | 899 (100.0%) | 203 (100.0%) |
Monthly Housing Cost Tiers in Pretty Bayou
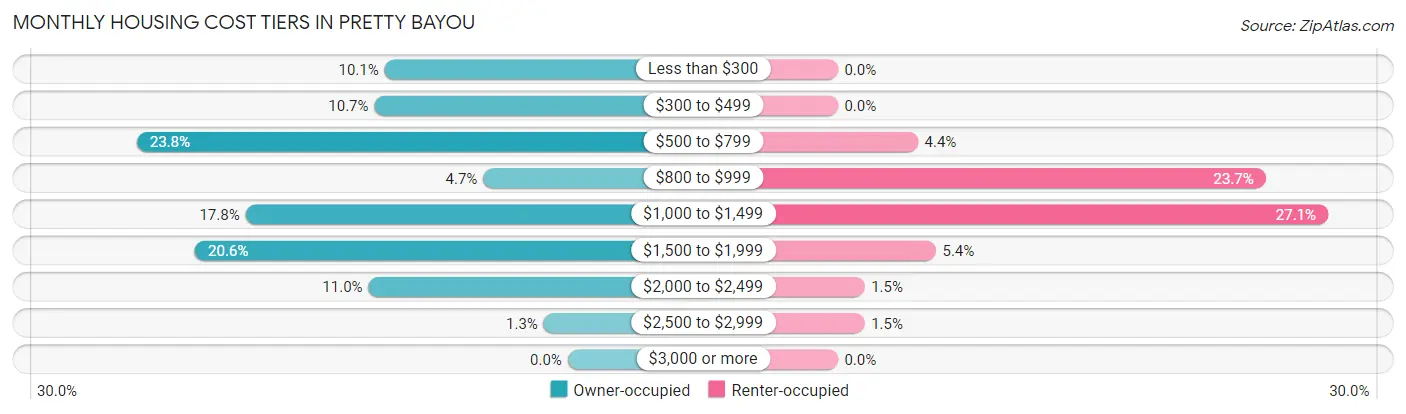
| Monthly Cost | Owner-occupied | Renter-occupied |
| Less than $300 | 91 (10.1%) | 0 (0.0%) |
| $300 to $499 | 96 (10.7%) | 0 (0.0%) |
| $500 to $799 | 214 (23.8%) | 9 (4.4%) |
| $800 to $999 | 42 (4.7%) | 48 (23.6%) |
| $1,000 to $1,499 | 160 (17.8%) | 55 (27.1%) |
| $1,500 to $1,999 | 185 (20.6%) | 11 (5.4%) |
| $2,000 to $2,499 | 99 (11.0%) | 3 (1.5%) |
| $2,500 to $2,999 | 12 (1.3%) | 3 (1.5%) |
| $3,000 or more | 0 (0.0%) | 0 (0.0%) |
| Total | 899 (100.0%) | 203 (100.0%) |
Physical Housing Characteristics in Pretty Bayou
Housing Structures in Pretty Bayou
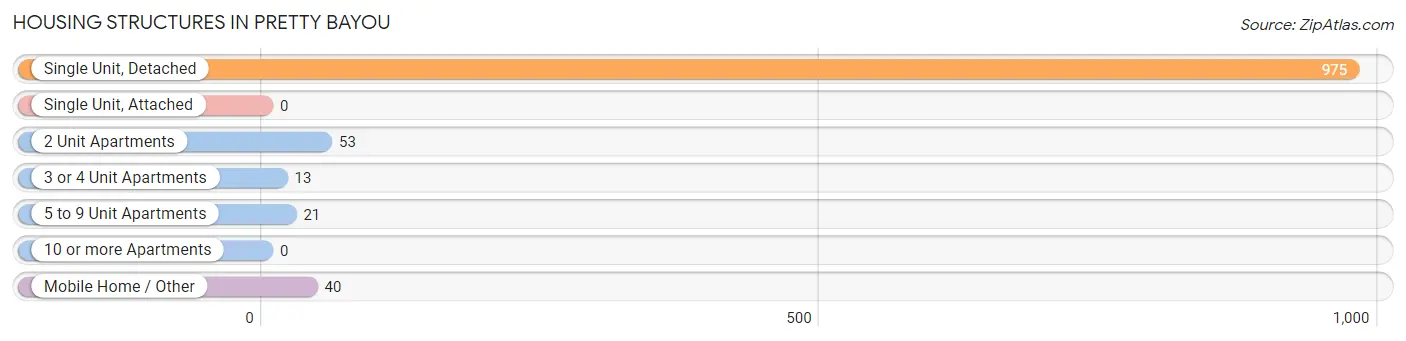
| Structure Type | # Housing Units | % Housing Units |
| Single Unit, Detached | 975 | 88.5% |
| Single Unit, Attached | 0 | 0.0% |
| 2 Unit Apartments | 53 | 4.8% |
| 3 or 4 Unit Apartments | 13 | 1.2% |
| 5 to 9 Unit Apartments | 21 | 1.9% |
| 10 or more Apartments | 0 | 0.0% |
| Mobile Home / Other | 40 | 3.6% |
| Total | 1,102 | 100.0% |
Housing Structures by Occupancy in Pretty Bayou
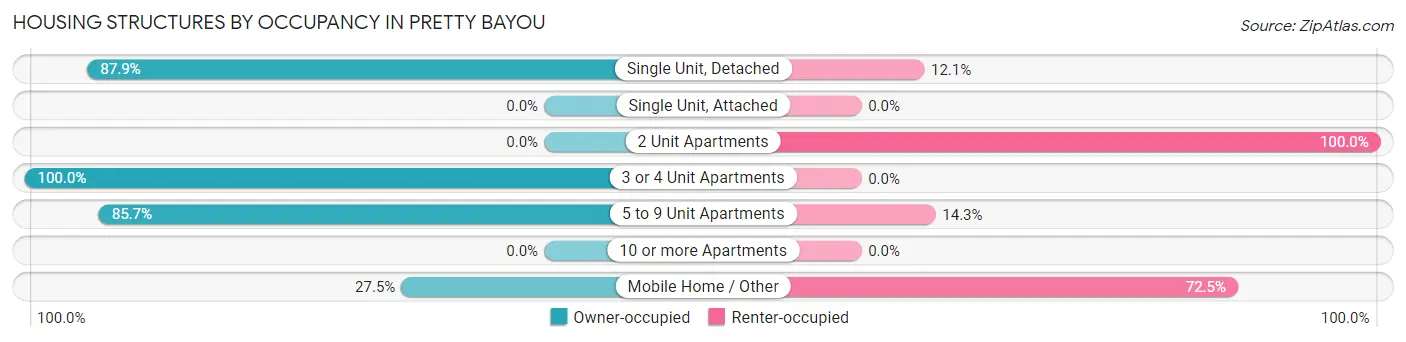
| Structure Type | Owner-occupied | Renter-occupied |
| Single Unit, Detached | 857 (87.9%) | 118 (12.1%) |
| Single Unit, Attached | 0 (0.0%) | 0 (0.0%) |
| 2 Unit Apartments | 0 (0.0%) | 53 (100.0%) |
| 3 or 4 Unit Apartments | 13 (100.0%) | 0 (0.0%) |
| 5 to 9 Unit Apartments | 18 (85.7%) | 3 (14.3%) |
| 10 or more Apartments | 0 (0.0%) | 0 (0.0%) |
| Mobile Home / Other | 11 (27.5%) | 29 (72.5%) |
| Total | 899 (81.6%) | 203 (18.4%) |
Housing Structures by Number of Rooms in Pretty Bayou
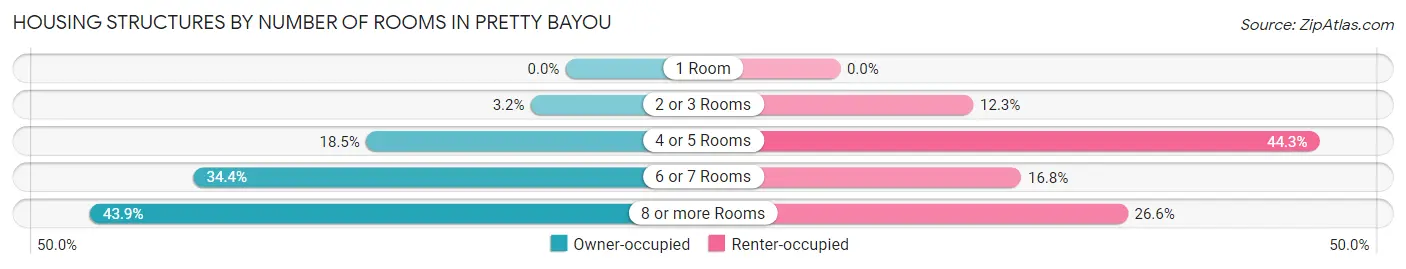
| Number of Rooms | Owner-occupied | Renter-occupied |
| 1 Room | 0 (0.0%) | 0 (0.0%) |
| 2 or 3 Rooms | 29 (3.2%) | 25 (12.3%) |
| 4 or 5 Rooms | 166 (18.5%) | 90 (44.3%) |
| 6 or 7 Rooms | 309 (34.4%) | 34 (16.8%) |
| 8 or more Rooms | 395 (43.9%) | 54 (26.6%) |
| Total | 899 (100.0%) | 203 (100.0%) |
Housing Structure by Heating Type in Pretty Bayou
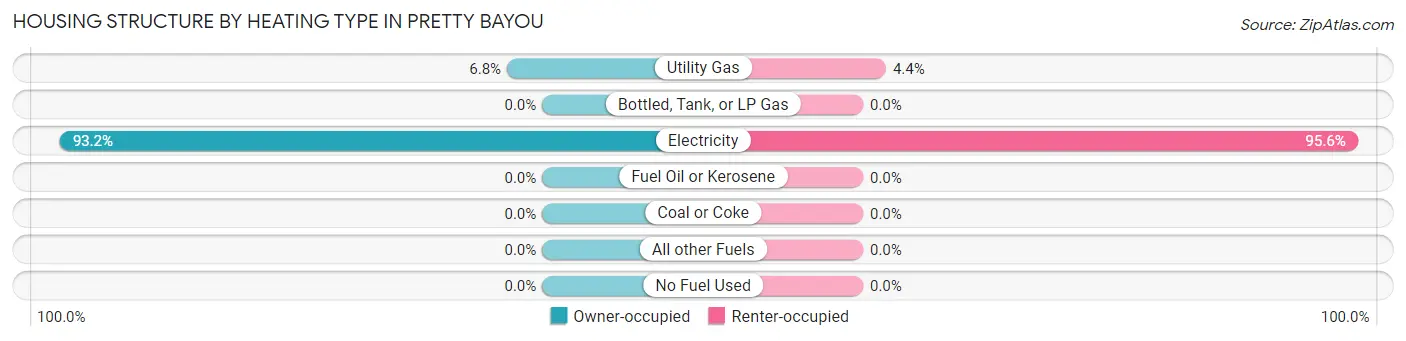
| Heating Type | Owner-occupied | Renter-occupied |
| Utility Gas | 61 (6.8%) | 9 (4.4%) |
| Bottled, Tank, or LP Gas | 0 (0.0%) | 0 (0.0%) |
| Electricity | 838 (93.2%) | 194 (95.6%) |
| Fuel Oil or Kerosene | 0 (0.0%) | 0 (0.0%) |
| Coal or Coke | 0 (0.0%) | 0 (0.0%) |
| All other Fuels | 0 (0.0%) | 0 (0.0%) |
| No Fuel Used | 0 (0.0%) | 0 (0.0%) |
| Total | 899 (100.0%) | 203 (100.0%) |
Household Vehicle Usage in Pretty Bayou
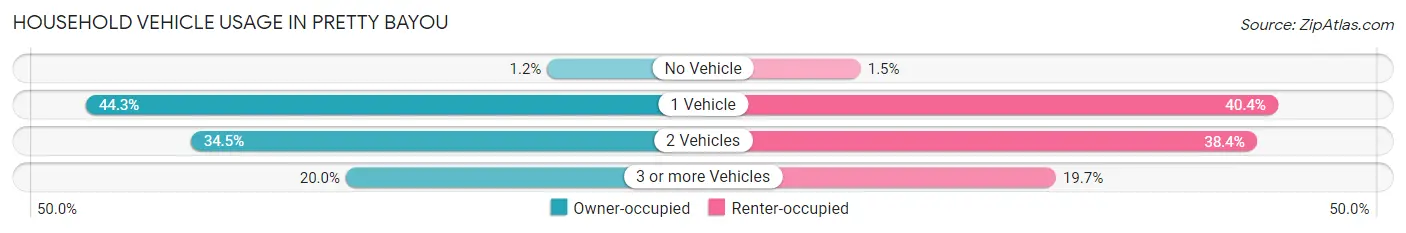
| Vehicles per Household | Owner-occupied | Renter-occupied |
| No Vehicle | 11 (1.2%) | 3 (1.5%) |
| 1 Vehicle | 398 (44.3%) | 82 (40.4%) |
| 2 Vehicles | 310 (34.5%) | 78 (38.4%) |
| 3 or more Vehicles | 180 (20.0%) | 40 (19.7%) |
| Total | 899 (100.0%) | 203 (100.0%) |
Real Estate & Mortgages in Pretty Bayou
Real Estate and Mortgage Overview in Pretty Bayou
| Characteristic | Without Mortgage | With Mortgage |
| Housing Units | 429 | 470 |
| Median Property Value | $246,900 | $263,600 |
| Median Household Income | $62,083 | $88 |
| Monthly Housing Costs | $517 | $0 |
| Real Estate Taxes | - | - |
Property Value by Mortgage Status in Pretty Bayou
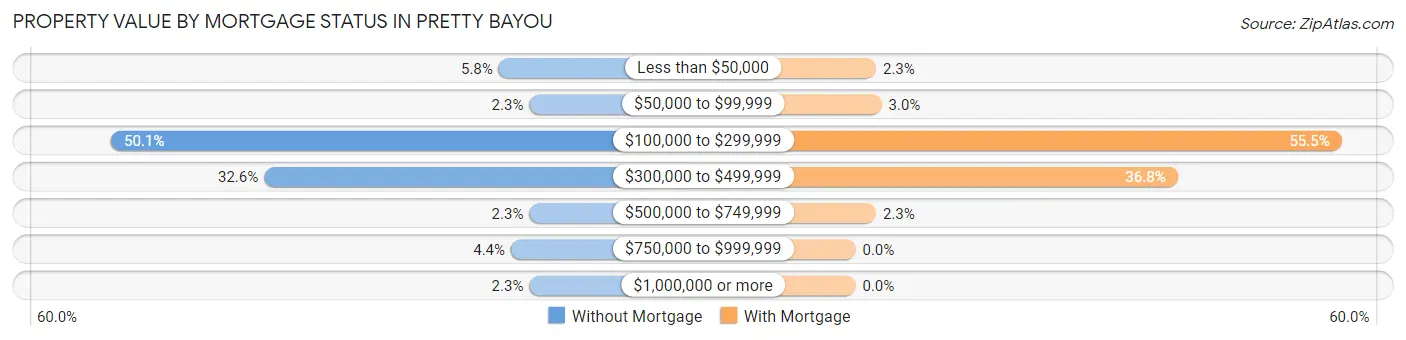
| Property Value | Without Mortgage | With Mortgage |
| Less than $50,000 | 25 (5.8%) | 11 (2.3%) |
| $50,000 to $99,999 | 10 (2.3%) | 14 (3.0%) |
| $100,000 to $299,999 | 215 (50.1%) | 261 (55.5%) |
| $300,000 to $499,999 | 140 (32.6%) | 173 (36.8%) |
| $500,000 to $749,999 | 10 (2.3%) | 11 (2.3%) |
| $750,000 to $999,999 | 19 (4.4%) | 0 (0.0%) |
| $1,000,000 or more | 10 (2.3%) | 0 (0.0%) |
| Total | 429 (100.0%) | 470 (100.0%) |
Household Income by Mortgage Status in Pretty Bayou
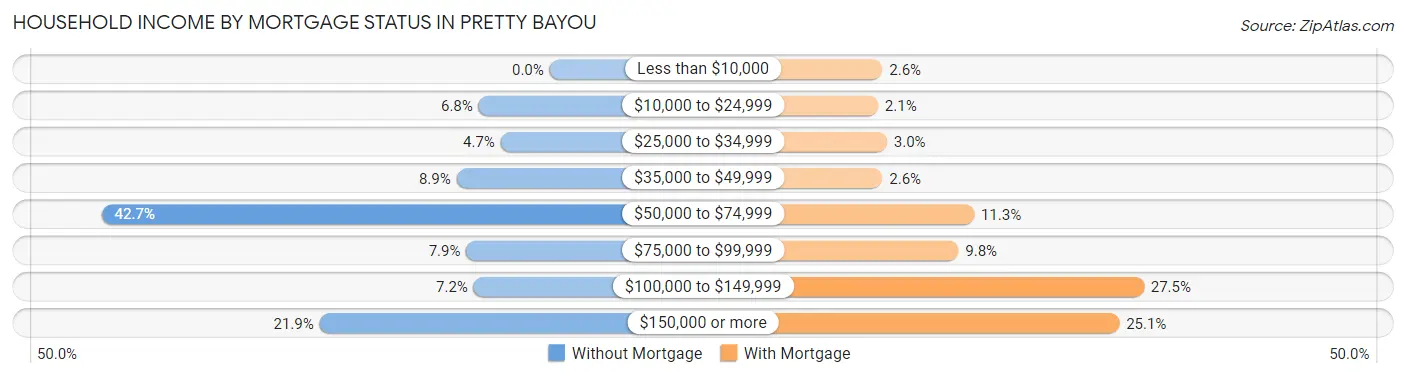
| Household Income | Without Mortgage | With Mortgage |
| Less than $10,000 | 0 (0.0%) | 12 (2.5%) |
| $10,000 to $24,999 | 29 (6.8%) | 10 (2.1%) |
| $25,000 to $34,999 | 20 (4.7%) | 14 (3.0%) |
| $35,000 to $49,999 | 38 (8.9%) | 12 (2.5%) |
| $50,000 to $74,999 | 183 (42.7%) | 53 (11.3%) |
| $75,000 to $99,999 | 34 (7.9%) | 46 (9.8%) |
| $100,000 to $149,999 | 31 (7.2%) | 129 (27.5%) |
| $150,000 or more | 94 (21.9%) | 118 (25.1%) |
| Total | 429 (100.0%) | 470 (100.0%) |
Property Value to Household Income Ratio in Pretty Bayou
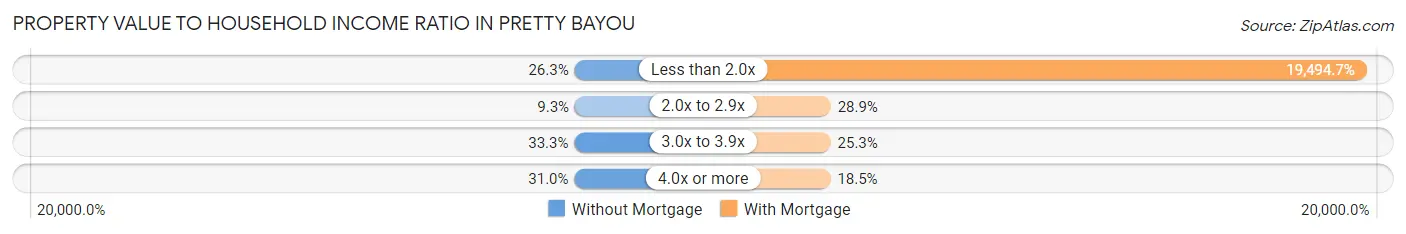
| Value-to-Income Ratio | Without Mortgage | With Mortgage |
| Less than 2.0x | 113 (26.3%) | 91,625 (19,494.7%) |
| 2.0x to 2.9x | 40 (9.3%) | 136 (28.9%) |
| 3.0x to 3.9x | 143 (33.3%) | 119 (25.3%) |
| 4.0x or more | 133 (31.0%) | 87 (18.5%) |
| Total | 429 (100.0%) | 470 (100.0%) |
Real Estate Taxes by Mortgage Status in Pretty Bayou
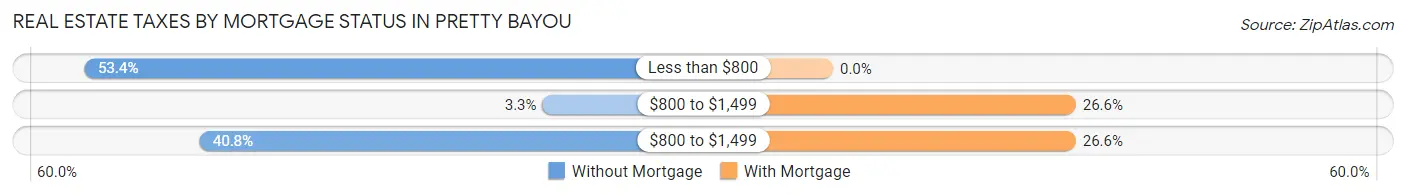
| Property Taxes | Without Mortgage | With Mortgage |
| Less than $800 | 229 (53.4%) | 0 (0.0%) |
| $800 to $1,499 | 14 (3.3%) | 125 (26.6%) |
| $800 to $1,499 | 175 (40.8%) | 125 (26.6%) |
| Total | 429 (100.0%) | 470 (100.0%) |
Health & Disability in Pretty Bayou
Health Insurance Coverage by Age in Pretty Bayou
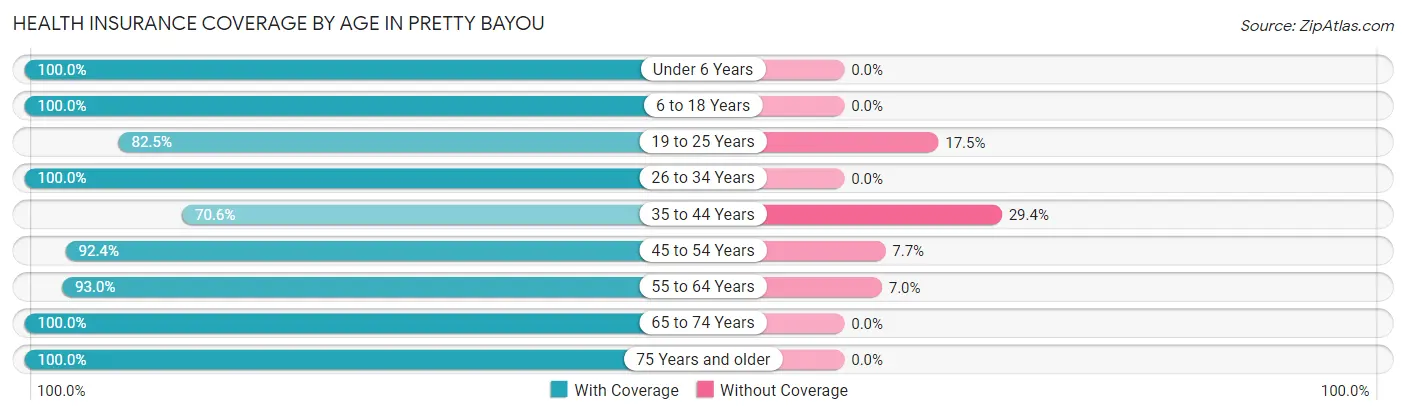
| Age Bracket | With Coverage | Without Coverage |
| Under 6 Years | 136 (100.0%) | 0 (0.0%) |
| 6 to 18 Years | 141 (100.0%) | 0 (0.0%) |
| 19 to 25 Years | 127 (82.5%) | 27 (17.5%) |
| 26 to 34 Years | 157 (100.0%) | 0 (0.0%) |
| 35 to 44 Years | 166 (70.6%) | 69 (29.4%) |
| 45 to 54 Years | 350 (92.3%) | 29 (7.6%) |
| 55 to 64 Years | 266 (93.0%) | 20 (7.0%) |
| 65 to 74 Years | 379 (100.0%) | 0 (0.0%) |
| 75 Years and older | 466 (100.0%) | 0 (0.0%) |
| Total | 2,188 (93.8%) | 145 (6.2%) |
Health Insurance Coverage by Citizenship Status in Pretty Bayou
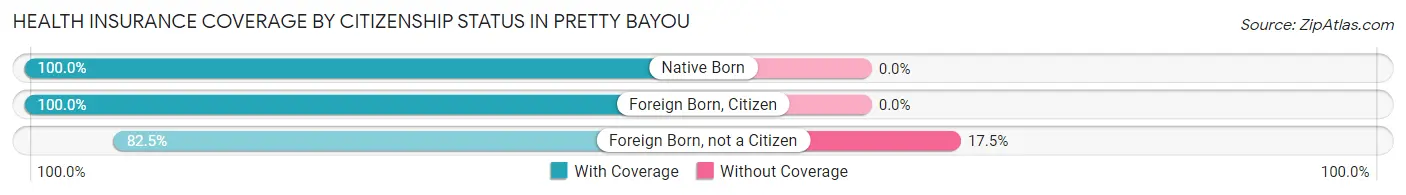
| Citizenship Status | With Coverage | Without Coverage |
| Native Born | 136 (100.0%) | 0 (0.0%) |
| Foreign Born, Citizen | 141 (100.0%) | 0 (0.0%) |
| Foreign Born, not a Citizen | 127 (82.5%) | 27 (17.5%) |
Health Insurance Coverage by Household Income in Pretty Bayou
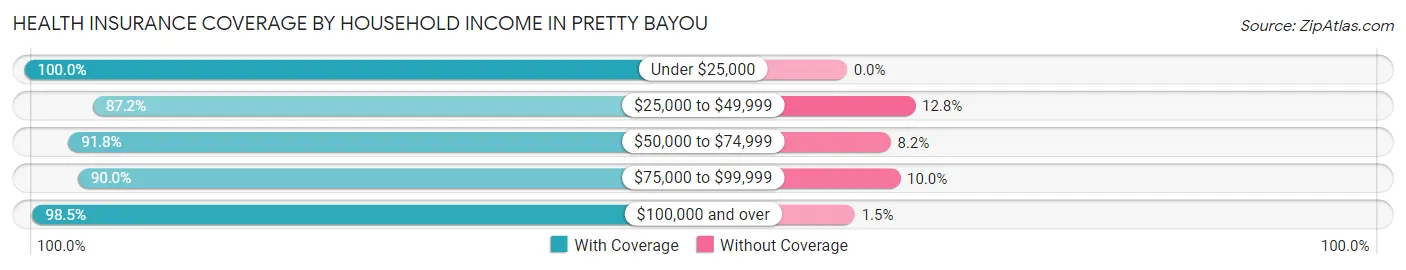
| Household Income | With Coverage | Without Coverage |
| Under $25,000 | 102 (100.0%) | 0 (0.0%) |
| $25,000 to $49,999 | 191 (87.2%) | 28 (12.8%) |
| $50,000 to $74,999 | 504 (91.8%) | 45 (8.2%) |
| $75,000 to $99,999 | 532 (90.0%) | 59 (10.0%) |
| $100,000 and over | 859 (98.5%) | 13 (1.5%) |
Public vs Private Health Insurance Coverage by Age in Pretty Bayou
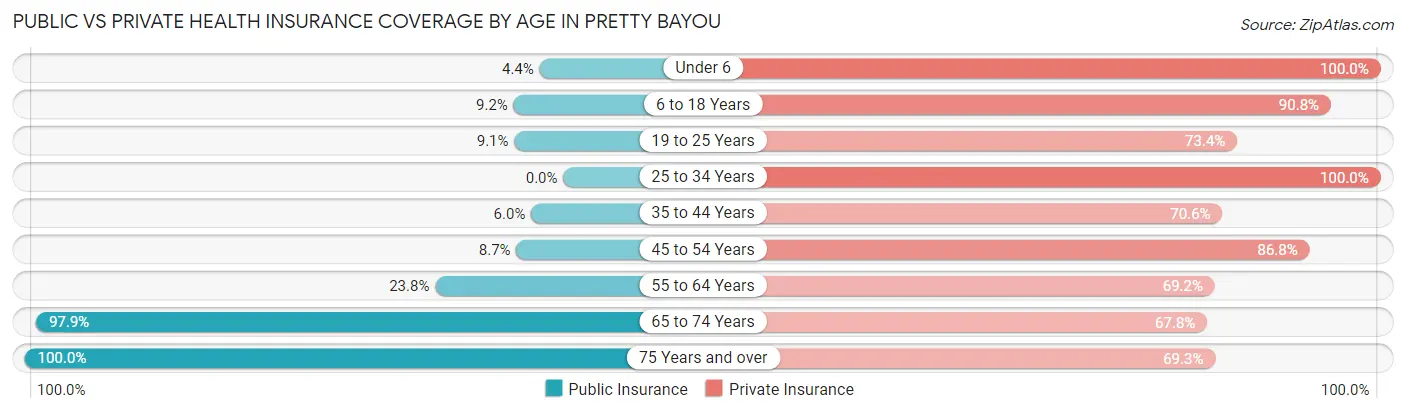
| Age Bracket | Public Insurance | Private Insurance |
| Under 6 | 6 (4.4%) | 136 (100.0%) |
| 6 to 18 Years | 13 (9.2%) | 128 (90.8%) |
| 19 to 25 Years | 14 (9.1%) | 113 (73.4%) |
| 25 to 34 Years | 0 (0.0%) | 157 (100.0%) |
| 35 to 44 Years | 14 (6.0%) | 166 (70.6%) |
| 45 to 54 Years | 33 (8.7%) | 329 (86.8%) |
| 55 to 64 Years | 68 (23.8%) | 198 (69.2%) |
| 65 to 74 Years | 371 (97.9%) | 257 (67.8%) |
| 75 Years and over | 466 (100.0%) | 323 (69.3%) |
| Total | 985 (42.2%) | 1,807 (77.4%) |
Disability Status by Sex by Age in Pretty Bayou
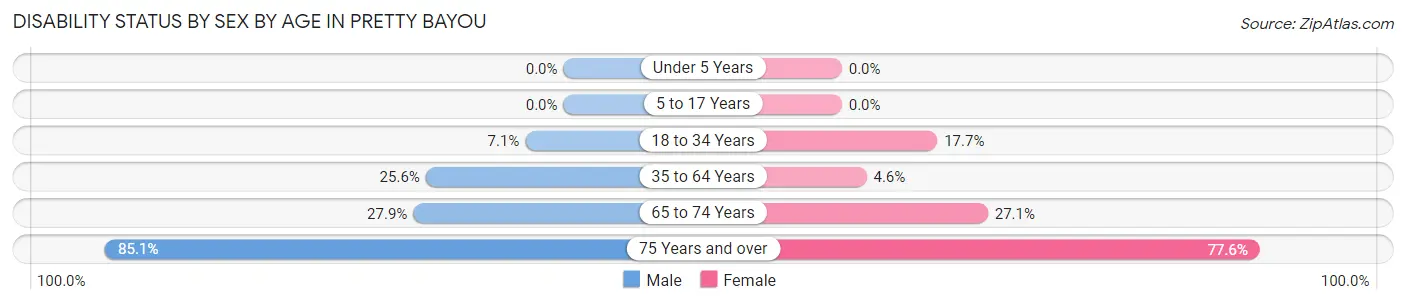
| Age Bracket | Male | Female |
| Under 5 Years | 0 (0.0%) | 0 (0.0%) |
| 5 to 17 Years | 0 (0.0%) | 0 (0.0%) |
| 18 to 34 Years | 15 (7.1%) | 28 (17.7%) |
| 35 to 64 Years | 102 (25.6%) | 23 (4.6%) |
| 65 to 74 Years | 46 (27.9%) | 58 (27.1%) |
| 75 Years and over | 165 (85.1%) | 211 (77.6%) |
Disability Class by Sex by Age in Pretty Bayou
Disability Class: Hearing Difficulty
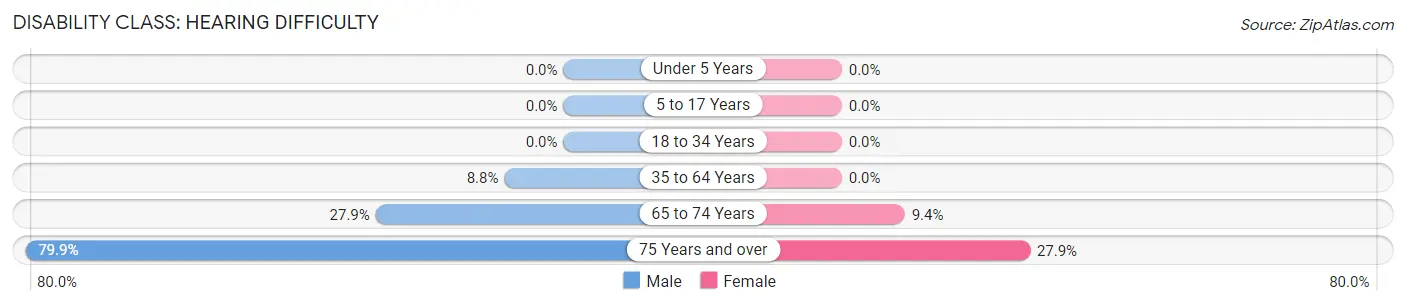
| Age Bracket | Male | Female |
| Under 5 Years | 0 (0.0%) | 0 (0.0%) |
| 5 to 17 Years | 0 (0.0%) | 0 (0.0%) |
| 18 to 34 Years | 0 (0.0%) | 0 (0.0%) |
| 35 to 64 Years | 35 (8.8%) | 0 (0.0%) |
| 65 to 74 Years | 46 (27.9%) | 20 (9.3%) |
| 75 Years and over | 155 (79.9%) | 76 (27.9%) |
Disability Class: Vision Difficulty
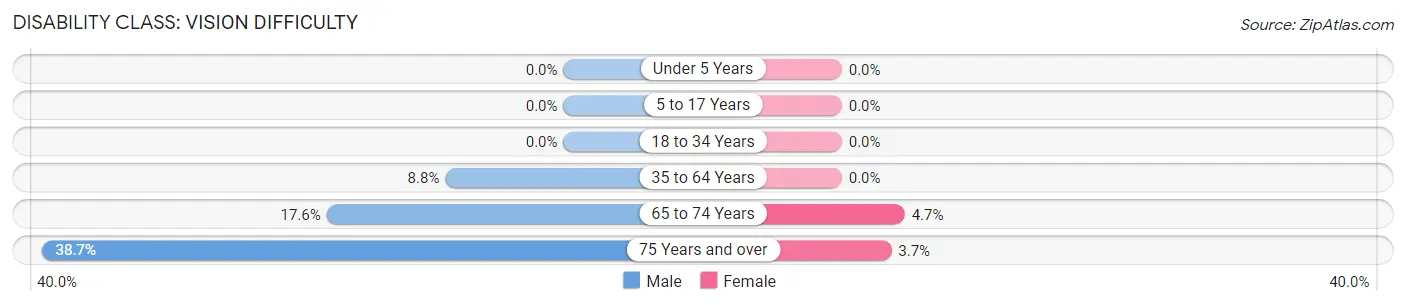
| Age Bracket | Male | Female |
| Under 5 Years | 0 (0.0%) | 0 (0.0%) |
| 5 to 17 Years | 0 (0.0%) | 0 (0.0%) |
| 18 to 34 Years | 0 (0.0%) | 0 (0.0%) |
| 35 to 64 Years | 35 (8.8%) | 0 (0.0%) |
| 65 to 74 Years | 29 (17.6%) | 10 (4.7%) |
| 75 Years and over | 75 (38.7%) | 10 (3.7%) |
Disability Class: Cognitive Difficulty
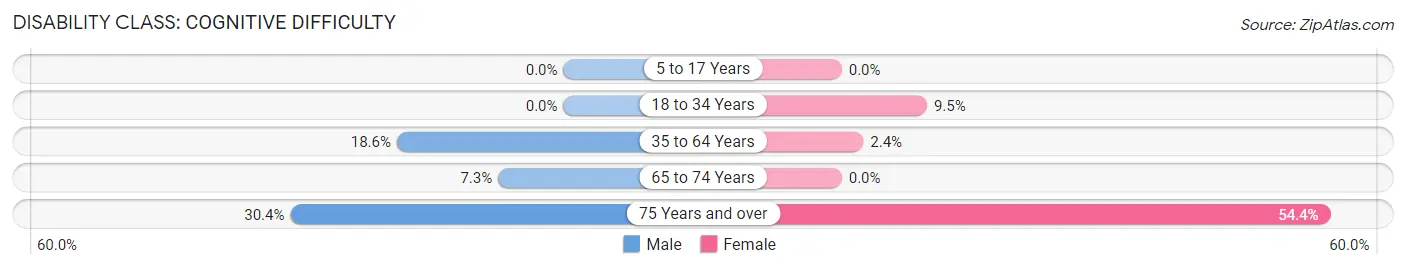
| Age Bracket | Male | Female |
| 5 to 17 Years | 0 (0.0%) | 0 (0.0%) |
| 18 to 34 Years | 0 (0.0%) | 15 (9.5%) |
| 35 to 64 Years | 74 (18.5%) | 12 (2.4%) |
| 65 to 74 Years | 12 (7.3%) | 0 (0.0%) |
| 75 Years and over | 59 (30.4%) | 148 (54.4%) |
Disability Class: Ambulatory Difficulty
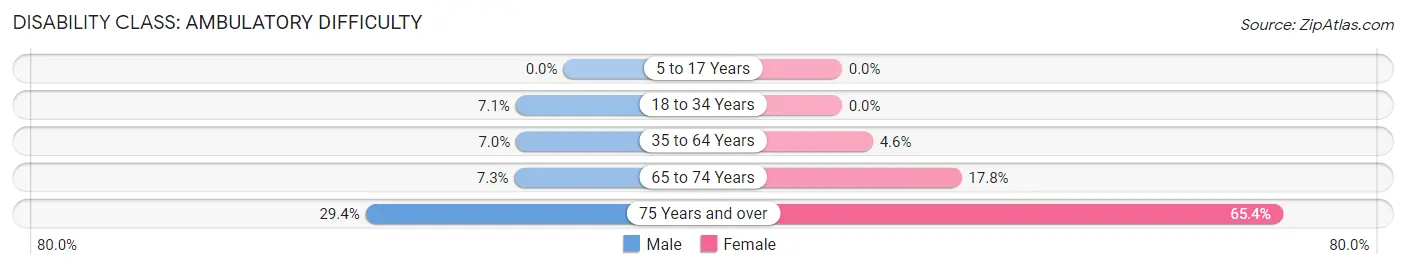
| Age Bracket | Male | Female |
| 5 to 17 Years | 0 (0.0%) | 0 (0.0%) |
| 18 to 34 Years | 15 (7.1%) | 0 (0.0%) |
| 35 to 64 Years | 28 (7.0%) | 23 (4.6%) |
| 65 to 74 Years | 12 (7.3%) | 38 (17.8%) |
| 75 Years and over | 57 (29.4%) | 178 (65.4%) |
Disability Class: Self-Care Difficulty
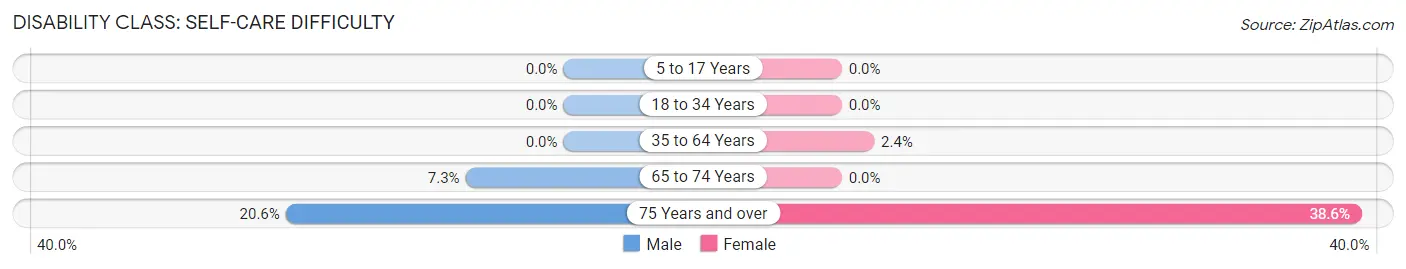
| Age Bracket | Male | Female |
| 5 to 17 Years | 0 (0.0%) | 0 (0.0%) |
| 18 to 34 Years | 0 (0.0%) | 0 (0.0%) |
| 35 to 64 Years | 0 (0.0%) | 12 (2.4%) |
| 65 to 74 Years | 12 (7.3%) | 0 (0.0%) |
| 75 Years and over | 40 (20.6%) | 105 (38.6%) |
Technology Access in Pretty Bayou
Computing Device Access in Pretty Bayou
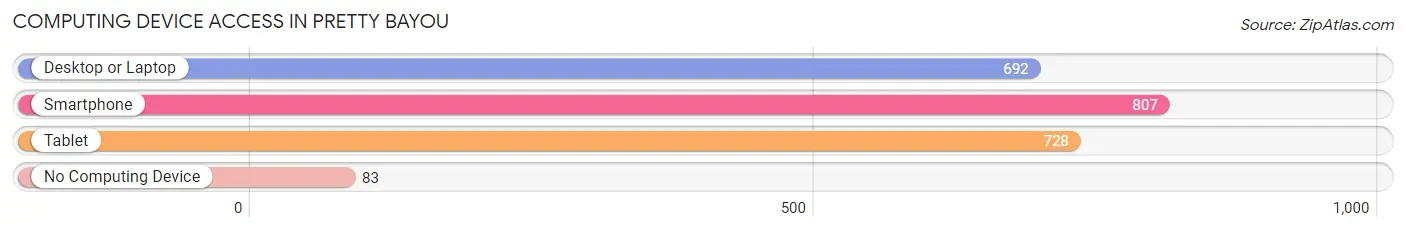
| Device Type | # Households | % Households |
| Desktop or Laptop | 692 | 62.8% |
| Smartphone | 807 | 73.2% |
| Tablet | 728 | 66.1% |
| No Computing Device | 83 | 7.5% |
| Total | 1,102 | 100.0% |
Internet Access in Pretty Bayou
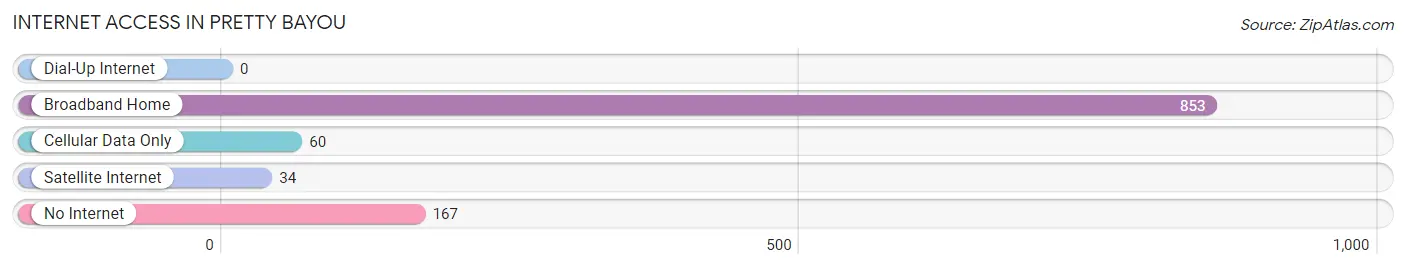
| Internet Type | # Households | % Households |
| Dial-Up Internet | 0 | 0.0% |
| Broadband Home | 853 | 77.4% |
| Cellular Data Only | 60 | 5.4% |
| Satellite Internet | 34 | 3.1% |
| No Internet | 167 | 15.1% |
| Total | 1,102 | 100.0% |
Pretty Bayou Summary
Bayou, Florida is a small town located in the panhandle of Florida, just south of the Alabama border. It is a rural community with a population of just over 1,000 people. The town is situated on the banks of the Choctawhatchee Bay, which is part of the Gulf of Mexico. The town is known for its beautiful scenery, with lush green forests and crystal clear waters.
History
The area that is now Bayou, Florida was first settled by Native Americans in the late 1700s. The Choctawhatchee Bay was a major source of food and transportation for the Native Americans. In 1821, the United States acquired the area from Spain and the first settlers began to arrive in the area. The town was officially founded in 1845 and was named after the bayou that runs through the town.
In the late 1800s, the town began to grow and prosper. The economy was based on fishing, timber, and agriculture. The town was also a popular destination for tourists, who came to enjoy the beautiful scenery and the warm climate.
In the early 1900s, the town began to decline as the timber industry began to decline. The town was also hit hard by the Great Depression. However, the town was able to recover and the economy began to improve in the 1950s.
Geography
Bayou, Florida is located in the panhandle of Florida, just south of the Alabama border. The town is situated on the banks of the Choctawhatchee Bay, which is part of the Gulf of Mexico. The town is surrounded by lush green forests and crystal clear waters. The town is located about 30 miles from the nearest major city, Pensacola.
The town is located in a humid subtropical climate, with hot summers and mild winters. The average temperature in the summer is around 90 degrees Fahrenheit, while the average temperature in the winter is around 60 degrees Fahrenheit.
Economy
The economy of Bayou, Florida is largely based on tourism. The town is a popular destination for tourists, who come to enjoy the beautiful scenery and the warm climate. The town is also home to several marinas, which attract boaters from all over the country.
The town is also home to several small businesses, including restaurants, shops, and other services. The town is also home to a few small manufacturing companies.
Demographics
As of the 2010 census, the population of Bayou, Florida was 1,072. The population is mostly white, with a small percentage of African Americans and Hispanics. The median household income is $37,000, and the median age is 44. The town is home to several churches, including Baptist, Methodist, and Catholic.
Conclusion
Bayou, Florida is a small town located in the panhandle of Florida, just south of the Alabama border. The town is known for its beautiful scenery, with lush green forests and crystal clear waters. The economy of the town is largely based on tourism, and the town is home to several small businesses. The population of the town is mostly white, with a small percentage of African Americans and Hispanics. The town is home to several churches, including Baptist, Methodist, and Catholic.
Common Questions
What is Per Capita Income in Pretty Bayou?
Per Capita income in Pretty Bayou is $41,101.
What is the Median Family Income in Pretty Bayou?
Median Family Income in Pretty Bayou is $102,452.
What is the Median Household income in Pretty Bayou?
Median Household Income in Pretty Bayou is $78,008.
What is Income or Wage Gap in Pretty Bayou?
Income or Wage Gap in Pretty Bayou is 5.8%.
Women in Pretty Bayou earn 94.2 cents for every dollar earned by a man.
What is Inequality or Gini Index in Pretty Bayou?
Inequality or Gini Index in Pretty Bayou is 0.33.
What is the Total Population of Pretty Bayou?
Total Population of Pretty Bayou is 2,469.
What is the Total Male Population of Pretty Bayou?
Total Male Population of Pretty Bayou is 1,112.
What is the Total Female Population of Pretty Bayou?
Total Female Population of Pretty Bayou is 1,357.
What is the Ratio of Males per 100 Females in Pretty Bayou?
There are 81.95 Males per 100 Females in Pretty Bayou.
What is the Ratio of Females per 100 Males in Pretty Bayou?
There are 122.03 Females per 100 Males in Pretty Bayou.
What is the Median Population Age in Pretty Bayou?
Median Population Age in Pretty Bayou is 55.2 Years.
What is the Average Family Size in Pretty Bayou
Average Family Size in Pretty Bayou is 2.9 People.
What is the Average Household Size in Pretty Bayou
Average Household Size in Pretty Bayou is 2.1 People.
How Large is the Labor Force in Pretty Bayou?
There are 1,105 People in the Labor Forcein in Pretty Bayou.
What is the Percentage of People in the Labor Force in Pretty Bayou?
48.9% of People are in the Labor Force in Pretty Bayou.
What is the Unemployment Rate in Pretty Bayou?
Unemployment Rate in Pretty Bayou is 8.4%.