Tyndall AFB, FL Map & Demographics
Tyndall AFB Map
Tyndall AFB Overview
$26,942
PER CAPITA INCOME
$91,458
AVG FAMILY INCOME
$90,104
AVG HOUSEHOLD INCOME
0.24
INEQUALITY / GINI INDEX
746
TOTAL POPULATION
440
MALE POPULATION
306
FEMALE POPULATION
143.79
MALES / 100 FEMALES
69.55
FEMALES / 100 MALES
22.0
MEDIAN AGE
3.2
AVG FAMILY SIZE
3.0
AVG HOUSEHOLD SIZE
523
LABOR FORCE [ PEOPLE ]
86.3%
PERCENT IN LABOR FORCE
9.8%
UNEMPLOYMENT RATE
Tyndall AFB Area Codes
Income in Tyndall AFB
Income Overview in Tyndall AFB
Per Capita Income in Tyndall AFB is $26,942, while median incomes of families and households are $91,458 and $90,104 respectively.
| Characteristic | Number | Measure |
| Per Capita Income | 746 | $26,942 |
| Median Family Income | 120 | $91,458 |
| Mean Family Income | 120 | $91,714 |
| Median Household Income | 133 | $90,104 |
| Mean Household Income | 133 | $88,301 |
| Income Deficit | 120 | $0 |
| Wage / Income Gap (%) | 746 | 0.00% |
| Wage / Income Gap ($) | 746 | 100.00¢ per $1 |
| Gini / Inequality Index | 746 | 0.24 |
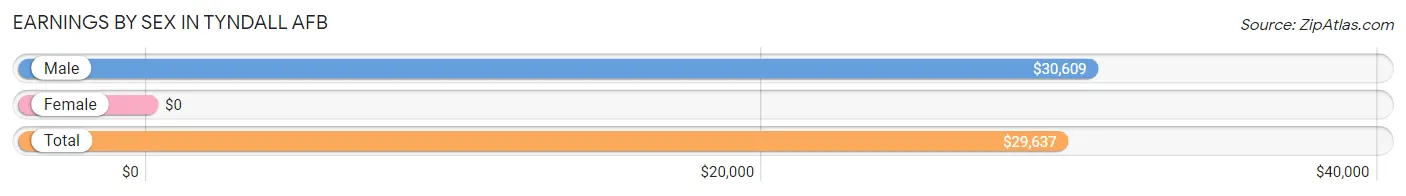
Earnings by Sex in Tyndall AFB
| Sex | Number | Average Earnings |
| Male | 347 (66.3%) | $30,609 |
| Female | 176 (33.7%) | $0 |
| Total | 523 (100.0%) | $29,637 |
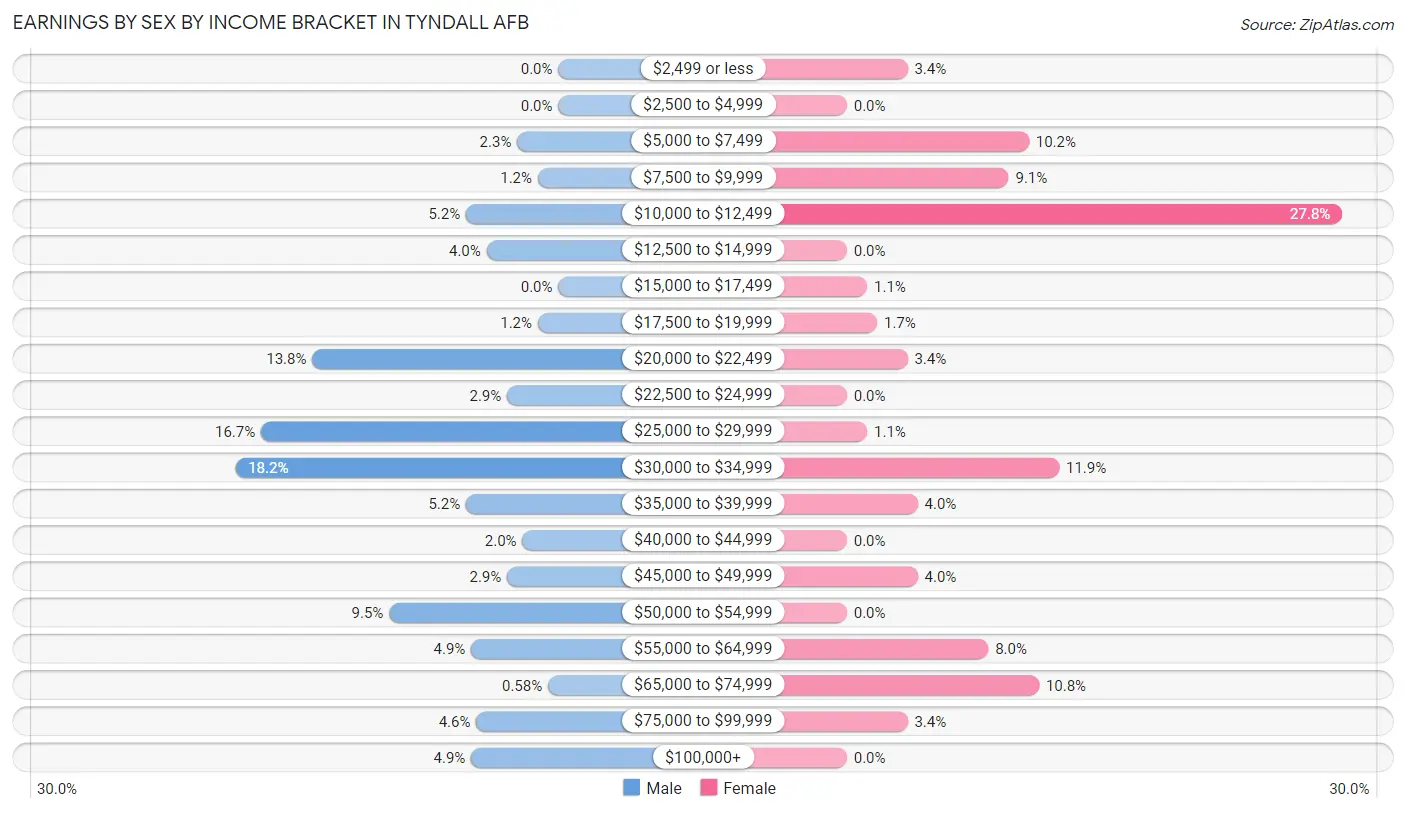
Earnings by Sex by Income Bracket in Tyndall AFB
The most common earnings brackets in Tyndall AFB are $30,000 to $34,999 for men (63 | 18.2%) and $10,000 to $12,499 for women (49 | 27.8%).
| Income | Male | Female |
| $2,499 or less | 0 (0.0%) | 6 (3.4%) |
| $2,500 to $4,999 | 0 (0.0%) | 0 (0.0%) |
| $5,000 to $7,499 | 8 (2.3%) | 18 (10.2%) |
| $7,500 to $9,999 | 4 (1.1%) | 16 (9.1%) |
| $10,000 to $12,499 | 18 (5.2%) | 49 (27.8%) |
| $12,500 to $14,999 | 14 (4.0%) | 0 (0.0%) |
| $15,000 to $17,499 | 0 (0.0%) | 2 (1.1%) |
| $17,500 to $19,999 | 4 (1.1%) | 3 (1.7%) |
| $20,000 to $22,499 | 48 (13.8%) | 6 (3.4%) |
| $22,500 to $24,999 | 10 (2.9%) | 0 (0.0%) |
| $25,000 to $29,999 | 58 (16.7%) | 2 (1.1%) |
| $30,000 to $34,999 | 63 (18.2%) | 21 (11.9%) |
| $35,000 to $39,999 | 18 (5.2%) | 7 (4.0%) |
| $40,000 to $44,999 | 7 (2.0%) | 0 (0.0%) |
| $45,000 to $49,999 | 10 (2.9%) | 7 (4.0%) |
| $50,000 to $54,999 | 33 (9.5%) | 0 (0.0%) |
| $55,000 to $64,999 | 17 (4.9%) | 14 (8.0%) |
| $65,000 to $74,999 | 2 (0.6%) | 19 (10.8%) |
| $75,000 to $99,999 | 16 (4.6%) | 6 (3.4%) |
| $100,000+ | 17 (4.9%) | 0 (0.0%) |
| Total | 347 (100.0%) | 176 (100.0%) |
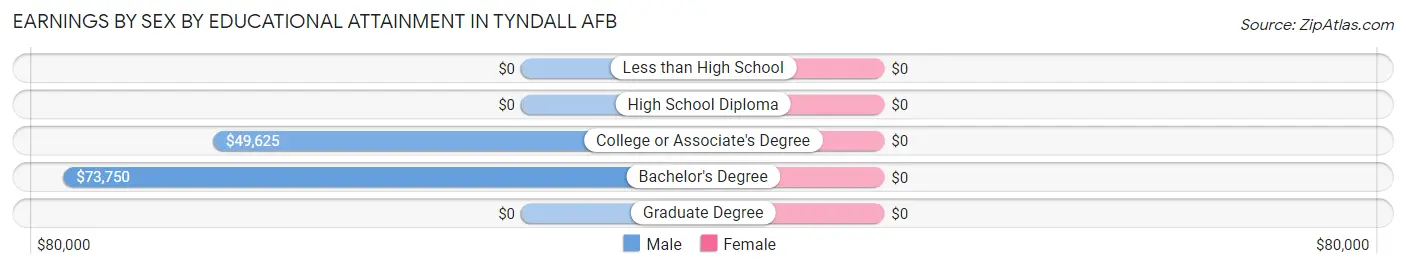
Earnings by Sex by Educational Attainment in Tyndall AFB
| Educational Attainment | Male Income | Female Income |
| Less than High School | - | - |
| High School Diploma | - | - |
| College or Associate's Degree | $49,625 | $0 |
| Bachelor's Degree | $73,750 | $0 |
| Graduate Degree | - | - |
| Total | $53,875 | $0 |
Family Income in Tyndall AFB
Family Income Brackets in Tyndall AFB
According to the Tyndall AFB family income data, there are 37 families falling into the $50,000 to $74,999 income range, which is the most common income bracket and makes up 30.8% of all families.
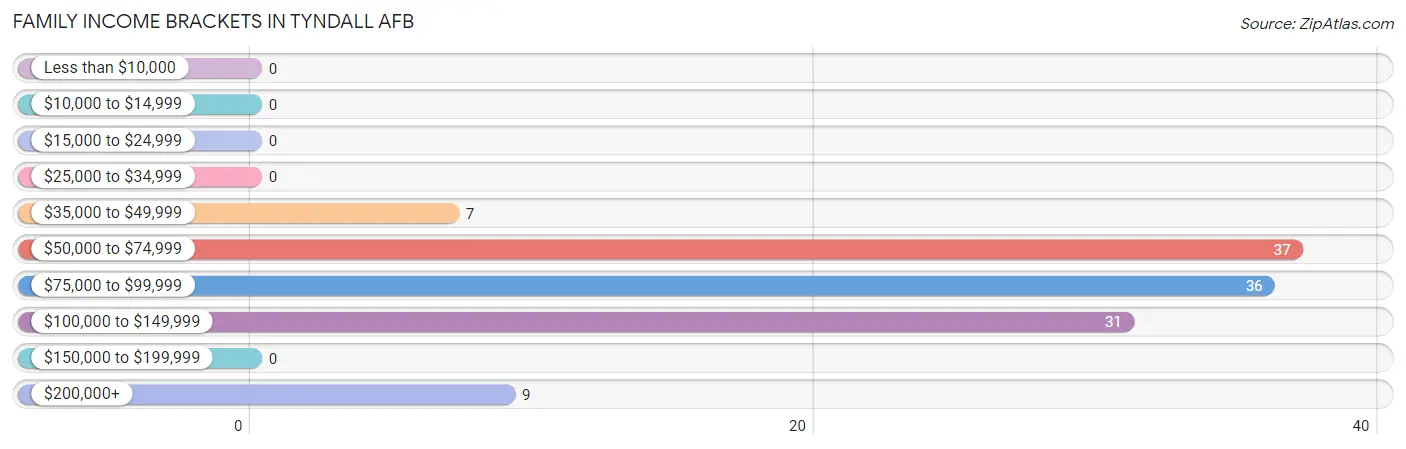
| Income Bracket | # Families | % Families |
| Less than $10,000 | 0 | 0.0% |
| $10,000 to $14,999 | 0 | 0.0% |
| $15,000 to $24,999 | 0 | 0.0% |
| $25,000 to $34,999 | 0 | 0.0% |
| $35,000 to $49,999 | 7 | 5.8% |
| $50,000 to $74,999 | 37 | 30.8% |
| $75,000 to $99,999 | 36 | 30.0% |
| $100,000 to $149,999 | 31 | 25.8% |
| $150,000 to $199,999 | 0 | 0.0% |
| $200,000+ | 9 | 7.5% |
Family Income by Famaliy Size in Tyndall AFB
2-person families (44 | 36.7%) account for the highest median family income in Tyndall AFB with $96,000 per family, while 2-person families (44 | 36.7%) have the highest median income of $48,000 per family member.
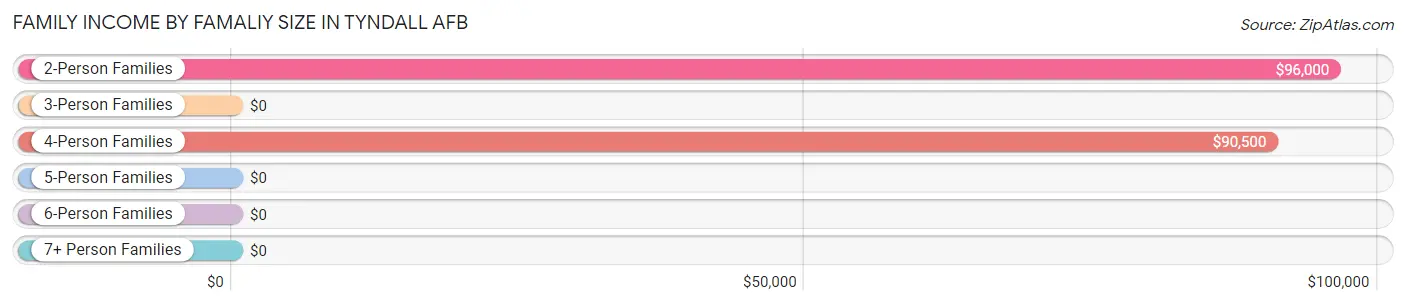
| Income Bracket | # Families | Median Income |
| 2-Person Families | 44 (36.7%) | $96,000 |
| 3-Person Families | 26 (21.7%) | $0 |
| 4-Person Families | 32 (26.7%) | $90,500 |
| 5-Person Families | 9 (7.5%) | $0 |
| 6-Person Families | 9 (7.5%) | $0 |
| 7+ Person Families | 0 (0.0%) | $0 |
| Total | 120 (100.0%) | $91,458 |
Family Income by Number of Earners in Tyndall AFB
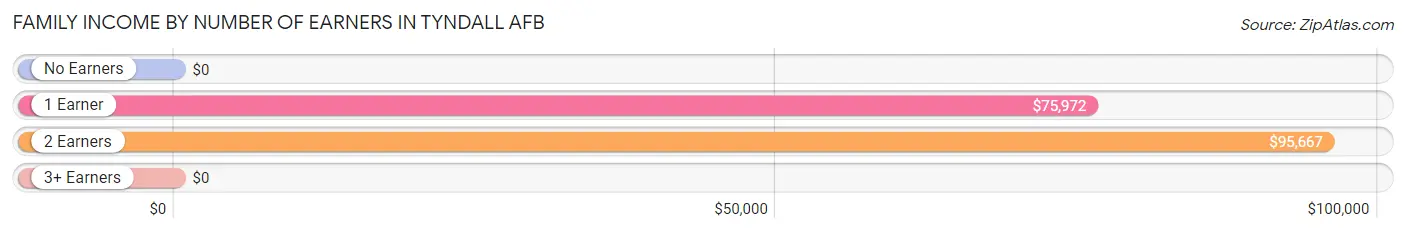
| Number of Earners | # Families | Median Income |
| No Earners | 7 (5.8%) | $0 |
| 1 Earner | 59 (49.2%) | $75,972 |
| 2 Earners | 54 (45.0%) | $95,667 |
| 3+ Earners | 0 (0.0%) | $0 |
| Total | 120 (100.0%) | $91,458 |
Household Income in Tyndall AFB
Household Income Brackets in Tyndall AFB
With 50 households falling in the category, the $50,000 to $74,999 income range is the most frequent in Tyndall AFB, accounting for 37.6% of all households.
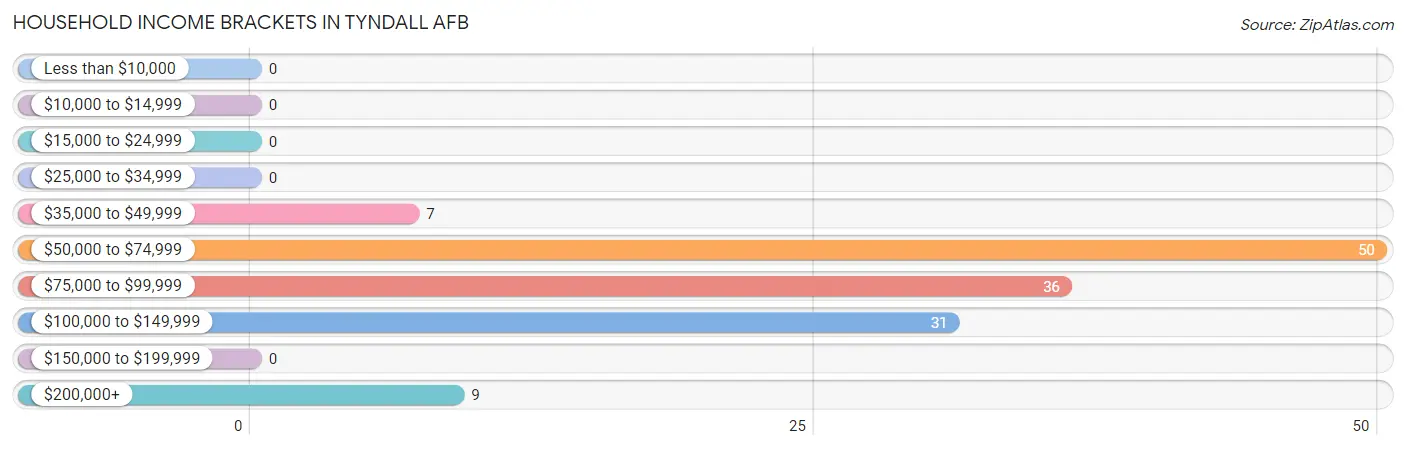
| Income Bracket | # Households | % Households |
| Less than $10,000 | 0 | 0.0% |
| $10,000 to $14,999 | 0 | 0.0% |
| $15,000 to $24,999 | 0 | 0.0% |
| $25,000 to $34,999 | 0 | 0.0% |
| $35,000 to $49,999 | 7 | 5.3% |
| $50,000 to $74,999 | 50 | 37.6% |
| $75,000 to $99,999 | 36 | 27.1% |
| $100,000 to $149,999 | 31 | 23.3% |
| $150,000 to $199,999 | 0 | 0.0% |
| $200,000+ | 9 | 6.8% |
Household Income by Householder Age in Tyndall AFB
The median household income in Tyndall AFB is $90,104, with the highest median household income of $104,750 found in the 45 to 64 years age bracket for the primary householder. A total of 32 households (24.1%) fall into this category.
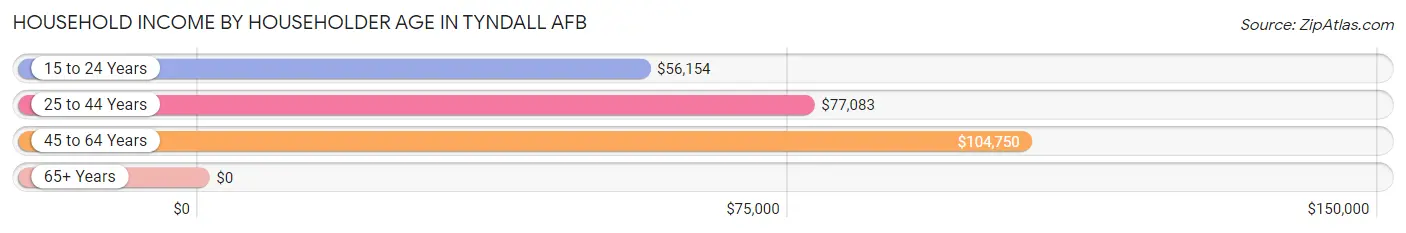
| Income Bracket | # Households | Median Income |
| 15 to 24 Years | 44 (33.1%) | $56,154 |
| 25 to 44 Years | 57 (42.9%) | $77,083 |
| 45 to 64 Years | 32 (24.1%) | $104,750 |
| 65+ Years | 0 (0.0%) | $0 |
| Total | 133 (100.0%) | $90,104 |
Poverty in Tyndall AFB
Income Below Poverty by Sex and Age in Tyndall AFB
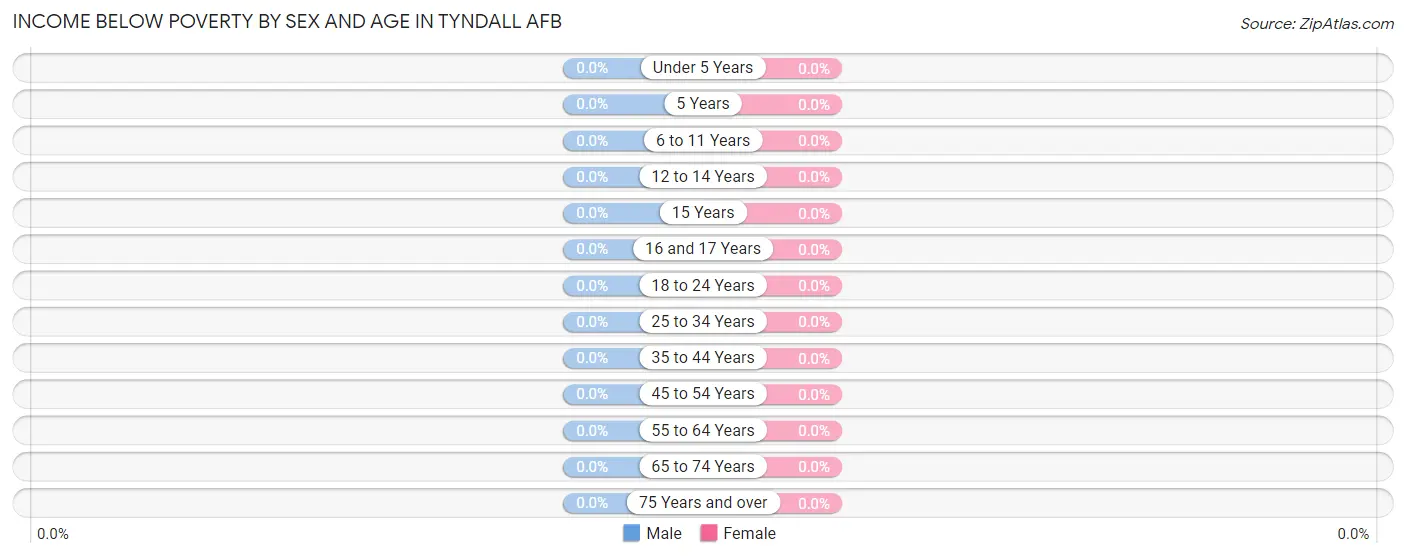
| Age Bracket | Male | Female |
| Under 5 Years | 0 (0.0%) | 0 (0.0%) |
| 5 Years | 0 (0.0%) | 0 (0.0%) |
| 6 to 11 Years | 0 (0.0%) | 0 (0.0%) |
| 12 to 14 Years | 0 (0.0%) | 0 (0.0%) |
| 15 Years | 0 (0.0%) | 0 (0.0%) |
| 16 and 17 Years | 0 (0.0%) | 0 (0.0%) |
| 18 to 24 Years | 0 (0.0%) | 0 (0.0%) |
| 25 to 34 Years | 0 (0.0%) | 0 (0.0%) |
| 35 to 44 Years | 0 (0.0%) | 0 (0.0%) |
| 45 to 54 Years | 0 (0.0%) | 0 (0.0%) |
| 55 to 64 Years | 0 (0.0%) | 0 (0.0%) |
| 65 to 74 Years | 0 (0.0%) | 0 (0.0%) |
| 75 Years and over | 0 (0.0%) | 0 (0.0%) |
| Total | 0 (0.0%) | 0 (0.0%) |
Income Above Poverty by Sex and Age in Tyndall AFB
According to the poverty statistics in Tyndall AFB, males aged under 5 years and females aged under 5 years are the age groups that are most secure financially, with 100.0% of males and 100.0% of females in these age groups living above the poverty line.
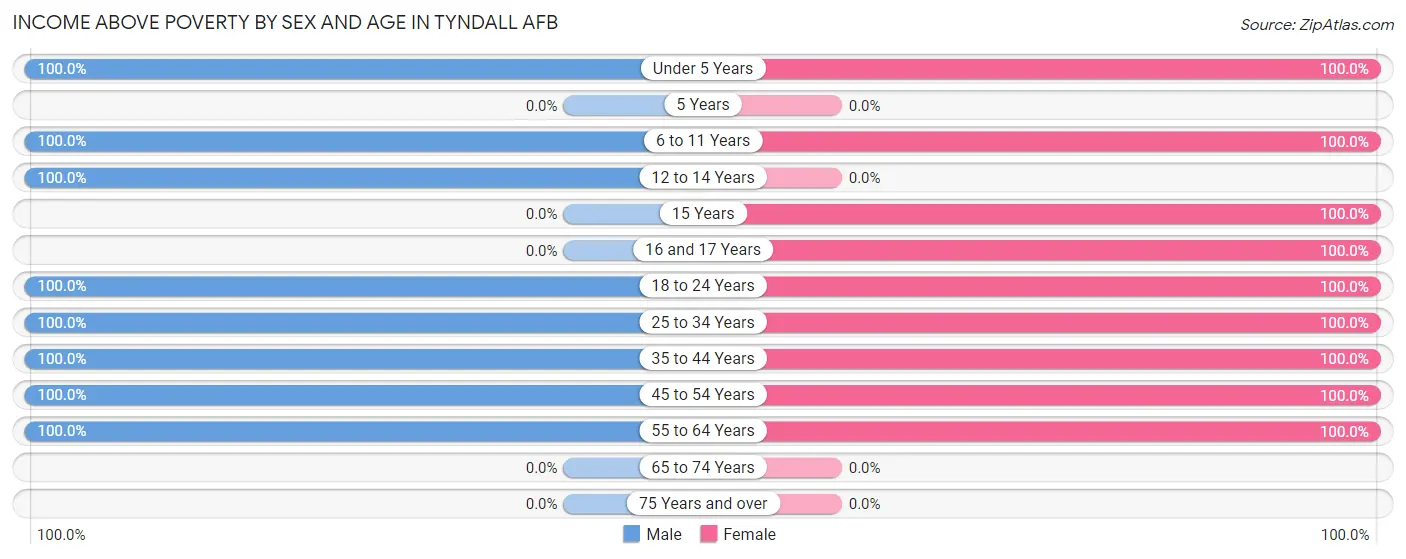
| Age Bracket | Male | Female |
| Under 5 Years | 17 (100.0%) | 29 (100.0%) |
| 5 Years | 0 (0.0%) | 0 (0.0%) |
| 6 to 11 Years | 29 (100.0%) | 37 (100.0%) |
| 12 to 14 Years | 20 (100.0%) | 0 (0.0%) |
| 15 Years | 0 (0.0%) | 8 (100.0%) |
| 16 and 17 Years | 0 (0.0%) | 9 (100.0%) |
| 18 to 24 Years | 54 (100.0%) | 14 (100.0%) |
| 25 to 34 Years | 25 (100.0%) | 16 (100.0%) |
| 35 to 44 Years | 32 (100.0%) | 42 (100.0%) |
| 45 to 54 Years | 25 (100.0%) | 23 (100.0%) |
| 55 to 64 Years | 7 (100.0%) | 9 (100.0%) |
| 65 to 74 Years | 0 (0.0%) | 0 (0.0%) |
| 75 Years and over | 0 (0.0%) | 0 (0.0%) |
| Total | 209 (100.0%) | 187 (100.0%) |
Income Below Poverty Among Married-Couple Families in Tyndall AFB
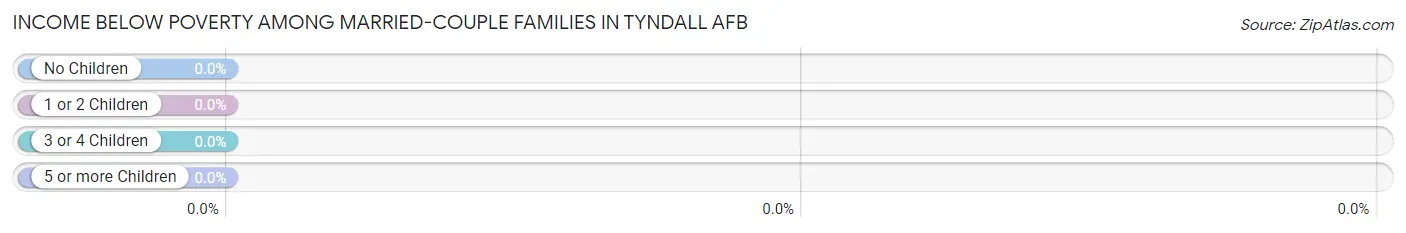
| Children | Above Poverty | Below Poverty |
| No Children | 28 (100.0%) | 0 (0.0%) |
| 1 or 2 Children | 58 (100.0%) | 0 (0.0%) |
| 3 or 4 Children | 18 (100.0%) | 0 (0.0%) |
| 5 or more Children | 0 (0.0%) | 0 (0.0%) |
| Total | 104 (100.0%) | 0 (0.0%) |
Income Below Poverty Among Single-Parent Households in Tyndall AFB
| Children | Single Father | Single Mother |
| No Children | 0 (0.0%) | 0 (0.0%) |
| 1 or 2 Children | 0 (0.0%) | 0 (0.0%) |
| 3 or 4 Children | 0 (0.0%) | 0 (0.0%) |
| 5 or more Children | 0 (0.0%) | 0 (0.0%) |
| Total | 0 (0.0%) | 0 (0.0%) |
Income Below Poverty Among Married-Couple vs Single-Parent Households in Tyndall AFB
| Children | Married-Couple Families | Single-Parent Households |
| No Children | 0 (0.0%) | 0 (0.0%) |
| 1 or 2 Children | 0 (0.0%) | 0 (0.0%) |
| 3 or 4 Children | 0 (0.0%) | 0 (0.0%) |
| 5 or more Children | 0 (0.0%) | 0 (0.0%) |
| Total | 0 (0.0%) | 0 (0.0%) |
Race in Tyndall AFB
The most populous races in Tyndall AFB are White / Caucasian (609 | 81.6%), Black / African American (91 | 12.2%), and Hispanic or Latino (58 | 7.8%).
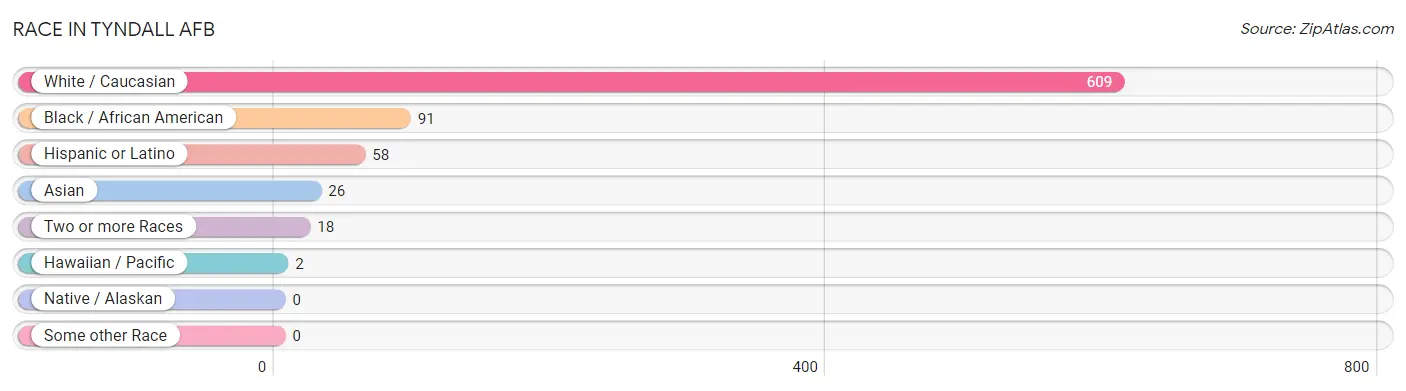
| Race | # Population | % Population |
| Asian | 26 | 3.5% |
| Black / African American | 91 | 12.2% |
| Hawaiian / Pacific | 2 | 0.3% |
| Hispanic or Latino | 58 | 7.8% |
| Native / Alaskan | 0 | 0.0% |
| White / Caucasian | 609 | 81.6% |
| Two or more Races | 18 | 2.4% |
| Some other Race | 0 | 0.0% |
| Total | 746 | 100.0% |
Ancestry in Tyndall AFB
The most populous ancestries reported in Tyndall AFB are Irish (128 | 17.2%), German (116 | 15.5%), English (98 | 13.1%), American (47 | 6.3%), and Mexican (42 | 5.6%), together accounting for 57.8% of all Tyndall AFB residents.
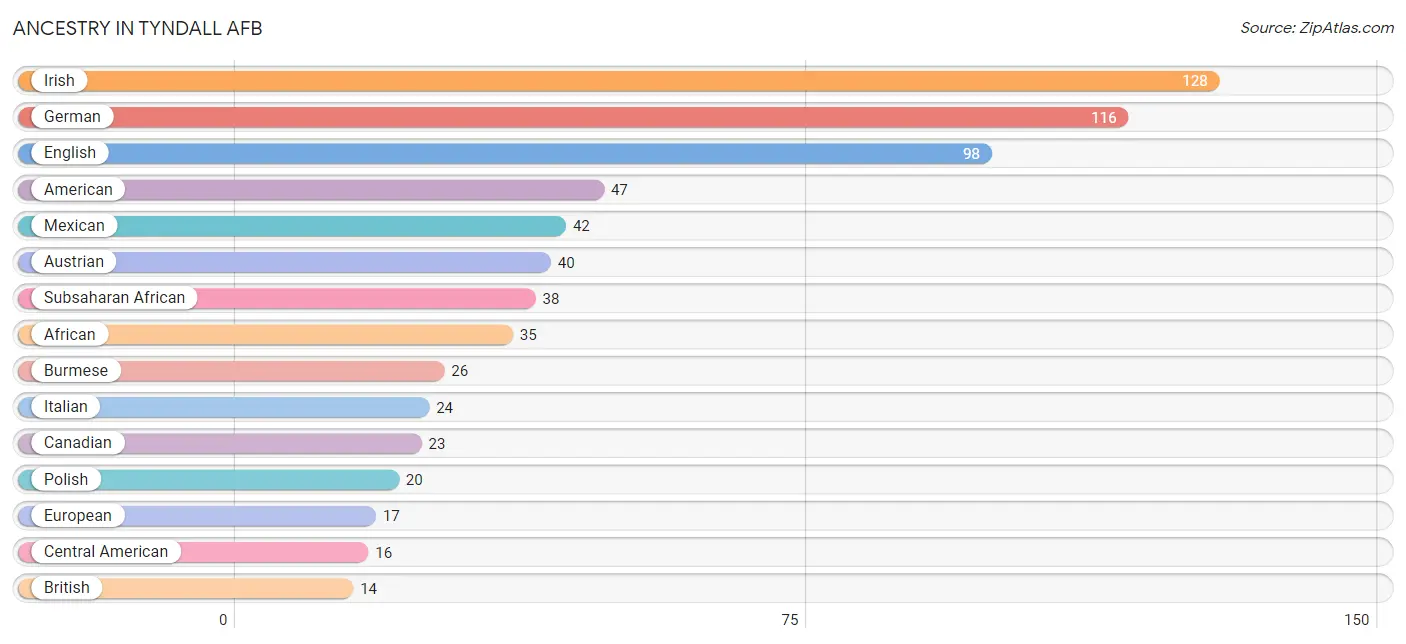
| Ancestry | # Population | % Population |
| African | 35 | 4.7% |
| American | 47 | 6.3% |
| Austrian | 40 | 5.4% |
| British | 14 | 1.9% |
| Burmese | 26 | 3.5% |
| Canadian | 23 | 3.1% |
| Central American | 16 | 2.1% |
| English | 98 | 13.1% |
| European | 17 | 2.3% |
| French | 3 | 0.4% |
| German | 116 | 15.5% |
| Honduran | 6 | 0.8% |
| Irish | 128 | 17.2% |
| Italian | 24 | 3.2% |
| Mexican | 42 | 5.6% |
| Panamanian | 10 | 1.3% |
| Polish | 20 | 2.7% |
| Portuguese | 10 | 1.3% |
| Samoan | 9 | 1.2% |
| Scottish | 14 | 1.9% |
| Subsaharan African | 38 | 5.1% |
| West Indian | 8 | 1.1% | View All 22 Rows |
Immigrants in Tyndall AFB
The most numerous immigrant groups reported in Tyndall AFB came from Asia (21 | 2.8%), Eastern Asia (21 | 2.8%), Korea (21 | 2.8%), Europe (13 | 1.7%), and Germany (13 | 1.7%), together accounting for 11.9% of all Tyndall AFB residents.
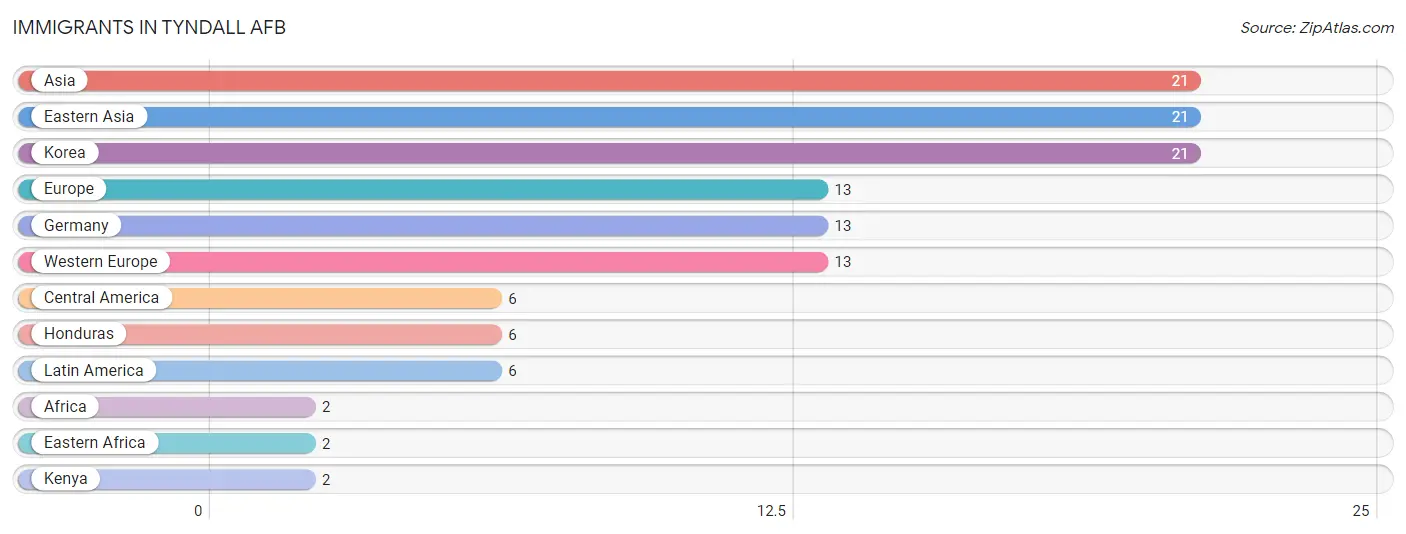
| Immigration Origin | # Population | % Population |
| Africa | 2 | 0.3% |
| Asia | 21 | 2.8% |
| Central America | 6 | 0.8% |
| Eastern Africa | 2 | 0.3% |
| Eastern Asia | 21 | 2.8% |
| Europe | 13 | 1.7% |
| Germany | 13 | 1.7% |
| Honduras | 6 | 0.8% |
| Kenya | 2 | 0.3% |
| Korea | 21 | 2.8% |
| Latin America | 6 | 0.8% |
| Western Europe | 13 | 1.7% | View All 12 Rows |
Sex and Age in Tyndall AFB
Sex and Age in Tyndall AFB
The most populous age groups in Tyndall AFB are 20 to 24 Years (236 | 53.6%) for men and 20 to 24 Years (114 | 37.2%) for women.
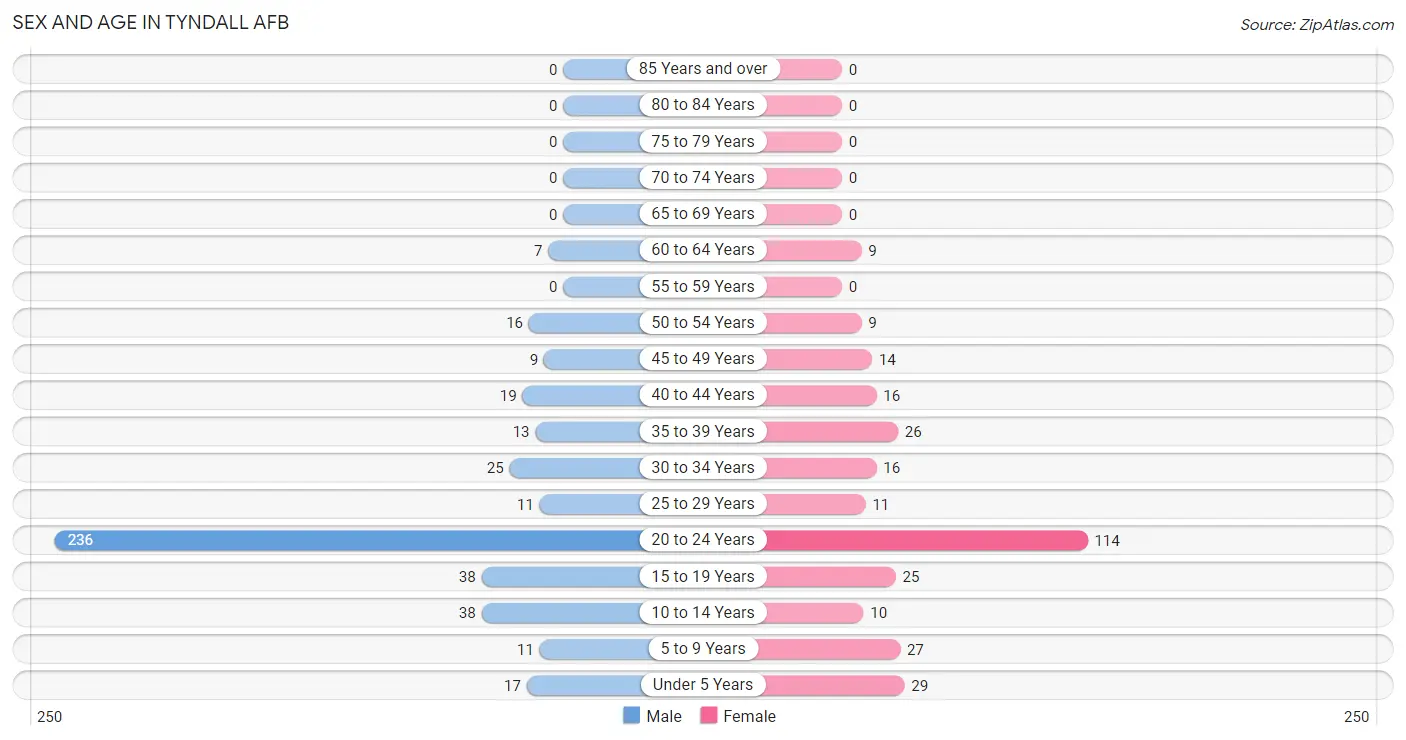
| Age Bracket | Male | Female |
| Under 5 Years | 17 (3.9%) | 29 (9.5%) |
| 5 to 9 Years | 11 (2.5%) | 27 (8.8%) |
| 10 to 14 Years | 38 (8.6%) | 10 (3.3%) |
| 15 to 19 Years | 38 (8.6%) | 25 (8.2%) |
| 20 to 24 Years | 236 (53.6%) | 114 (37.2%) |
| 25 to 29 Years | 11 (2.5%) | 11 (3.6%) |
| 30 to 34 Years | 25 (5.7%) | 16 (5.2%) |
| 35 to 39 Years | 13 (2.9%) | 26 (8.5%) |
| 40 to 44 Years | 19 (4.3%) | 16 (5.2%) |
| 45 to 49 Years | 9 (2.1%) | 14 (4.6%) |
| 50 to 54 Years | 16 (3.6%) | 9 (2.9%) |
| 55 to 59 Years | 0 (0.0%) | 0 (0.0%) |
| 60 to 64 Years | 7 (1.6%) | 9 (2.9%) |
| 65 to 69 Years | 0 (0.0%) | 0 (0.0%) |
| 70 to 74 Years | 0 (0.0%) | 0 (0.0%) |
| 75 to 79 Years | 0 (0.0%) | 0 (0.0%) |
| 80 to 84 Years | 0 (0.0%) | 0 (0.0%) |
| 85 Years and over | 0 (0.0%) | 0 (0.0%) |
| Total | 440 (100.0%) | 306 (100.0%) |
Families and Households in Tyndall AFB
Median Family Size in Tyndall AFB
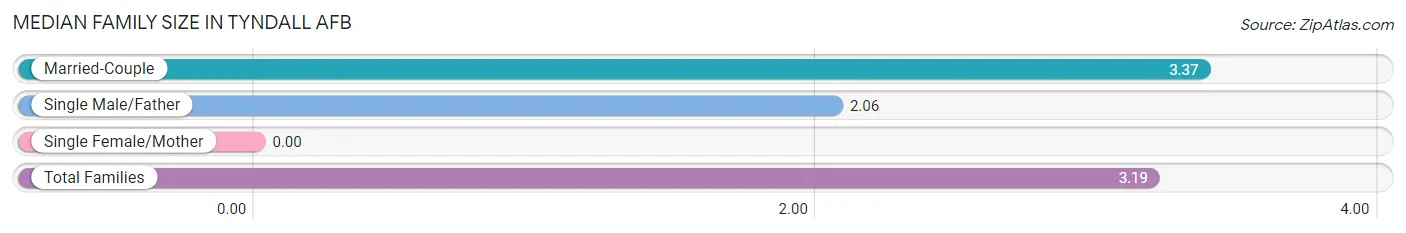
| Family Type | # Families | Family Size |
| Married-Couple | 104 (86.7%) | 3.37 |
| Single Male/Father | 16 (13.3%) | 2.06 |
| Single Female/Mother | 0 (0.0%) | - |
| Total Families | 120 (100.0%) | 3.19 |
Median Household Size in Tyndall AFB
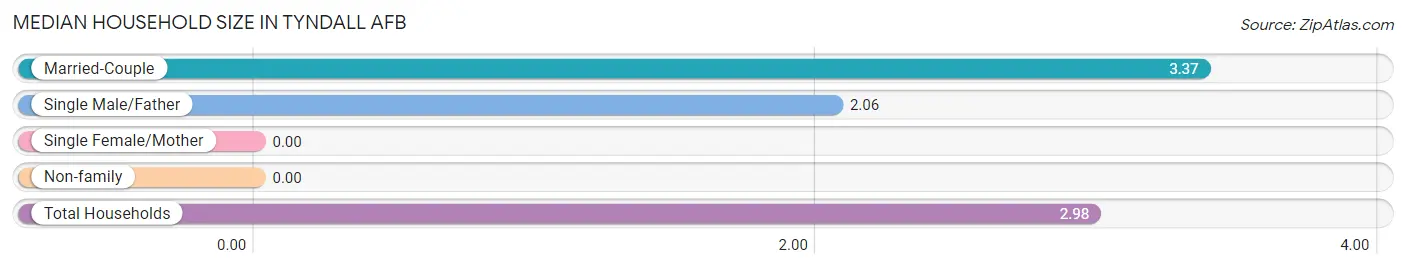
| Household Type | # Households | Household Size |
| Married-Couple | 104 (78.2%) | 3.37 |
| Single Male/Father | 16 (12.0%) | 2.06 |
| Single Female/Mother | 0 (0.0%) | - |
| Non-family | 13 (9.8%) | - |
| Total Households | 133 (100.0%) | 2.98 |
Household Size by Marriage Status in Tyndall AFB
Out of a total of 133 households in Tyndall AFB, 120 (90.2%) are family households, while 13 (9.8%) are nonfamily households. The most numerous type of family households are 2-person households, comprising 44, and the most common type of nonfamily households are 1-person households, comprising 13.
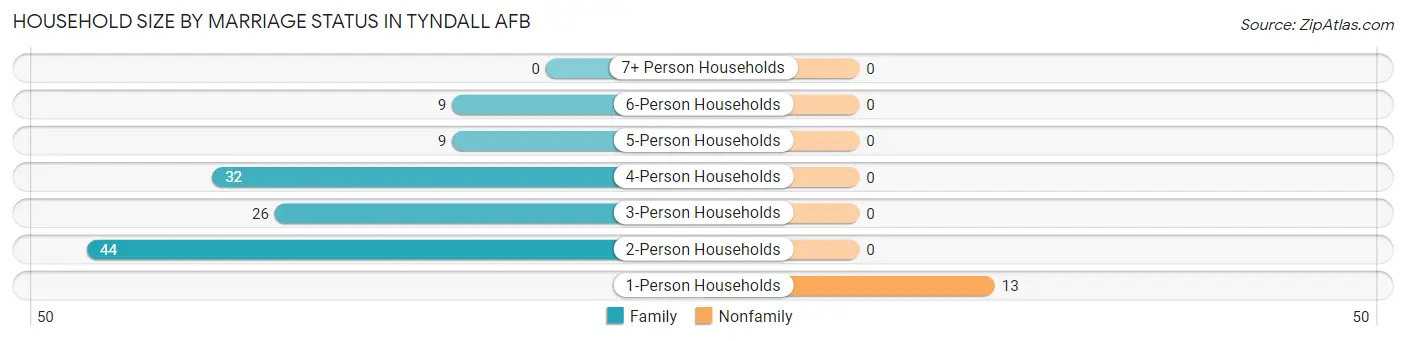
| Household Size | Family Households | Nonfamily Households |
| 1-Person Households | - | 13 (9.8%) |
| 2-Person Households | 44 (33.1%) | 0 (0.0%) |
| 3-Person Households | 26 (19.6%) | 0 (0.0%) |
| 4-Person Households | 32 (24.1%) | 0 (0.0%) |
| 5-Person Households | 9 (6.8%) | 0 (0.0%) |
| 6-Person Households | 9 (6.8%) | 0 (0.0%) |
| 7+ Person Households | 0 (0.0%) | 0 (0.0%) |
| Total | 120 (90.2%) | 13 (9.8%) |
Female Fertility in Tyndall AFB
Fertility by Age in Tyndall AFB
Average fertility rate in Tyndall AFB is 32.0 births per 1,000 women. Women in the age bracket of 35 to 50 years have the highest fertility rate with 125.0 births per 1,000 women. Women in the age bracket of 35 to 50 years acount for 100.0% of all women with births.
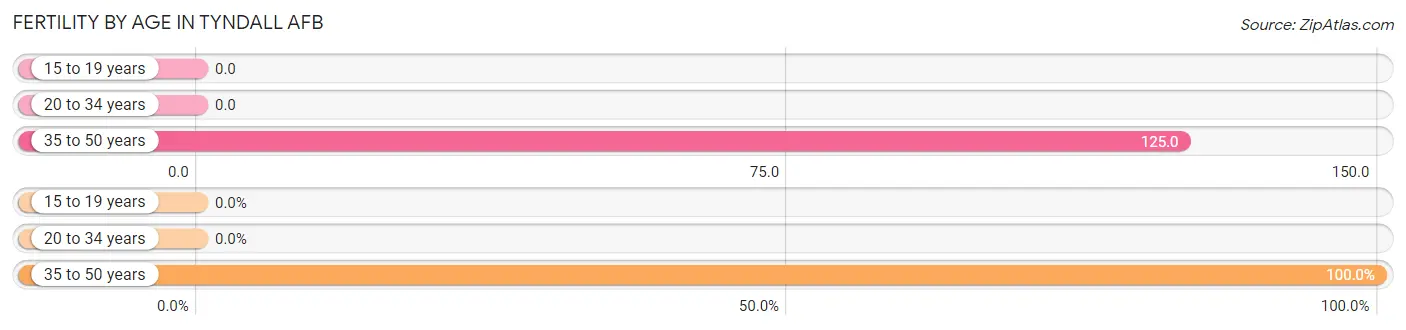
| Age Bracket | Women with Births | Births / 1,000 Women |
| 15 to 19 years | 0 (0.0%) | 0.0 |
| 20 to 34 years | 0 (0.0%) | 0.0 |
| 35 to 50 years | 7 (100.0%) | 125.0 |
| Total | 7 (100.0%) | 32.0 |
Fertility by Age by Marriage Status in Tyndall AFB
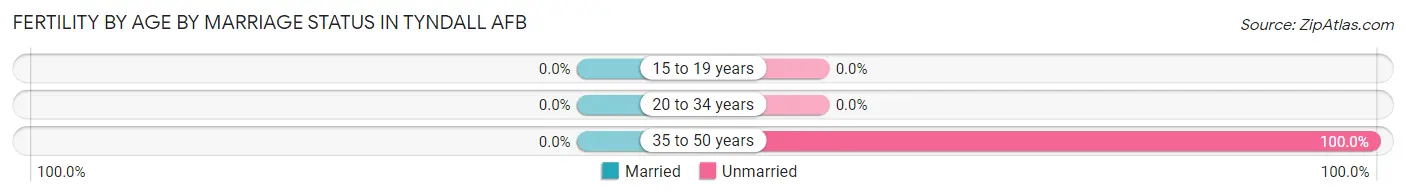
| Age Bracket | Married | Unmarried |
| 15 to 19 years | 0 (0.0%) | 0 (0.0%) |
| 20 to 34 years | 0 (0.0%) | 0 (0.0%) |
| 35 to 50 years | 0 (0.0%) | 7 (100.0%) |
| Total | 0 (0.0%) | 7 (100.0%) |
Fertility by Education in Tyndall AFB
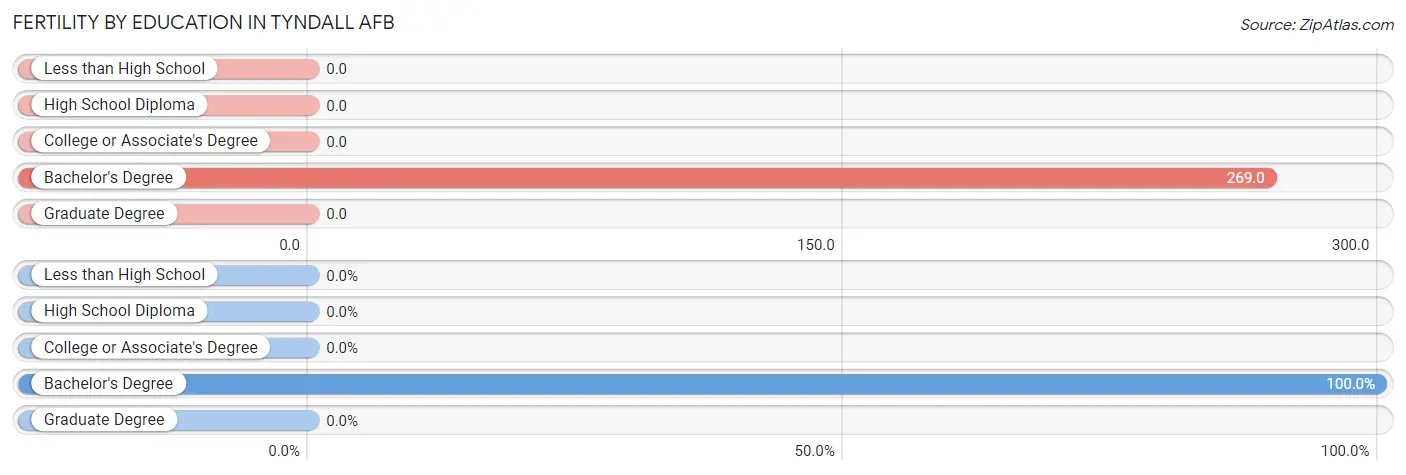
| Educational Attainment | Women with Births | Births / 1,000 Women |
| Less than High School | 0 (0.0%) | 0.0 |
| High School Diploma | 0 (0.0%) | 0.0 |
| College or Associate's Degree | 0 (0.0%) | 0.0 |
| Bachelor's Degree | 7 (100.0%) | 269.0 |
| Graduate Degree | 0 (0.0%) | 0.0 |
| Total | 7 (100.0%) | 32.0 |
Fertility by Education by Marriage Status in Tyndall AFB
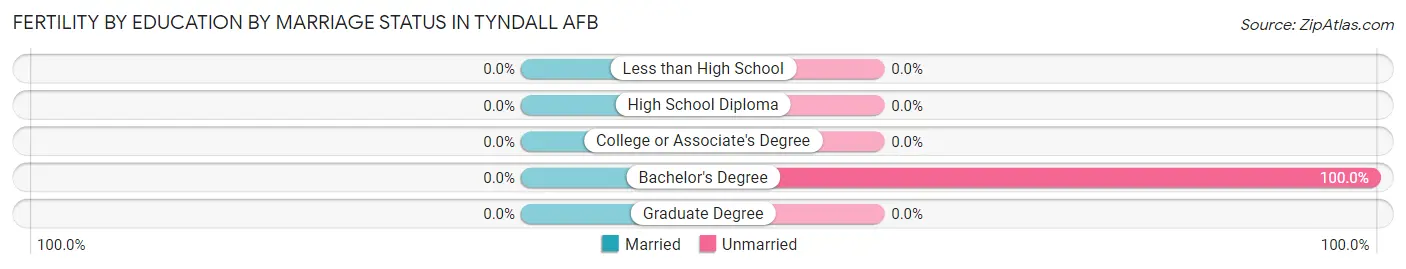
| Educational Attainment | Married | Unmarried |
| Less than High School | 0 (0.0%) | 0 (0.0%) |
| High School Diploma | 0 (0.0%) | 0 (0.0%) |
| College or Associate's Degree | 0 (0.0%) | 0 (0.0%) |
| Bachelor's Degree | 0 (0.0%) | 7 (100.0%) |
| Graduate Degree | 0 (0.0%) | 0 (0.0%) |
| Total | 0 (0.0%) | 7 (100.0%) |
Employment Characteristics in Tyndall AFB
Employment by Class of Employer in Tyndall AFB
Among the 501 employed individuals in Tyndall AFB, federal government employees (432 | 86.2%), private company employees (67 | 13.4%), and not-for-profit organizations (2 | 0.4%) make up the most common classes of employment.
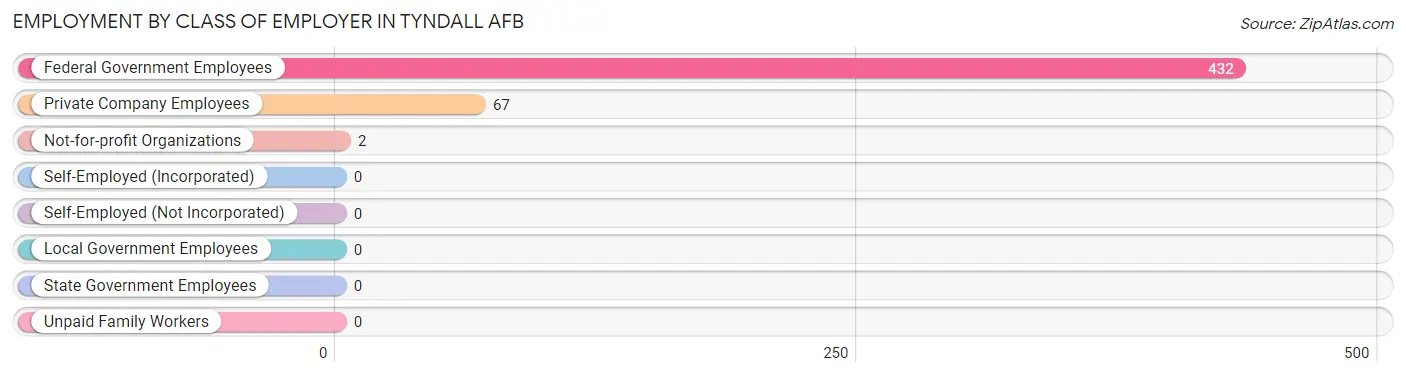
| Employer Class | # Employees | % Employees |
| Private Company Employees | 67 | 13.4% |
| Self-Employed (Incorporated) | 0 | 0.0% |
| Self-Employed (Not Incorporated) | 0 | 0.0% |
| Not-for-profit Organizations | 2 | 0.4% |
| Local Government Employees | 0 | 0.0% |
| State Government Employees | 0 | 0.0% |
| Federal Government Employees | 432 | 86.2% |
| Unpaid Family Workers | 0 | 0.0% |
| Total | 501 | 100.0% |
Employment Status by Age in Tyndall AFB
According to the labor force statistics for Tyndall AFB, out of the total population over 16 years of age (606), 86.3% or 523 individuals are in the labor force, with 9.8% or 51 of them unemployed. The age group with the highest labor force participation rate is 25 to 29 years, with 100.0% or 22 individuals in the labor force. Within the labor force, the 35 to 44 years age range has the highest percentage of unemployed individuals, with 25.6% or 16 of them being unemployed.
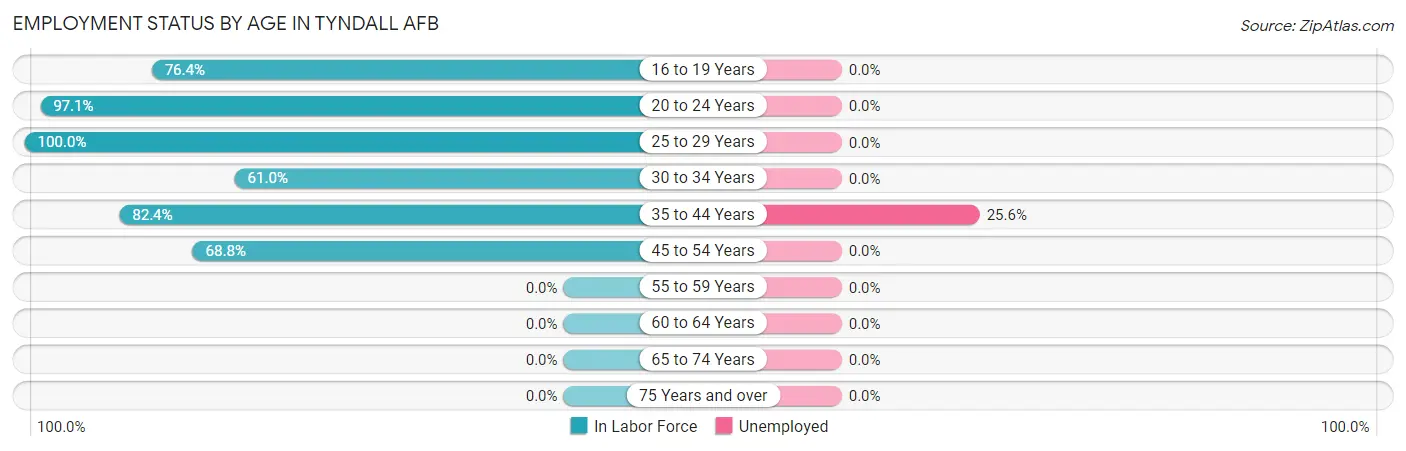
| Age Bracket | In Labor Force | Unemployed |
| 16 to 19 Years | 42 (76.4%) | 0 (0.0%) |
| 20 to 24 Years | 340 (97.1%) | 0 (0.0%) |
| 25 to 29 Years | 22 (100.0%) | 0 (0.0%) |
| 30 to 34 Years | 25 (61.0%) | 0 (0.0%) |
| 35 to 44 Years | 61 (82.4%) | 16 (25.6%) |
| 45 to 54 Years | 33 (68.8%) | 0 (0.0%) |
| 55 to 59 Years | 0 (0.0%) | 0 (0.0%) |
| 60 to 64 Years | 0 (0.0%) | 0 (0.0%) |
| 65 to 74 Years | 0 (0.0%) | 0 (0.0%) |
| 75 Years and over | 0 (0.0%) | 0 (0.0%) |
| Total | 523 (86.3%) | 51 (9.8%) |
Employment Status by Educational Attainment in Tyndall AFB
According to labor force statistics for Tyndall AFB, 70.1% of individuals (141) out of the total population between 25 and 64 years of age (201) are in the labor force, with 14.1% or 20 of them being unemployed. The group with the highest labor force participation rate are those with the educational attainment of bachelor's degree or higher, with 89.5% or 77 individuals in the labor force. Within the labor force, individuals with college / associate degree education have the highest percentage of unemployment, with 27.8% or 15 of them being unemployed.
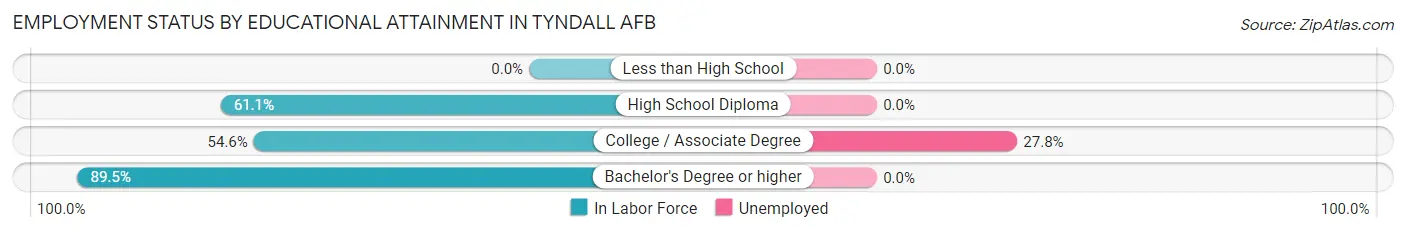
| Educational Attainment | In Labor Force | Unemployed |
| Less than High School | 0 (0.0%) | 0 (0.0%) |
| High School Diploma | 11 (61.1%) | 0 (0.0%) |
| College / Associate Degree | 53 (54.6%) | 27 (27.8%) |
| Bachelor's Degree or higher | 77 (89.5%) | 0 (0.0%) |
| Total | 141 (70.1%) | 28 (14.1%) |
Employment Occupations by Sex in Tyndall AFB
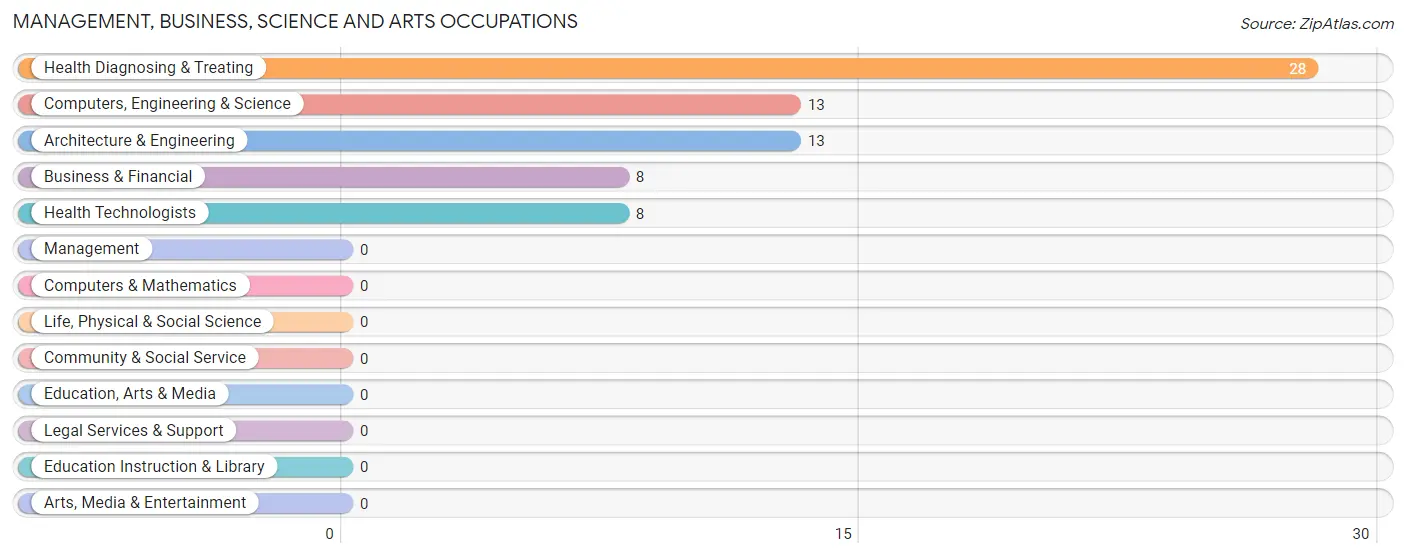
Management, Business, Science and Arts Occupations
The most common Management, Business, Science and Arts occupations in Tyndall AFB are Health Diagnosing & Treating (28 | 30.4%), Computers, Engineering & Science (13 | 14.1%), Architecture & Engineering (13 | 14.1%), Business & Financial (8 | 8.7%), and Health Technologists (8 | 8.7%).
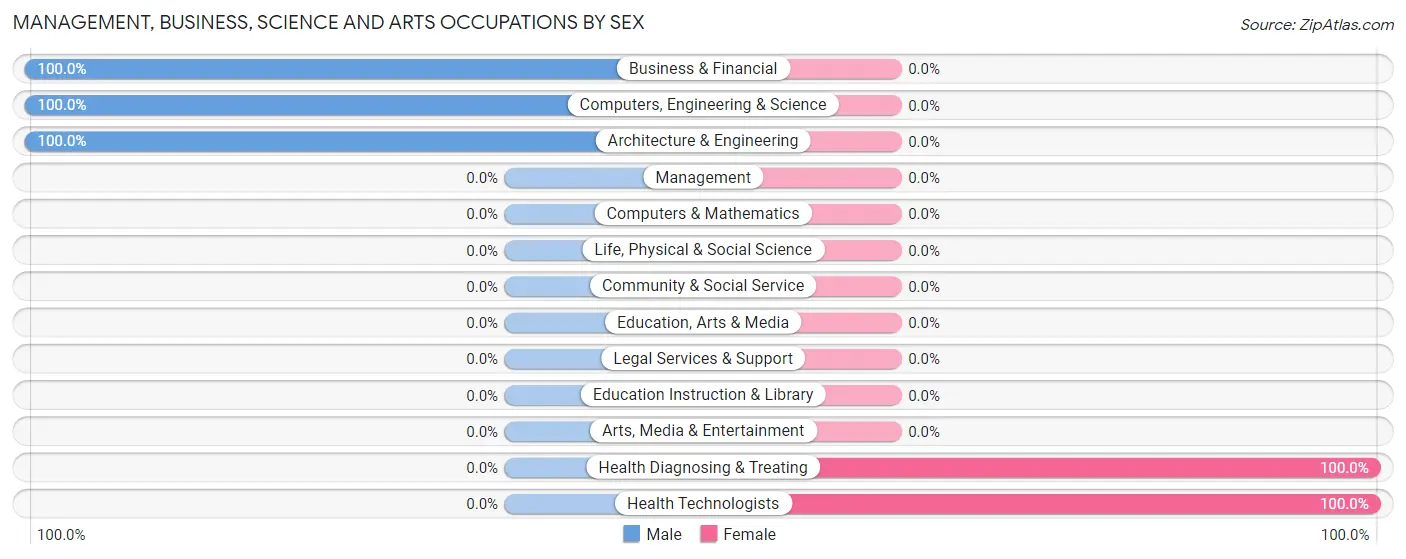
Management, Business, Science and Arts Occupations by Sex
Within the Management, Business, Science and Arts occupations in Tyndall AFB, the most male-oriented occupations are Business & Financial (100.0%), Computers, Engineering & Science (100.0%), and Architecture & Engineering (100.0%), while the most female-oriented occupations are Health Diagnosing & Treating (100.0%), and Health Technologists (100.0%).
| Occupation | Male | Female |
| Management | 0 (0.0%) | 0 (0.0%) |
| Business & Financial | 8 (100.0%) | 0 (0.0%) |
| Computers, Engineering & Science | 13 (100.0%) | 0 (0.0%) |
| Computers & Mathematics | 0 (0.0%) | 0 (0.0%) |
| Architecture & Engineering | 13 (100.0%) | 0 (0.0%) |
| Life, Physical & Social Science | 0 (0.0%) | 0 (0.0%) |
| Community & Social Service | 0 (0.0%) | 0 (0.0%) |
| Education, Arts & Media | 0 (0.0%) | 0 (0.0%) |
| Legal Services & Support | 0 (0.0%) | 0 (0.0%) |
| Education Instruction & Library | 0 (0.0%) | 0 (0.0%) |
| Arts, Media & Entertainment | 0 (0.0%) | 0 (0.0%) |
| Health Diagnosing & Treating | 0 (0.0%) | 28 (100.0%) |
| Health Technologists | 0 (0.0%) | 8 (100.0%) |
| Total (Category) | 21 (42.9%) | 28 (57.1%) |
| Total (Overall) | 35 (38.0%) | 57 (62.0%) |
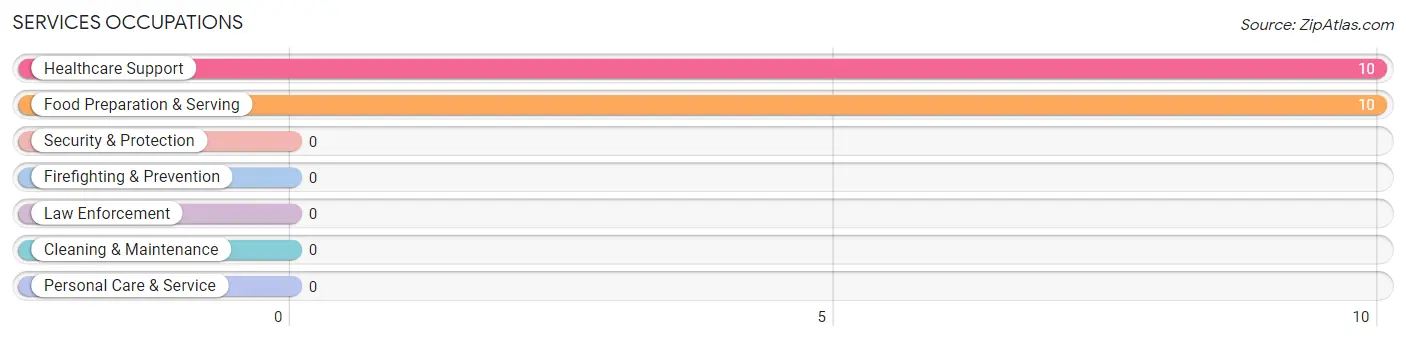
Services Occupations
The most common Services occupations in Tyndall AFB are Healthcare Support (10 | 10.9%), and Food Preparation & Serving (10 | 10.9%).
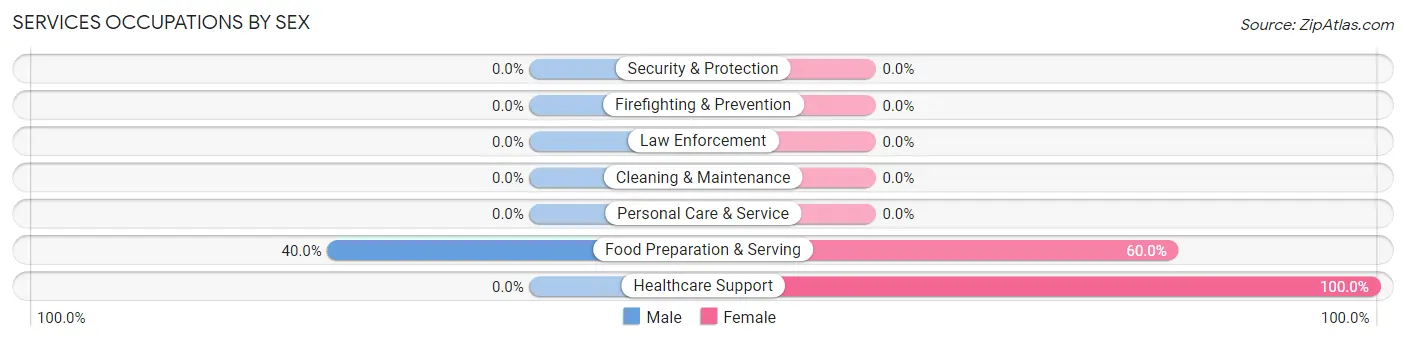
Services Occupations by Sex
| Occupation | Male | Female |
| Healthcare Support | 0 (0.0%) | 10 (100.0%) |
| Security & Protection | 0 (0.0%) | 0 (0.0%) |
| Firefighting & Prevention | 0 (0.0%) | 0 (0.0%) |
| Law Enforcement | 0 (0.0%) | 0 (0.0%) |
| Food Preparation & Serving | 4 (40.0%) | 6 (60.0%) |
| Cleaning & Maintenance | 0 (0.0%) | 0 (0.0%) |
| Personal Care & Service | 0 (0.0%) | 0 (0.0%) |
| Total (Category) | 4 (20.0%) | 16 (80.0%) |
| Total (Overall) | 35 (38.0%) | 57 (62.0%) |
Sales and Office Occupations
The most common Sales and Office occupations in Tyndall AFB are Office & Administration (21 | 22.8%), and Sales & Related (2 | 2.2%).
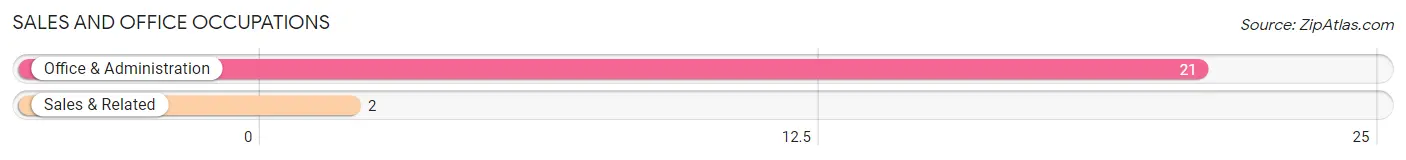
Sales and Office Occupations by Sex
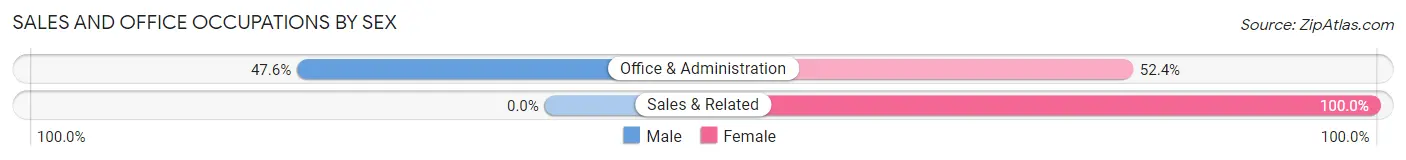
| Occupation | Male | Female |
| Sales & Related | 0 (0.0%) | 2 (100.0%) |
| Office & Administration | 10 (47.6%) | 11 (52.4%) |
| Total (Category) | 10 (43.5%) | 13 (56.5%) |
| Total (Overall) | 35 (38.0%) | 57 (62.0%) |
Natural Resources, Construction and Maintenance Occupations
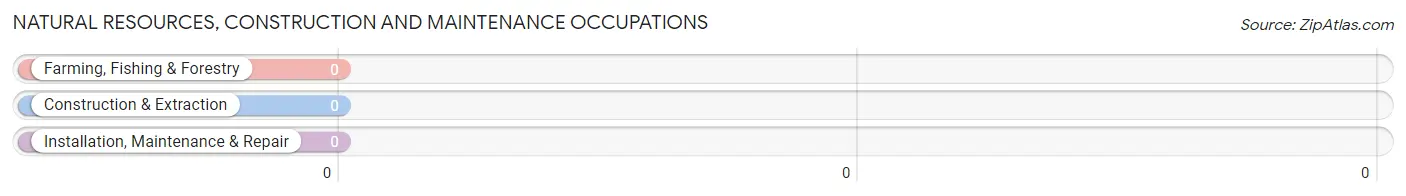
Natural Resources, Construction and Maintenance Occupations by Sex
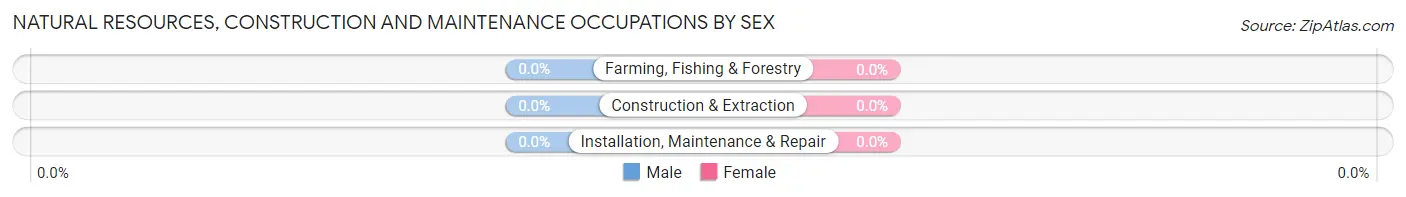
| Occupation | Male | Female |
| Farming, Fishing & Forestry | 0 (0.0%) | 0 (0.0%) |
| Construction & Extraction | 0 (0.0%) | 0 (0.0%) |
| Installation, Maintenance & Repair | 0 (0.0%) | 0 (0.0%) |
| Total (Category) | 0 (0.0%) | 0 (0.0%) |
| Total (Overall) | 35 (38.0%) | 57 (62.0%) |
Production, Transportation and Moving Occupations
Production, Transportation and Moving Occupations by Sex
| Occupation | Male | Female |
| Production | 0 (0.0%) | 0 (0.0%) |
| Transportation | 0 (0.0%) | 0 (0.0%) |
| Material Moving | 0 (0.0%) | 0 (0.0%) |
| Total (Category) | 0 (0.0%) | 0 (0.0%) |
| Total (Overall) | 35 (38.0%) | 57 (62.0%) |
Employment Industries by Sex in Tyndall AFB
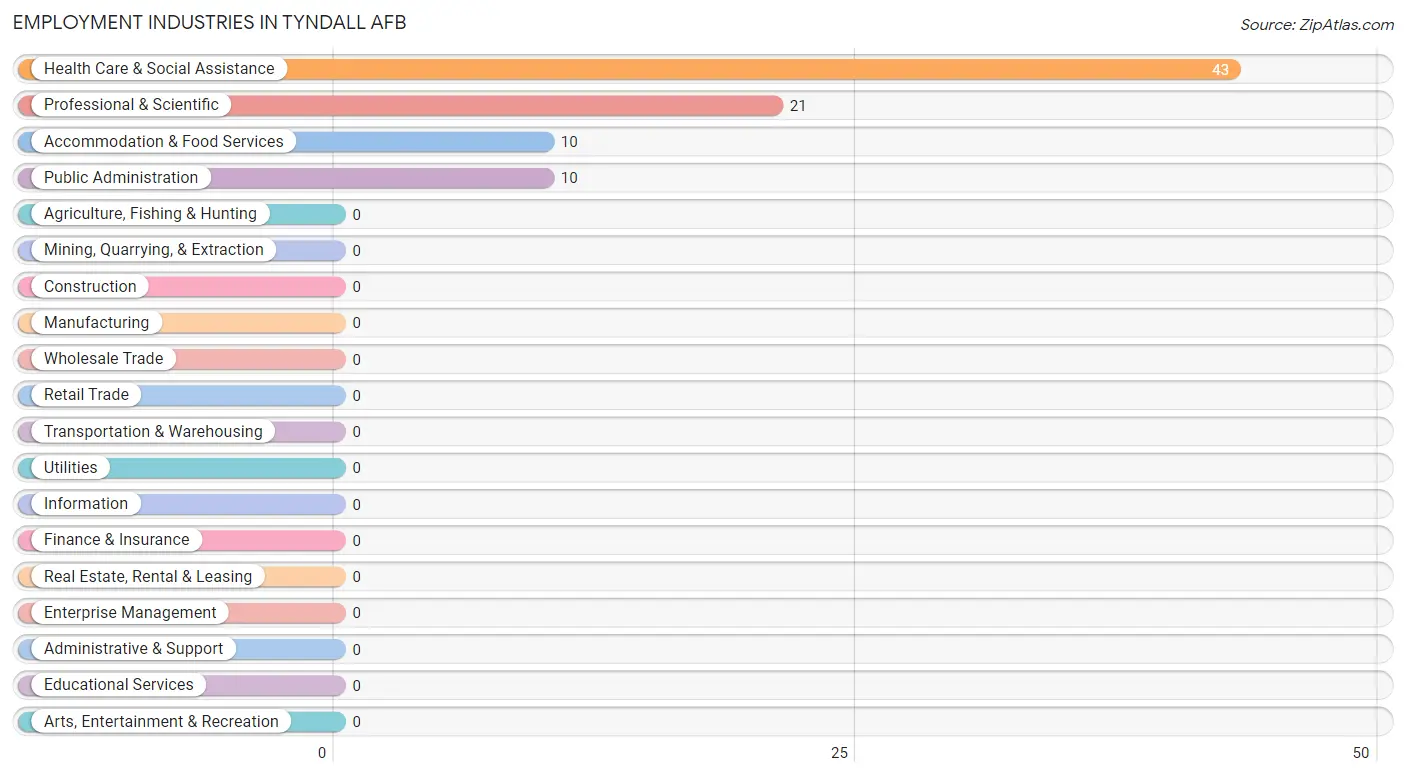
Employment Industries in Tyndall AFB
The major employment industries in Tyndall AFB include Health Care & Social Assistance (43 | 46.7%), Professional & Scientific (21 | 22.8%), Accommodation & Food Services (10 | 10.9%), and Public Administration (10 | 10.9%).
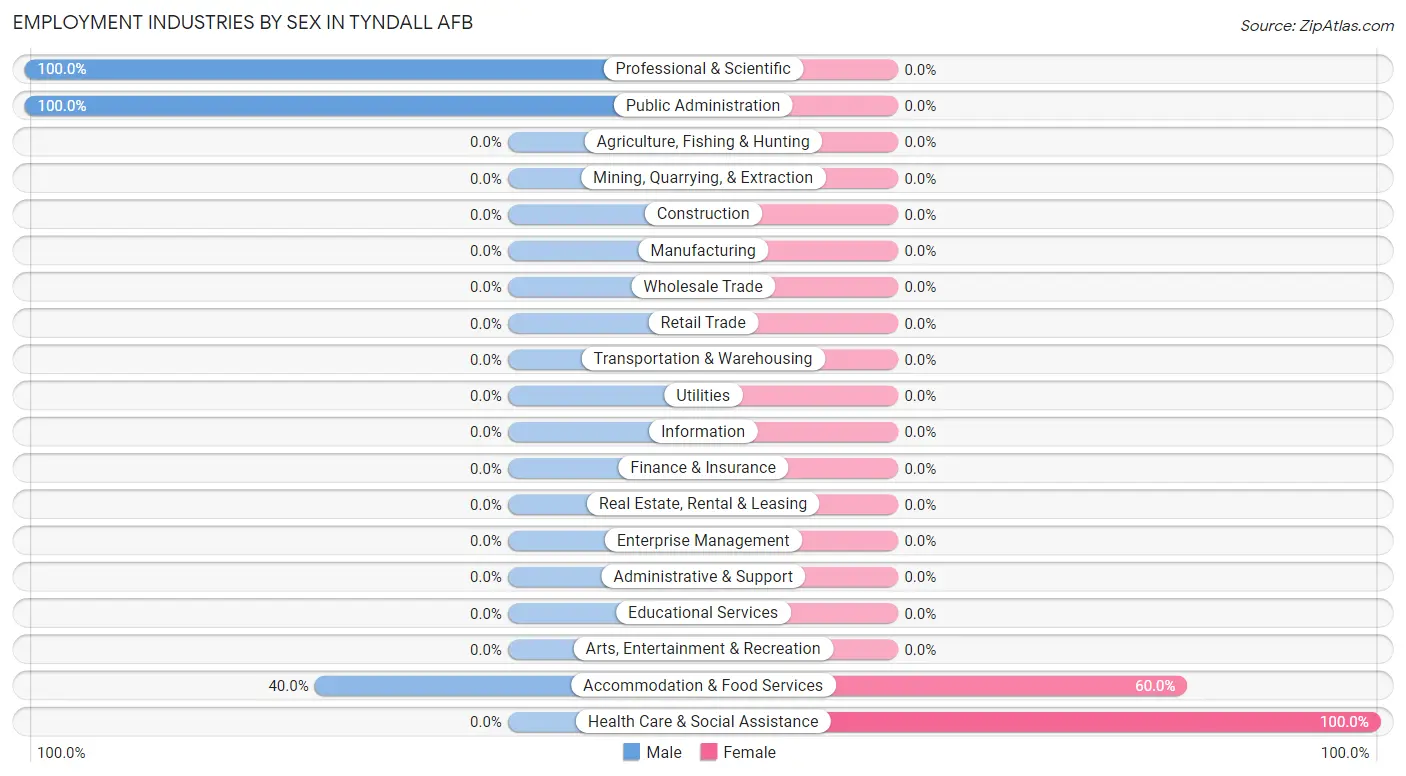
Employment Industries by Sex in Tyndall AFB
The Tyndall AFB industries that see more men than women are Professional & Scientific (100.0%), Public Administration (100.0%), and Accommodation & Food Services (40.0%), whereas the industries that tend to have a higher number of women are Health Care & Social Assistance (100.0%), and Accommodation & Food Services (60.0%).
| Industry | Male | Female |
| Agriculture, Fishing & Hunting | 0 (0.0%) | 0 (0.0%) |
| Mining, Quarrying, & Extraction | 0 (0.0%) | 0 (0.0%) |
| Construction | 0 (0.0%) | 0 (0.0%) |
| Manufacturing | 0 (0.0%) | 0 (0.0%) |
| Wholesale Trade | 0 (0.0%) | 0 (0.0%) |
| Retail Trade | 0 (0.0%) | 0 (0.0%) |
| Transportation & Warehousing | 0 (0.0%) | 0 (0.0%) |
| Utilities | 0 (0.0%) | 0 (0.0%) |
| Information | 0 (0.0%) | 0 (0.0%) |
| Finance & Insurance | 0 (0.0%) | 0 (0.0%) |
| Real Estate, Rental & Leasing | 0 (0.0%) | 0 (0.0%) |
| Professional & Scientific | 21 (100.0%) | 0 (0.0%) |
| Enterprise Management | 0 (0.0%) | 0 (0.0%) |
| Administrative & Support | 0 (0.0%) | 0 (0.0%) |
| Educational Services | 0 (0.0%) | 0 (0.0%) |
| Health Care & Social Assistance | 0 (0.0%) | 43 (100.0%) |
| Arts, Entertainment & Recreation | 0 (0.0%) | 0 (0.0%) |
| Accommodation & Food Services | 4 (40.0%) | 6 (60.0%) |
| Public Administration | 10 (100.0%) | 0 (0.0%) |
| Total | 35 (38.0%) | 57 (62.0%) |
Education in Tyndall AFB
School Enrollment in Tyndall AFB
The most common levels of schooling among the 183 students in Tyndall AFB are college / undergraduate (68 | 37.2%), elementary school (39 | 21.3%), and middle school (33 | 18.0%).
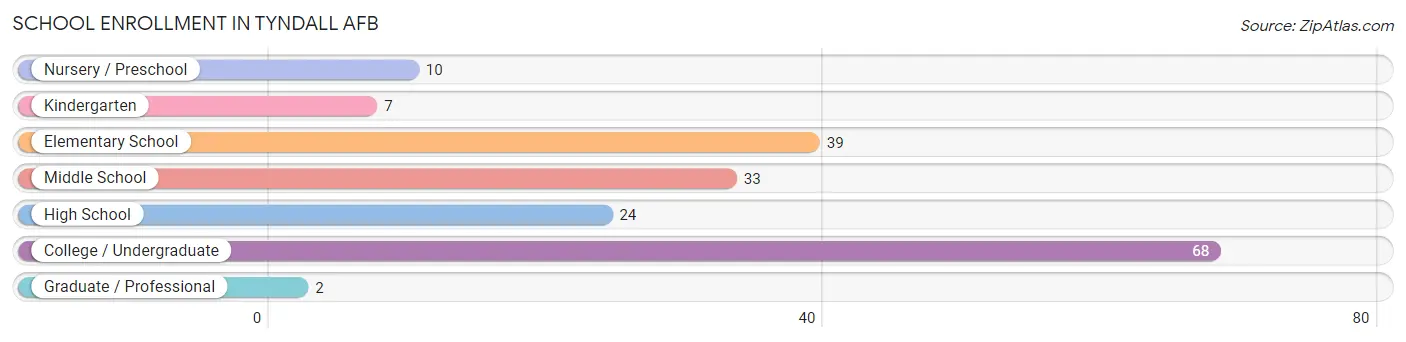
| School Level | # Students | % Students |
| Nursery / Preschool | 10 | 5.5% |
| Kindergarten | 7 | 3.8% |
| Elementary School | 39 | 21.3% |
| Middle School | 33 | 18.0% |
| High School | 24 | 13.1% |
| College / Undergraduate | 68 | 37.2% |
| Graduate / Professional | 2 | 1.1% |
| Total | 183 | 100.0% |
School Enrollment by Age by Funding Source in Tyndall AFB
Out of a total of 183 students who are enrolled in schools in Tyndall AFB, 33 (18.0%) attend a private institution, while the remaining 150 (82.0%) are enrolled in public schools. The age group of 18 to 19 year olds has the highest likelihood of being enrolled in private schools, with 4 (100.0% in the age bracket) enrolled. Conversely, the age group of 3 to 4 year olds has the lowest likelihood of being enrolled in a private school, with 10 (100.0% in the age bracket) attending a public institution.
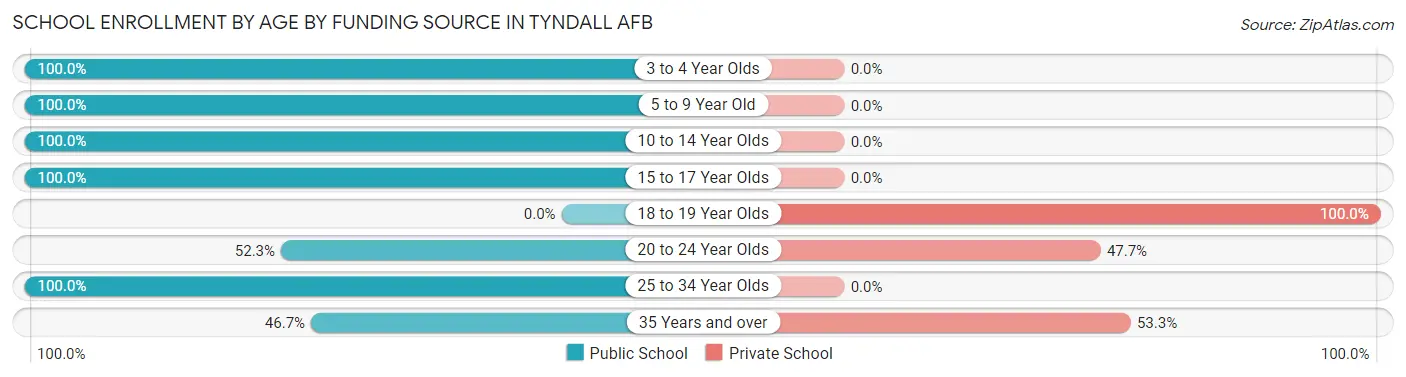
| Age Bracket | Public School | Private School |
| 3 to 4 Year Olds | 10 (100.0%) | 0 (0.0%) |
| 5 to 9 Year Old | 38 (100.0%) | 0 (0.0%) |
| 10 to 14 Year Olds | 48 (100.0%) | 0 (0.0%) |
| 15 to 17 Year Olds | 17 (100.0%) | 0 (0.0%) |
| 18 to 19 Year Olds | 0 (0.0%) | 4 (100.0%) |
| 20 to 24 Year Olds | 23 (52.3%) | 21 (47.7%) |
| 25 to 34 Year Olds | 7 (100.0%) | 0 (0.0%) |
| 35 Years and over | 7 (46.7%) | 8 (53.3%) |
| Total | 150 (82.0%) | 33 (18.0%) |
Educational Attainment by Field of Study in Tyndall AFB
Business (33 | 37.5%), bio, nature & agricultural (19 | 21.6%), liberal arts & history (13 | 14.8%), arts & humanities (12 | 13.6%), and science & technology (7 | 8.0%) are the most common fields of study among 88 individuals in Tyndall AFB who have obtained a bachelor's degree or higher.
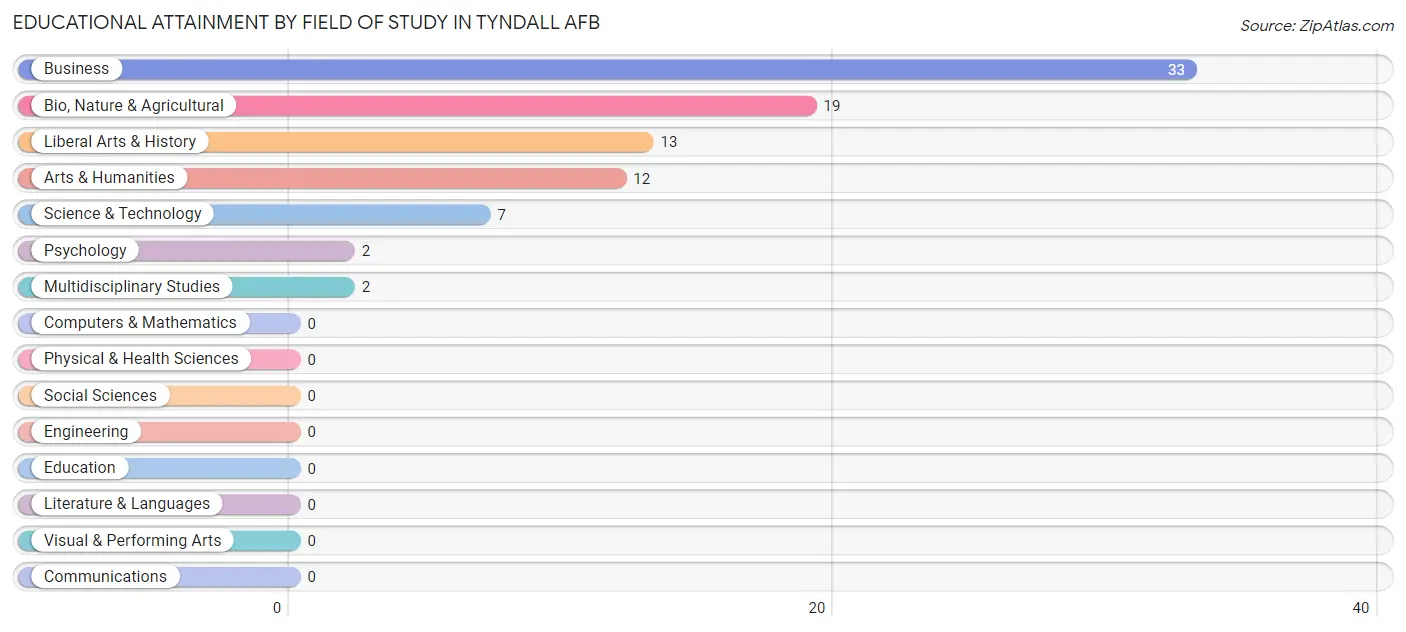
| Field of Study | # Graduates | % Graduates |
| Computers & Mathematics | 0 | 0.0% |
| Bio, Nature & Agricultural | 19 | 21.6% |
| Physical & Health Sciences | 0 | 0.0% |
| Psychology | 2 | 2.3% |
| Social Sciences | 0 | 0.0% |
| Engineering | 0 | 0.0% |
| Multidisciplinary Studies | 2 | 2.3% |
| Science & Technology | 7 | 8.0% |
| Business | 33 | 37.5% |
| Education | 0 | 0.0% |
| Literature & Languages | 0 | 0.0% |
| Liberal Arts & History | 13 | 14.8% |
| Visual & Performing Arts | 0 | 0.0% |
| Communications | 0 | 0.0% |
| Arts & Humanities | 12 | 13.6% |
| Total | 88 | 100.0% |
Transportation & Commute in Tyndall AFB
Vehicle Availability by Sex in Tyndall AFB
The most prevalent vehicle ownership categories in Tyndall AFB are males with 2 vehicles (64, accounting for 58.2%) and females with 2 vehicles (41, making up 112.3%).
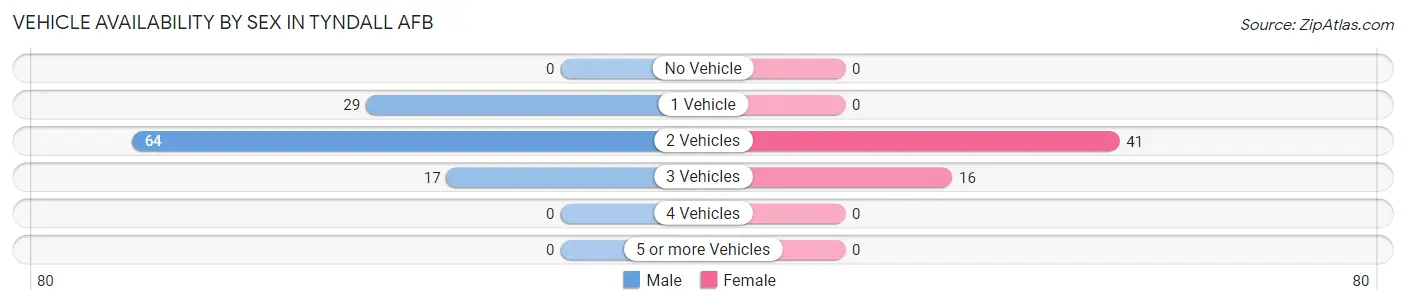
| Vehicles Available | Male | Female |
| No Vehicle | 0 (0.0%) | 0 (0.0%) |
| 1 Vehicle | 29 (26.4%) | 0 (0.0%) |
| 2 Vehicles | 64 (58.2%) | 41 (71.9%) |
| 3 Vehicles | 17 (15.4%) | 16 (28.1%) |
| 4 Vehicles | 0 (0.0%) | 0 (0.0%) |
| 5 or more Vehicles | 0 (0.0%) | 0 (0.0%) |
| Total | 110 (100.0%) | 57 (100.0%) |
Commute Time in Tyndall AFB
The most frequently occuring commute durations in Tyndall AFB are 10 to 14 minutes (163 commuters, 35.0%), 5 to 9 minutes (105 commuters, 22.6%), and 15 to 19 minutes (74 commuters, 15.9%).
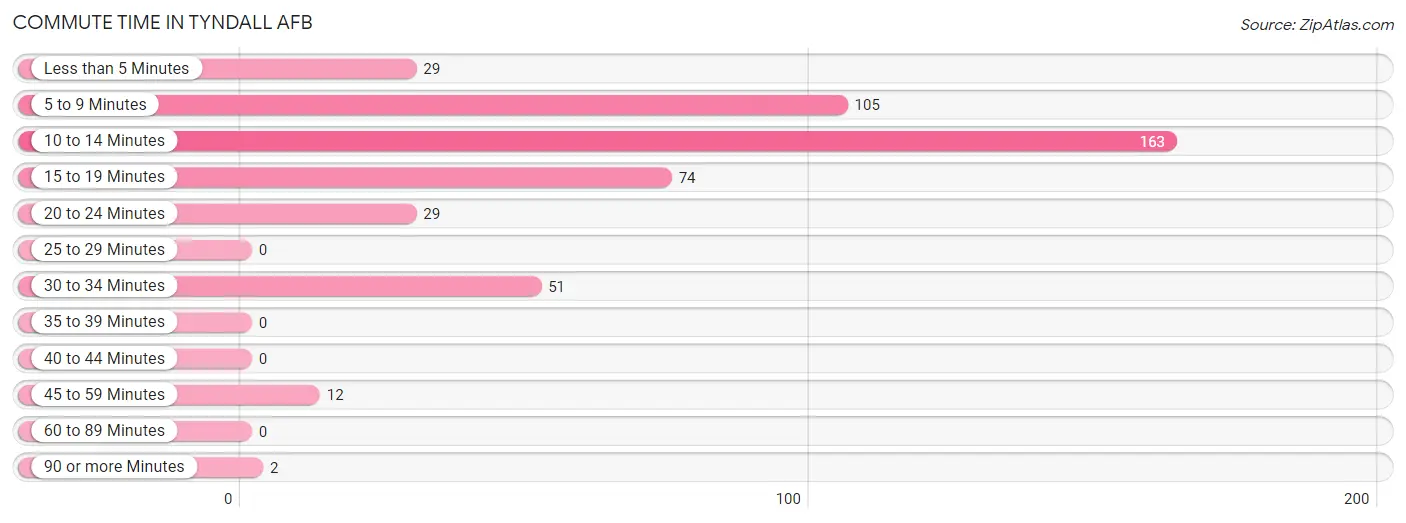
| Commute Time | # Commuters | % Commuters |
| Less than 5 Minutes | 29 | 6.2% |
| 5 to 9 Minutes | 105 | 22.6% |
| 10 to 14 Minutes | 163 | 35.0% |
| 15 to 19 Minutes | 74 | 15.9% |
| 20 to 24 Minutes | 29 | 6.2% |
| 25 to 29 Minutes | 0 | 0.0% |
| 30 to 34 Minutes | 51 | 11.0% |
| 35 to 39 Minutes | 0 | 0.0% |
| 40 to 44 Minutes | 0 | 0.0% |
| 45 to 59 Minutes | 12 | 2.6% |
| 60 to 89 Minutes | 0 | 0.0% |
| 90 or more Minutes | 2 | 0.4% |
Commute Time by Sex in Tyndall AFB
The most common commute times in Tyndall AFB are 10 to 14 minutes (118 commuters, 38.9%) for males and 10 to 14 minutes (45 commuters, 27.8%) for females.
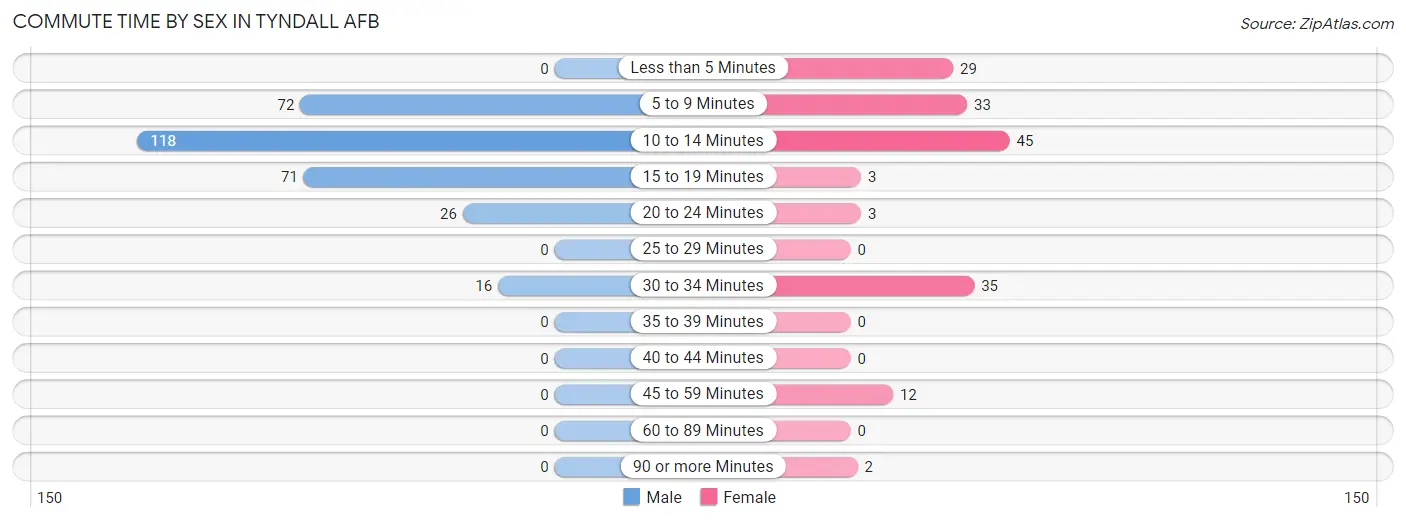
| Commute Time | Male | Female |
| Less than 5 Minutes | 0 (0.0%) | 29 (17.9%) |
| 5 to 9 Minutes | 72 (23.8%) | 33 (20.4%) |
| 10 to 14 Minutes | 118 (38.9%) | 45 (27.8%) |
| 15 to 19 Minutes | 71 (23.4%) | 3 (1.8%) |
| 20 to 24 Minutes | 26 (8.6%) | 3 (1.8%) |
| 25 to 29 Minutes | 0 (0.0%) | 0 (0.0%) |
| 30 to 34 Minutes | 16 (5.3%) | 35 (21.6%) |
| 35 to 39 Minutes | 0 (0.0%) | 0 (0.0%) |
| 40 to 44 Minutes | 0 (0.0%) | 0 (0.0%) |
| 45 to 59 Minutes | 0 (0.0%) | 12 (7.4%) |
| 60 to 89 Minutes | 0 (0.0%) | 0 (0.0%) |
| 90 or more Minutes | 0 (0.0%) | 2 (1.2%) |
Time of Departure to Work by Sex in Tyndall AFB
The most frequent times of departure to work in Tyndall AFB are 6:30 AM to 6:59 AM (98, 32.3%) for males and 7:00 AM to 7:29 AM (98, 60.5%) for females.
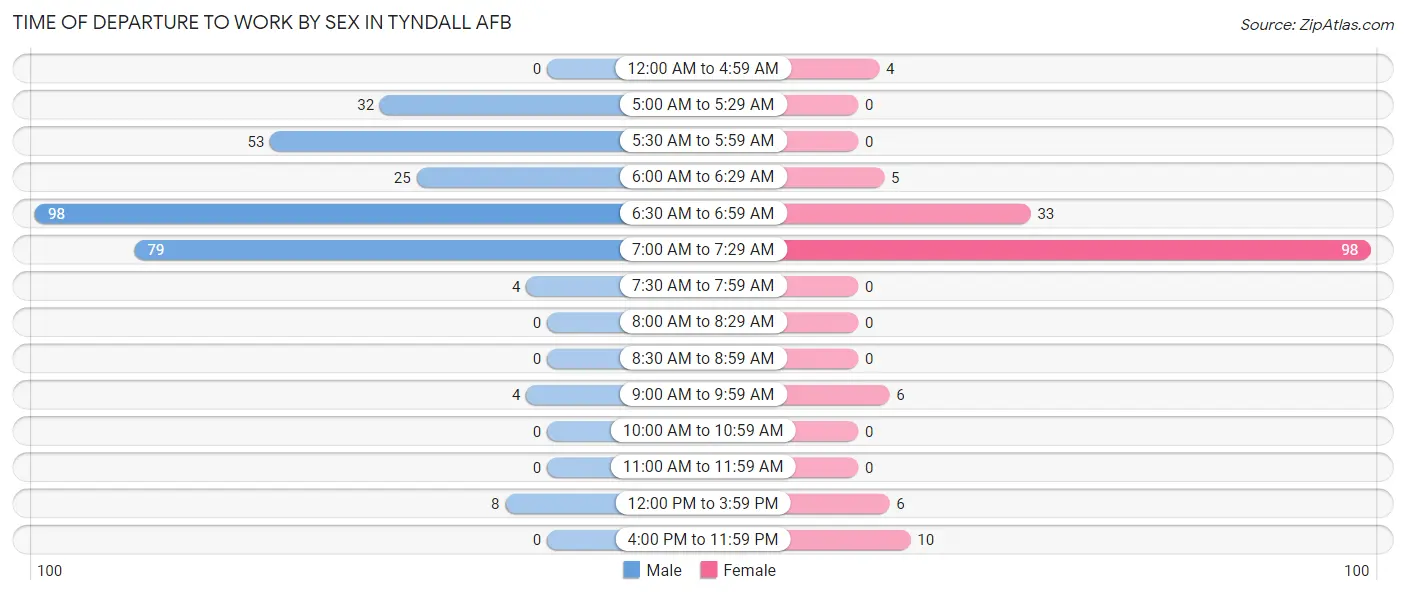
| Time of Departure | Male | Female |
| 12:00 AM to 4:59 AM | 0 (0.0%) | 4 (2.5%) |
| 5:00 AM to 5:29 AM | 32 (10.6%) | 0 (0.0%) |
| 5:30 AM to 5:59 AM | 53 (17.5%) | 0 (0.0%) |
| 6:00 AM to 6:29 AM | 25 (8.3%) | 5 (3.1%) |
| 6:30 AM to 6:59 AM | 98 (32.3%) | 33 (20.4%) |
| 7:00 AM to 7:29 AM | 79 (26.1%) | 98 (60.5%) |
| 7:30 AM to 7:59 AM | 4 (1.3%) | 0 (0.0%) |
| 8:00 AM to 8:29 AM | 0 (0.0%) | 0 (0.0%) |
| 8:30 AM to 8:59 AM | 0 (0.0%) | 0 (0.0%) |
| 9:00 AM to 9:59 AM | 4 (1.3%) | 6 (3.7%) |
| 10:00 AM to 10:59 AM | 0 (0.0%) | 0 (0.0%) |
| 11:00 AM to 11:59 AM | 0 (0.0%) | 0 (0.0%) |
| 12:00 PM to 3:59 PM | 8 (2.6%) | 6 (3.7%) |
| 4:00 PM to 11:59 PM | 0 (0.0%) | 10 (6.2%) |
| Total | 303 (100.0%) | 162 (100.0%) |
Housing Occupancy in Tyndall AFB
Occupancy by Ownership in Tyndall AFB
Of the total 133 dwellings in Tyndall AFB, owner-occupied units account for 0 (0.0%), while renter-occupied units make up 133 (100.0%).
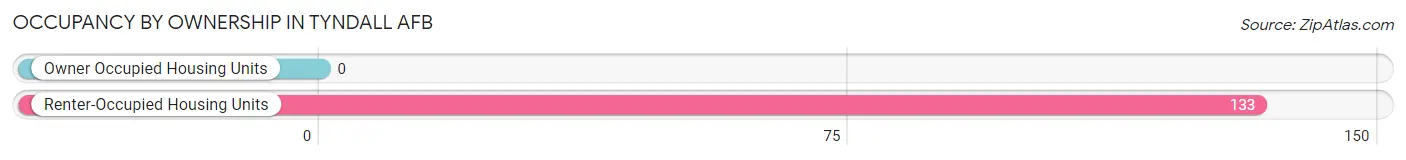
| Occupancy | # Housing Units | % Housing Units |
| Owner Occupied Housing Units | 0 | 0.0% |
| Renter-Occupied Housing Units | 133 | 100.0% |
| Total Occupied Housing Units | 133 | 100.0% |
Occupancy by Household Size in Tyndall AFB
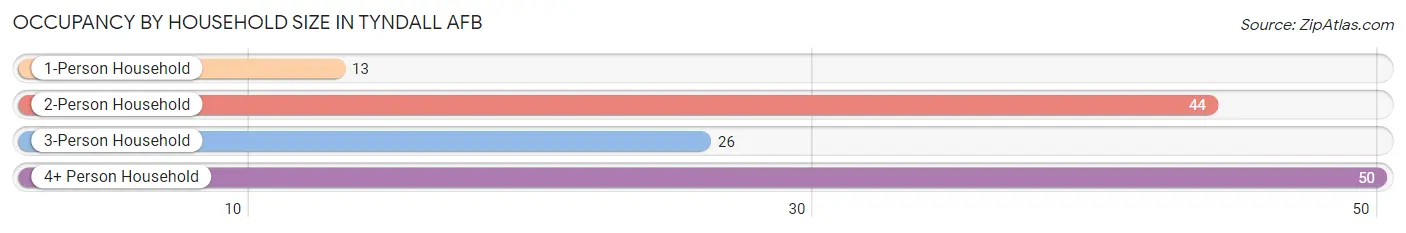
| Household Size | # Housing Units | % Housing Units |
| 1-Person Household | 13 | 9.8% |
| 2-Person Household | 44 | 33.1% |
| 3-Person Household | 26 | 19.6% |
| 4+ Person Household | 50 | 37.6% |
| Total Housing Units | 133 | 100.0% |
Occupancy by Ownership by Household Size in Tyndall AFB
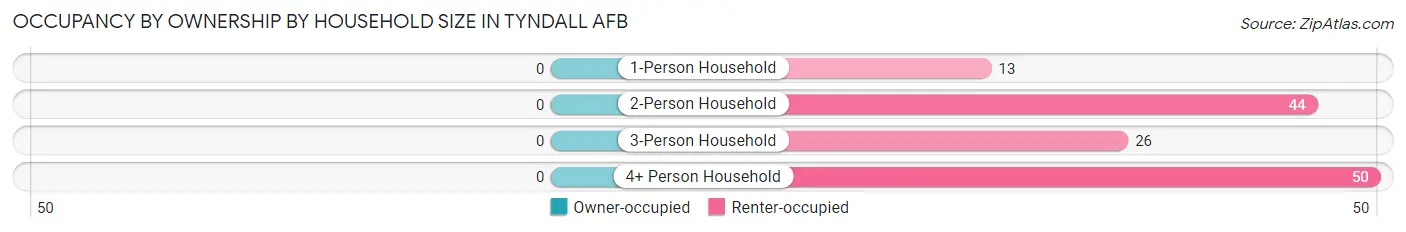
| Household Size | Owner-occupied | Renter-occupied |
| 1-Person Household | 0 (0.0%) | 13 (100.0%) |
| 2-Person Household | 0 (0.0%) | 44 (100.0%) |
| 3-Person Household | 0 (0.0%) | 26 (100.0%) |
| 4+ Person Household | 0 (0.0%) | 50 (100.0%) |
| Total Housing Units | 0 (0.0%) | 133 (100.0%) |
Occupancy by Educational Attainment in Tyndall AFB
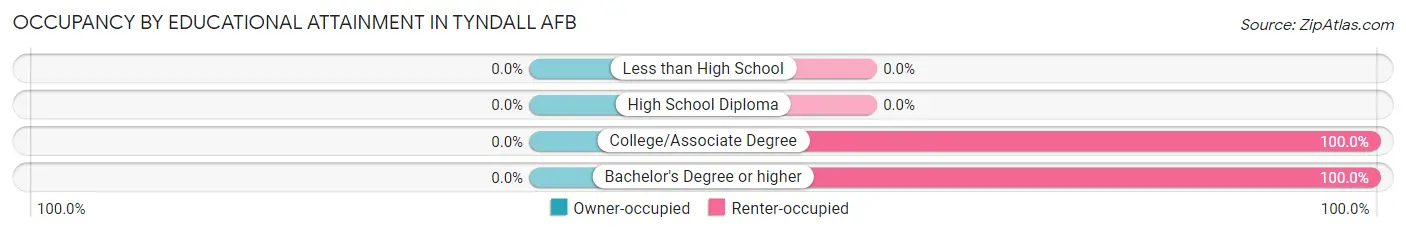
| Household Size | Owner-occupied | Renter-occupied |
| Less than High School | 0 (0.0%) | 0 (0.0%) |
| High School Diploma | 0 (0.0%) | 0 (0.0%) |
| College/Associate Degree | 0 (0.0%) | 81 (100.0%) |
| Bachelor's Degree or higher | 0 (0.0%) | 52 (100.0%) |
Occupancy by Age of Householder in Tyndall AFB
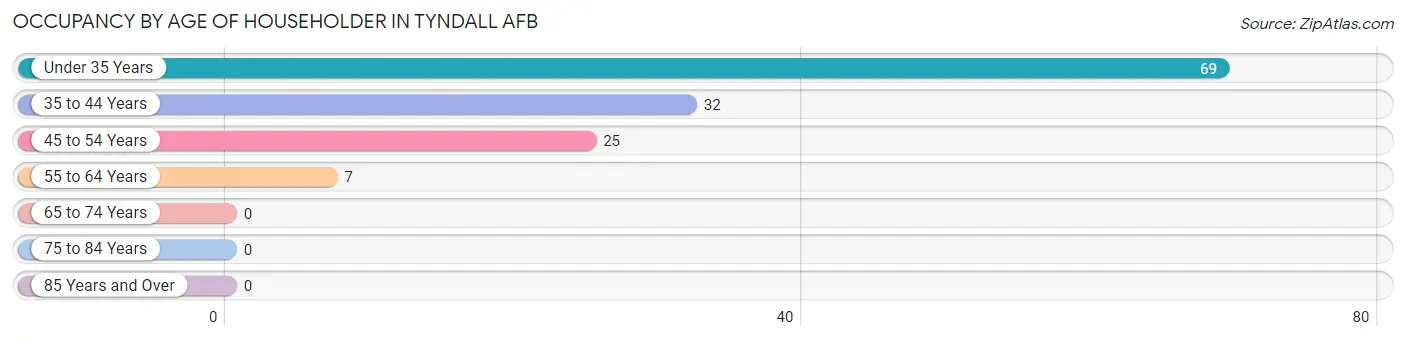
| Age Bracket | # Households | % Households |
| Under 35 Years | 69 | 51.9% |
| 35 to 44 Years | 32 | 24.1% |
| 45 to 54 Years | 25 | 18.8% |
| 55 to 64 Years | 7 | 5.3% |
| 65 to 74 Years | 0 | 0.0% |
| 75 to 84 Years | 0 | 0.0% |
| 85 Years and Over | 0 | 0.0% |
| Total | 133 | 100.0% |
Housing Finances in Tyndall AFB
Median Income by Occupancy in Tyndall AFB
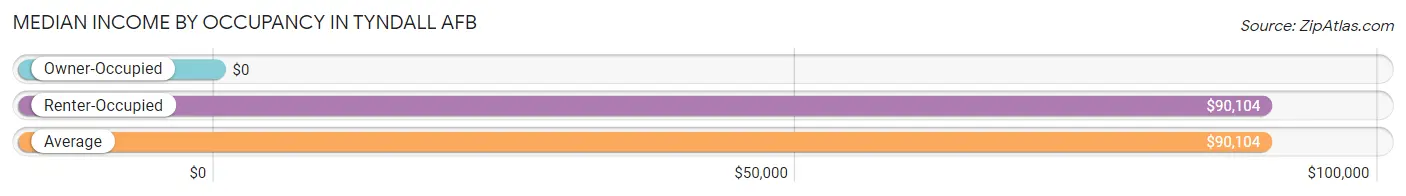
| Occupancy Type | # Households | Median Income |
| Owner-Occupied | 0 (0.0%) | $0 |
| Renter-Occupied | 133 (100.0%) | $90,104 |
| Average | 133 (100.0%) | $90,104 |
Occupancy by Householder Income Bracket in Tyndall AFB
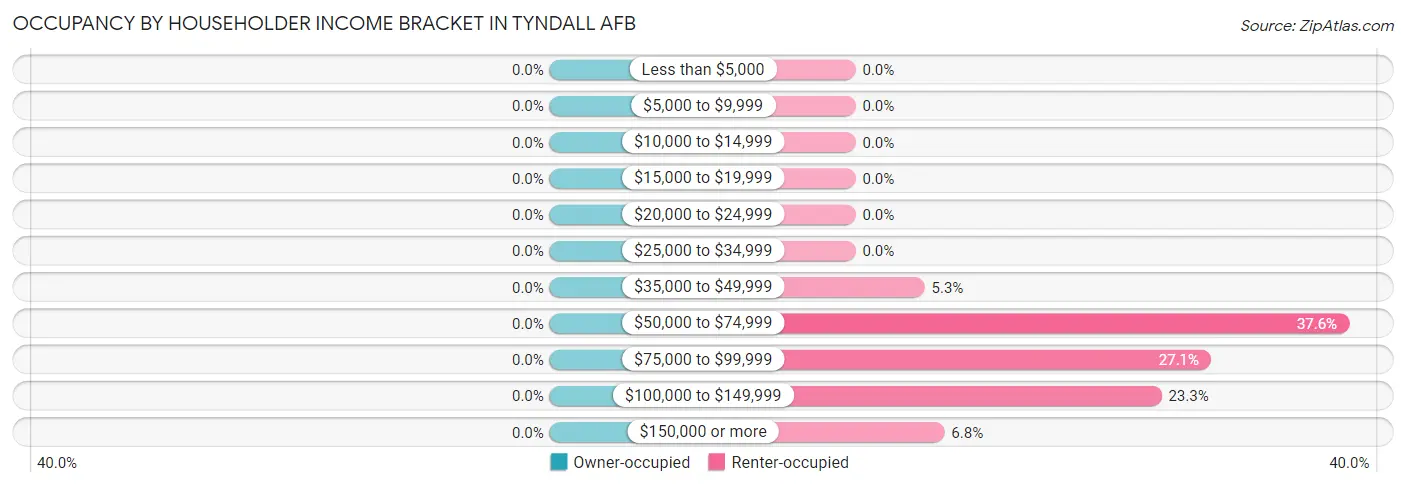
| Income Bracket | Owner-occupied | Renter-occupied |
| Less than $5,000 | 0 (0.0%) | 0 (0.0%) |
| $5,000 to $9,999 | 0 (0.0%) | 0 (0.0%) |
| $10,000 to $14,999 | 0 (0.0%) | 0 (0.0%) |
| $15,000 to $19,999 | 0 (0.0%) | 0 (0.0%) |
| $20,000 to $24,999 | 0 (0.0%) | 0 (0.0%) |
| $25,000 to $34,999 | 0 (0.0%) | 0 (0.0%) |
| $35,000 to $49,999 | 0 (0.0%) | 7 (5.3%) |
| $50,000 to $74,999 | 0 (0.0%) | 50 (37.6%) |
| $75,000 to $99,999 | 0 (0.0%) | 36 (27.1%) |
| $100,000 to $149,999 | 0 (0.0%) | 31 (23.3%) |
| $150,000 or more | 0 (0.0%) | 9 (6.8%) |
| Total | 0 (0.0%) | 133 (100.0%) |
Monthly Housing Cost Tiers in Tyndall AFB
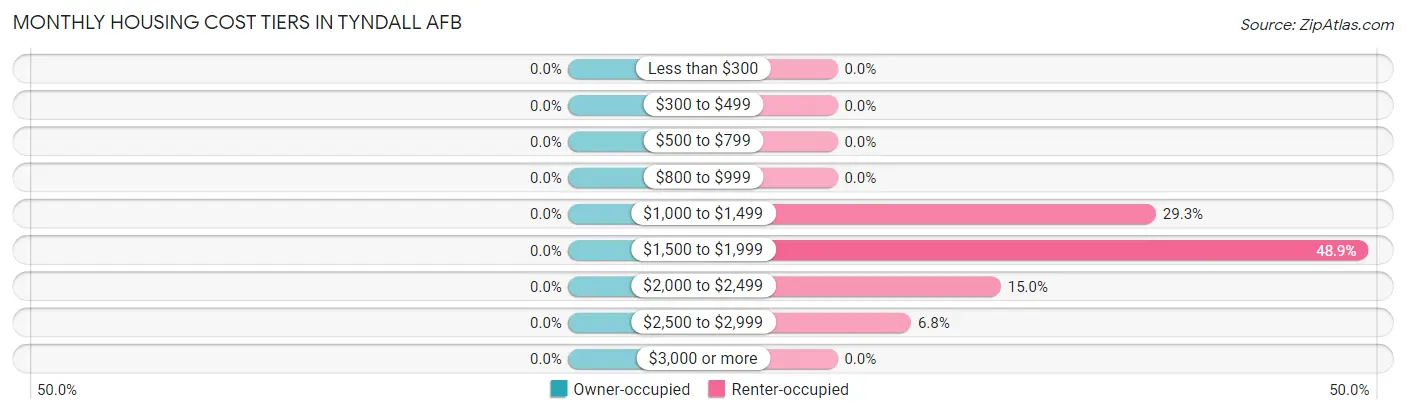
| Monthly Cost | Owner-occupied | Renter-occupied |
| Less than $300 | 0 (0.0%) | 0 (0.0%) |
| $300 to $499 | 0 (0.0%) | 0 (0.0%) |
| $500 to $799 | 0 (0.0%) | 0 (0.0%) |
| $800 to $999 | 0 (0.0%) | 0 (0.0%) |
| $1,000 to $1,499 | 0 (0.0%) | 39 (29.3%) |
| $1,500 to $1,999 | 0 (0.0%) | 65 (48.9%) |
| $2,000 to $2,499 | 0 (0.0%) | 20 (15.0%) |
| $2,500 to $2,999 | 0 (0.0%) | 9 (6.8%) |
| $3,000 or more | 0 (0.0%) | 0 (0.0%) |
| Total | 0 (0.0%) | 133 (100.0%) |
Physical Housing Characteristics in Tyndall AFB
Housing Structures in Tyndall AFB
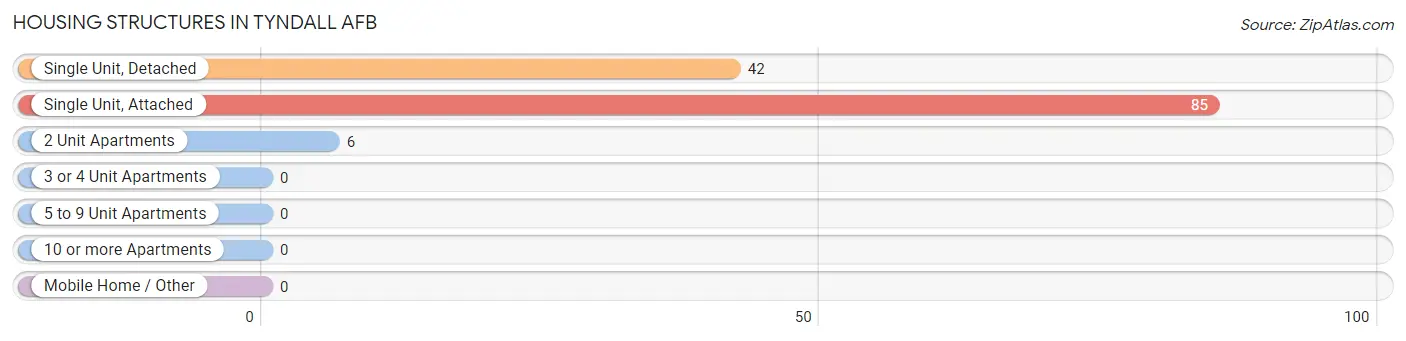
| Structure Type | # Housing Units | % Housing Units |
| Single Unit, Detached | 42 | 31.6% |
| Single Unit, Attached | 85 | 63.9% |
| 2 Unit Apartments | 6 | 4.5% |
| 3 or 4 Unit Apartments | 0 | 0.0% |
| 5 to 9 Unit Apartments | 0 | 0.0% |
| 10 or more Apartments | 0 | 0.0% |
| Mobile Home / Other | 0 | 0.0% |
| Total | 133 | 100.0% |
Housing Structures by Occupancy in Tyndall AFB
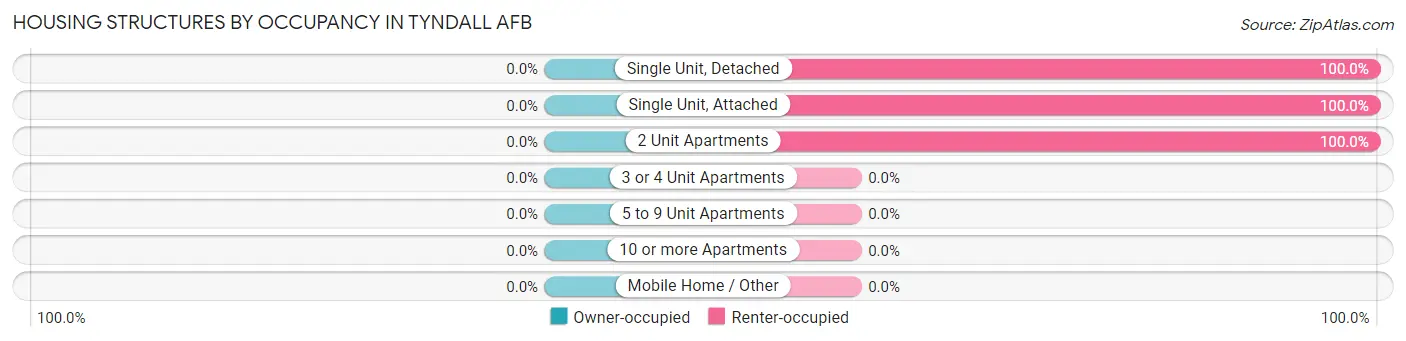
| Structure Type | Owner-occupied | Renter-occupied |
| Single Unit, Detached | 0 (0.0%) | 42 (100.0%) |
| Single Unit, Attached | 0 (0.0%) | 85 (100.0%) |
| 2 Unit Apartments | 0 (0.0%) | 6 (100.0%) |
| 3 or 4 Unit Apartments | 0 (0.0%) | 0 (0.0%) |
| 5 to 9 Unit Apartments | 0 (0.0%) | 0 (0.0%) |
| 10 or more Apartments | 0 (0.0%) | 0 (0.0%) |
| Mobile Home / Other | 0 (0.0%) | 0 (0.0%) |
| Total | 0 (0.0%) | 133 (100.0%) |
Housing Structures by Number of Rooms in Tyndall AFB
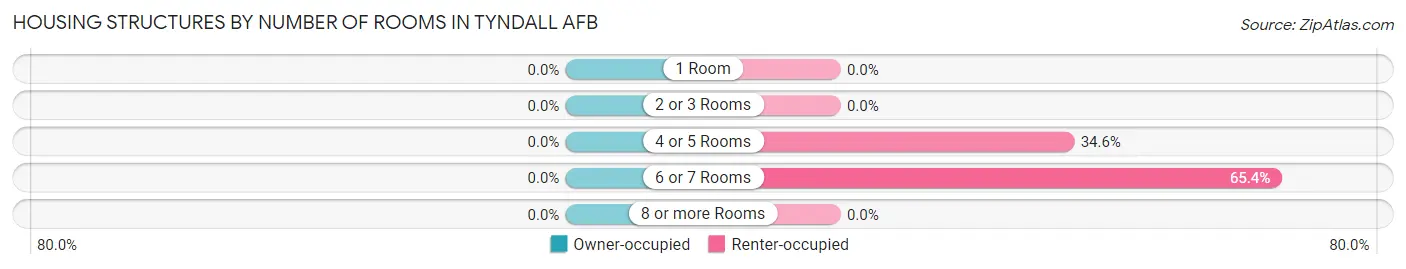
| Number of Rooms | Owner-occupied | Renter-occupied |
| 1 Room | 0 (0.0%) | 0 (0.0%) |
| 2 or 3 Rooms | 0 (0.0%) | 0 (0.0%) |
| 4 or 5 Rooms | 0 (0.0%) | 46 (34.6%) |
| 6 or 7 Rooms | 0 (0.0%) | 87 (65.4%) |
| 8 or more Rooms | 0 (0.0%) | 0 (0.0%) |
| Total | 0 (0.0%) | 133 (100.0%) |
Housing Structure by Heating Type in Tyndall AFB
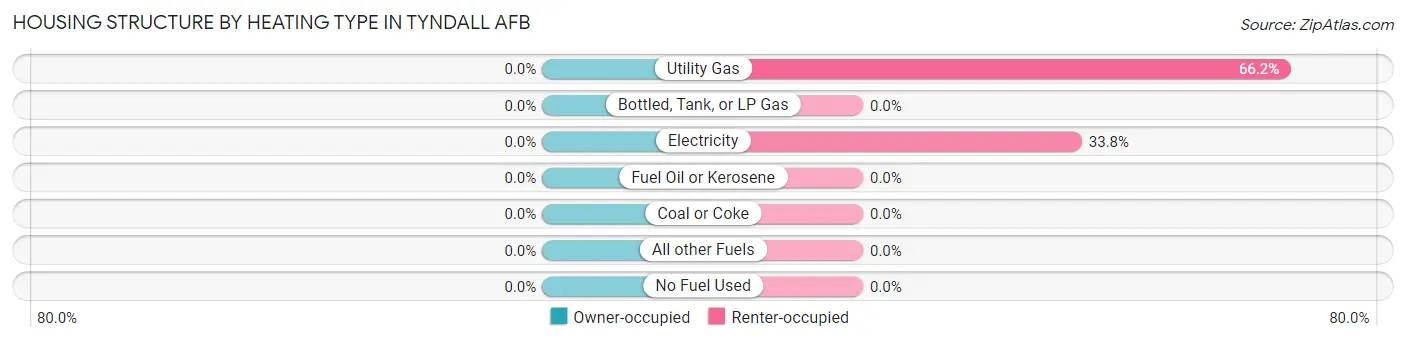
| Heating Type | Owner-occupied | Renter-occupied |
| Utility Gas | 0 (0.0%) | 88 (66.2%) |
| Bottled, Tank, or LP Gas | 0 (0.0%) | 0 (0.0%) |
| Electricity | 0 (0.0%) | 45 (33.8%) |
| Fuel Oil or Kerosene | 0 (0.0%) | 0 (0.0%) |
| Coal or Coke | 0 (0.0%) | 0 (0.0%) |
| All other Fuels | 0 (0.0%) | 0 (0.0%) |
| No Fuel Used | 0 (0.0%) | 0 (0.0%) |
| Total | 0 (0.0%) | 133 (100.0%) |
Household Vehicle Usage in Tyndall AFB
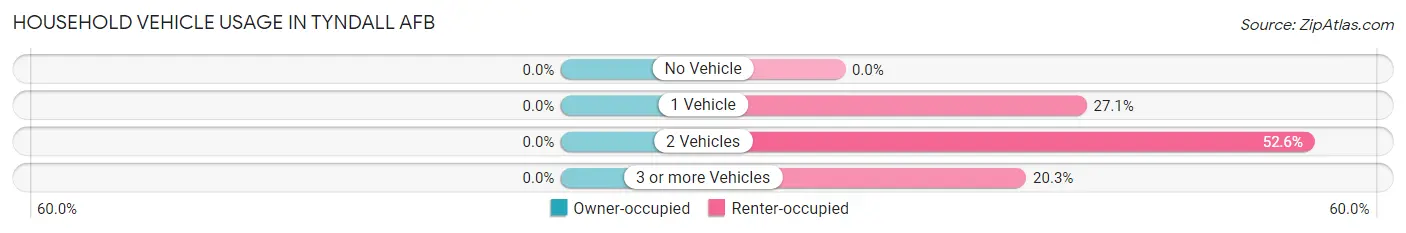
| Vehicles per Household | Owner-occupied | Renter-occupied |
| No Vehicle | 0 (0.0%) | 0 (0.0%) |
| 1 Vehicle | 0 (0.0%) | 36 (27.1%) |
| 2 Vehicles | 0 (0.0%) | 70 (52.6%) |
| 3 or more Vehicles | 0 (0.0%) | 27 (20.3%) |
| Total | 0 (0.0%) | 133 (100.0%) |
Real Estate & Mortgages in Tyndall AFB
Real Estate and Mortgage Overview in Tyndall AFB
| Characteristic | Without Mortgage | With Mortgage |
| Housing Units | 0 | 0 |
| Median Property Value | - | - |
| Median Household Income | - | - |
| Monthly Housing Costs | - | - |
| Real Estate Taxes | - | - |
Property Value by Mortgage Status in Tyndall AFB
| Property Value | Without Mortgage | With Mortgage |
| Less than $50,000 | 0 (0.0%) | 0 (0.0%) |
| $50,000 to $99,999 | 0 (0.0%) | 0 (0.0%) |
| $100,000 to $299,999 | 0 (0.0%) | 0 (0.0%) |
| $300,000 to $499,999 | 0 (0.0%) | 0 (0.0%) |
| $500,000 to $749,999 | 0 (0.0%) | 0 (0.0%) |
| $750,000 to $999,999 | 0 (0.0%) | 0 (0.0%) |
| $1,000,000 or more | 0 (0.0%) | 0 (0.0%) |
| Total | 0 (0.0%) | 0 (0.0%) |
Household Income by Mortgage Status in Tyndall AFB
| Household Income | Without Mortgage | With Mortgage |
| Less than $10,000 | 0 (0.0%) | 0 (0.0%) |
| $10,000 to $24,999 | 0 (0.0%) | 0 (0.0%) |
| $25,000 to $34,999 | 0 (0.0%) | 0 (0.0%) |
| $35,000 to $49,999 | 0 (0.0%) | 0 (0.0%) |
| $50,000 to $74,999 | 0 (0.0%) | 0 (0.0%) |
| $75,000 to $99,999 | 0 (0.0%) | 0 (0.0%) |
| $100,000 to $149,999 | 0 (0.0%) | 0 (0.0%) |
| $150,000 or more | 0 (0.0%) | 0 (0.0%) |
| Total | 0 (0.0%) | 0 (0.0%) |
Property Value to Household Income Ratio in Tyndall AFB
| Value-to-Income Ratio | Without Mortgage | With Mortgage |
| Less than 2.0x | 0 (0.0%) | 0 (0.0%) |
| 2.0x to 2.9x | 0 (0.0%) | 0 (0.0%) |
| 3.0x to 3.9x | 0 (0.0%) | 0 (0.0%) |
| 4.0x or more | 0 (0.0%) | 0 (0.0%) |
| Total | 0 (0.0%) | 0 (0.0%) |
Real Estate Taxes by Mortgage Status in Tyndall AFB
| Property Taxes | Without Mortgage | With Mortgage |
| Less than $800 | 0 (0.0%) | 0 (0.0%) |
| $800 to $1,499 | 0 (0.0%) | 0 (0.0%) |
| $800 to $1,499 | 0 (0.0%) | 0 (0.0%) |
| Total | 0 (0.0%) | 0 (0.0%) |
Health & Disability in Tyndall AFB
Health Insurance Coverage by Age in Tyndall AFB
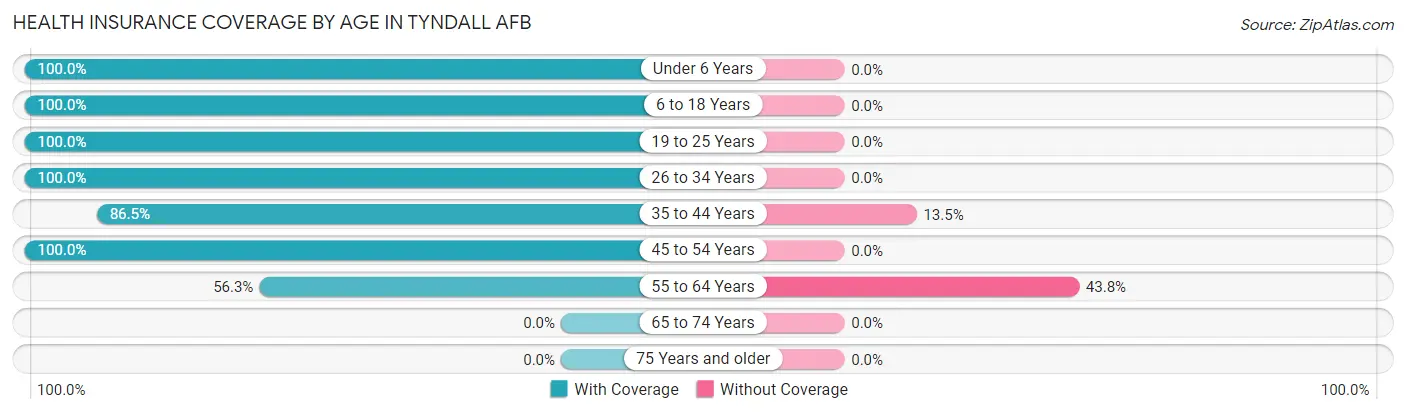
| Age Bracket | With Coverage | Without Coverage |
| Under 6 Years | 46 (100.0%) | 0 (0.0%) |
| 6 to 18 Years | 103 (100.0%) | 0 (0.0%) |
| 19 to 25 Years | 37 (100.0%) | 0 (0.0%) |
| 26 to 34 Years | 24 (100.0%) | 0 (0.0%) |
| 35 to 44 Years | 45 (86.5%) | 7 (13.5%) |
| 45 to 54 Years | 39 (100.0%) | 0 (0.0%) |
| 55 to 64 Years | 9 (56.2%) | 7 (43.8%) |
| 65 to 74 Years | 0 (0.0%) | 0 (0.0%) |
| 75 Years and older | 0 (0.0%) | 0 (0.0%) |
| Total | 303 (95.6%) | 14 (4.4%) |
Health Insurance Coverage by Citizenship Status in Tyndall AFB
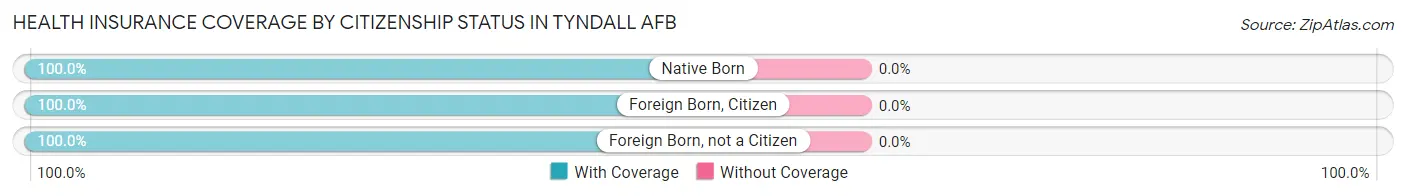
| Citizenship Status | With Coverage | Without Coverage |
| Native Born | 46 (100.0%) | 0 (0.0%) |
| Foreign Born, Citizen | 103 (100.0%) | 0 (0.0%) |
| Foreign Born, not a Citizen | 37 (100.0%) | 0 (0.0%) |
Health Insurance Coverage by Household Income in Tyndall AFB
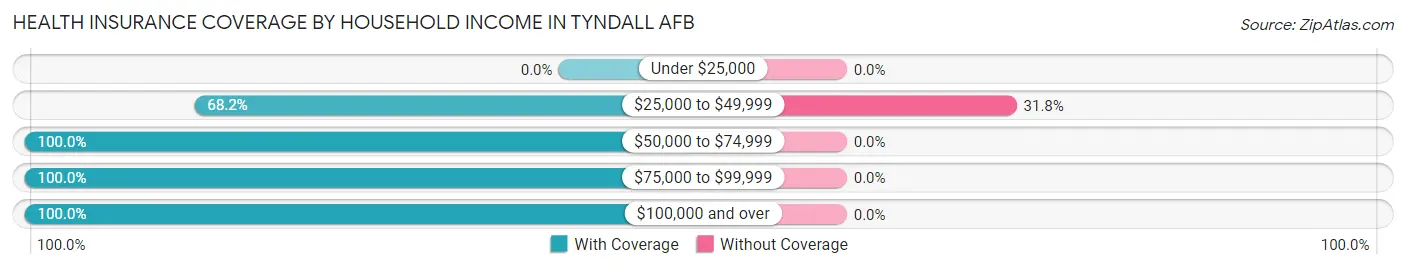
| Household Income | With Coverage | Without Coverage |
| Under $25,000 | 0 (0.0%) | 0 (0.0%) |
| $25,000 to $49,999 | 30 (68.2%) | 14 (31.8%) |
| $50,000 to $74,999 | 83 (100.0%) | 0 (0.0%) |
| $75,000 to $99,999 | 96 (100.0%) | 0 (0.0%) |
| $100,000 and over | 94 (100.0%) | 0 (0.0%) |
Public vs Private Health Insurance Coverage by Age in Tyndall AFB
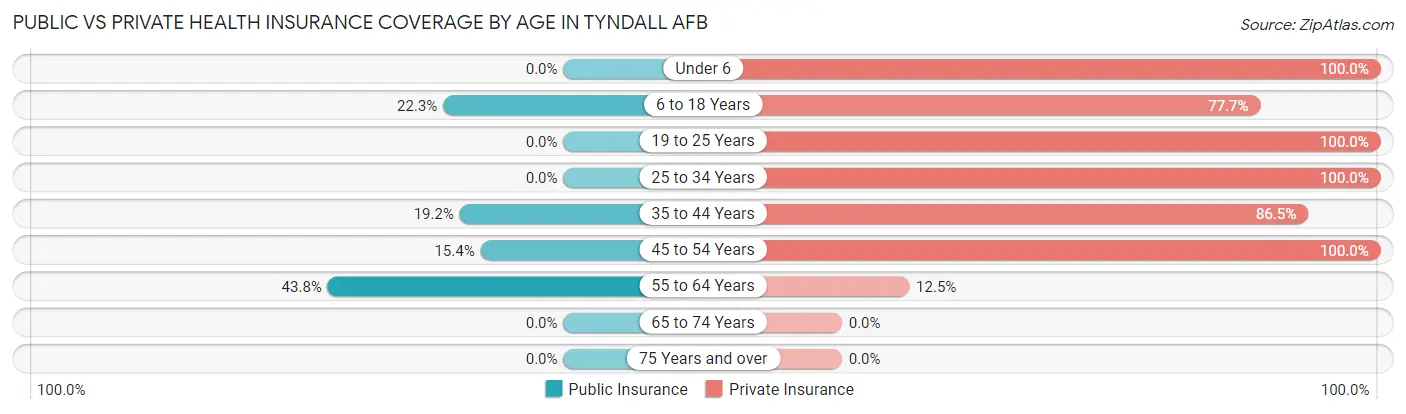
| Age Bracket | Public Insurance | Private Insurance |
| Under 6 | 0 (0.0%) | 46 (100.0%) |
| 6 to 18 Years | 23 (22.3%) | 80 (77.7%) |
| 19 to 25 Years | 0 (0.0%) | 37 (100.0%) |
| 25 to 34 Years | 0 (0.0%) | 24 (100.0%) |
| 35 to 44 Years | 10 (19.2%) | 45 (86.5%) |
| 45 to 54 Years | 6 (15.4%) | 39 (100.0%) |
| 55 to 64 Years | 7 (43.8%) | 2 (12.5%) |
| 65 to 74 Years | 0 (0.0%) | 0 (0.0%) |
| 75 Years and over | 0 (0.0%) | 0 (0.0%) |
| Total | 46 (14.5%) | 273 (86.1%) |
Disability Status by Sex by Age in Tyndall AFB
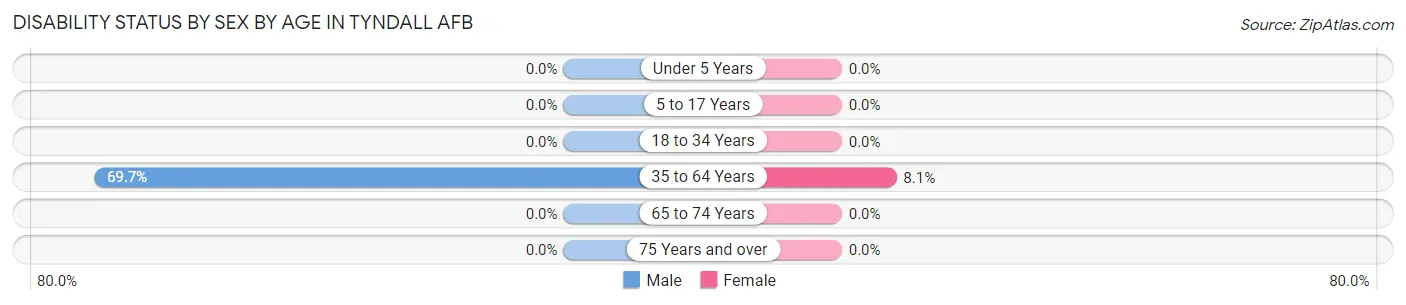
| Age Bracket | Male | Female |
| Under 5 Years | 0 (0.0%) | 0 (0.0%) |
| 5 to 17 Years | 0 (0.0%) | 0 (0.0%) |
| 18 to 34 Years | 0 (0.0%) | 0 (0.0%) |
| 35 to 64 Years | 23 (69.7%) | 6 (8.1%) |
| 65 to 74 Years | 0 (0.0%) | 0 (0.0%) |
| 75 Years and over | 0 (0.0%) | 0 (0.0%) |
Disability Class by Sex by Age in Tyndall AFB
Disability Class: Hearing Difficulty
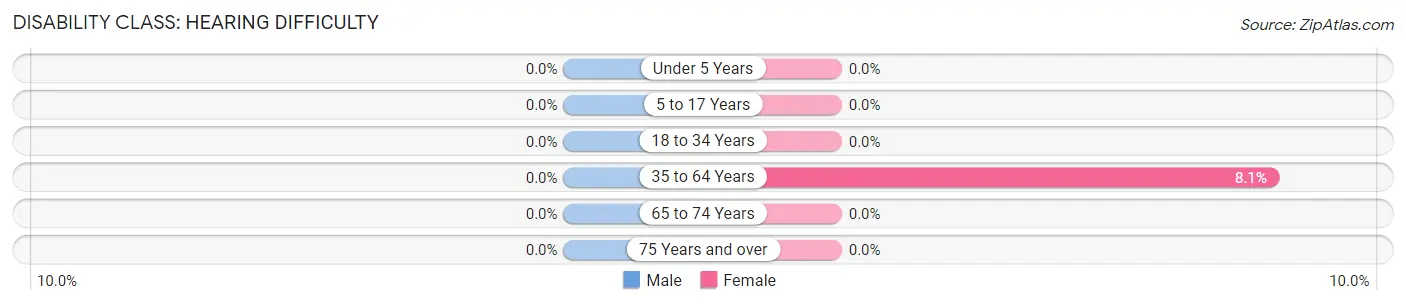
| Age Bracket | Male | Female |
| Under 5 Years | 0 (0.0%) | 0 (0.0%) |
| 5 to 17 Years | 0 (0.0%) | 0 (0.0%) |
| 18 to 34 Years | 0 (0.0%) | 0 (0.0%) |
| 35 to 64 Years | 0 (0.0%) | 6 (8.1%) |
| 65 to 74 Years | 0 (0.0%) | 0 (0.0%) |
| 75 Years and over | 0 (0.0%) | 0 (0.0%) |
Disability Class: Vision Difficulty
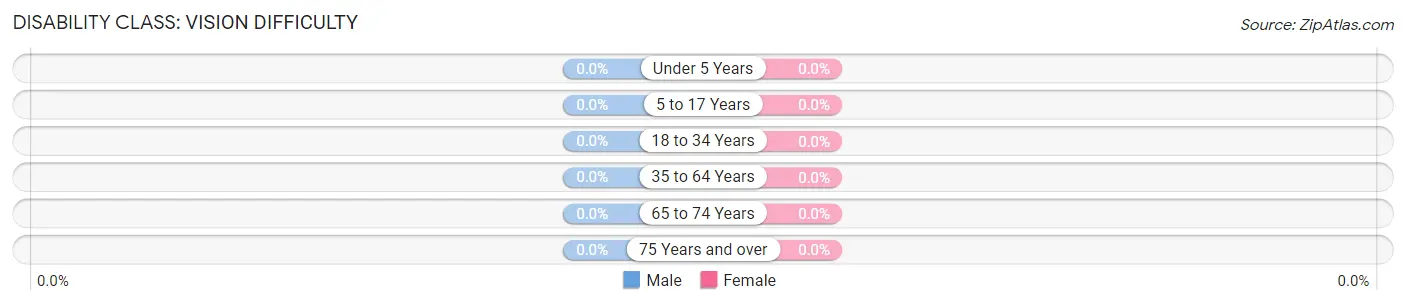
| Age Bracket | Male | Female |
| Under 5 Years | 0 (0.0%) | 0 (0.0%) |
| 5 to 17 Years | 0 (0.0%) | 0 (0.0%) |
| 18 to 34 Years | 0 (0.0%) | 0 (0.0%) |
| 35 to 64 Years | 0 (0.0%) | 0 (0.0%) |
| 65 to 74 Years | 0 (0.0%) | 0 (0.0%) |
| 75 Years and over | 0 (0.0%) | 0 (0.0%) |
Disability Class: Cognitive Difficulty
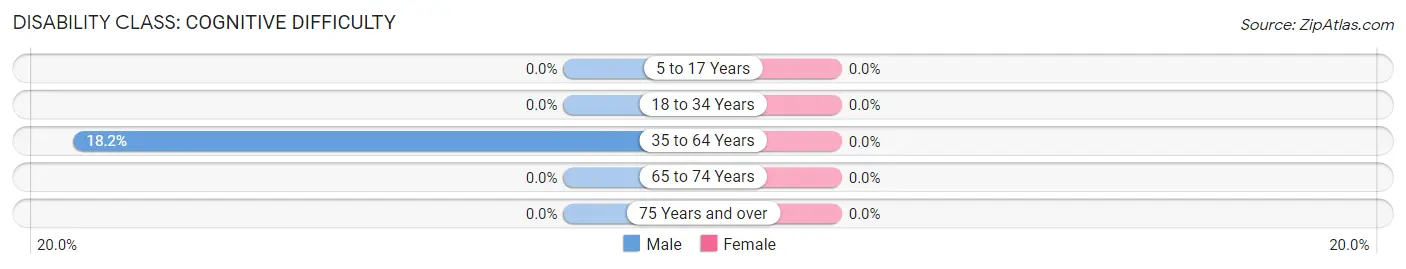
| Age Bracket | Male | Female |
| 5 to 17 Years | 0 (0.0%) | 0 (0.0%) |
| 18 to 34 Years | 0 (0.0%) | 0 (0.0%) |
| 35 to 64 Years | 6 (18.2%) | 0 (0.0%) |
| 65 to 74 Years | 0 (0.0%) | 0 (0.0%) |
| 75 Years and over | 0 (0.0%) | 0 (0.0%) |
Disability Class: Ambulatory Difficulty
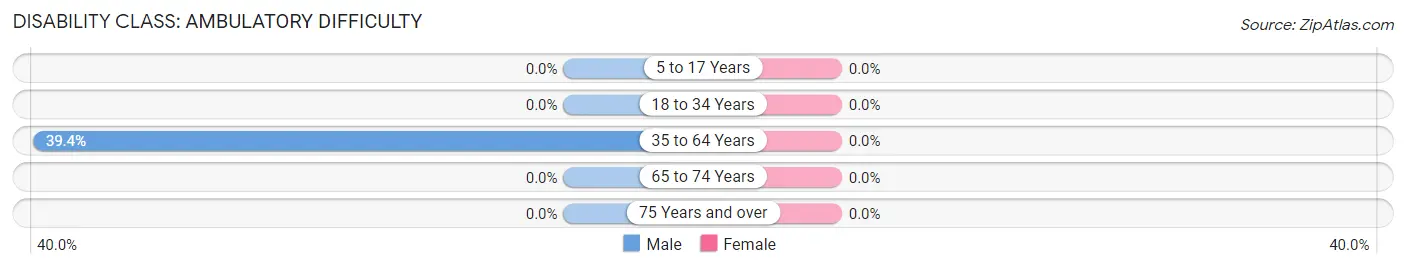
| Age Bracket | Male | Female |
| 5 to 17 Years | 0 (0.0%) | 0 (0.0%) |
| 18 to 34 Years | 0 (0.0%) | 0 (0.0%) |
| 35 to 64 Years | 13 (39.4%) | 0 (0.0%) |
| 65 to 74 Years | 0 (0.0%) | 0 (0.0%) |
| 75 Years and over | 0 (0.0%) | 0 (0.0%) |
Disability Class: Self-Care Difficulty
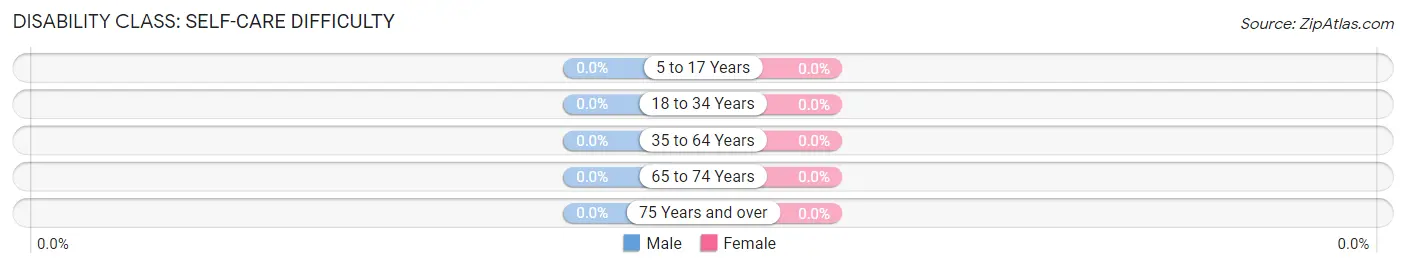
| Age Bracket | Male | Female |
| 5 to 17 Years | 0 (0.0%) | 0 (0.0%) |
| 18 to 34 Years | 0 (0.0%) | 0 (0.0%) |
| 35 to 64 Years | 0 (0.0%) | 0 (0.0%) |
| 65 to 74 Years | 0 (0.0%) | 0 (0.0%) |
| 75 Years and over | 0 (0.0%) | 0 (0.0%) |
Technology Access in Tyndall AFB
Computing Device Access in Tyndall AFB
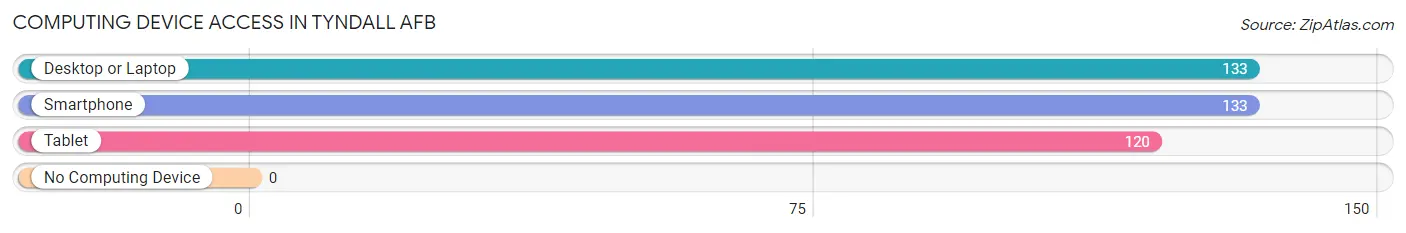
| Device Type | # Households | % Households |
| Desktop or Laptop | 133 | 100.0% |
| Smartphone | 133 | 100.0% |
| Tablet | 120 | 90.2% |
| No Computing Device | 0 | 0.0% |
| Total | 133 | 100.0% |
Internet Access in Tyndall AFB
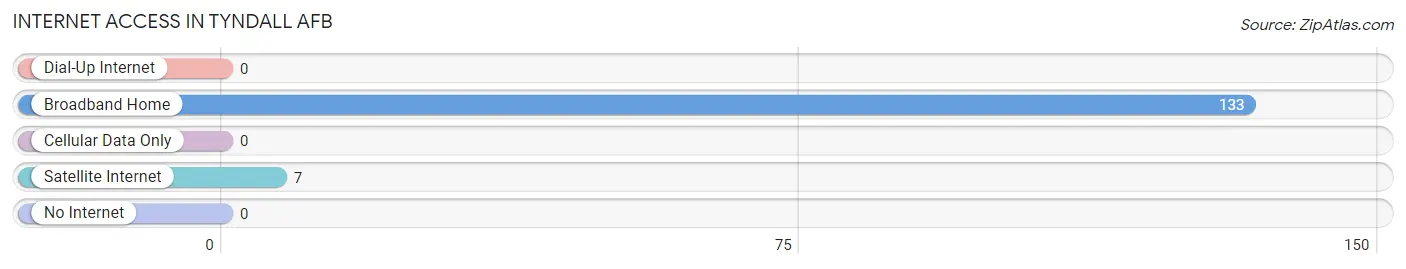
| Internet Type | # Households | % Households |
| Dial-Up Internet | 0 | 0.0% |
| Broadband Home | 133 | 100.0% |
| Cellular Data Only | 0 | 0.0% |
| Satellite Internet | 7 | 5.3% |
| No Internet | 0 | 0.0% |
| Total | 133 | 100.0% |
Tyndall AFB Summary
Tyndall Air Force Base (AFB) is located in Bay County, Florida, on the Gulf of Mexico, approximately 12 miles east of Panama City. It is the home of the 325th Fighter Wing, which is part of the Air Combat Command. The base is named after World War I flying ace, Frank Benjamin Tyndall.
History
Tyndall AFB was established in 1941 as a training base for the Army Air Corps. It was originally named the Panama City Army Air Field and was used to train pilots for World War II. In 1947, the base was renamed Tyndall AFB in honor of Frank Benjamin Tyndall, a World War I flying ace.
In the 1950s, the base was used as a training facility for the Air Force's Tactical Air Command. During the Vietnam War, the base was used to train pilots for combat missions. In the 1970s, the base was used to train pilots for the F-15 Eagle fighter jet.
In the 1980s, the base was used to train pilots for the F-16 Fighting Falcon fighter jet. In the 1990s, the base was used to train pilots for the F-22 Raptor fighter jet.
Geography
Tyndall AFB is located in Bay County, Florida, on the Gulf of Mexico, approximately 12 miles east of Panama City. The base is situated on a peninsula that is bordered by the Gulf of Mexico to the south and St. Andrew Bay to the north. The base covers an area of approximately 4,000 acres.
The base is located in a humid subtropical climate zone, with hot, humid summers and mild winters. The average temperature in the summer is around 90°F, and the average temperature in the winter is around 60°F.
Economy
Tyndall AFB is a major economic driver for the region. The base has an estimated economic impact of $1.2 billion annually. The base is home to more than 5,000 military personnel and civilian employees, and provides jobs for more than 10,000 people in the region.
The base is also home to a number of businesses, including a shopping center, a golf course, a bowling alley, and a movie theater. The base also hosts a number of events throughout the year, including air shows, concerts, and festivals.
Demographics
As of the 2010 census, the population of Tyndall AFB was 5,845. The racial makeup of the base was 79.3% White, 11.2% African American, 0.7% Native American, 2.2% Asian, 0.1% Pacific Islander, 4.2% from other races, and 2.3% from two or more races.
The median household income was $45,845, and the median family income was $50,845. The per capita income was $20,845. About 8.3% of the population was below the poverty line.
Conclusion
Tyndall AFB is a major economic driver for the region, providing jobs for more than 10,000 people in the region. The base is home to more than 5,000 military personnel and civilian employees, and is home to a number of businesses, including a shopping center, a golf course, a bowling alley, and a movie theater. The base also hosts a number of events throughout the year, including air shows, concerts, and festivals. The base has an estimated economic impact of $1.2 billion annually.
Common Questions
What is Per Capita Income in Tyndall AFB?
Per Capita income in Tyndall AFB is $26,942.
What is the Median Family Income in Tyndall AFB?
Median Family Income in Tyndall AFB is $91,458.
What is the Median Household income in Tyndall AFB?
Median Household Income in Tyndall AFB is $90,104.
What is Inequality or Gini Index in Tyndall AFB?
Inequality or Gini Index in Tyndall AFB is 0.24.
What is the Total Population of Tyndall AFB?
Total Population of Tyndall AFB is 746.
What is the Total Male Population of Tyndall AFB?
Total Male Population of Tyndall AFB is 440.
What is the Total Female Population of Tyndall AFB?
Total Female Population of Tyndall AFB is 306.
What is the Ratio of Males per 100 Females in Tyndall AFB?
There are 143.79 Males per 100 Females in Tyndall AFB.
What is the Ratio of Females per 100 Males in Tyndall AFB?
There are 69.55 Females per 100 Males in Tyndall AFB.
What is the Median Population Age in Tyndall AFB?
Median Population Age in Tyndall AFB is 22.0 Years.
What is the Average Family Size in Tyndall AFB
Average Family Size in Tyndall AFB is 3.2 People.
What is the Average Household Size in Tyndall AFB
Average Household Size in Tyndall AFB is 3.0 People.
How Large is the Labor Force in Tyndall AFB?
There are 523 People in the Labor Forcein in Tyndall AFB.
What is the Percentage of People in the Labor Force in Tyndall AFB?
86.3% of People are in the Labor Force in Tyndall AFB.
What is the Unemployment Rate in Tyndall AFB?
Unemployment Rate in Tyndall AFB is 9.8%.