Ocean City, FL Map & Demographics
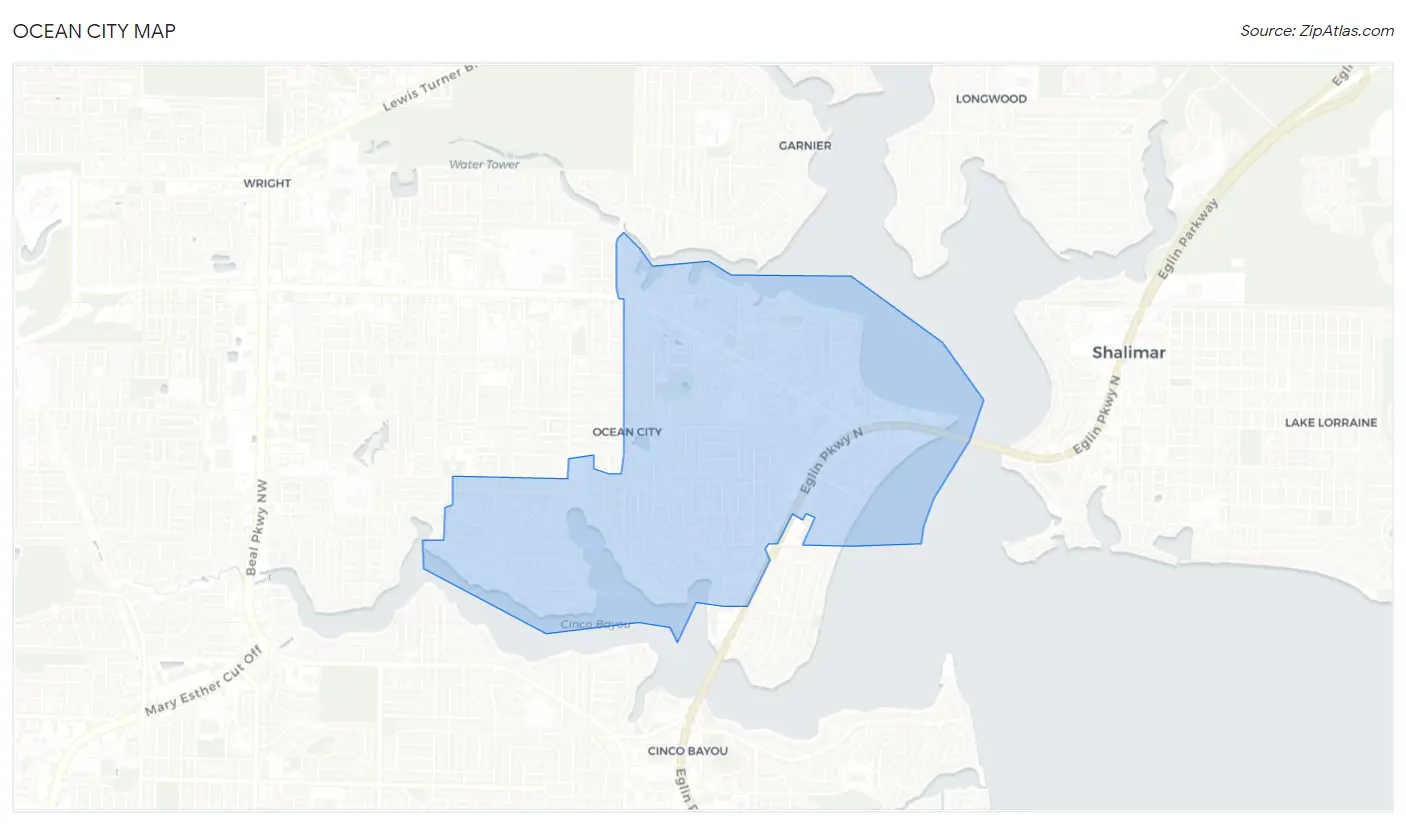
Ocean City Map
Ocean City Overview
$36,097
PER CAPITA INCOME
$53,711
AVG FAMILY INCOME
$53,181
AVG HOUSEHOLD INCOME
20.7%
WAGE / INCOME GAP [ % ]
79.3¢/ $1
WAGE / INCOME GAP [ $ ]
$5,988
FAMILY INCOME DEFICIT
0.43
INEQUALITY / GINI INDEX
6,108
TOTAL POPULATION
3,076
MALE POPULATION
3,032
FEMALE POPULATION
101.45
MALES / 100 FEMALES
98.57
FEMALES / 100 MALES
33.9
MEDIAN AGE
2.9
AVG FAMILY SIZE
2.3
AVG HOUSEHOLD SIZE
3,516
LABOR FORCE [ PEOPLE ]
69.7%
PERCENT IN LABOR FORCE
1.7%
UNEMPLOYMENT RATE
Income in Ocean City
Income Overview in Ocean City
Per Capita Income in Ocean City is $36,097, while median incomes of families and households are $53,711 and $53,181 respectively.
| Characteristic | Number | Measure |
| Per Capita Income | 6,108 | $36,097 |
| Median Family Income | 1,603 | $53,711 |
| Mean Family Income | 1,603 | $93,290 |
| Median Household Income | 2,691 | $53,181 |
| Mean Household Income | 2,691 | $81,371 |
| Income Deficit | 1,603 | $5,988 |
| Wage / Income Gap (%) | 6,108 | 20.68% |
| Wage / Income Gap ($) | 6,108 | 79.32¢ per $1 |
| Gini / Inequality Index | 6,108 | 0.43 |
Earnings by Sex in Ocean City
Average Earnings in Ocean City are $31,941, $35,020 for men and $27,777 for women, a difference of 20.7%.
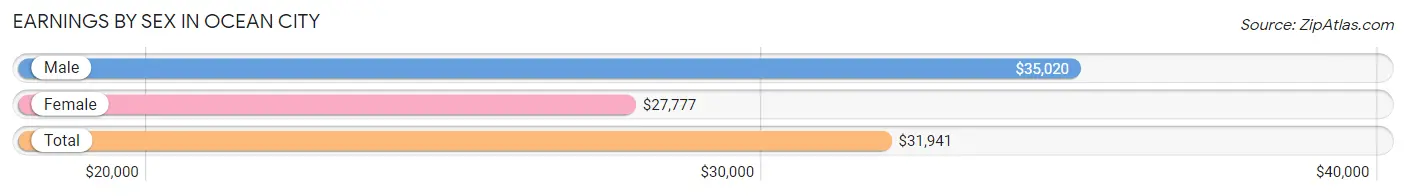
| Sex | Number | Average Earnings |
| Male | 2,199 (57.9%) | $35,020 |
| Female | 1,599 (42.1%) | $27,777 |
| Total | 3,798 (100.0%) | $31,941 |
Earnings by Sex by Income Bracket in Ocean City
The most common earnings brackets in Ocean City are $100,000+ for men (239 | 10.9%) and $10,000 to $12,499 for women (167 | 10.4%).
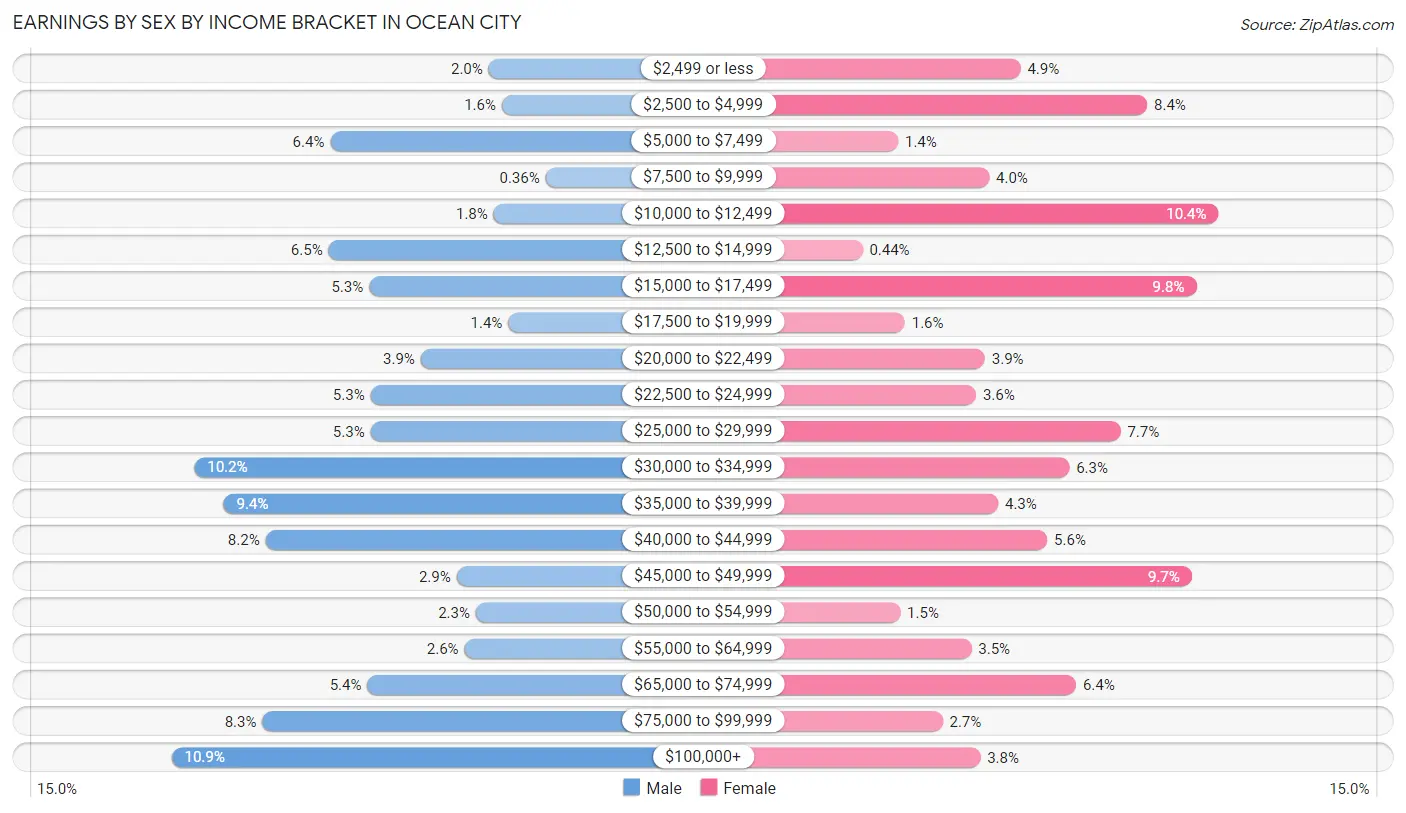
| Income | Male | Female |
| $2,499 or less | 43 (2.0%) | 78 (4.9%) |
| $2,500 to $4,999 | 35 (1.6%) | 135 (8.4%) |
| $5,000 to $7,499 | 141 (6.4%) | 23 (1.4%) |
| $7,500 to $9,999 | 8 (0.4%) | 64 (4.0%) |
| $10,000 to $12,499 | 40 (1.8%) | 167 (10.4%) |
| $12,500 to $14,999 | 142 (6.5%) | 7 (0.4%) |
| $15,000 to $17,499 | 117 (5.3%) | 157 (9.8%) |
| $17,500 to $19,999 | 31 (1.4%) | 26 (1.6%) |
| $20,000 to $22,499 | 85 (3.9%) | 62 (3.9%) |
| $22,500 to $24,999 | 116 (5.3%) | 58 (3.6%) |
| $25,000 to $29,999 | 116 (5.3%) | 123 (7.7%) |
| $30,000 to $34,999 | 225 (10.2%) | 100 (6.2%) |
| $35,000 to $39,999 | 207 (9.4%) | 68 (4.3%) |
| $40,000 to $44,999 | 181 (8.2%) | 90 (5.6%) |
| $45,000 to $49,999 | 63 (2.9%) | 155 (9.7%) |
| $50,000 to $54,999 | 51 (2.3%) | 24 (1.5%) |
| $55,000 to $64,999 | 58 (2.6%) | 56 (3.5%) |
| $65,000 to $74,999 | 118 (5.4%) | 103 (6.4%) |
| $75,000 to $99,999 | 183 (8.3%) | 43 (2.7%) |
| $100,000+ | 239 (10.9%) | 60 (3.7%) |
| Total | 2,199 (100.0%) | 1,599 (100.0%) |
Earnings by Sex by Educational Attainment in Ocean City
Average earnings in Ocean City are $38,664 for men and $29,172 for women, a difference of 24.5%. Men with an educational attainment of graduate degree enjoy the highest average annual earnings of $93,750, while those with less than high school education earn the least with $29,324. Women with an educational attainment of graduate degree earn the most with the average annual earnings of $52,031, while those with high school diploma education have the smallest earnings of $16,649.
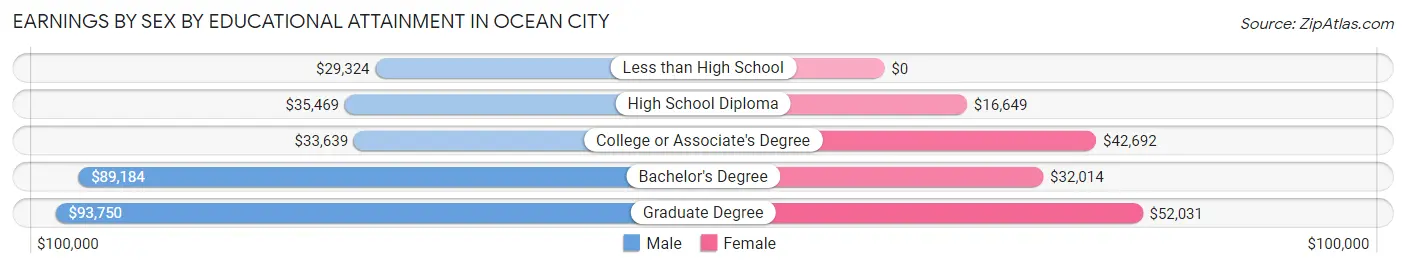
| Educational Attainment | Male Income | Female Income |
| Less than High School | $29,324 | $0 |
| High School Diploma | $35,469 | $16,649 |
| College or Associate's Degree | $33,639 | $42,692 |
| Bachelor's Degree | $89,184 | $32,014 |
| Graduate Degree | $93,750 | $52,031 |
| Total | $38,664 | $29,172 |
Family Income in Ocean City
Family Income Brackets in Ocean City
According to the Ocean City family income data, there are 412 families falling into the $50,000 to $74,999 income range, which is the most common income bracket and makes up 25.7% of all families. Conversely, the $10,000 to $14,999 income bracket is the least frequent group with only 8 families (0.5%) belonging to this category.
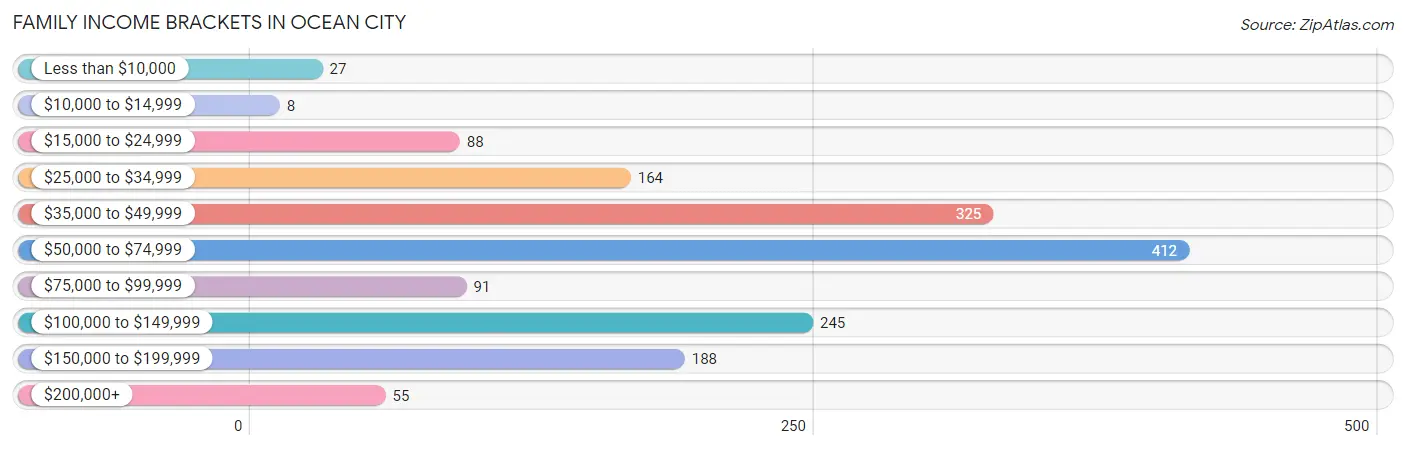
| Income Bracket | # Families | % Families |
| Less than $10,000 | 27 | 1.7% |
| $10,000 to $14,999 | 8 | 0.5% |
| $15,000 to $24,999 | 88 | 5.5% |
| $25,000 to $34,999 | 164 | 10.2% |
| $35,000 to $49,999 | 325 | 20.3% |
| $50,000 to $74,999 | 412 | 25.7% |
| $75,000 to $99,999 | 91 | 5.7% |
| $100,000 to $149,999 | 245 | 15.3% |
| $150,000 to $199,999 | 188 | 11.7% |
| $200,000+ | 55 | 3.4% |
Family Income by Famaliy Size in Ocean City
3-person families (272 | 17.0%) account for the highest median family income in Ocean City with $103,564 per family, while 3-person families (272 | 17.0%) have the highest median income of $34,521 per family member.
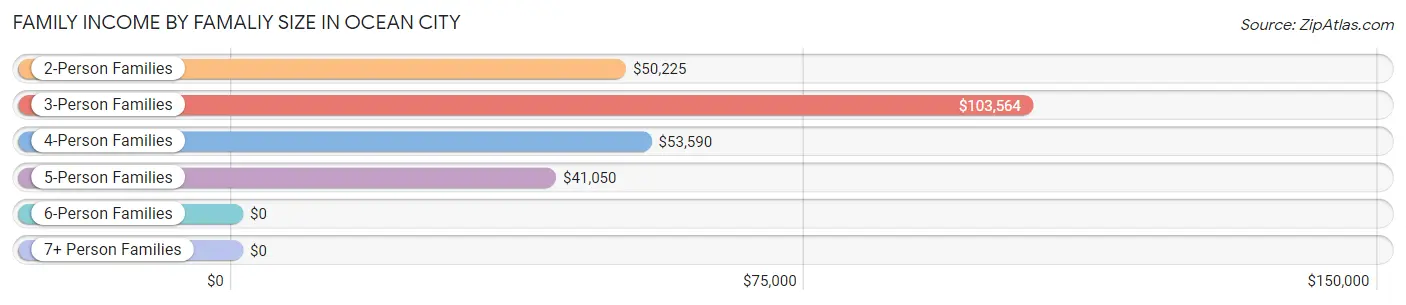
| Income Bracket | # Families | Median Income |
| 2-Person Families | 863 (53.8%) | $50,225 |
| 3-Person Families | 272 (17.0%) | $103,564 |
| 4-Person Families | 270 (16.8%) | $53,590 |
| 5-Person Families | 83 (5.2%) | $41,050 |
| 6-Person Families | 71 (4.4%) | $0 |
| 7+ Person Families | 44 (2.7%) | $0 |
| Total | 1,603 (100.0%) | $53,711 |
Family Income by Number of Earners in Ocean City
The median family income in Ocean City is $53,711, with families comprising 3+ earners (147) having the highest median family income of $131,653, while families with 1 earner (420) have the lowest median family income of $46,667, accounting for 9.2% and 26.2% of families, respectively.
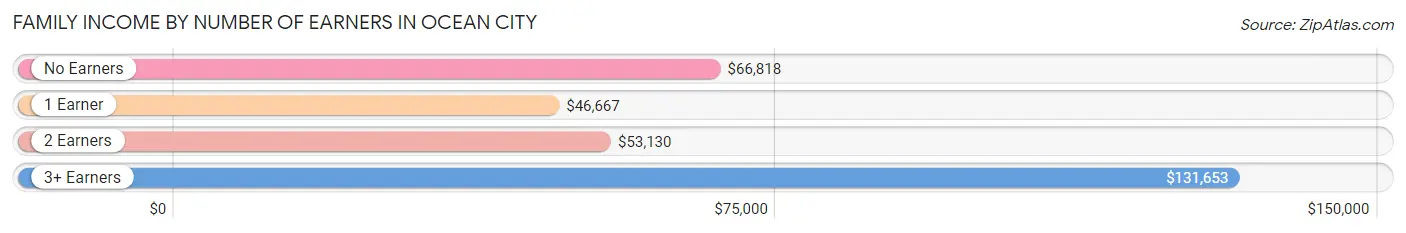
| Number of Earners | # Families | Median Income |
| No Earners | 174 (10.8%) | $66,818 |
| 1 Earner | 420 (26.2%) | $46,667 |
| 2 Earners | 862 (53.8%) | $53,130 |
| 3+ Earners | 147 (9.2%) | $131,653 |
| Total | 1,603 (100.0%) | $53,711 |
Household Income in Ocean City
Household Income Brackets in Ocean City
With 705 households falling in the category, the $50,000 to $74,999 income range is the most frequent in Ocean City, accounting for 26.2% of all households. In contrast, only 24 households (0.9%) fall into the $10,000 to $14,999 income bracket, making it the least populous group.
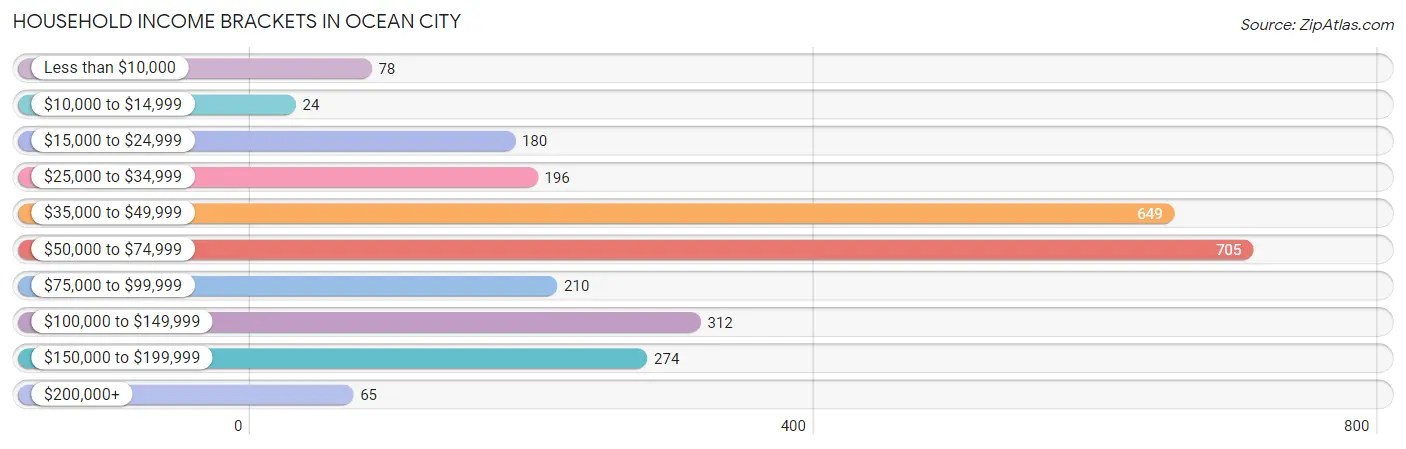
| Income Bracket | # Households | % Households |
| Less than $10,000 | 78 | 2.9% |
| $10,000 to $14,999 | 24 | 0.9% |
| $15,000 to $24,999 | 180 | 6.7% |
| $25,000 to $34,999 | 196 | 7.3% |
| $35,000 to $49,999 | 649 | 24.1% |
| $50,000 to $74,999 | 705 | 26.2% |
| $75,000 to $99,999 | 210 | 7.8% |
| $100,000 to $149,999 | 312 | 11.6% |
| $150,000 to $199,999 | 274 | 10.2% |
| $200,000+ | 65 | 2.4% |
Household Income by Householder Age in Ocean City
The median household income in Ocean City is $53,181, with the highest median household income of $64,464 found in the 65+ years age bracket for the primary householder. A total of 511 households (19.0%) fall into this category. Meanwhile, the 15 to 24 years age bracket for the primary householder has the lowest median household income of $0, with 101 households (3.7%) in this group.
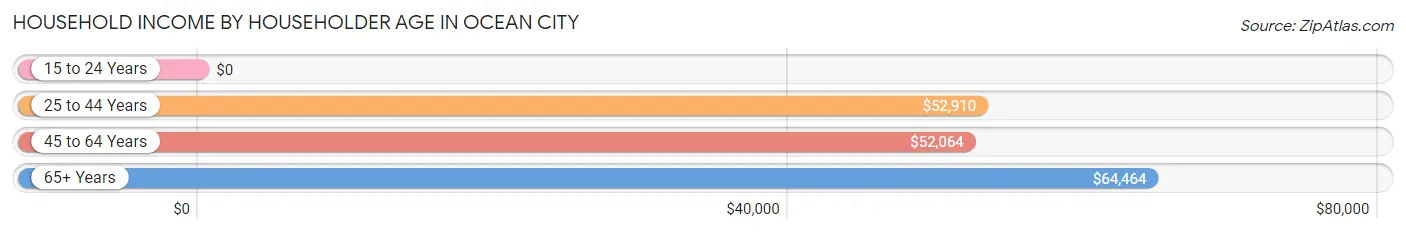
| Income Bracket | # Households | Median Income |
| 15 to 24 Years | 101 (3.7%) | $0 |
| 25 to 44 Years | 1,155 (42.9%) | $52,910 |
| 45 to 64 Years | 924 (34.3%) | $52,064 |
| 65+ Years | 511 (19.0%) | $64,464 |
| Total | 2,691 (100.0%) | $53,181 |
Poverty in Ocean City
Income Below Poverty by Sex and Age in Ocean City
With 9.3% poverty level for males and 7.7% for females among the residents of Ocean City, 15 year old males and 15 year old females are the most vulnerable to poverty, with 14 males (36.8%) and 13 females (38.2%) in their respective age groups living below the poverty level.
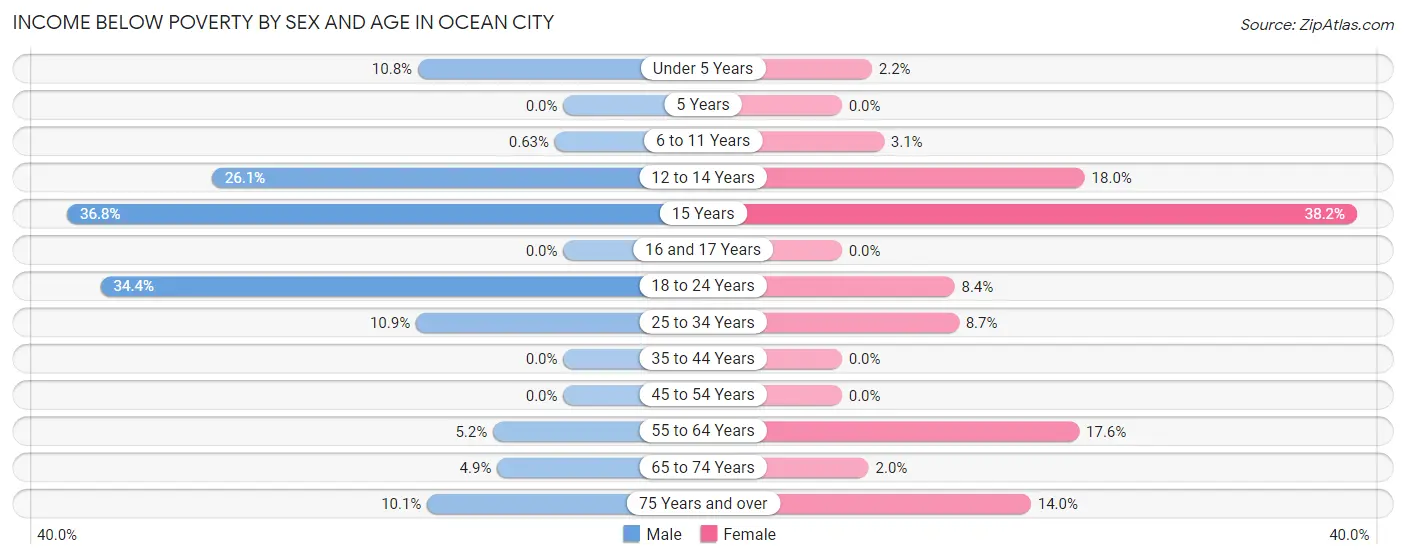
| Age Bracket | Male | Female |
| Under 5 Years | 19 (10.8%) | 4 (2.2%) |
| 5 Years | 0 (0.0%) | 0 (0.0%) |
| 6 to 11 Years | 1 (0.6%) | 6 (3.1%) |
| 12 to 14 Years | 18 (26.1%) | 22 (18.0%) |
| 15 Years | 14 (36.8%) | 13 (38.2%) |
| 16 and 17 Years | 0 (0.0%) | 0 (0.0%) |
| 18 to 24 Years | 101 (34.4%) | 20 (8.4%) |
| 25 to 34 Years | 85 (10.9%) | 65 (8.7%) |
| 35 to 44 Years | 0 (0.0%) | 0 (0.0%) |
| 45 to 54 Years | 0 (0.0%) | 0 (0.0%) |
| 55 to 64 Years | 23 (5.2%) | 68 (17.6%) |
| 65 to 74 Years | 8 (4.9%) | 4 (2.0%) |
| 75 Years and over | 18 (10.1%) | 31 (14.0%) |
| Total | 287 (9.3%) | 233 (7.7%) |
Income Above Poverty by Sex and Age in Ocean City
According to the poverty statistics in Ocean City, males aged 5 years and females aged 5 years are the age groups that are most secure financially, with 100.0% of males and 100.0% of females in these age groups living above the poverty line.
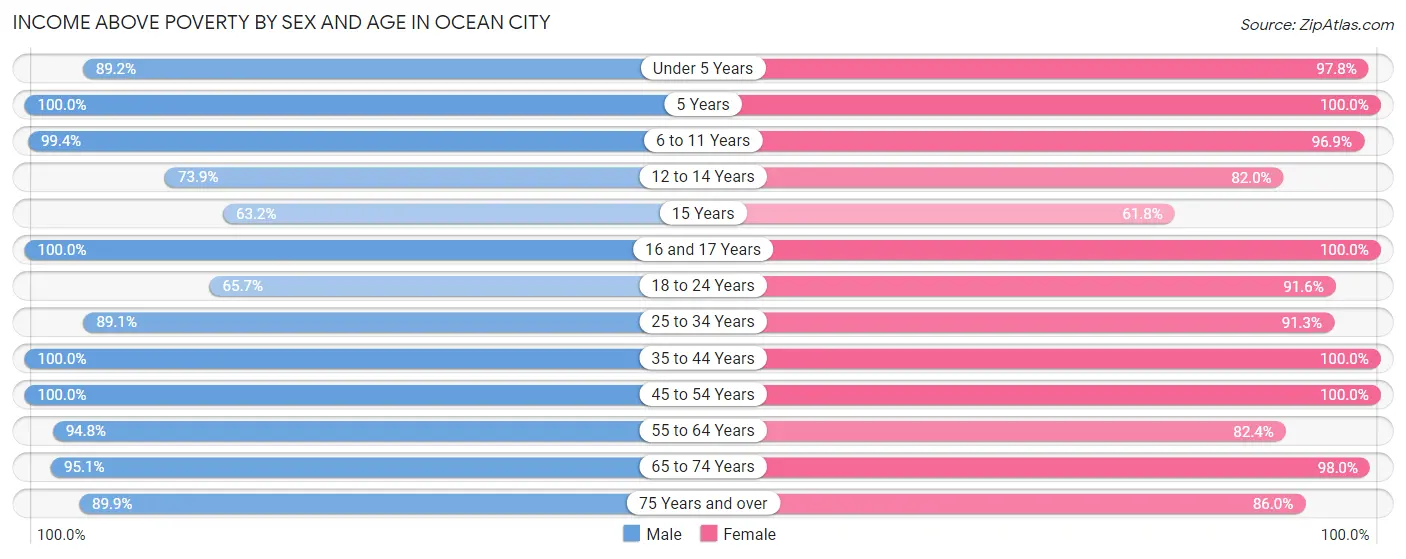
| Age Bracket | Male | Female |
| Under 5 Years | 157 (89.2%) | 175 (97.8%) |
| 5 Years | 19 (100.0%) | 75 (100.0%) |
| 6 to 11 Years | 158 (99.4%) | 186 (96.9%) |
| 12 to 14 Years | 51 (73.9%) | 100 (82.0%) |
| 15 Years | 24 (63.2%) | 21 (61.8%) |
| 16 and 17 Years | 21 (100.0%) | 64 (100.0%) |
| 18 to 24 Years | 193 (65.6%) | 219 (91.6%) |
| 25 to 34 Years | 692 (89.1%) | 684 (91.3%) |
| 35 to 44 Years | 305 (100.0%) | 199 (100.0%) |
| 45 to 54 Years | 436 (100.0%) | 371 (100.0%) |
| 55 to 64 Years | 418 (94.8%) | 318 (82.4%) |
| 65 to 74 Years | 155 (95.1%) | 197 (98.0%) |
| 75 Years and over | 160 (89.9%) | 190 (86.0%) |
| Total | 2,789 (90.7%) | 2,799 (92.3%) |
Income Below Poverty Among Married-Couple Families in Ocean City
The poverty statistics for married-couple families in Ocean City show that 2.9% or 31 of the total 1,064 families live below the poverty line. Families with no children have the highest poverty rate of 3.7%, comprising of 30 families. On the other hand, families with 1 or 2 children have the lowest poverty rate of 0.0%, which includes 0 families.
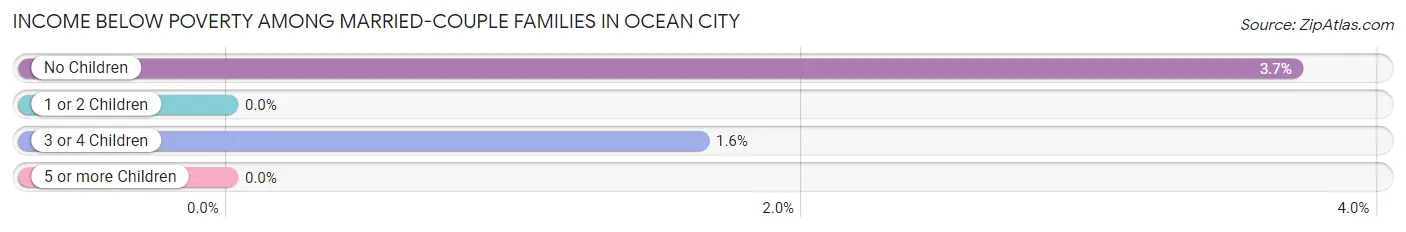
| Children | Above Poverty | Below Poverty |
| No Children | 779 (96.3%) | 30 (3.7%) |
| 1 or 2 Children | 179 (100.0%) | 0 (0.0%) |
| 3 or 4 Children | 60 (98.4%) | 1 (1.6%) |
| 5 or more Children | 15 (100.0%) | 0 (0.0%) |
| Total | 1,033 (97.1%) | 31 (2.9%) |
Income Below Poverty Among Single-Parent Households in Ocean City
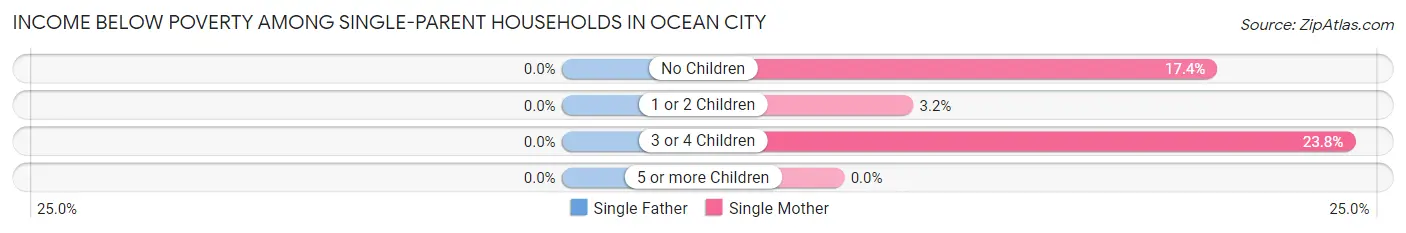
| Children | Single Father | Single Mother |
| No Children | 0 (0.0%) | 28 (17.4%) |
| 1 or 2 Children | 0 (0.0%) | 6 (3.2%) |
| 3 or 4 Children | 0 (0.0%) | 30 (23.8%) |
| 5 or more Children | 0 (0.0%) | 0 (0.0%) |
| Total | 0 (0.0%) | 64 (13.5%) |
Income Below Poverty Among Married-Couple vs Single-Parent Households in Ocean City
The poverty data for Ocean City shows that 31 of the married-couple family households (2.9%) and 64 of the single-parent households (11.9%) are living below the poverty level. Within the married-couple family households, those with no children have the highest poverty rate, with 30 households (3.7%) falling below the poverty line. Among the single-parent households, those with 3 or 4 children have the highest poverty rate, with 30 household (23.8%) living below poverty.
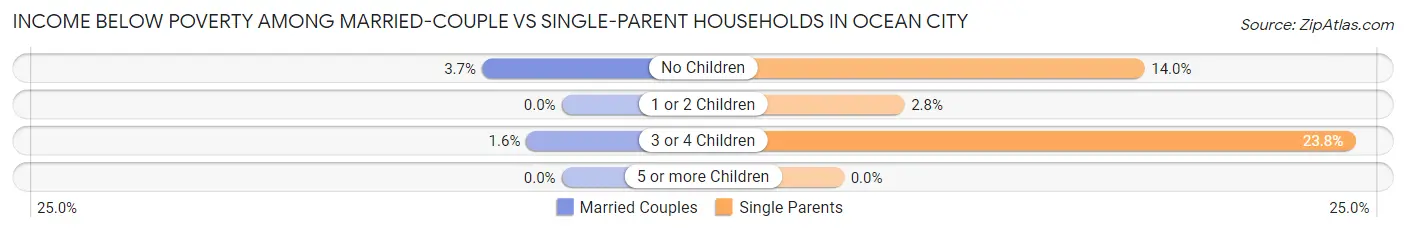
| Children | Married-Couple Families | Single-Parent Households |
| No Children | 30 (3.7%) | 28 (14.0%) |
| 1 or 2 Children | 0 (0.0%) | 6 (2.8%) |
| 3 or 4 Children | 1 (1.6%) | 30 (23.8%) |
| 5 or more Children | 0 (0.0%) | 0 (0.0%) |
| Total | 31 (2.9%) | 64 (11.9%) |
Race in Ocean City
The most populous races in Ocean City are White / Caucasian (4,419 | 72.4%), Hispanic or Latino (1,213 | 19.9%), and Two or more Races (744 | 12.2%).
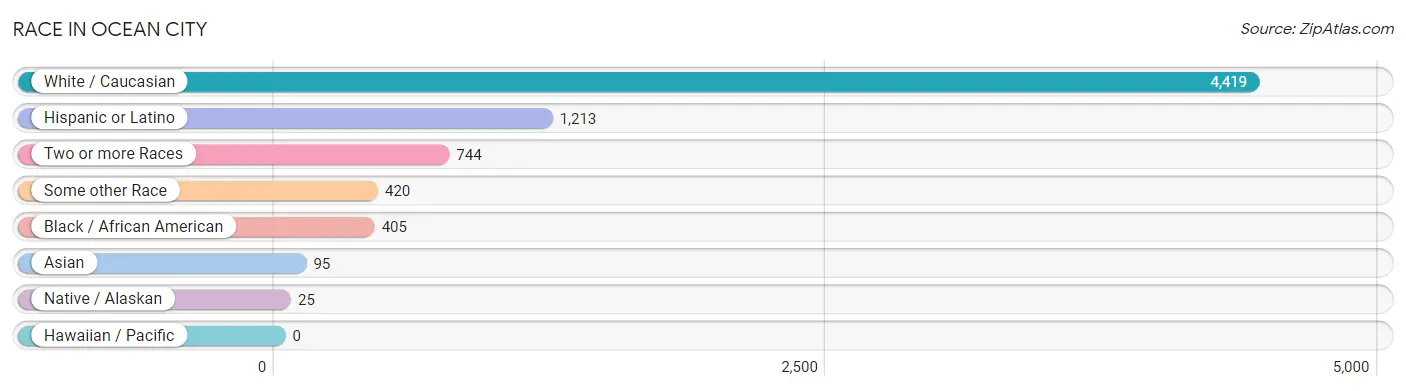
| Race | # Population | % Population |
| Asian | 95 | 1.6% |
| Black / African American | 405 | 6.6% |
| Hawaiian / Pacific | 0 | 0.0% |
| Hispanic or Latino | 1,213 | 19.9% |
| Native / Alaskan | 25 | 0.4% |
| White / Caucasian | 4,419 | 72.4% |
| Two or more Races | 744 | 12.2% |
| Some other Race | 420 | 6.9% |
| Total | 6,108 | 100.0% |
Ancestry in Ocean City
The most populous ancestries reported in Ocean City are Central American (697 | 11.4%), English (685 | 11.2%), Irish (600 | 9.8%), German (560 | 9.2%), and Mexican (350 | 5.7%), together accounting for 47.3% of all Ocean City residents.
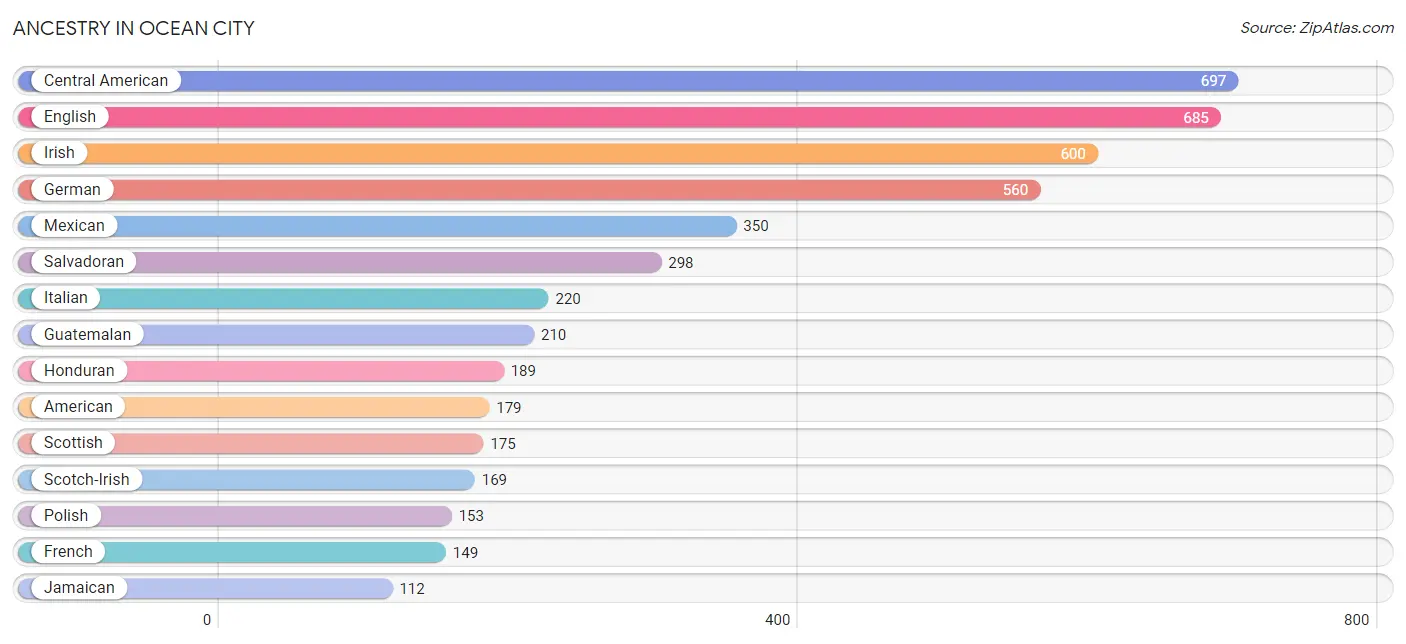
| Ancestry | # Population | % Population |
| African | 8 | 0.1% |
| American | 179 | 2.9% |
| Austrian | 11 | 0.2% |
| Bhutanese | 20 | 0.3% |
| Burmese | 10 | 0.2% |
| Cajun | 10 | 0.2% |
| Canadian | 6 | 0.1% |
| Central American | 697 | 11.4% |
| Cherokee | 20 | 0.3% |
| Creek | 18 | 0.3% |
| Cuban | 6 | 0.1% |
| Czech | 16 | 0.3% |
| Czechoslovakian | 31 | 0.5% |
| Dutch | 8 | 0.1% |
| Eastern European | 19 | 0.3% |
| English | 685 | 11.2% |
| European | 92 | 1.5% |
| French | 149 | 2.4% |
| German | 560 | 9.2% |
| Ghanaian | 71 | 1.2% |
| Greek | 21 | 0.3% |
| Guatemalan | 210 | 3.4% |
| Honduran | 189 | 3.1% |
| Hungarian | 38 | 0.6% |
| Indian (Asian) | 25 | 0.4% |
| Irish | 600 | 9.8% |
| Italian | 220 | 3.6% |
| Jamaican | 112 | 1.8% |
| Korean | 65 | 1.1% |
| Lithuanian | 74 | 1.2% |
| Macedonian | 25 | 0.4% |
| Malaysian | 12 | 0.2% |
| Mexican | 350 | 5.7% |
| Northern European | 15 | 0.3% |
| Norwegian | 35 | 0.6% |
| Pakistani | 73 | 1.2% |
| Polish | 153 | 2.5% |
| Puerto Rican | 27 | 0.4% |
| Salvadoran | 298 | 4.9% |
| Scotch-Irish | 169 | 2.8% |
| Scottish | 175 | 2.9% |
| South American | 74 | 1.2% |
| Spaniard | 8 | 0.1% |
| Spanish | 10 | 0.2% |
| Subsaharan African | 79 | 1.3% |
| Swedish | 57 | 0.9% |
| Swiss | 6 | 0.1% |
| Thai | 112 | 1.8% |
| Tohono O'Odham | 21 | 0.3% |
| Ukrainian | 17 | 0.3% |
| Venezuelan | 74 | 1.2% |
| Welsh | 10 | 0.2% | View All 52 Rows |
Immigrants in Ocean City
The most numerous immigrant groups reported in Ocean City came from Latin America (809 | 13.2%), Central America (735 | 12.0%), El Salvador (235 | 3.8%), Guatemala (178 | 2.9%), and Mexico (170 | 2.8%), together accounting for 34.8% of all Ocean City residents.
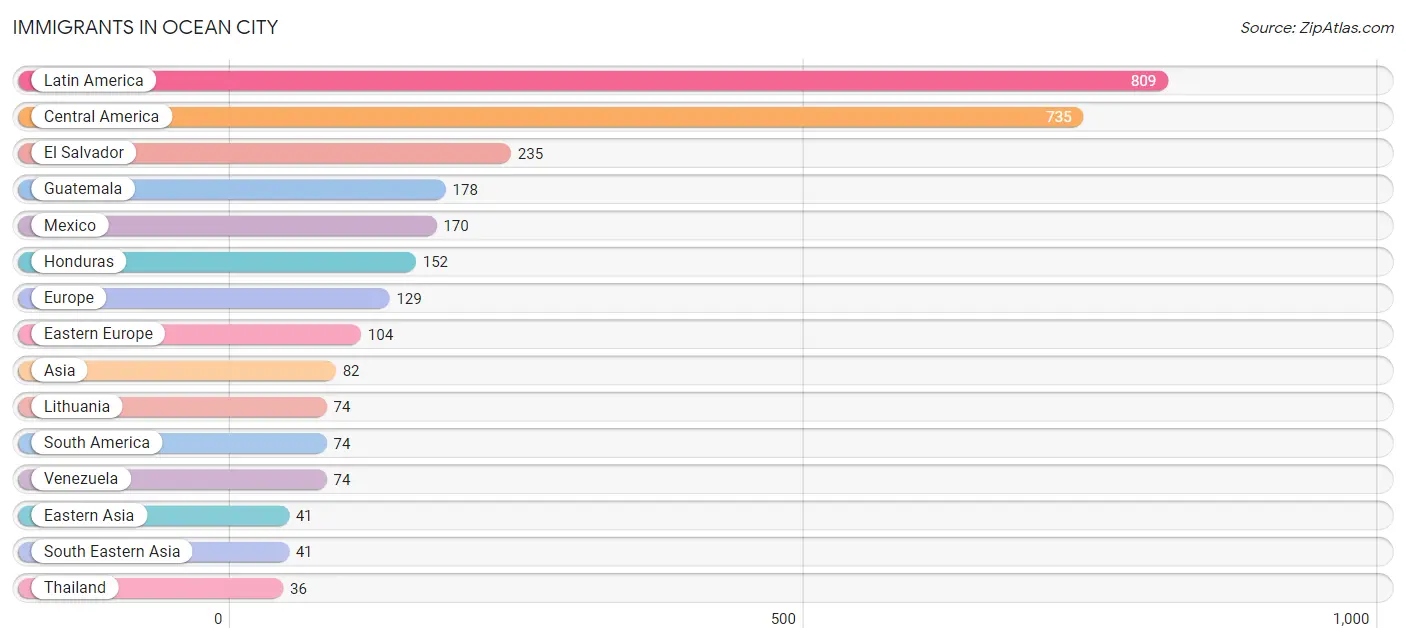
| Immigration Origin | # Population | % Population |
| Asia | 82 | 1.3% |
| Canada | 6 | 0.1% |
| Central America | 735 | 12.0% |
| China | 25 | 0.4% |
| Eastern Asia | 41 | 0.7% |
| Eastern Europe | 104 | 1.7% |
| El Salvador | 235 | 3.8% |
| England | 17 | 0.3% |
| Europe | 129 | 2.1% |
| Guatemala | 178 | 2.9% |
| Honduras | 152 | 2.5% |
| Hong Kong | 25 | 0.4% |
| Japan | 16 | 0.3% |
| Latin America | 809 | 13.2% |
| Lithuania | 74 | 1.2% |
| Mexico | 170 | 2.8% |
| Northern Europe | 17 | 0.3% |
| Philippines | 5 | 0.1% |
| Poland | 17 | 0.3% |
| South America | 74 | 1.2% |
| South Eastern Asia | 41 | 0.7% |
| Southern Europe | 8 | 0.1% |
| Spain | 8 | 0.1% |
| Thailand | 36 | 0.6% |
| Venezuela | 74 | 1.2% | View All 25 Rows |
Sex and Age in Ocean City
Sex and Age in Ocean City
The most populous age groups in Ocean City are 30 to 34 Years (435 | 14.1%) for men and 25 to 29 Years (418 | 13.8%) for women.
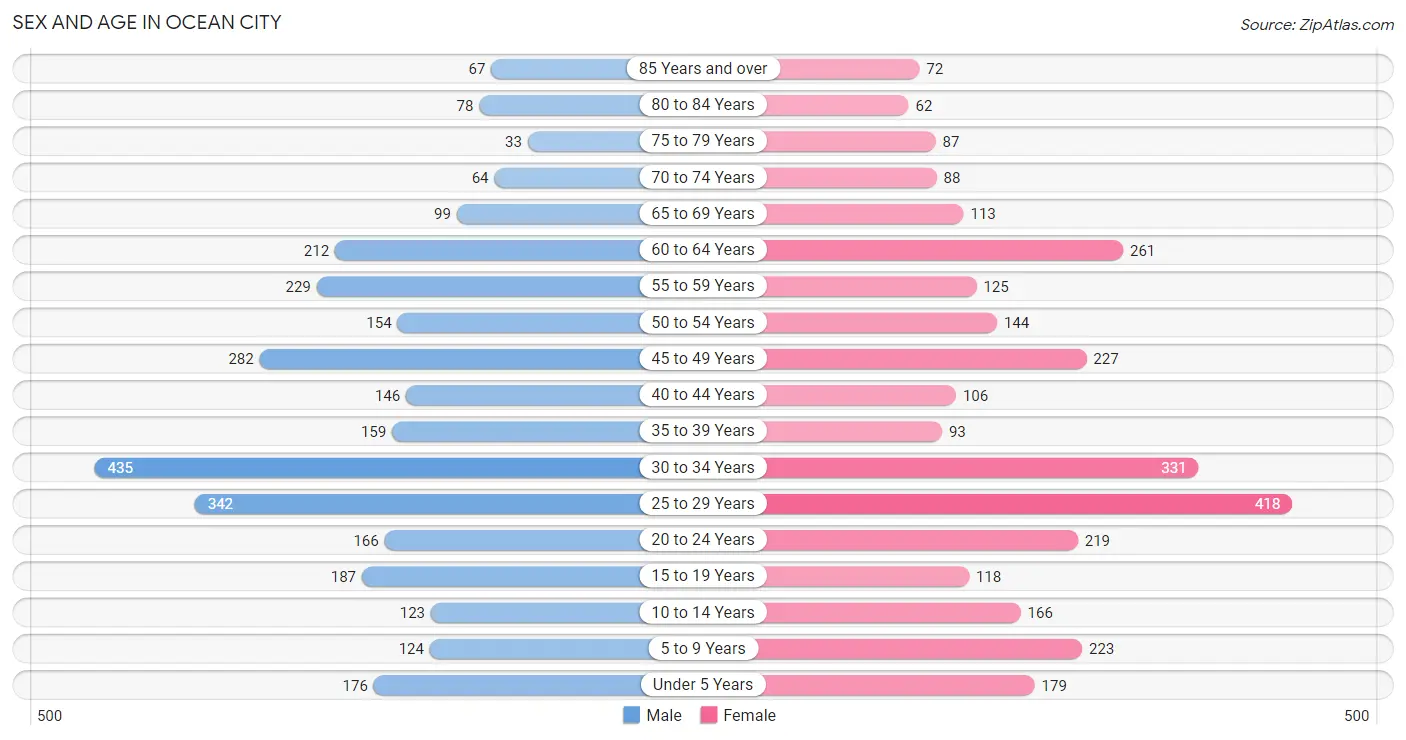
| Age Bracket | Male | Female |
| Under 5 Years | 176 (5.7%) | 179 (5.9%) |
| 5 to 9 Years | 124 (4.0%) | 223 (7.3%) |
| 10 to 14 Years | 123 (4.0%) | 166 (5.5%) |
| 15 to 19 Years | 187 (6.1%) | 118 (3.9%) |
| 20 to 24 Years | 166 (5.4%) | 219 (7.2%) |
| 25 to 29 Years | 342 (11.1%) | 418 (13.8%) |
| 30 to 34 Years | 435 (14.1%) | 331 (10.9%) |
| 35 to 39 Years | 159 (5.2%) | 93 (3.1%) |
| 40 to 44 Years | 146 (4.8%) | 106 (3.5%) |
| 45 to 49 Years | 282 (9.2%) | 227 (7.5%) |
| 50 to 54 Years | 154 (5.0%) | 144 (4.8%) |
| 55 to 59 Years | 229 (7.4%) | 125 (4.1%) |
| 60 to 64 Years | 212 (6.9%) | 261 (8.6%) |
| 65 to 69 Years | 99 (3.2%) | 113 (3.7%) |
| 70 to 74 Years | 64 (2.1%) | 88 (2.9%) |
| 75 to 79 Years | 33 (1.1%) | 87 (2.9%) |
| 80 to 84 Years | 78 (2.5%) | 62 (2.0%) |
| 85 Years and over | 67 (2.2%) | 72 (2.4%) |
| Total | 3,076 (100.0%) | 3,032 (100.0%) |
Families and Households in Ocean City
Median Family Size in Ocean City
The median family size in Ocean City is 2.85 persons per family, with single male/father families (65 | 4.1%) accounting for the largest median family size of 3 persons per family. On the other hand, married-couple families (1,064 | 66.4%) represent the smallest median family size with 2.81 persons per family.
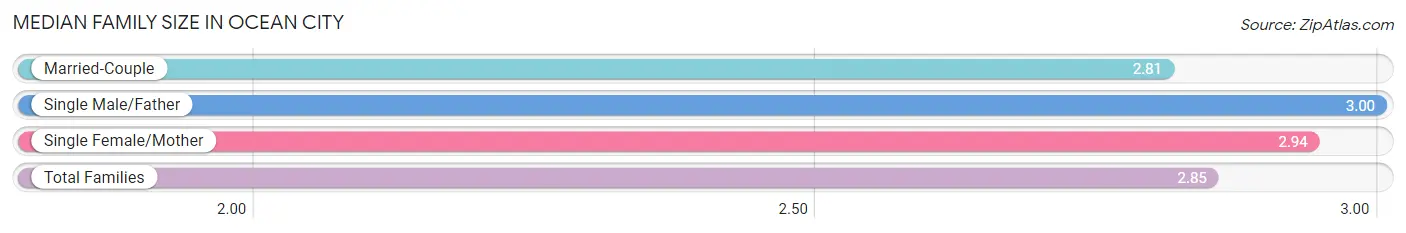
| Family Type | # Families | Family Size |
| Married-Couple | 1,064 (66.4%) | 2.81 |
| Single Male/Father | 65 (4.1%) | 3.00 |
| Single Female/Mother | 474 (29.6%) | 2.94 |
| Total Families | 1,603 (100.0%) | 2.85 |
Median Household Size in Ocean City
The median household size in Ocean City is 2.27 persons per household, with single male/father households (65 | 2.4%) accounting for the largest median household size of 3.43 persons per household. non-family households (1,088 | 40.4%) represent the smallest median household size with 1.18 persons per household.
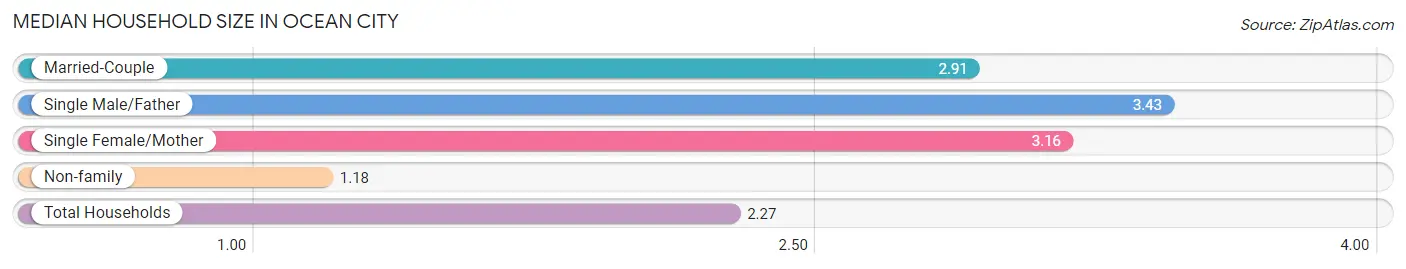
| Household Type | # Households | Household Size |
| Married-Couple | 1,064 (39.5%) | 2.91 |
| Single Male/Father | 65 (2.4%) | 3.43 |
| Single Female/Mother | 474 (17.6%) | 3.16 |
| Non-family | 1,088 (40.4%) | 1.18 |
| Total Households | 2,691 (100.0%) | 2.27 |
Household Size by Marriage Status in Ocean City
Out of a total of 2,691 households in Ocean City, 1,603 (59.6%) are family households, while 1,088 (40.4%) are nonfamily households. The most numerous type of family households are 2-person households, comprising 810, and the most common type of nonfamily households are 1-person households, comprising 926.
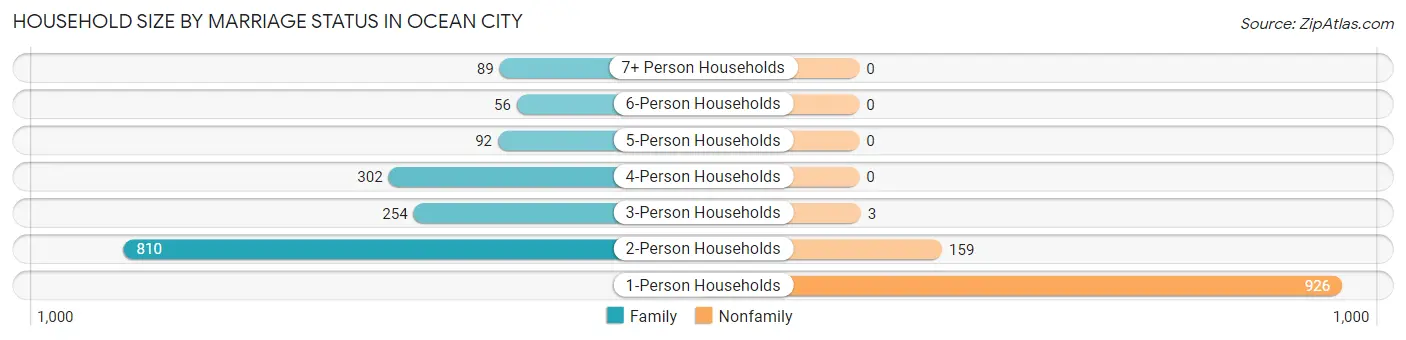
| Household Size | Family Households | Nonfamily Households |
| 1-Person Households | - | 926 (34.4%) |
| 2-Person Households | 810 (30.1%) | 159 (5.9%) |
| 3-Person Households | 254 (9.4%) | 3 (0.1%) |
| 4-Person Households | 302 (11.2%) | 0 (0.0%) |
| 5-Person Households | 92 (3.4%) | 0 (0.0%) |
| 6-Person Households | 56 (2.1%) | 0 (0.0%) |
| 7+ Person Households | 89 (3.3%) | 0 (0.0%) |
| Total | 1,603 (59.6%) | 1,088 (40.4%) |
Female Fertility in Ocean City
Fertility by Age in Ocean City
Average fertility rate in Ocean City is 31.0 births per 1,000 women. Women in the age bracket of 35 to 50 years have the highest fertility rate with 105.0 births per 1,000 women. Women in the age bracket of 35 to 50 years acount for 97.9% of all women with births.
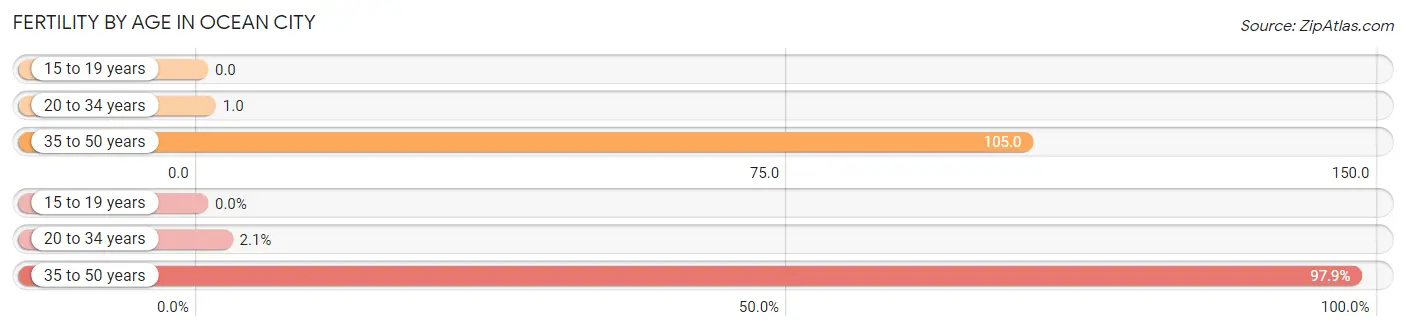
| Age Bracket | Women with Births | Births / 1,000 Women |
| 15 to 19 years | 0 (0.0%) | 0.0 |
| 20 to 34 years | 1 (2.1%) | 1.0 |
| 35 to 50 years | 47 (97.9%) | 105.0 |
| Total | 48 (100.0%) | 31.0 |
Fertility by Age by Marriage Status in Ocean City
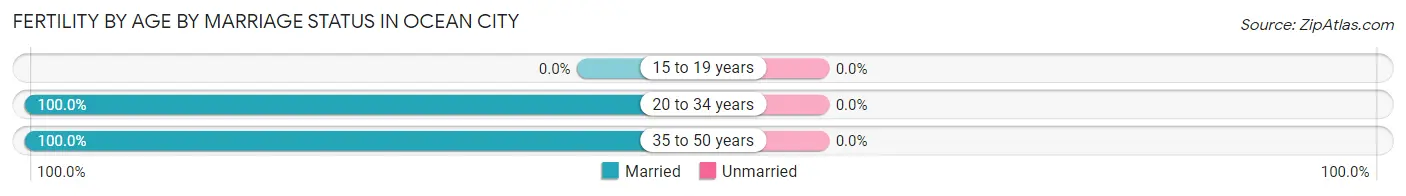
| Age Bracket | Married | Unmarried |
| 15 to 19 years | 0 (0.0%) | 0 (0.0%) |
| 20 to 34 years | 1 (100.0%) | 0 (0.0%) |
| 35 to 50 years | 47 (100.0%) | 0 (0.0%) |
| Total | 48 (100.0%) | 0 (0.0%) |
Fertility by Education in Ocean City
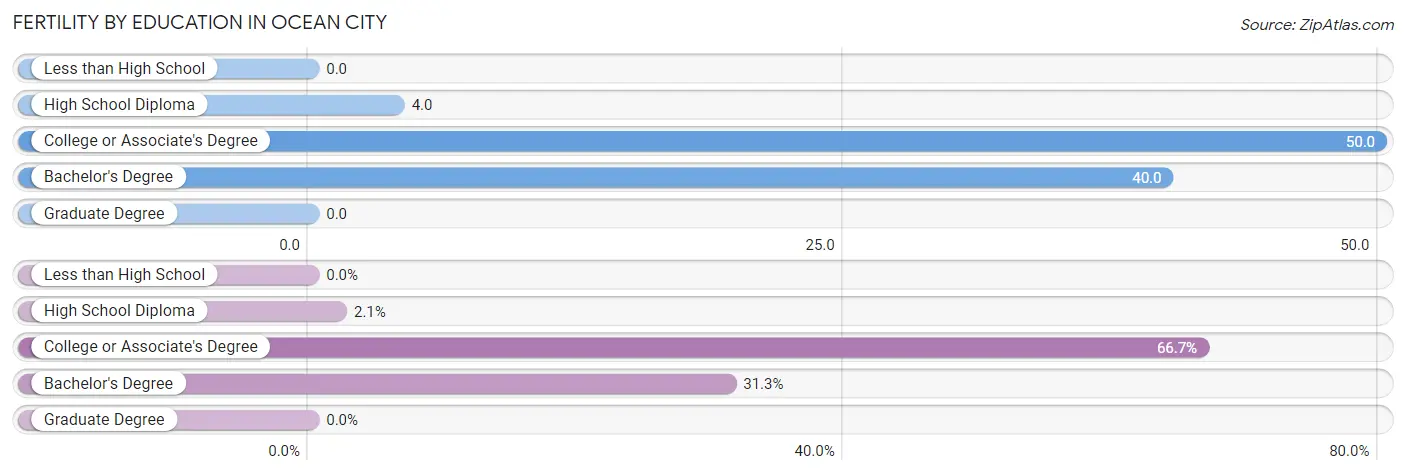
| Educational Attainment | Women with Births | Births / 1,000 Women |
| Less than High School | 0 (0.0%) | 0.0 |
| High School Diploma | 1 (2.1%) | 4.0 |
| College or Associate's Degree | 32 (66.7%) | 50.0 |
| Bachelor's Degree | 15 (31.2%) | 40.0 |
| Graduate Degree | 0 (0.0%) | 0.0 |
| Total | 48 (100.0%) | 31.0 |
Fertility by Education by Marriage Status in Ocean City
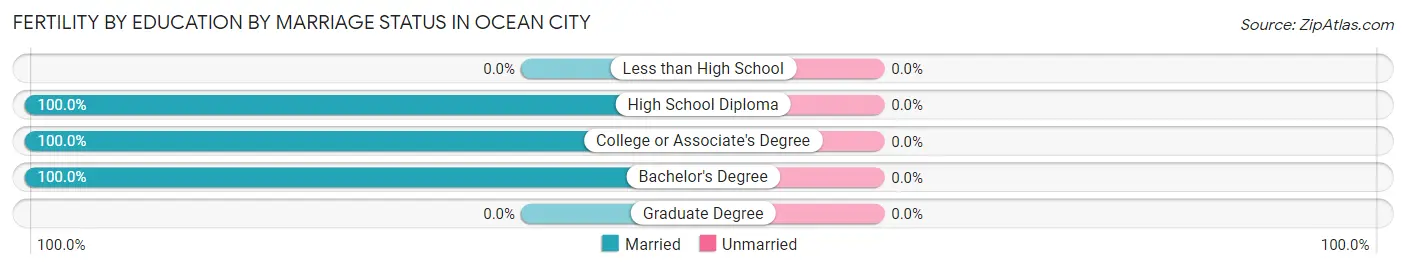
| Educational Attainment | Married | Unmarried |
| Less than High School | 0 (0.0%) | 0 (0.0%) |
| High School Diploma | 1 (100.0%) | 0 (0.0%) |
| College or Associate's Degree | 32 (100.0%) | 0 (0.0%) |
| Bachelor's Degree | 15 (100.0%) | 0 (0.0%) |
| Graduate Degree | 0 (0.0%) | 0 (0.0%) |
| Total | 48 (100.0%) | 0 (0.0%) |
Employment Characteristics in Ocean City
Employment by Class of Employer in Ocean City
Among the 3,417 employed individuals in Ocean City, private company employees (2,236 | 65.4%), federal government employees (576 | 16.9%), and self-employed (not incorporated) (193 | 5.7%) make up the most common classes of employment.
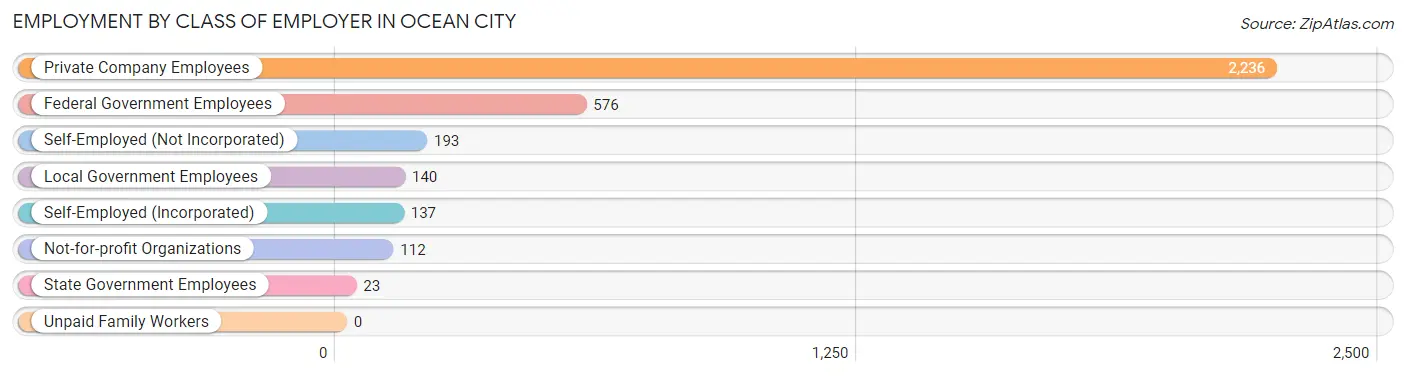
| Employer Class | # Employees | % Employees |
| Private Company Employees | 2,236 | 65.4% |
| Self-Employed (Incorporated) | 137 | 4.0% |
| Self-Employed (Not Incorporated) | 193 | 5.7% |
| Not-for-profit Organizations | 112 | 3.3% |
| Local Government Employees | 140 | 4.1% |
| State Government Employees | 23 | 0.7% |
| Federal Government Employees | 576 | 16.9% |
| Unpaid Family Workers | 0 | 0.0% |
| Total | 3,417 | 100.0% |
Employment Status by Age in Ocean City
According to the labor force statistics for Ocean City, out of the total population over 16 years of age (5,045), 69.7% or 3,516 individuals are in the labor force, with 1.7% or 60 of them unemployed. The age group with the highest labor force participation rate is 25 to 29 years, with 89.2% or 678 individuals in the labor force. Within the labor force, the 55 to 59 years age range has the highest percentage of unemployed individuals, with 8.6% or 27 of them being unemployed.
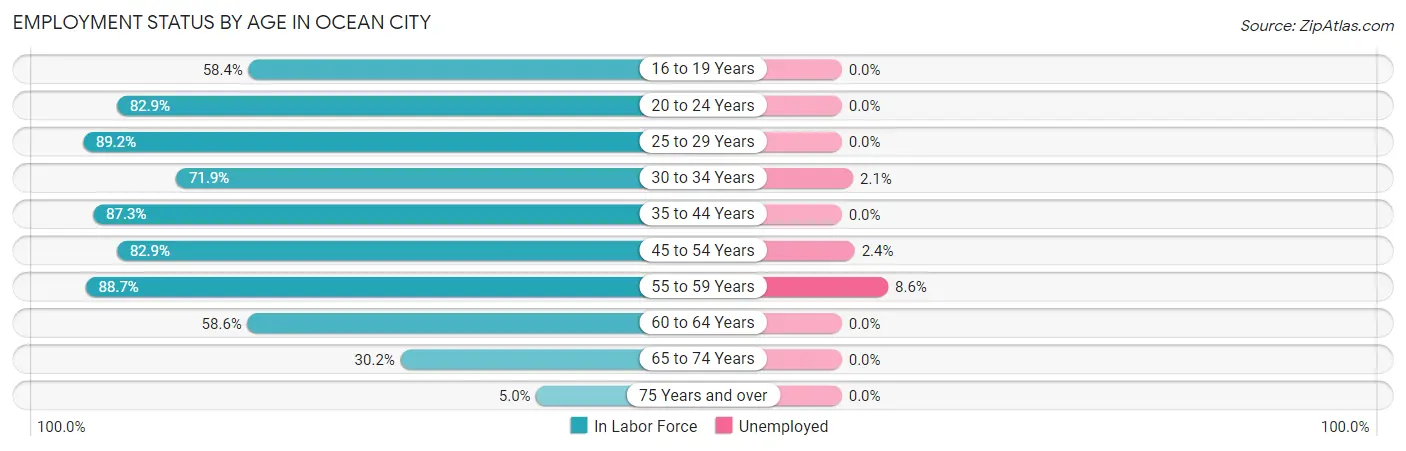
| Age Bracket | In Labor Force | Unemployed |
| 16 to 19 Years | 136 (58.4%) | 0 (0.0%) |
| 20 to 24 Years | 319 (82.9%) | 0 (0.0%) |
| 25 to 29 Years | 678 (89.2%) | 0 (0.0%) |
| 30 to 34 Years | 551 (71.9%) | 12 (2.1%) |
| 35 to 44 Years | 440 (87.3%) | 0 (0.0%) |
| 45 to 54 Years | 669 (82.9%) | 16 (2.4%) |
| 55 to 59 Years | 314 (88.7%) | 27 (8.6%) |
| 60 to 64 Years | 277 (58.6%) | 0 (0.0%) |
| 65 to 74 Years | 110 (30.2%) | 0 (0.0%) |
| 75 Years and over | 20 (5.0%) | 0 (0.0%) |
| Total | 3,516 (69.7%) | 60 (1.7%) |
Employment Status by Educational Attainment in Ocean City
According to labor force statistics for Ocean City, 79.9% of individuals (2,928) out of the total population between 25 and 64 years of age (3,664) are in the labor force, with 2.0% or 59 of them being unemployed. The group with the highest labor force participation rate are those with the educational attainment of bachelor's degree or higher, with 87.8% or 824 individuals in the labor force. Within the labor force, individuals with less than high school education have the highest percentage of unemployment, with 3.8% or 16 of them being unemployed.
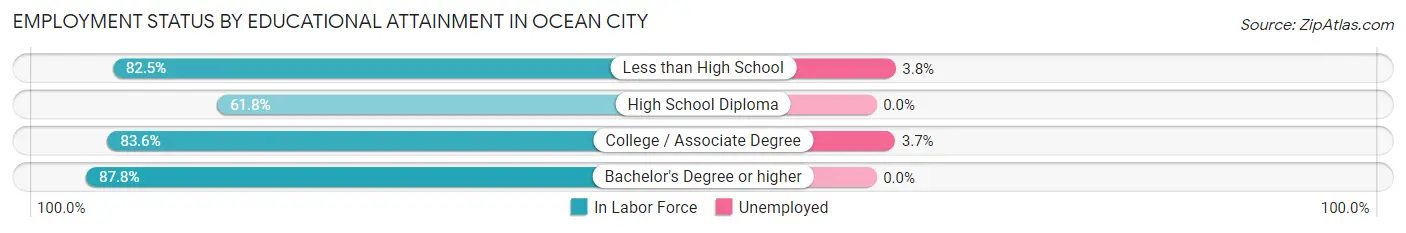
| Educational Attainment | In Labor Force | Unemployed |
| Less than High School | 423 (82.5%) | 19 (3.8%) |
| High School Diploma | 473 (61.8%) | 0 (0.0%) |
| College / Associate Degree | 1,210 (83.6%) | 54 (3.7%) |
| Bachelor's Degree or higher | 824 (87.8%) | 0 (0.0%) |
| Total | 2,928 (79.9%) | 73 (2.0%) |
Employment Occupations by Sex in Ocean City
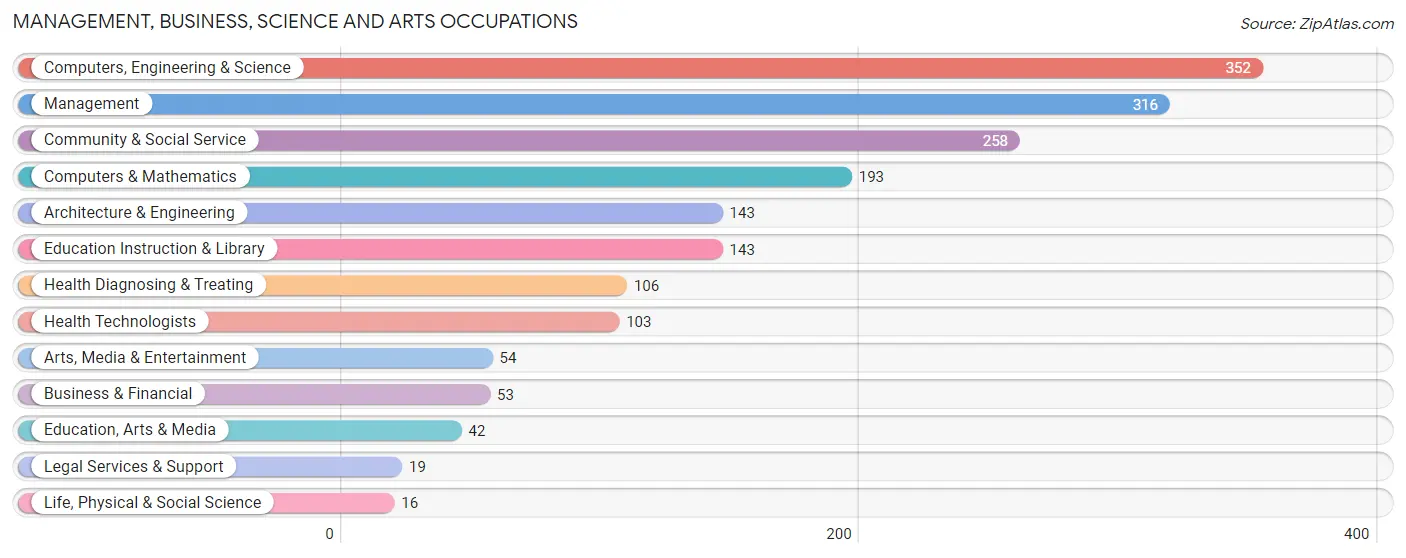
Management, Business, Science and Arts Occupations
The most common Management, Business, Science and Arts occupations in Ocean City are Computers, Engineering & Science (352 | 11.5%), Management (316 | 10.3%), Community & Social Service (258 | 8.4%), Computers & Mathematics (193 | 6.3%), and Architecture & Engineering (143 | 4.6%).
Management, Business, Science and Arts Occupations by Sex
Within the Management, Business, Science and Arts occupations in Ocean City, the most male-oriented occupations are Architecture & Engineering (100.0%), Computers, Engineering & Science (81.0%), and Arts, Media & Entertainment (77.8%), while the most female-oriented occupations are Life, Physical & Social Science (100.0%), Legal Services & Support (100.0%), and Health Diagnosing & Treating (100.0%).
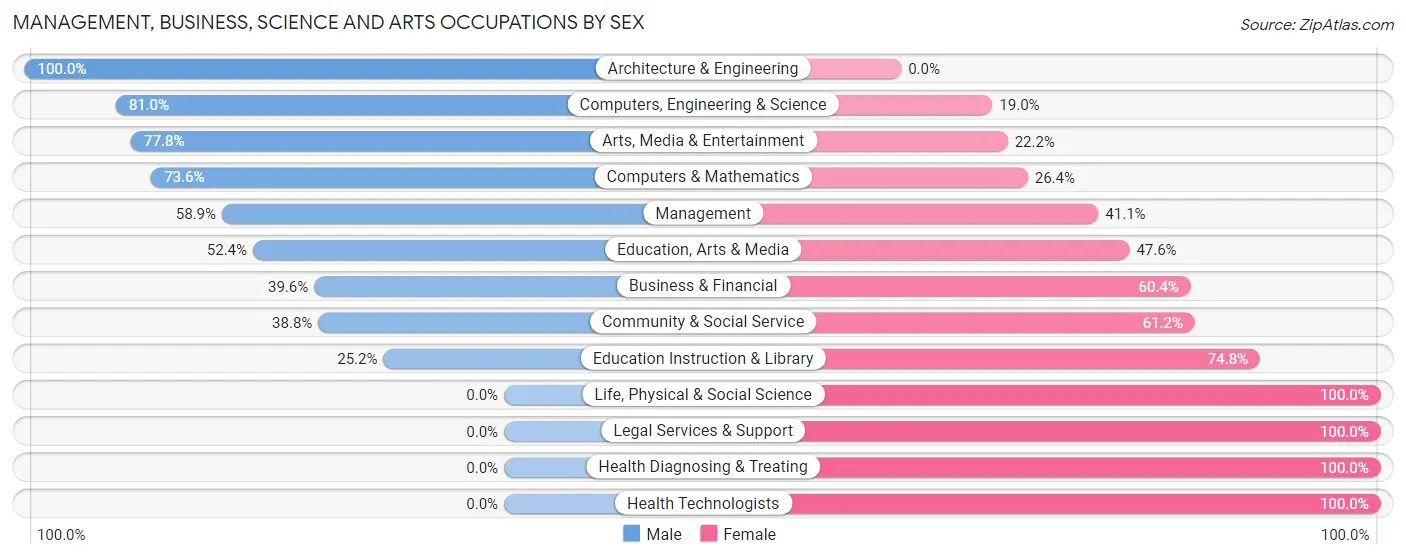
| Occupation | Male | Female |
| Management | 186 (58.9%) | 130 (41.1%) |
| Business & Financial | 21 (39.6%) | 32 (60.4%) |
| Computers, Engineering & Science | 285 (81.0%) | 67 (19.0%) |
| Computers & Mathematics | 142 (73.6%) | 51 (26.4%) |
| Architecture & Engineering | 143 (100.0%) | 0 (0.0%) |
| Life, Physical & Social Science | 0 (0.0%) | 16 (100.0%) |
| Community & Social Service | 100 (38.8%) | 158 (61.2%) |
| Education, Arts & Media | 22 (52.4%) | 20 (47.6%) |
| Legal Services & Support | 0 (0.0%) | 19 (100.0%) |
| Education Instruction & Library | 36 (25.2%) | 107 (74.8%) |
| Arts, Media & Entertainment | 42 (77.8%) | 12 (22.2%) |
| Health Diagnosing & Treating | 0 (0.0%) | 106 (100.0%) |
| Health Technologists | 0 (0.0%) | 103 (100.0%) |
| Total (Category) | 592 (54.6%) | 493 (45.4%) |
| Total (Overall) | 1,788 (58.2%) | 1,284 (41.8%) |
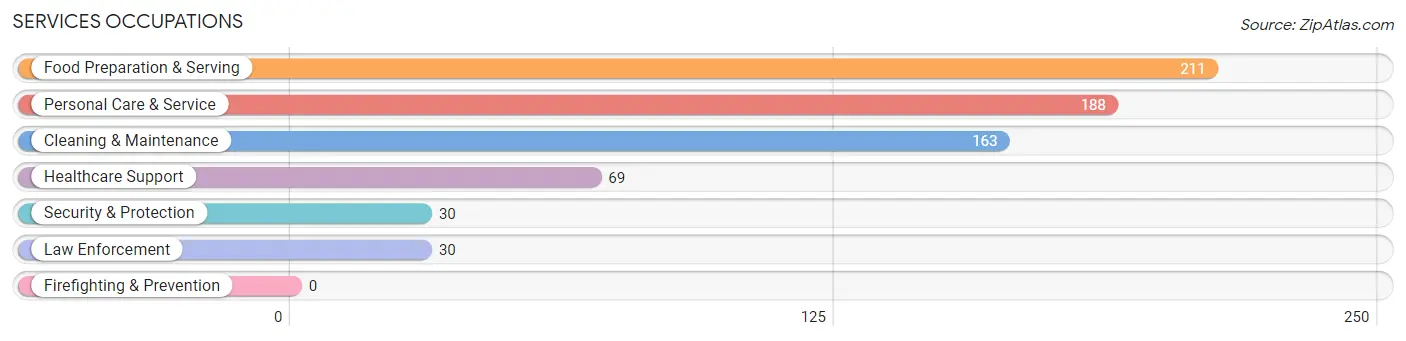
Services Occupations
The most common Services occupations in Ocean City are Food Preparation & Serving (211 | 6.9%), Personal Care & Service (188 | 6.1%), Cleaning & Maintenance (163 | 5.3%), Healthcare Support (69 | 2.2%), and Security & Protection (30 | 1.0%).
Services Occupations by Sex
Within the Services occupations in Ocean City, the most male-oriented occupations are Security & Protection (100.0%), Law Enforcement (100.0%), and Cleaning & Maintenance (66.3%), while the most female-oriented occupations are Healthcare Support (84.1%), Personal Care & Service (62.2%), and Food Preparation & Serving (39.8%).
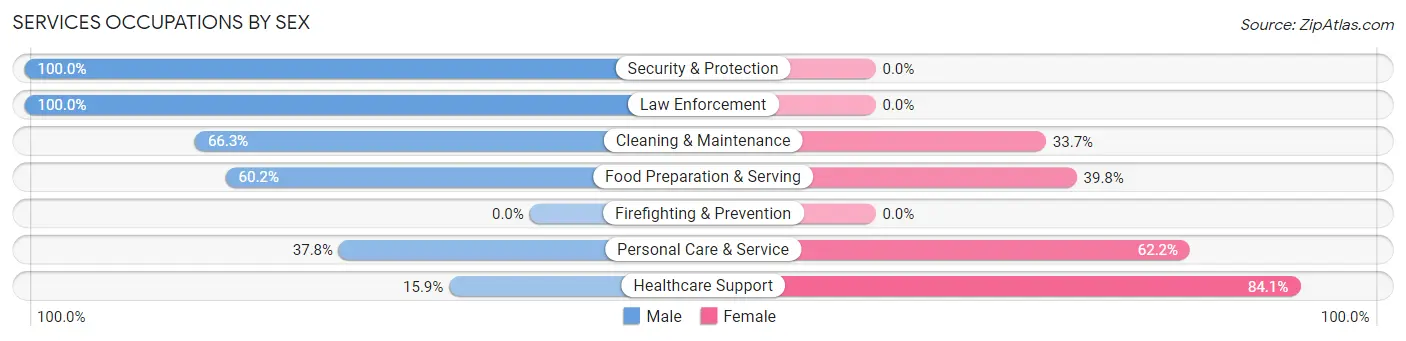
| Occupation | Male | Female |
| Healthcare Support | 11 (15.9%) | 58 (84.1%) |
| Security & Protection | 30 (100.0%) | 0 (0.0%) |
| Firefighting & Prevention | 0 (0.0%) | 0 (0.0%) |
| Law Enforcement | 30 (100.0%) | 0 (0.0%) |
| Food Preparation & Serving | 127 (60.2%) | 84 (39.8%) |
| Cleaning & Maintenance | 108 (66.3%) | 55 (33.7%) |
| Personal Care & Service | 71 (37.8%) | 117 (62.2%) |
| Total (Category) | 347 (52.5%) | 314 (47.5%) |
| Total (Overall) | 1,788 (58.2%) | 1,284 (41.8%) |
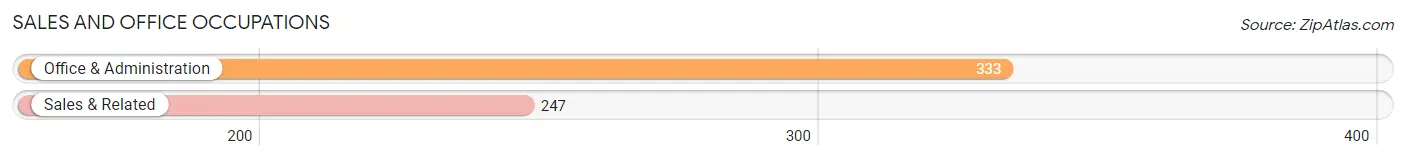
Sales and Office Occupations
The most common Sales and Office occupations in Ocean City are Office & Administration (333 | 10.8%), and Sales & Related (247 | 8.0%).
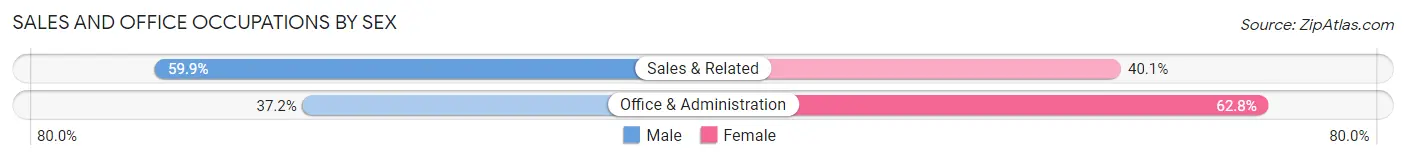
Sales and Office Occupations by Sex
| Occupation | Male | Female |
| Sales & Related | 148 (59.9%) | 99 (40.1%) |
| Office & Administration | 124 (37.2%) | 209 (62.8%) |
| Total (Category) | 272 (46.9%) | 308 (53.1%) |
| Total (Overall) | 1,788 (58.2%) | 1,284 (41.8%) |
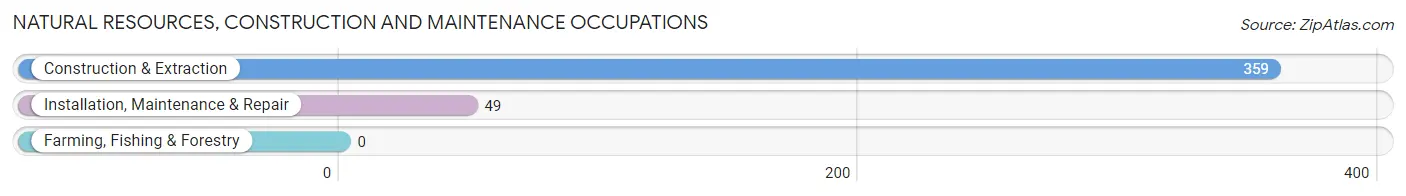
Natural Resources, Construction and Maintenance Occupations
The most common Natural Resources, Construction and Maintenance occupations in Ocean City are Construction & Extraction (359 | 11.7%), and Installation, Maintenance & Repair (49 | 1.6%).
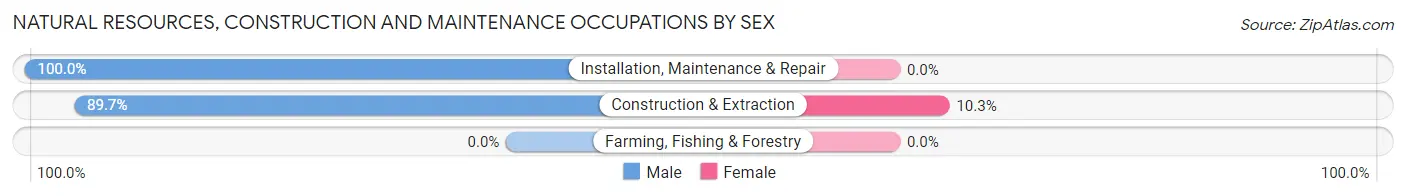
Natural Resources, Construction and Maintenance Occupations by Sex
| Occupation | Male | Female |
| Farming, Fishing & Forestry | 0 (0.0%) | 0 (0.0%) |
| Construction & Extraction | 322 (89.7%) | 37 (10.3%) |
| Installation, Maintenance & Repair | 49 (100.0%) | 0 (0.0%) |
| Total (Category) | 371 (90.9%) | 37 (9.1%) |
| Total (Overall) | 1,788 (58.2%) | 1,284 (41.8%) |
Production, Transportation and Moving Occupations
The most common Production, Transportation and Moving occupations in Ocean City are Material Moving (143 | 4.6%), Production (111 | 3.6%), and Transportation (84 | 2.7%).
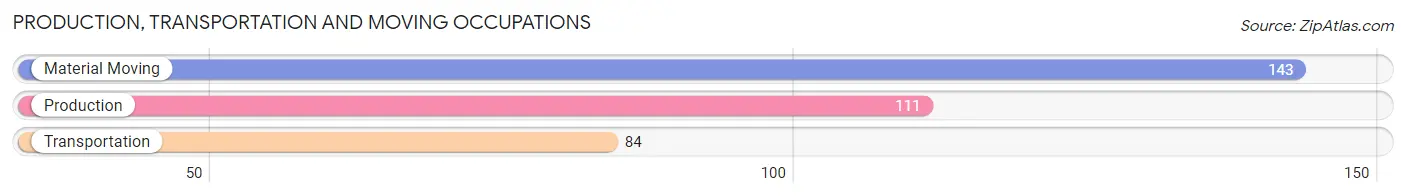
Production, Transportation and Moving Occupations by Sex
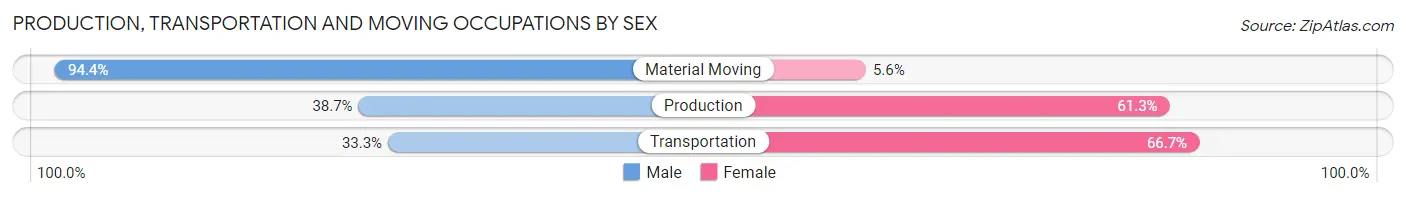
| Occupation | Male | Female |
| Production | 43 (38.7%) | 68 (61.3%) |
| Transportation | 28 (33.3%) | 56 (66.7%) |
| Material Moving | 135 (94.4%) | 8 (5.6%) |
| Total (Category) | 206 (61.0%) | 132 (39.1%) |
| Total (Overall) | 1,788 (58.2%) | 1,284 (41.8%) |
Employment Industries by Sex in Ocean City
Employment Industries in Ocean City
The major employment industries in Ocean City include Construction (468 | 15.2%), Professional & Scientific (385 | 12.5%), Health Care & Social Assistance (348 | 11.3%), Retail Trade (307 | 10.0%), and Accommodation & Food Services (301 | 9.8%).
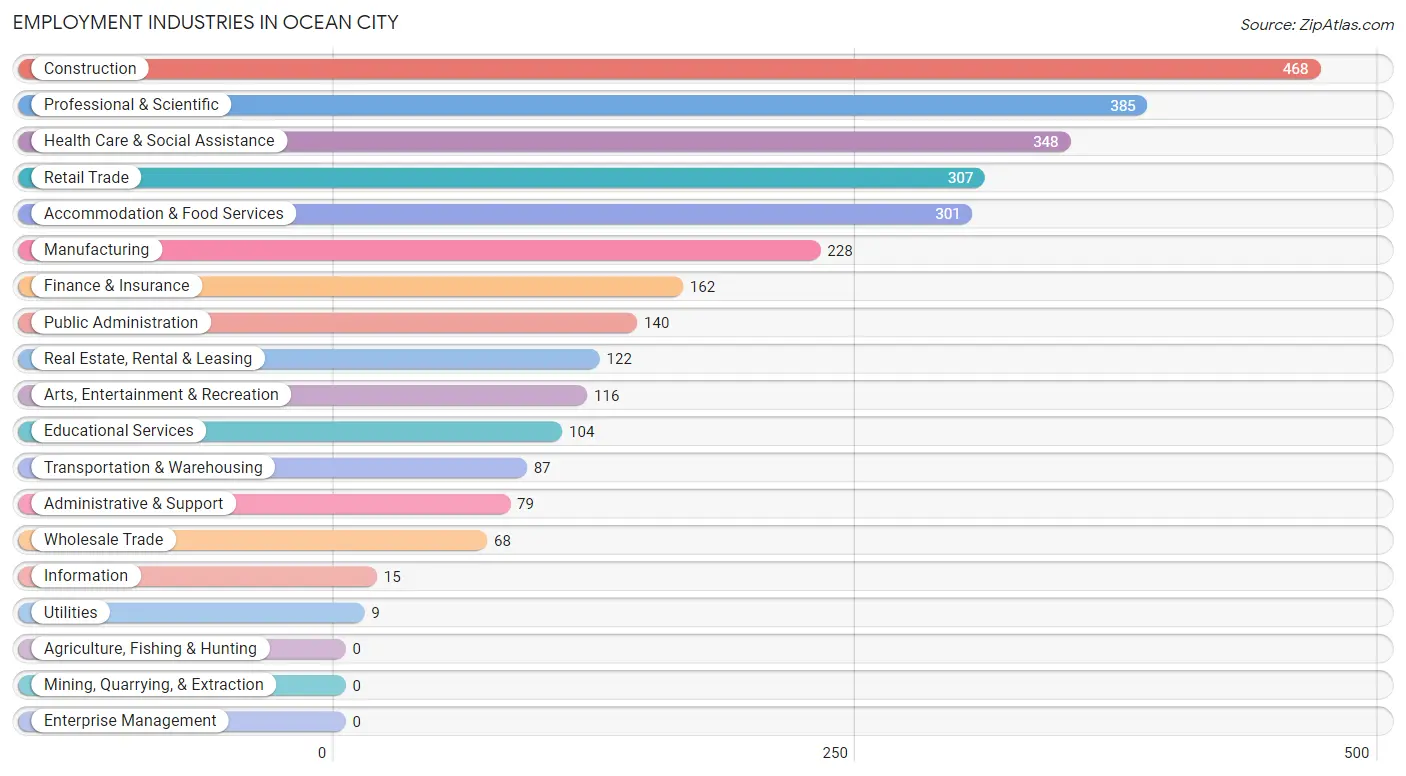
Employment Industries by Sex in Ocean City
The Ocean City industries that see more men than women are Utilities (100.0%), Information (100.0%), and Construction (85.7%), whereas the industries that tend to have a higher number of women are Health Care & Social Assistance (88.5%), Real Estate, Rental & Leasing (86.1%), and Educational Services (84.6%).
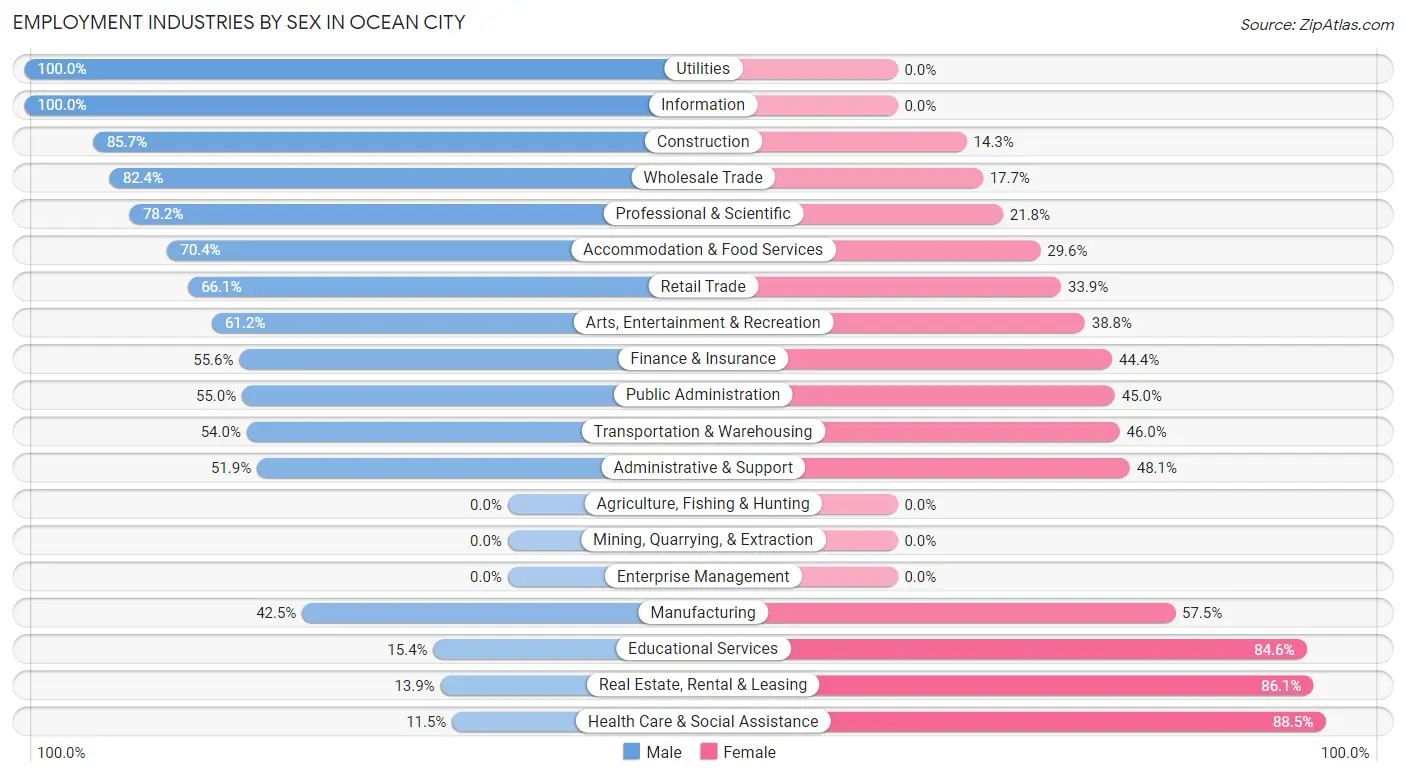
| Industry | Male | Female |
| Agriculture, Fishing & Hunting | 0 (0.0%) | 0 (0.0%) |
| Mining, Quarrying, & Extraction | 0 (0.0%) | 0 (0.0%) |
| Construction | 401 (85.7%) | 67 (14.3%) |
| Manufacturing | 97 (42.5%) | 131 (57.5%) |
| Wholesale Trade | 56 (82.4%) | 12 (17.6%) |
| Retail Trade | 203 (66.1%) | 104 (33.9%) |
| Transportation & Warehousing | 47 (54.0%) | 40 (46.0%) |
| Utilities | 9 (100.0%) | 0 (0.0%) |
| Information | 15 (100.0%) | 0 (0.0%) |
| Finance & Insurance | 90 (55.6%) | 72 (44.4%) |
| Real Estate, Rental & Leasing | 17 (13.9%) | 105 (86.1%) |
| Professional & Scientific | 301 (78.2%) | 84 (21.8%) |
| Enterprise Management | 0 (0.0%) | 0 (0.0%) |
| Administrative & Support | 41 (51.9%) | 38 (48.1%) |
| Educational Services | 16 (15.4%) | 88 (84.6%) |
| Health Care & Social Assistance | 40 (11.5%) | 308 (88.5%) |
| Arts, Entertainment & Recreation | 71 (61.2%) | 45 (38.8%) |
| Accommodation & Food Services | 212 (70.4%) | 89 (29.6%) |
| Public Administration | 77 (55.0%) | 63 (45.0%) |
| Total | 1,788 (58.2%) | 1,284 (41.8%) |
Education in Ocean City
School Enrollment in Ocean City
The most common levels of schooling among the 1,389 students in Ocean City are college / undergraduate (420 | 30.2%), high school (264 | 19.0%), and elementary school (249 | 17.9%).
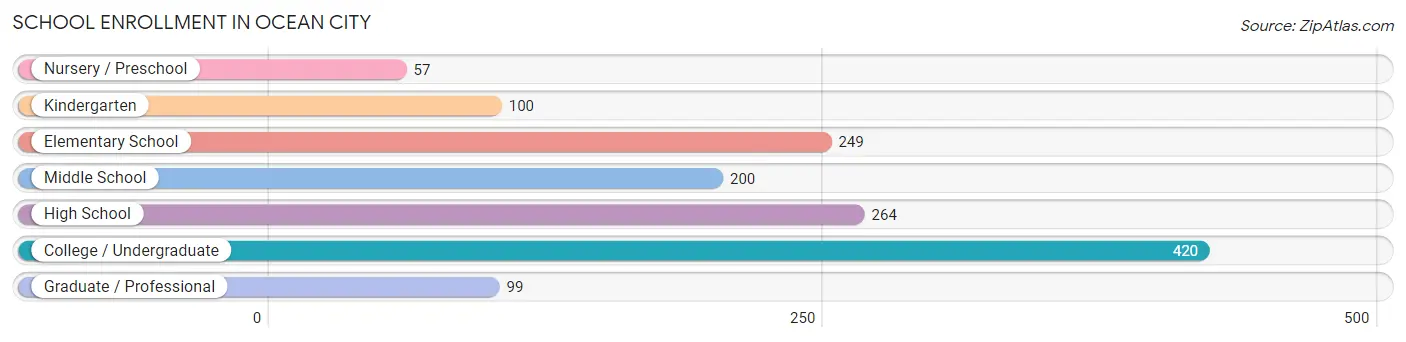
| School Level | # Students | % Students |
| Nursery / Preschool | 57 | 4.1% |
| Kindergarten | 100 | 7.2% |
| Elementary School | 249 | 17.9% |
| Middle School | 200 | 14.4% |
| High School | 264 | 19.0% |
| College / Undergraduate | 420 | 30.2% |
| Graduate / Professional | 99 | 7.1% |
| Total | 1,389 | 100.0% |
School Enrollment by Age by Funding Source in Ocean City
Out of a total of 1,389 students who are enrolled in schools in Ocean City, 131 (9.4%) attend a private institution, while the remaining 1,258 (90.6%) are enrolled in public schools. The age group of 3 to 4 year olds has the highest likelihood of being enrolled in private schools, with 35 (61.4% in the age bracket) enrolled. Conversely, the age group of 18 to 19 year olds has the lowest likelihood of being enrolled in a private school, with 148 (100.0% in the age bracket) attending a public institution.
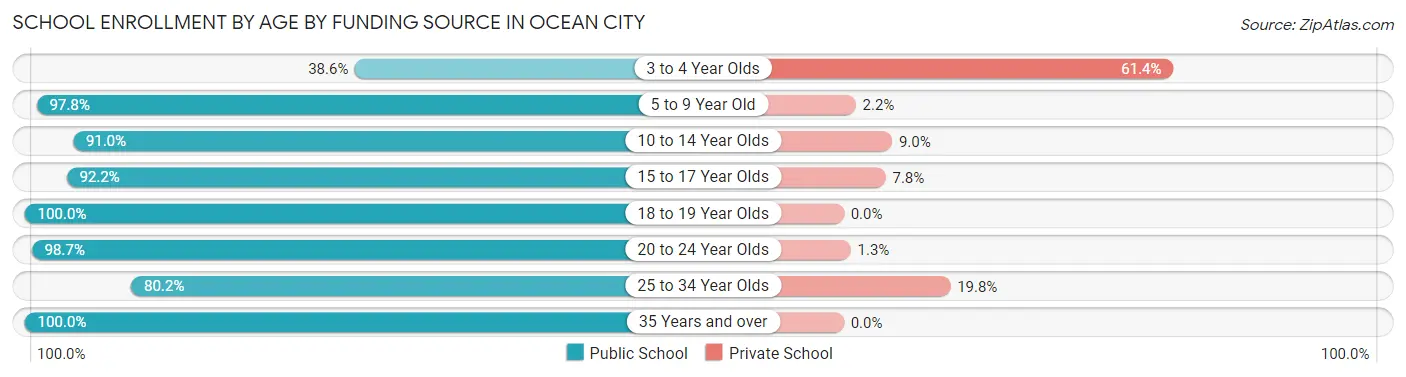
| Age Bracket | Public School | Private School |
| 3 to 4 Year Olds | 22 (38.6%) | 35 (61.4%) |
| 5 to 9 Year Old | 308 (97.8%) | 7 (2.2%) |
| 10 to 14 Year Olds | 263 (91.0%) | 26 (9.0%) |
| 15 to 17 Year Olds | 130 (92.2%) | 11 (7.8%) |
| 18 to 19 Year Olds | 148 (100.0%) | 0 (0.0%) |
| 20 to 24 Year Olds | 153 (98.7%) | 2 (1.3%) |
| 25 to 34 Year Olds | 198 (80.2%) | 49 (19.8%) |
| 35 Years and over | 37 (100.0%) | 0 (0.0%) |
| Total | 1,258 (90.6%) | 131 (9.4%) |
Educational Attainment by Field of Study in Ocean City
Business (161 | 13.5%), engineering (129 | 10.8%), visual & performing arts (129 | 10.8%), social sciences (119 | 9.9%), and education (108 | 9.0%) are the most common fields of study among 1,197 individuals in Ocean City who have obtained a bachelor's degree or higher.
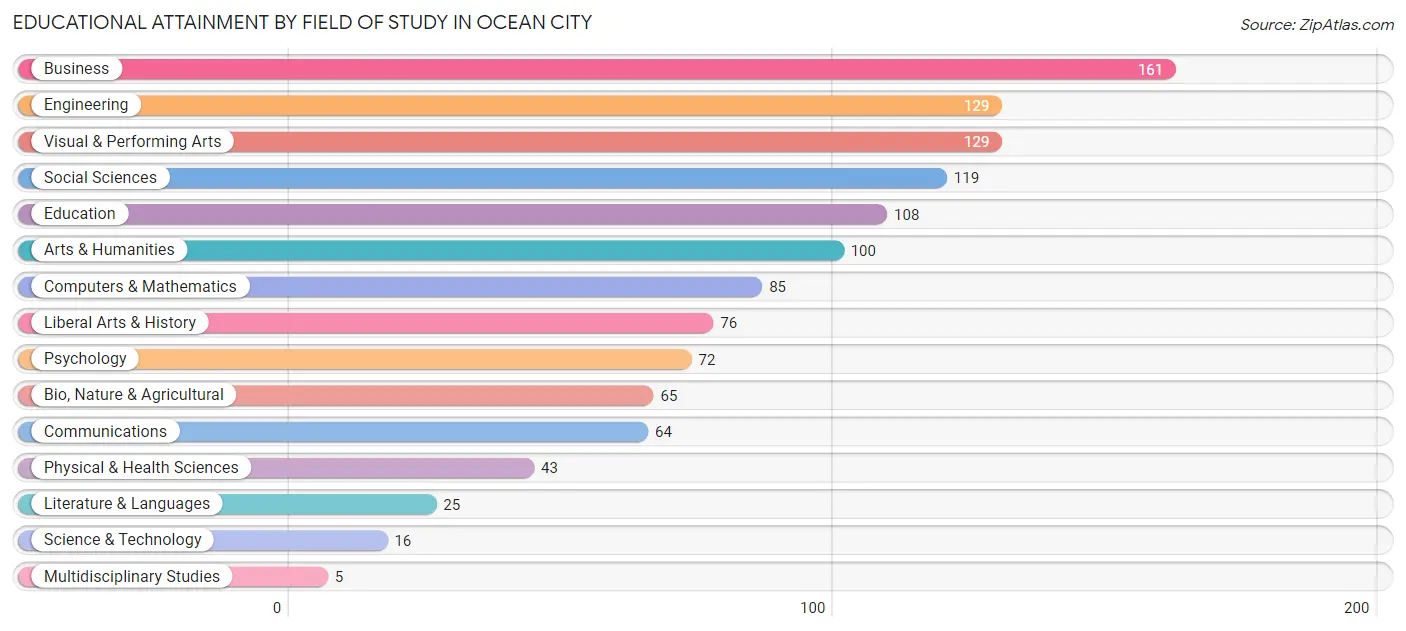
| Field of Study | # Graduates | % Graduates |
| Computers & Mathematics | 85 | 7.1% |
| Bio, Nature & Agricultural | 65 | 5.4% |
| Physical & Health Sciences | 43 | 3.6% |
| Psychology | 72 | 6.0% |
| Social Sciences | 119 | 9.9% |
| Engineering | 129 | 10.8% |
| Multidisciplinary Studies | 5 | 0.4% |
| Science & Technology | 16 | 1.3% |
| Business | 161 | 13.5% |
| Education | 108 | 9.0% |
| Literature & Languages | 25 | 2.1% |
| Liberal Arts & History | 76 | 6.4% |
| Visual & Performing Arts | 129 | 10.8% |
| Communications | 64 | 5.3% |
| Arts & Humanities | 100 | 8.4% |
| Total | 1,197 | 100.0% |
Transportation & Commute in Ocean City
Vehicle Availability by Sex in Ocean City
The most prevalent vehicle ownership categories in Ocean City are males with 2 vehicles (919, accounting for 44.6%) and females with 2 vehicles (759, making up 67.7%).
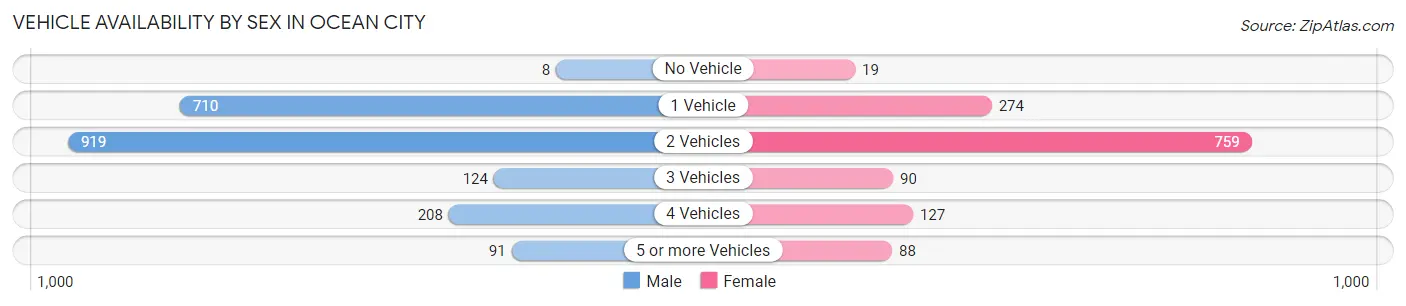
| Vehicles Available | Male | Female |
| No Vehicle | 8 (0.4%) | 19 (1.4%) |
| 1 Vehicle | 710 (34.5%) | 274 (20.2%) |
| 2 Vehicles | 919 (44.6%) | 759 (55.9%) |
| 3 Vehicles | 124 (6.0%) | 90 (6.6%) |
| 4 Vehicles | 208 (10.1%) | 127 (9.4%) |
| 5 or more Vehicles | 91 (4.4%) | 88 (6.5%) |
| Total | 2,060 (100.0%) | 1,357 (100.0%) |
Commute Time in Ocean City
The most frequently occuring commute durations in Ocean City are 15 to 19 minutes (789 commuters, 23.8%), 20 to 24 minutes (626 commuters, 18.9%), and 10 to 14 minutes (526 commuters, 15.9%).
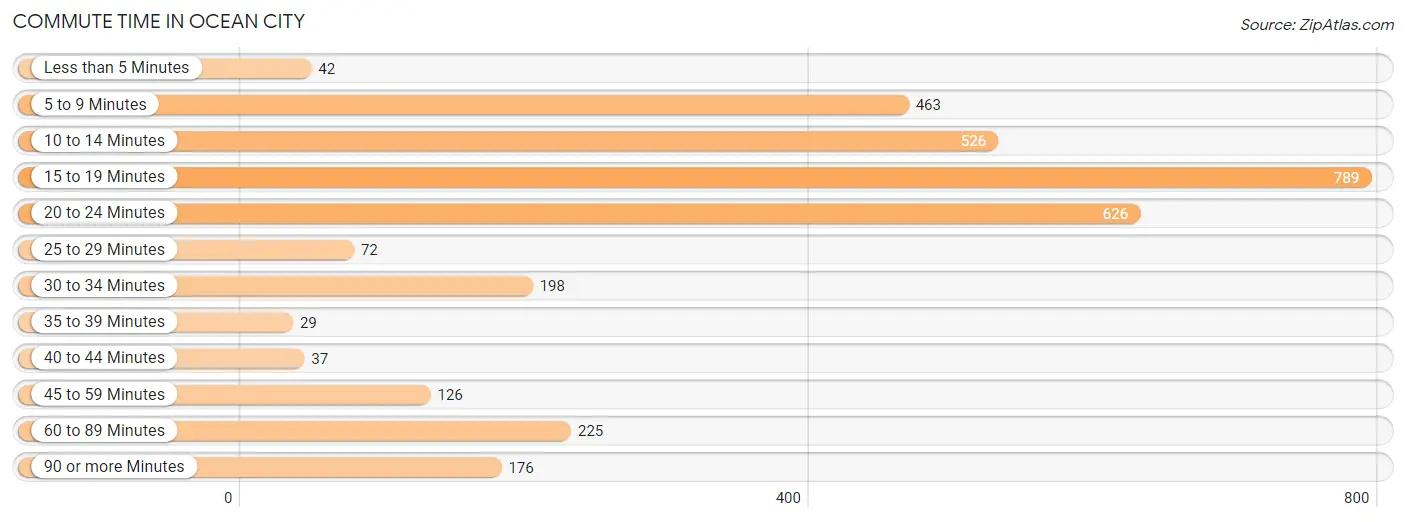
| Commute Time | # Commuters | % Commuters |
| Less than 5 Minutes | 42 | 1.3% |
| 5 to 9 Minutes | 463 | 14.0% |
| 10 to 14 Minutes | 526 | 15.9% |
| 15 to 19 Minutes | 789 | 23.8% |
| 20 to 24 Minutes | 626 | 18.9% |
| 25 to 29 Minutes | 72 | 2.2% |
| 30 to 34 Minutes | 198 | 6.0% |
| 35 to 39 Minutes | 29 | 0.9% |
| 40 to 44 Minutes | 37 | 1.1% |
| 45 to 59 Minutes | 126 | 3.8% |
| 60 to 89 Minutes | 225 | 6.8% |
| 90 or more Minutes | 176 | 5.3% |
Commute Time by Sex in Ocean City
The most common commute times in Ocean City are 20 to 24 minutes (490 commuters, 24.1%) for males and 15 to 19 minutes (363 commuters, 28.5%) for females.
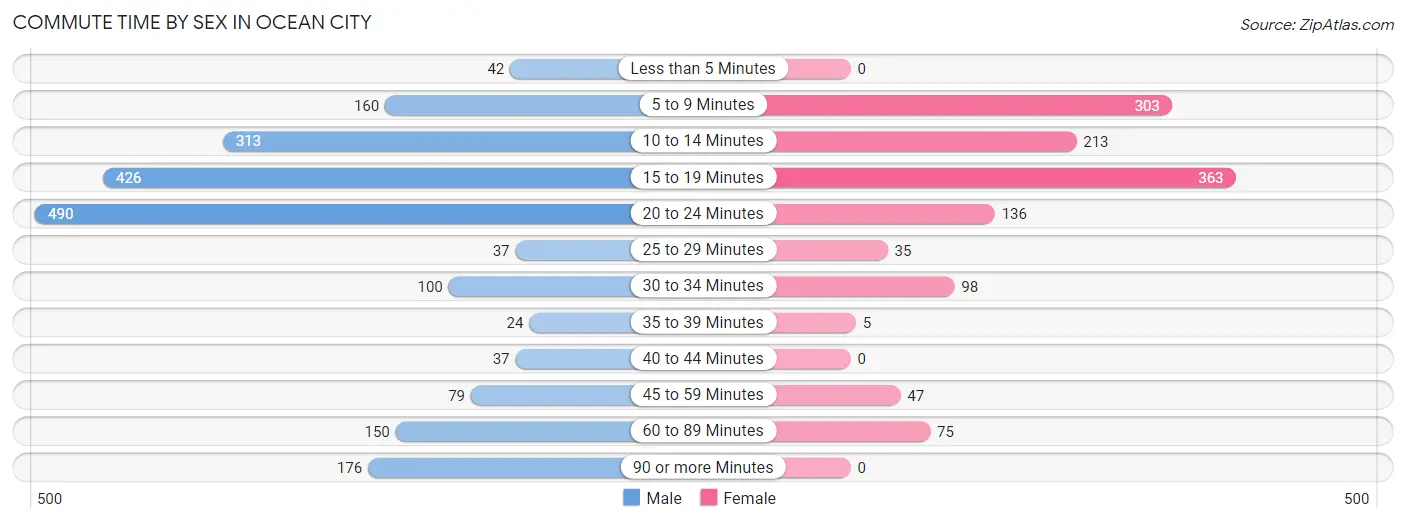
| Commute Time | Male | Female |
| Less than 5 Minutes | 42 (2.1%) | 0 (0.0%) |
| 5 to 9 Minutes | 160 (7.9%) | 303 (23.8%) |
| 10 to 14 Minutes | 313 (15.4%) | 213 (16.7%) |
| 15 to 19 Minutes | 426 (20.9%) | 363 (28.5%) |
| 20 to 24 Minutes | 490 (24.1%) | 136 (10.7%) |
| 25 to 29 Minutes | 37 (1.8%) | 35 (2.8%) |
| 30 to 34 Minutes | 100 (4.9%) | 98 (7.7%) |
| 35 to 39 Minutes | 24 (1.2%) | 5 (0.4%) |
| 40 to 44 Minutes | 37 (1.8%) | 0 (0.0%) |
| 45 to 59 Minutes | 79 (3.9%) | 47 (3.7%) |
| 60 to 89 Minutes | 150 (7.4%) | 75 (5.9%) |
| 90 or more Minutes | 176 (8.6%) | 0 (0.0%) |
Time of Departure to Work by Sex in Ocean City
The most frequent times of departure to work in Ocean City are 6:00 AM to 6:29 AM (349, 17.2%) for males and 7:00 AM to 7:29 AM (346, 27.1%) for females.
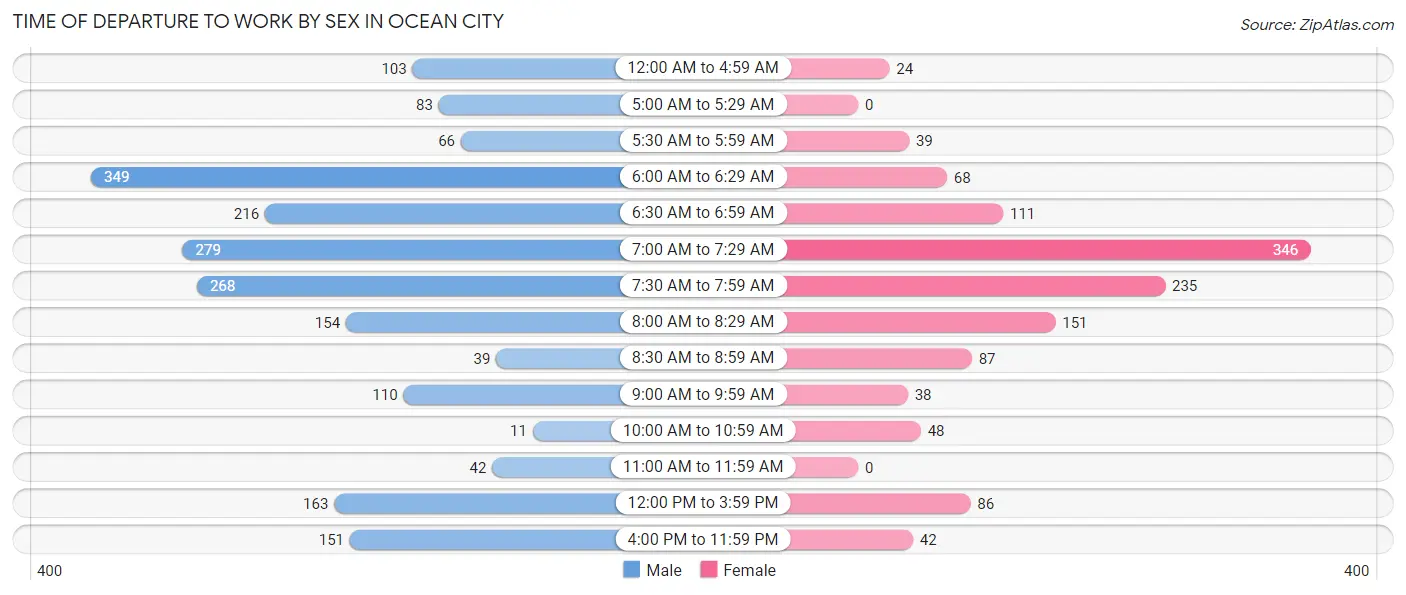
| Time of Departure | Male | Female |
| 12:00 AM to 4:59 AM | 103 (5.1%) | 24 (1.9%) |
| 5:00 AM to 5:29 AM | 83 (4.1%) | 0 (0.0%) |
| 5:30 AM to 5:59 AM | 66 (3.2%) | 39 (3.1%) |
| 6:00 AM to 6:29 AM | 349 (17.2%) | 68 (5.3%) |
| 6:30 AM to 6:59 AM | 216 (10.6%) | 111 (8.7%) |
| 7:00 AM to 7:29 AM | 279 (13.7%) | 346 (27.1%) |
| 7:30 AM to 7:59 AM | 268 (13.2%) | 235 (18.4%) |
| 8:00 AM to 8:29 AM | 154 (7.6%) | 151 (11.8%) |
| 8:30 AM to 8:59 AM | 39 (1.9%) | 87 (6.8%) |
| 9:00 AM to 9:59 AM | 110 (5.4%) | 38 (3.0%) |
| 10:00 AM to 10:59 AM | 11 (0.5%) | 48 (3.8%) |
| 11:00 AM to 11:59 AM | 42 (2.1%) | 0 (0.0%) |
| 12:00 PM to 3:59 PM | 163 (8.0%) | 86 (6.8%) |
| 4:00 PM to 11:59 PM | 151 (7.4%) | 42 (3.3%) |
| Total | 2,034 (100.0%) | 1,275 (100.0%) |
Housing Occupancy in Ocean City
Occupancy by Ownership in Ocean City
Of the total 2,691 dwellings in Ocean City, owner-occupied units account for 1,509 (56.1%), while renter-occupied units make up 1,182 (43.9%).
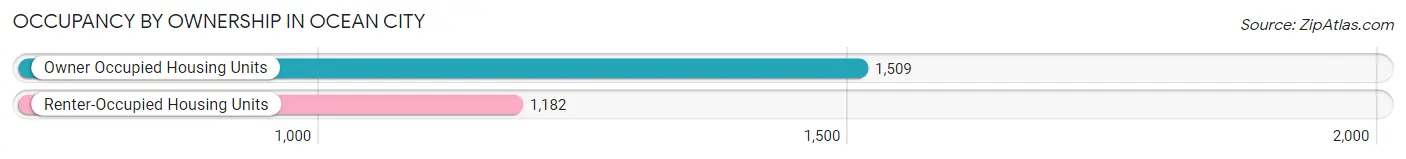
| Occupancy | # Housing Units | % Housing Units |
| Owner Occupied Housing Units | 1,509 | 56.1% |
| Renter-Occupied Housing Units | 1,182 | 43.9% |
| Total Occupied Housing Units | 2,691 | 100.0% |
Occupancy by Household Size in Ocean City
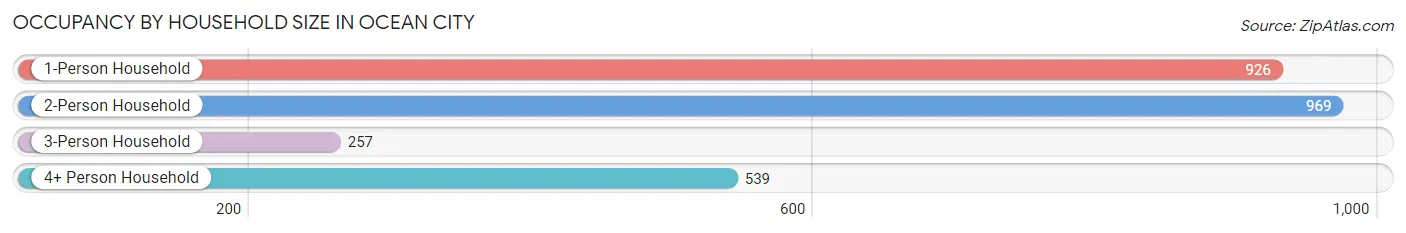
| Household Size | # Housing Units | % Housing Units |
| 1-Person Household | 926 | 34.4% |
| 2-Person Household | 969 | 36.0% |
| 3-Person Household | 257 | 9.6% |
| 4+ Person Household | 539 | 20.0% |
| Total Housing Units | 2,691 | 100.0% |
Occupancy by Ownership by Household Size in Ocean City
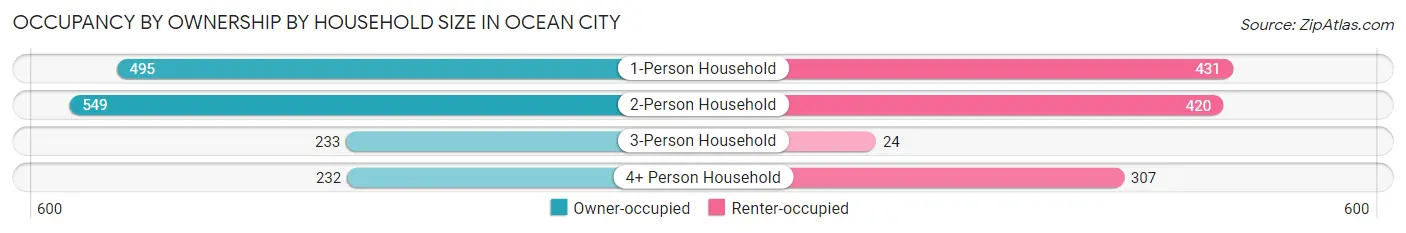
| Household Size | Owner-occupied | Renter-occupied |
| 1-Person Household | 495 (53.5%) | 431 (46.5%) |
| 2-Person Household | 549 (56.7%) | 420 (43.3%) |
| 3-Person Household | 233 (90.7%) | 24 (9.3%) |
| 4+ Person Household | 232 (43.0%) | 307 (57.0%) |
| Total Housing Units | 1,509 (56.1%) | 1,182 (43.9%) |
Occupancy by Educational Attainment in Ocean City
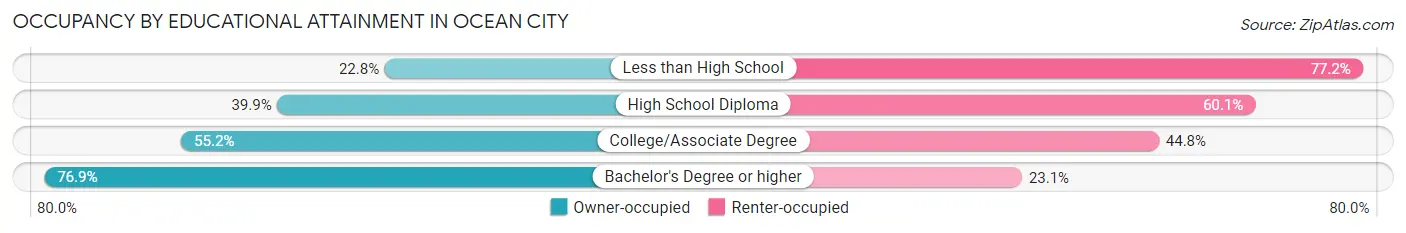
| Household Size | Owner-occupied | Renter-occupied |
| Less than High School | 45 (22.8%) | 152 (77.2%) |
| High School Diploma | 221 (39.9%) | 333 (60.1%) |
| College/Associate Degree | 631 (55.2%) | 513 (44.8%) |
| Bachelor's Degree or higher | 612 (76.9%) | 184 (23.1%) |
Occupancy by Age of Householder in Ocean City
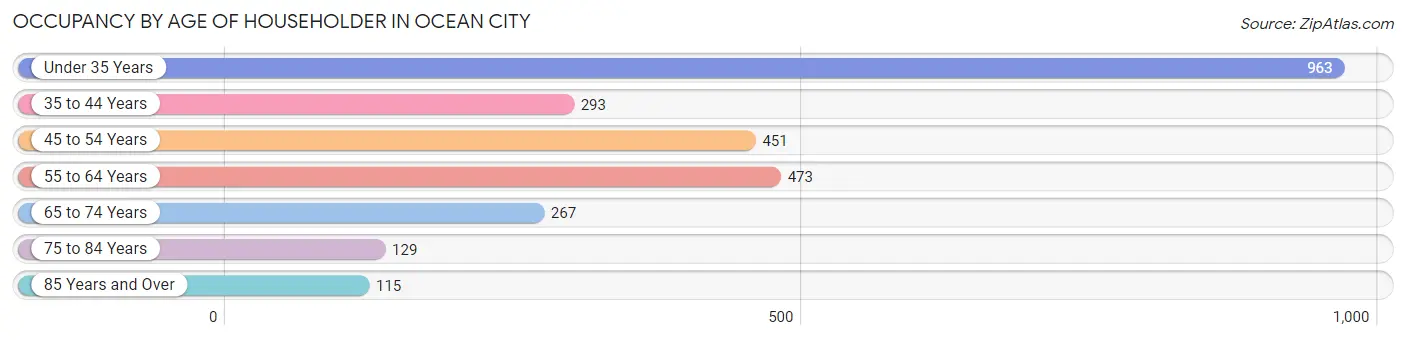
| Age Bracket | # Households | % Households |
| Under 35 Years | 963 | 35.8% |
| 35 to 44 Years | 293 | 10.9% |
| 45 to 54 Years | 451 | 16.8% |
| 55 to 64 Years | 473 | 17.6% |
| 65 to 74 Years | 267 | 9.9% |
| 75 to 84 Years | 129 | 4.8% |
| 85 Years and Over | 115 | 4.3% |
| Total | 2,691 | 100.0% |
Housing Finances in Ocean City
Median Income by Occupancy in Ocean City
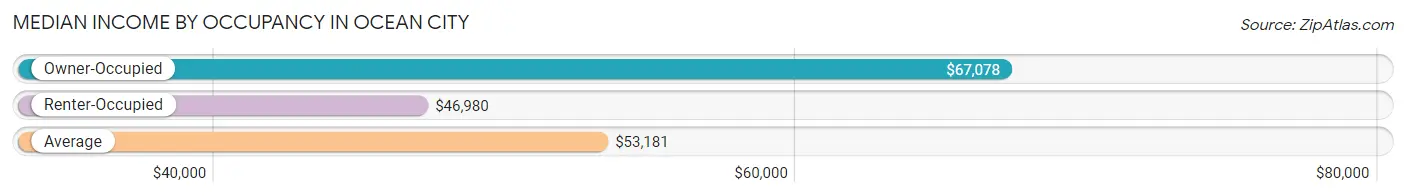
| Occupancy Type | # Households | Median Income |
| Owner-Occupied | 1,509 (56.1%) | $67,078 |
| Renter-Occupied | 1,182 (43.9%) | $46,980 |
| Average | 2,691 (100.0%) | $53,181 |
Occupancy by Householder Income Bracket in Ocean City
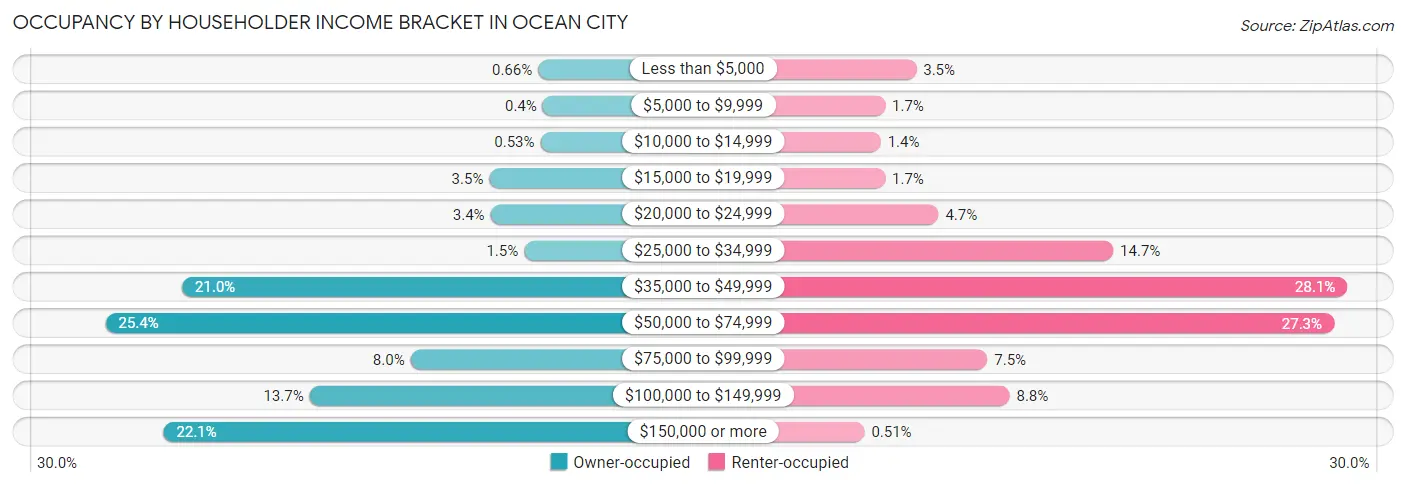
| Income Bracket | Owner-occupied | Renter-occupied |
| Less than $5,000 | 10 (0.7%) | 41 (3.5%) |
| $5,000 to $9,999 | 6 (0.4%) | 20 (1.7%) |
| $10,000 to $14,999 | 8 (0.5%) | 17 (1.4%) |
| $15,000 to $19,999 | 52 (3.5%) | 20 (1.7%) |
| $20,000 to $24,999 | 51 (3.4%) | 56 (4.7%) |
| $25,000 to $34,999 | 22 (1.5%) | 174 (14.7%) |
| $35,000 to $49,999 | 317 (21.0%) | 332 (28.1%) |
| $50,000 to $74,999 | 383 (25.4%) | 323 (27.3%) |
| $75,000 to $99,999 | 120 (8.0%) | 89 (7.5%) |
| $100,000 to $149,999 | 207 (13.7%) | 104 (8.8%) |
| $150,000 or more | 333 (22.1%) | 6 (0.5%) |
| Total | 1,509 (100.0%) | 1,182 (100.0%) |
Monthly Housing Cost Tiers in Ocean City
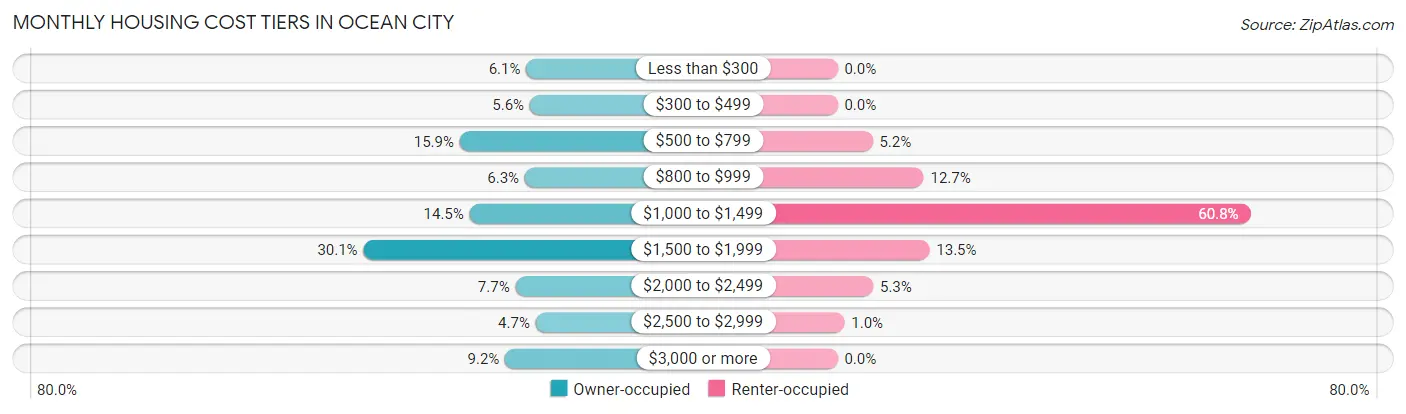
| Monthly Cost | Owner-occupied | Renter-occupied |
| Less than $300 | 92 (6.1%) | 0 (0.0%) |
| $300 to $499 | 84 (5.6%) | 0 (0.0%) |
| $500 to $799 | 240 (15.9%) | 61 (5.2%) |
| $800 to $999 | 95 (6.3%) | 150 (12.7%) |
| $1,000 to $1,499 | 218 (14.4%) | 719 (60.8%) |
| $1,500 to $1,999 | 454 (30.1%) | 160 (13.5%) |
| $2,000 to $2,499 | 116 (7.7%) | 62 (5.2%) |
| $2,500 to $2,999 | 71 (4.7%) | 12 (1.0%) |
| $3,000 or more | 139 (9.2%) | 0 (0.0%) |
| Total | 1,509 (100.0%) | 1,182 (100.0%) |
Physical Housing Characteristics in Ocean City
Housing Structures in Ocean City
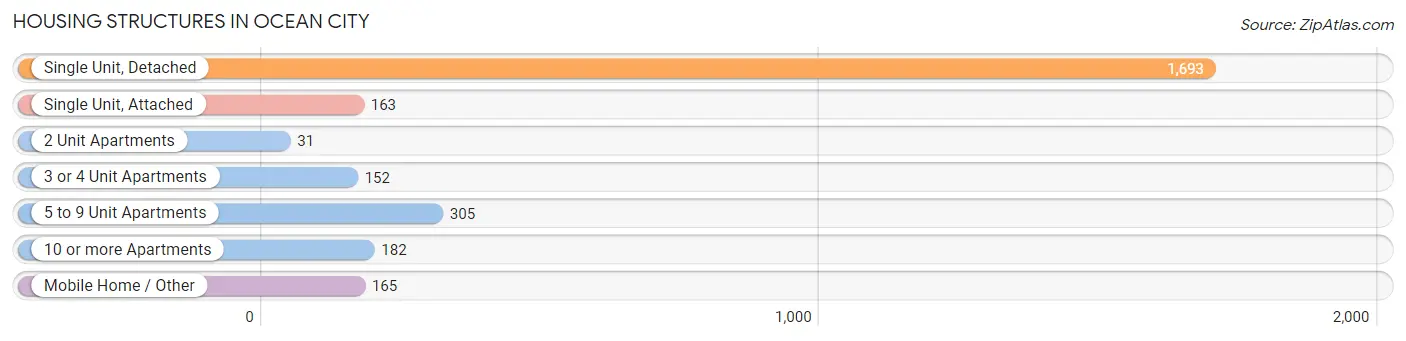
| Structure Type | # Housing Units | % Housing Units |
| Single Unit, Detached | 1,693 | 62.9% |
| Single Unit, Attached | 163 | 6.1% |
| 2 Unit Apartments | 31 | 1.1% |
| 3 or 4 Unit Apartments | 152 | 5.7% |
| 5 to 9 Unit Apartments | 305 | 11.3% |
| 10 or more Apartments | 182 | 6.8% |
| Mobile Home / Other | 165 | 6.1% |
| Total | 2,691 | 100.0% |
Housing Structures by Occupancy in Ocean City
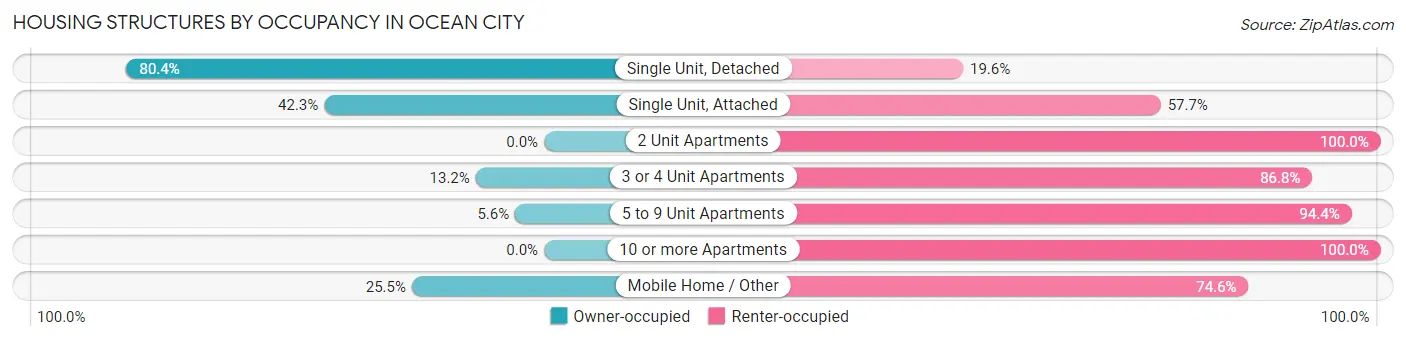
| Structure Type | Owner-occupied | Renter-occupied |
| Single Unit, Detached | 1,361 (80.4%) | 332 (19.6%) |
| Single Unit, Attached | 69 (42.3%) | 94 (57.7%) |
| 2 Unit Apartments | 0 (0.0%) | 31 (100.0%) |
| 3 or 4 Unit Apartments | 20 (13.2%) | 132 (86.8%) |
| 5 to 9 Unit Apartments | 17 (5.6%) | 288 (94.4%) |
| 10 or more Apartments | 0 (0.0%) | 182 (100.0%) |
| Mobile Home / Other | 42 (25.5%) | 123 (74.6%) |
| Total | 1,509 (56.1%) | 1,182 (43.9%) |
Housing Structures by Number of Rooms in Ocean City
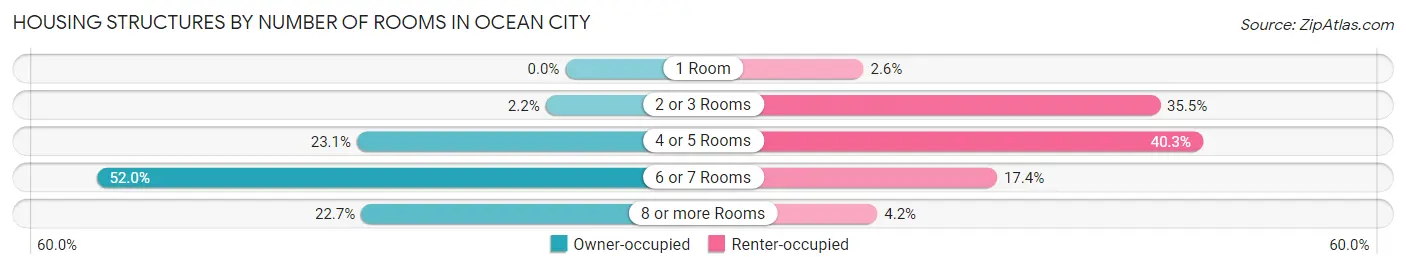
| Number of Rooms | Owner-occupied | Renter-occupied |
| 1 Room | 0 (0.0%) | 31 (2.6%) |
| 2 or 3 Rooms | 33 (2.2%) | 420 (35.5%) |
| 4 or 5 Rooms | 349 (23.1%) | 476 (40.3%) |
| 6 or 7 Rooms | 785 (52.0%) | 206 (17.4%) |
| 8 or more Rooms | 342 (22.7%) | 49 (4.2%) |
| Total | 1,509 (100.0%) | 1,182 (100.0%) |
Housing Structure by Heating Type in Ocean City
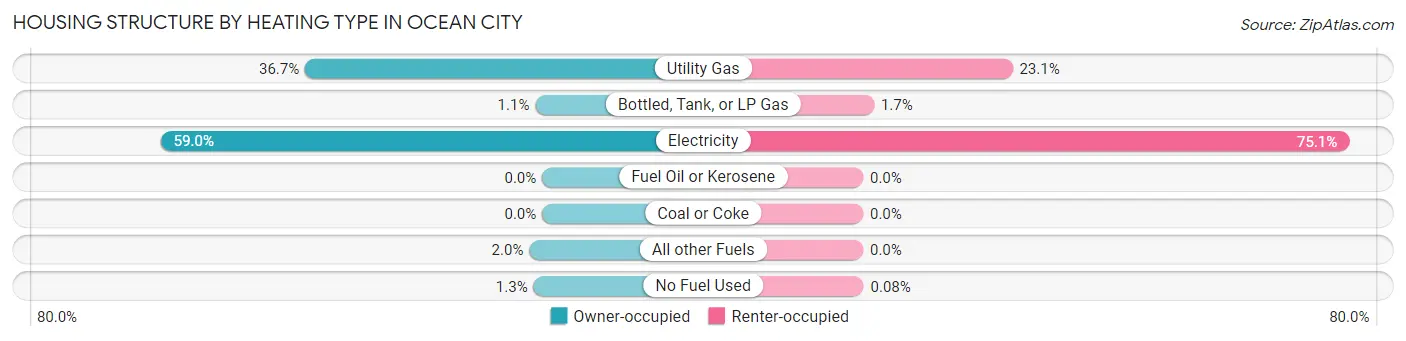
| Heating Type | Owner-occupied | Renter-occupied |
| Utility Gas | 553 (36.6%) | 273 (23.1%) |
| Bottled, Tank, or LP Gas | 16 (1.1%) | 20 (1.7%) |
| Electricity | 890 (59.0%) | 888 (75.1%) |
| Fuel Oil or Kerosene | 0 (0.0%) | 0 (0.0%) |
| Coal or Coke | 0 (0.0%) | 0 (0.0%) |
| All other Fuels | 30 (2.0%) | 0 (0.0%) |
| No Fuel Used | 20 (1.3%) | 1 (0.1%) |
| Total | 1,509 (100.0%) | 1,182 (100.0%) |
Household Vehicle Usage in Ocean City
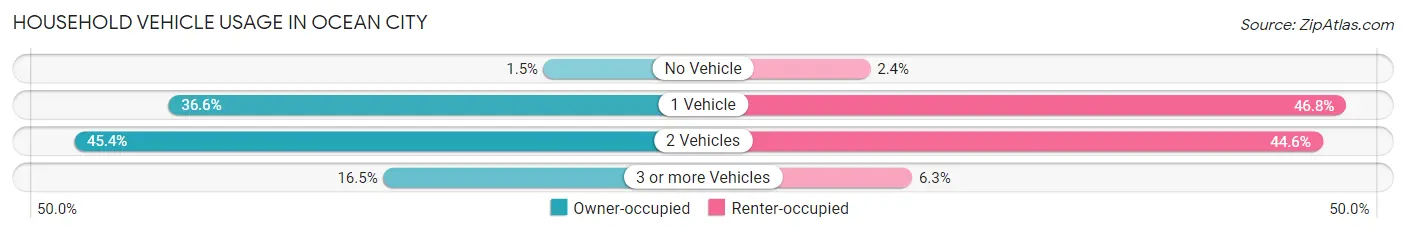
| Vehicles per Household | Owner-occupied | Renter-occupied |
| No Vehicle | 23 (1.5%) | 28 (2.4%) |
| 1 Vehicle | 552 (36.6%) | 553 (46.8%) |
| 2 Vehicles | 685 (45.4%) | 527 (44.6%) |
| 3 or more Vehicles | 249 (16.5%) | 74 (6.3%) |
| Total | 1,509 (100.0%) | 1,182 (100.0%) |
Real Estate & Mortgages in Ocean City
Real Estate and Mortgage Overview in Ocean City
| Characteristic | Without Mortgage | With Mortgage |
| Housing Units | 480 | 1,029 |
| Median Property Value | $277,000 | $287,400 |
| Median Household Income | $58,333 | $240 |
| Monthly Housing Costs | $613 | $139 |
| Real Estate Taxes | $2,005 | $67 |
Property Value by Mortgage Status in Ocean City
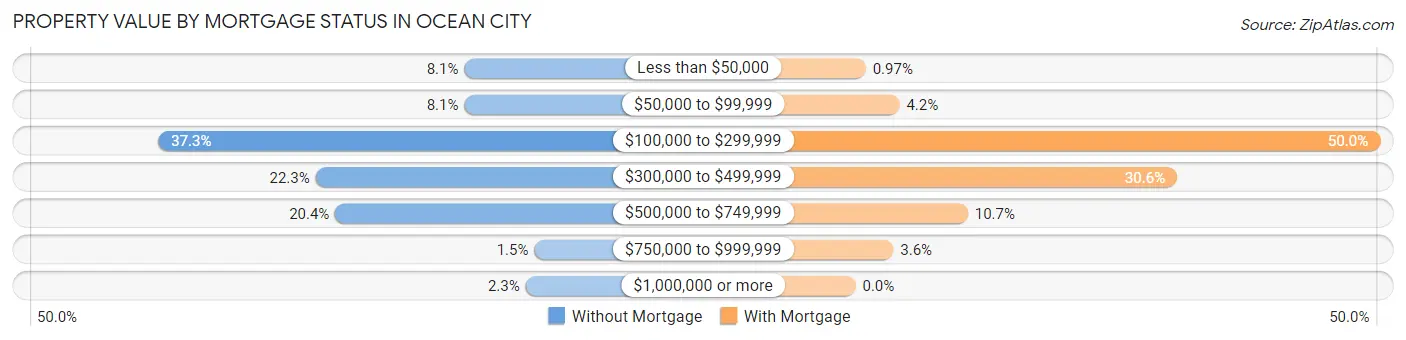
| Property Value | Without Mortgage | With Mortgage |
| Less than $50,000 | 39 (8.1%) | 10 (1.0%) |
| $50,000 to $99,999 | 39 (8.1%) | 43 (4.2%) |
| $100,000 to $299,999 | 179 (37.3%) | 514 (49.9%) |
| $300,000 to $499,999 | 107 (22.3%) | 315 (30.6%) |
| $500,000 to $749,999 | 98 (20.4%) | 110 (10.7%) |
| $750,000 to $999,999 | 7 (1.5%) | 37 (3.6%) |
| $1,000,000 or more | 11 (2.3%) | 0 (0.0%) |
| Total | 480 (100.0%) | 1,029 (100.0%) |
Household Income by Mortgage Status in Ocean City
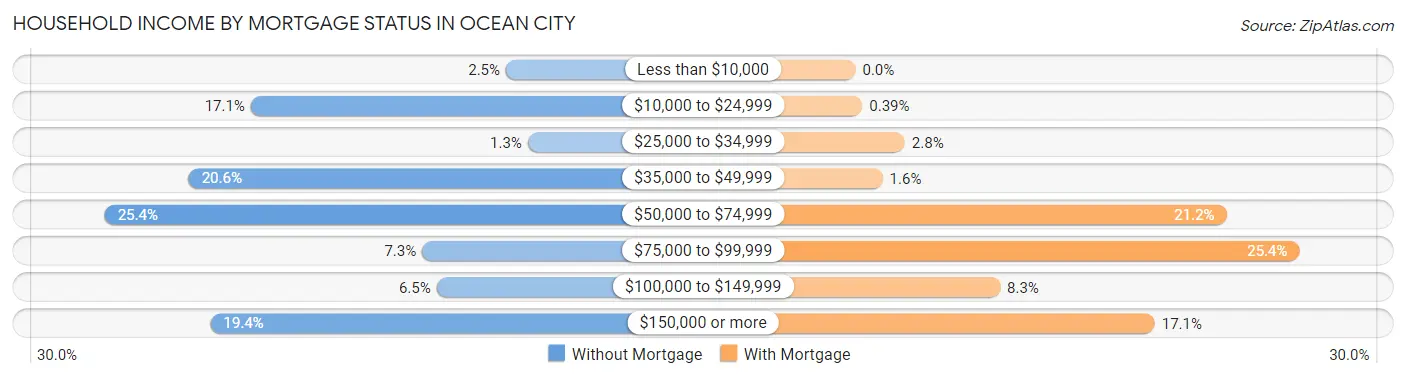
| Household Income | Without Mortgage | With Mortgage |
| Less than $10,000 | 12 (2.5%) | 0 (0.0%) |
| $10,000 to $24,999 | 82 (17.1%) | 4 (0.4%) |
| $25,000 to $34,999 | 6 (1.3%) | 29 (2.8%) |
| $35,000 to $49,999 | 99 (20.6%) | 16 (1.5%) |
| $50,000 to $74,999 | 122 (25.4%) | 218 (21.2%) |
| $75,000 to $99,999 | 35 (7.3%) | 261 (25.4%) |
| $100,000 to $149,999 | 31 (6.5%) | 85 (8.3%) |
| $150,000 or more | 93 (19.4%) | 176 (17.1%) |
| Total | 480 (100.0%) | 1,029 (100.0%) |
Property Value to Household Income Ratio in Ocean City
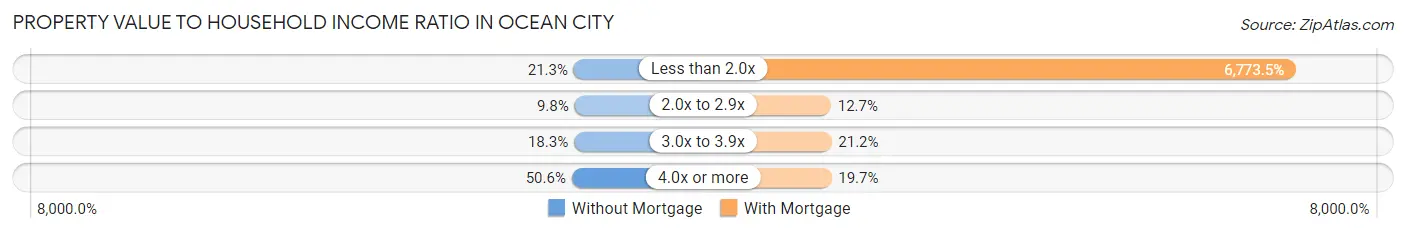
| Value-to-Income Ratio | Without Mortgage | With Mortgage |
| Less than 2.0x | 102 (21.2%) | 69,699 (6,773.5%) |
| 2.0x to 2.9x | 47 (9.8%) | 131 (12.7%) |
| 3.0x to 3.9x | 88 (18.3%) | 218 (21.2%) |
| 4.0x or more | 243 (50.6%) | 203 (19.7%) |
| Total | 480 (100.0%) | 1,029 (100.0%) |
Real Estate Taxes by Mortgage Status in Ocean City
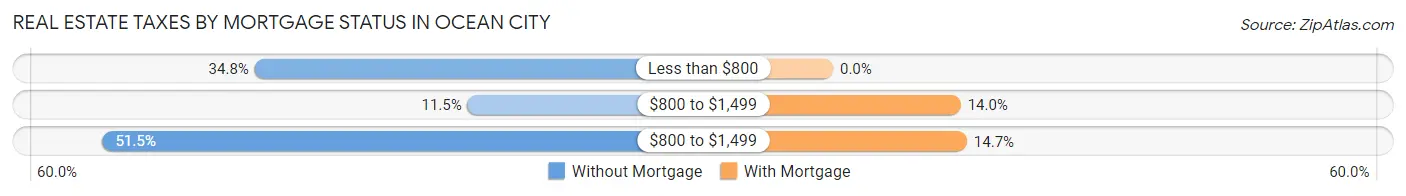
| Property Taxes | Without Mortgage | With Mortgage |
| Less than $800 | 167 (34.8%) | 0 (0.0%) |
| $800 to $1,499 | 55 (11.5%) | 144 (14.0%) |
| $800 to $1,499 | 247 (51.5%) | 151 (14.7%) |
| Total | 480 (100.0%) | 1,029 (100.0%) |
Health & Disability in Ocean City
Health Insurance Coverage by Age in Ocean City
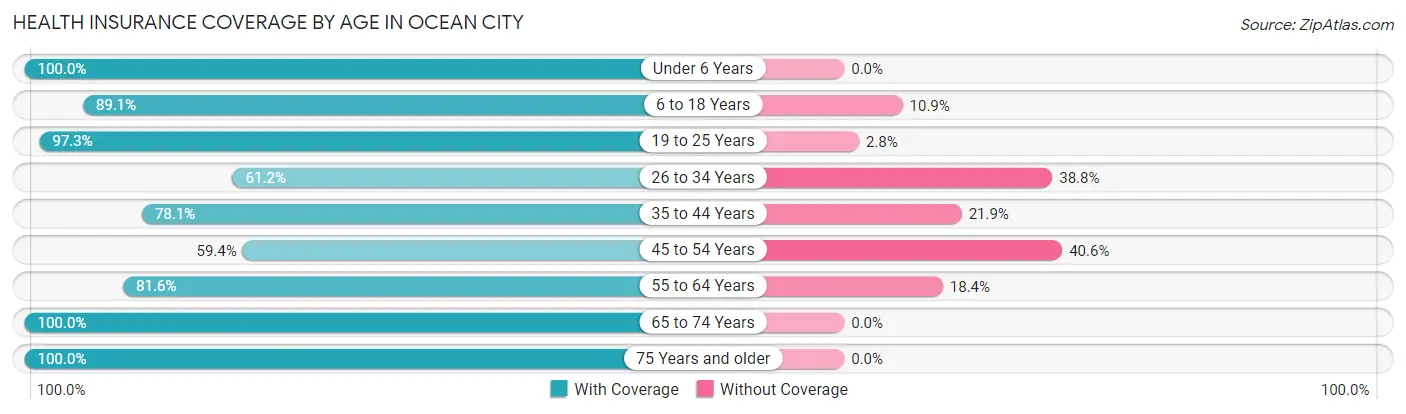
| Age Bracket | With Coverage | Without Coverage |
| Under 6 Years | 449 (100.0%) | 0 (0.0%) |
| 6 to 18 Years | 705 (89.1%) | 86 (10.9%) |
| 19 to 25 Years | 459 (97.3%) | 13 (2.8%) |
| 26 to 34 Years | 680 (61.2%) | 431 (38.8%) |
| 35 to 44 Years | 389 (78.1%) | 109 (21.9%) |
| 45 to 54 Years | 479 (59.4%) | 328 (40.6%) |
| 55 to 64 Years | 675 (81.6%) | 152 (18.4%) |
| 65 to 74 Years | 364 (100.0%) | 0 (0.0%) |
| 75 Years and older | 399 (100.0%) | 0 (0.0%) |
| Total | 4,599 (80.4%) | 1,119 (19.6%) |
Health Insurance Coverage by Citizenship Status in Ocean City
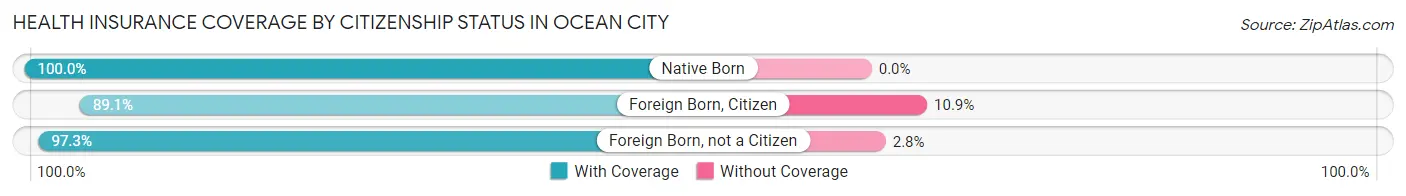
| Citizenship Status | With Coverage | Without Coverage |
| Native Born | 449 (100.0%) | 0 (0.0%) |
| Foreign Born, Citizen | 705 (89.1%) | 86 (10.9%) |
| Foreign Born, not a Citizen | 459 (97.3%) | 13 (2.8%) |
Health Insurance Coverage by Household Income in Ocean City
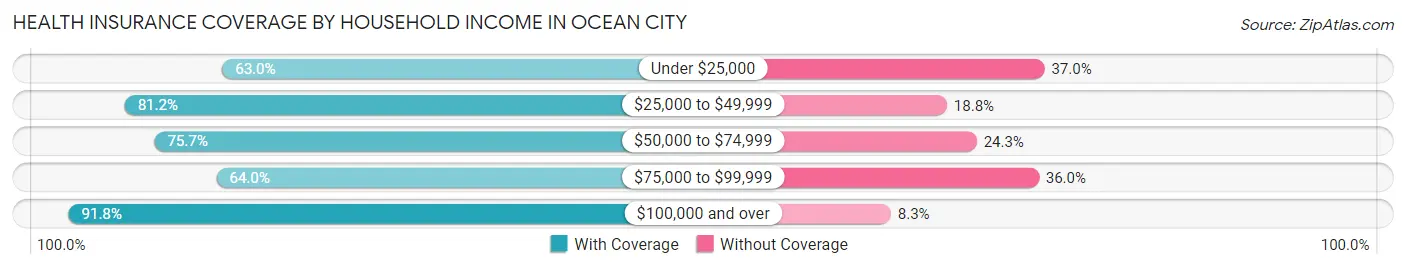
| Household Income | With Coverage | Without Coverage |
| Under $25,000 | 255 (63.0%) | 150 (37.0%) |
| $25,000 to $49,999 | 1,130 (81.2%) | 261 (18.8%) |
| $50,000 to $74,999 | 1,116 (75.7%) | 359 (24.3%) |
| $75,000 to $99,999 | 340 (64.0%) | 191 (36.0%) |
| $100,000 and over | 1,758 (91.7%) | 158 (8.3%) |
Public vs Private Health Insurance Coverage by Age in Ocean City
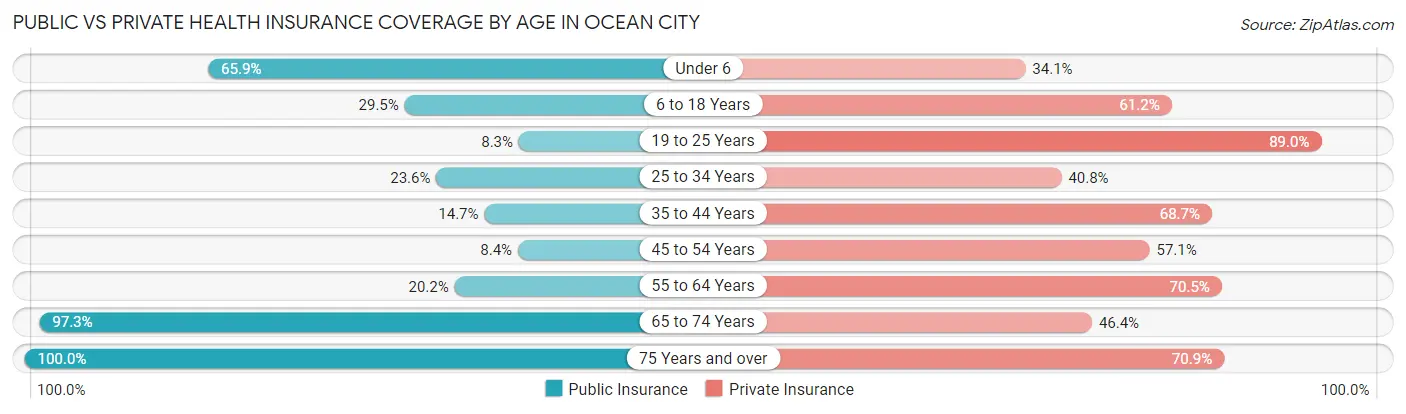
| Age Bracket | Public Insurance | Private Insurance |
| Under 6 | 296 (65.9%) | 153 (34.1%) |
| 6 to 18 Years | 233 (29.5%) | 484 (61.2%) |
| 19 to 25 Years | 39 (8.3%) | 420 (89.0%) |
| 25 to 34 Years | 262 (23.6%) | 453 (40.8%) |
| 35 to 44 Years | 73 (14.7%) | 342 (68.7%) |
| 45 to 54 Years | 68 (8.4%) | 461 (57.1%) |
| 55 to 64 Years | 167 (20.2%) | 583 (70.5%) |
| 65 to 74 Years | 354 (97.3%) | 169 (46.4%) |
| 75 Years and over | 399 (100.0%) | 283 (70.9%) |
| Total | 1,891 (33.1%) | 3,348 (58.6%) |
Disability Status by Sex by Age in Ocean City
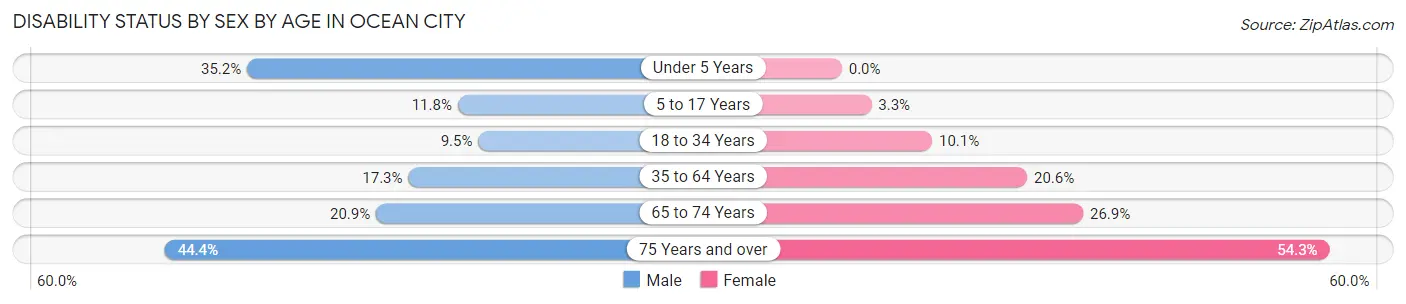
| Age Bracket | Male | Female |
| Under 5 Years | 62 (35.2%) | 0 (0.0%) |
| 5 to 17 Years | 36 (11.8%) | 16 (3.3%) |
| 18 to 34 Years | 72 (9.5%) | 92 (10.1%) |
| 35 to 64 Years | 204 (17.3%) | 196 (20.6%) |
| 65 to 74 Years | 34 (20.9%) | 54 (26.9%) |
| 75 Years and over | 79 (44.4%) | 120 (54.3%) |
Disability Class by Sex by Age in Ocean City
Disability Class: Hearing Difficulty
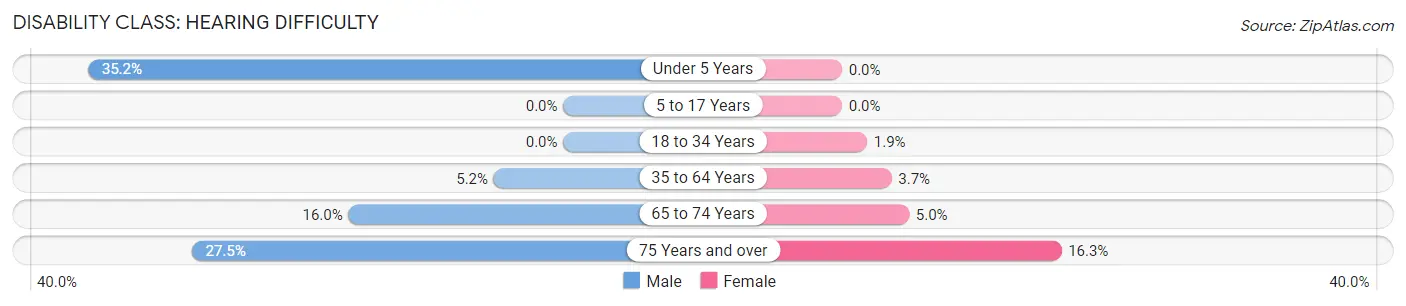
| Age Bracket | Male | Female |
| Under 5 Years | 62 (35.2%) | 0 (0.0%) |
| 5 to 17 Years | 0 (0.0%) | 0 (0.0%) |
| 18 to 34 Years | 0 (0.0%) | 17 (1.9%) |
| 35 to 64 Years | 61 (5.2%) | 35 (3.7%) |
| 65 to 74 Years | 26 (16.0%) | 10 (5.0%) |
| 75 Years and over | 49 (27.5%) | 36 (16.3%) |
Disability Class: Vision Difficulty
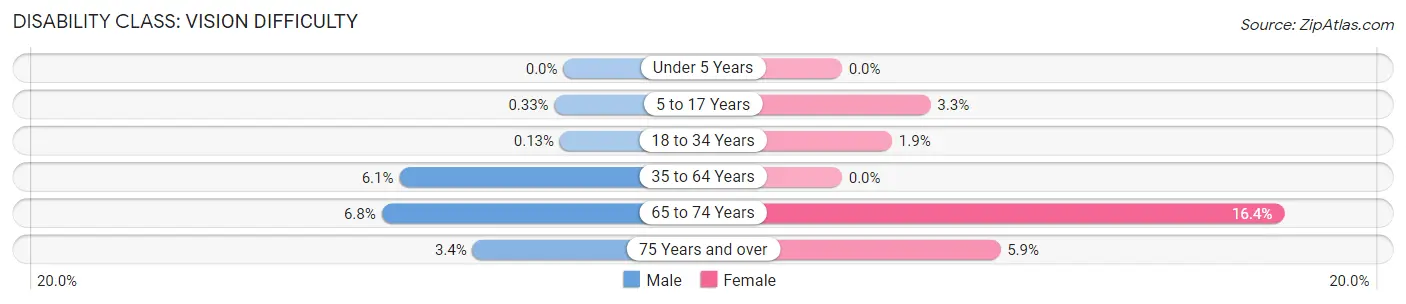
| Age Bracket | Male | Female |
| Under 5 Years | 0 (0.0%) | 0 (0.0%) |
| 5 to 17 Years | 1 (0.3%) | 16 (3.3%) |
| 18 to 34 Years | 1 (0.1%) | 17 (1.9%) |
| 35 to 64 Years | 72 (6.1%) | 0 (0.0%) |
| 65 to 74 Years | 11 (6.8%) | 33 (16.4%) |
| 75 Years and over | 6 (3.4%) | 13 (5.9%) |
Disability Class: Cognitive Difficulty
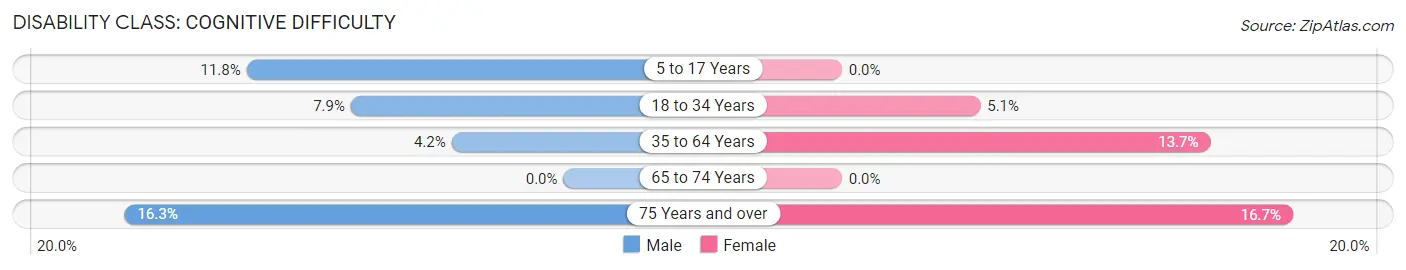
| Age Bracket | Male | Female |
| 5 to 17 Years | 36 (11.8%) | 0 (0.0%) |
| 18 to 34 Years | 60 (7.9%) | 47 (5.1%) |
| 35 to 64 Years | 49 (4.2%) | 130 (13.7%) |
| 65 to 74 Years | 0 (0.0%) | 0 (0.0%) |
| 75 Years and over | 29 (16.3%) | 37 (16.7%) |
Disability Class: Ambulatory Difficulty
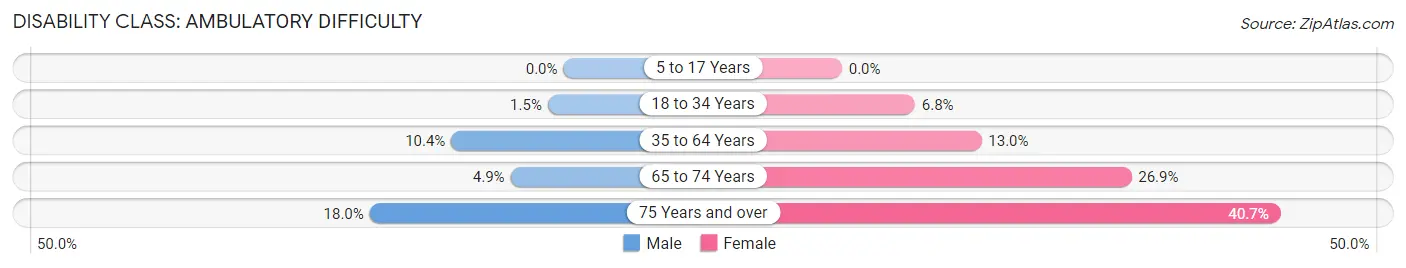
| Age Bracket | Male | Female |
| 5 to 17 Years | 0 (0.0%) | 0 (0.0%) |
| 18 to 34 Years | 11 (1.5%) | 62 (6.8%) |
| 35 to 64 Years | 123 (10.4%) | 123 (13.0%) |
| 65 to 74 Years | 8 (4.9%) | 54 (26.9%) |
| 75 Years and over | 32 (18.0%) | 90 (40.7%) |
Disability Class: Self-Care Difficulty
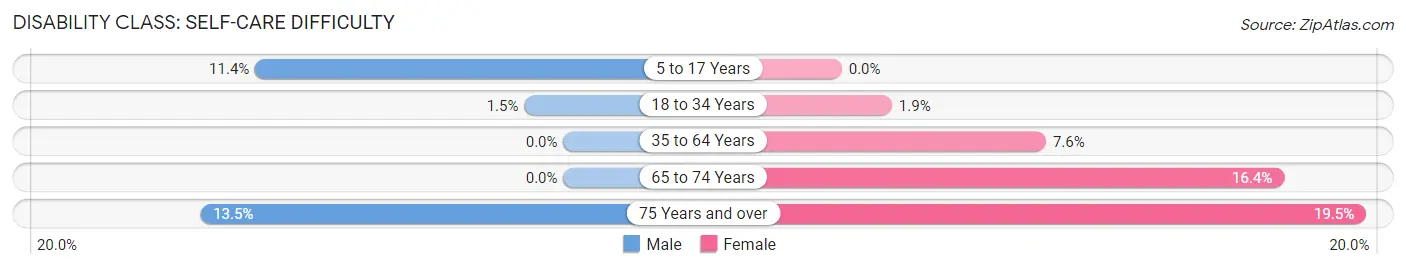
| Age Bracket | Male | Female |
| 5 to 17 Years | 35 (11.4%) | 0 (0.0%) |
| 18 to 34 Years | 11 (1.5%) | 17 (1.9%) |
| 35 to 64 Years | 0 (0.0%) | 72 (7.6%) |
| 65 to 74 Years | 0 (0.0%) | 33 (16.4%) |
| 75 Years and over | 24 (13.5%) | 43 (19.5%) |
Technology Access in Ocean City
Computing Device Access in Ocean City
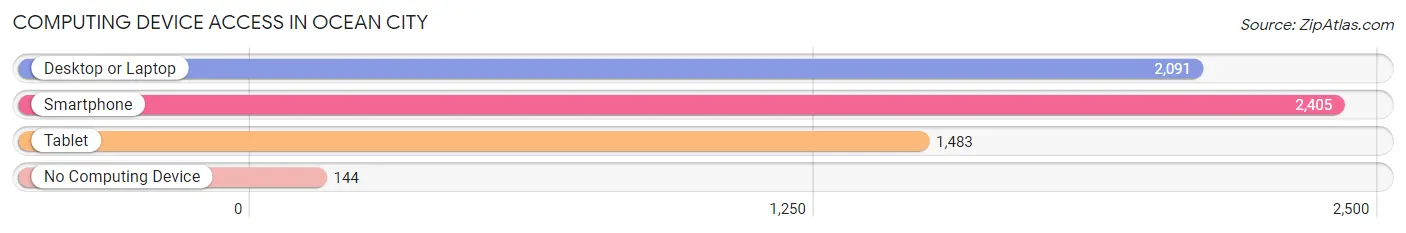
| Device Type | # Households | % Households |
| Desktop or Laptop | 2,091 | 77.7% |
| Smartphone | 2,405 | 89.4% |
| Tablet | 1,483 | 55.1% |
| No Computing Device | 144 | 5.3% |
| Total | 2,691 | 100.0% |
Internet Access in Ocean City
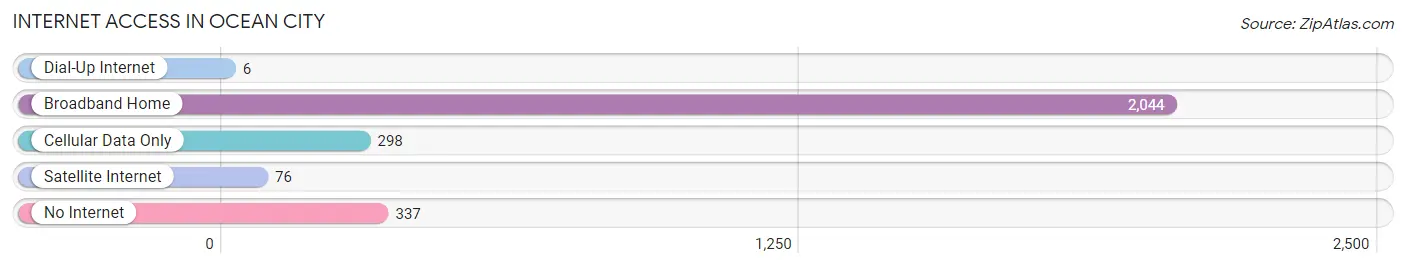
| Internet Type | # Households | % Households |
| Dial-Up Internet | 6 | 0.2% |
| Broadband Home | 2,044 | 76.0% |
| Cellular Data Only | 298 | 11.1% |
| Satellite Internet | 76 | 2.8% |
| No Internet | 337 | 12.5% |
| Total | 2,691 | 100.0% |
Ocean City Summary
Introduction
Ocean City is a small town located in Bay County, Florida, United States. It is situated on the Gulf of Mexico, just south of Panama City Beach. The town has a population of approximately 1,500 people and is a popular tourist destination. The town is known for its white sand beaches, fishing, and other outdoor activities.
History
The area that is now Ocean City was first settled in the late 1800s by a group of fishermen from the nearby town of St. Andrews. The fishermen built a small fishing village on the beach and named it Ocean City. The town grew slowly over the years, and by the early 1900s, it had become a popular tourist destination.
In the 1920s, the town was incorporated and began to grow rapidly. The town was home to several hotels, restaurants, and other businesses. The town also had a boardwalk, which was a popular spot for tourists.
In the 1950s, the town began to decline as tourists began to flock to nearby Panama City Beach. The town was hit hard by Hurricane Eloise in 1975, which caused extensive damage to the town. The town was able to rebuild and by the 1980s, it had become a popular destination once again.
Geography
Ocean City is located in Bay County, Florida, on the Gulf of Mexico. The town is situated on a peninsula, with the Gulf of Mexico to the south and St. Andrews Bay to the north. The town is bordered by the towns of Panama City Beach to the east and Mexico Beach to the west.
The town has a total area of 1.2 square miles, all of which is land. The town is located at an elevation of 10 feet above sea level. The town has a humid subtropical climate, with hot, humid summers and mild winters.
Economy
The economy of Ocean City is largely based on tourism. The town is home to several hotels, restaurants, and other businesses that cater to tourists. The town also has a boardwalk, which is a popular spot for tourists.
The town also has a fishing industry, with several commercial fishing boats operating out of the town. The town also has a small port, which is used for recreational boating.
Demographics
As of the 2010 census, the population of Ocean City was 1,500. The racial makeup of the town was 97.3% White, 0.7% African American, 0.3% Native American, 0.3% Asian, 0.3% from other races, and 1.3% from two or more races. Hispanic or Latino of any race were 1.3% of the population.
The median income for a household in the town was $37,500, and the median income for a family was $45,000. The per capita income for the town was $20,000. About 10.7% of families and 13.3% of the population were below the poverty line, including 17.9% of those under age 18 and 8.3% of those age 65 or over.
Conclusion
Ocean City is a small town located in Bay County, Florida, United States. It is situated on the Gulf of Mexico, just south of Panama City Beach. The town has a population of approximately 1,500 people and is a popular tourist destination. The town is known for its white sand beaches, fishing, and other outdoor activities. The economy of Ocean City is largely based on tourism, with several hotels, restaurants, and other businesses catering to tourists. The town also has a fishing industry and a small port. The population of Ocean City is predominantly White, with a small percentage of African American, Native American, Asian, and other races. The median income for a household in the town is $37,500, and the median income for a family is $45,000.
Common Questions
What is Per Capita Income in Ocean City?
Per Capita income in Ocean City is $36,097.
What is the Median Family Income in Ocean City?
Median Family Income in Ocean City is $53,711.
What is the Median Household income in Ocean City?
Median Household Income in Ocean City is $53,181.
What is Income or Wage Gap in Ocean City?
Income or Wage Gap in Ocean City is 20.7%.
Women in Ocean City earn 79.3 cents for every dollar earned by a man.
What is Family Income Deficit in Ocean City?
Family Income Deficit in Ocean City is $5,988.
Families that are below poverty line in Ocean City earn $5,988 less on average than the poverty threshold level.
What is Inequality or Gini Index in Ocean City?
Inequality or Gini Index in Ocean City is 0.43.
What is the Total Population of Ocean City?
Total Population of Ocean City is 6,108.
What is the Total Male Population of Ocean City?
Total Male Population of Ocean City is 3,076.
What is the Total Female Population of Ocean City?
Total Female Population of Ocean City is 3,032.
What is the Ratio of Males per 100 Females in Ocean City?
There are 101.45 Males per 100 Females in Ocean City.
What is the Ratio of Females per 100 Males in Ocean City?
There are 98.57 Females per 100 Males in Ocean City.
What is the Median Population Age in Ocean City?
Median Population Age in Ocean City is 33.9 Years.
What is the Average Family Size in Ocean City
Average Family Size in Ocean City is 2.9 People.
What is the Average Household Size in Ocean City
Average Household Size in Ocean City is 2.3 People.
How Large is the Labor Force in Ocean City?
There are 3,516 People in the Labor Forcein in Ocean City.
What is the Percentage of People in the Labor Force in Ocean City?
69.7% of People are in the Labor Force in Ocean City.
What is the Unemployment Rate in Ocean City?
Unemployment Rate in Ocean City is 1.7%.