Zip Codes with the Highest Percentage of Population Employed in Architecture & Engineering in Punta Gorda, FL
RELATED REPORTS & OPTIONS
Architecture & Engineering
Punta Gorda
Compare Zip Codes
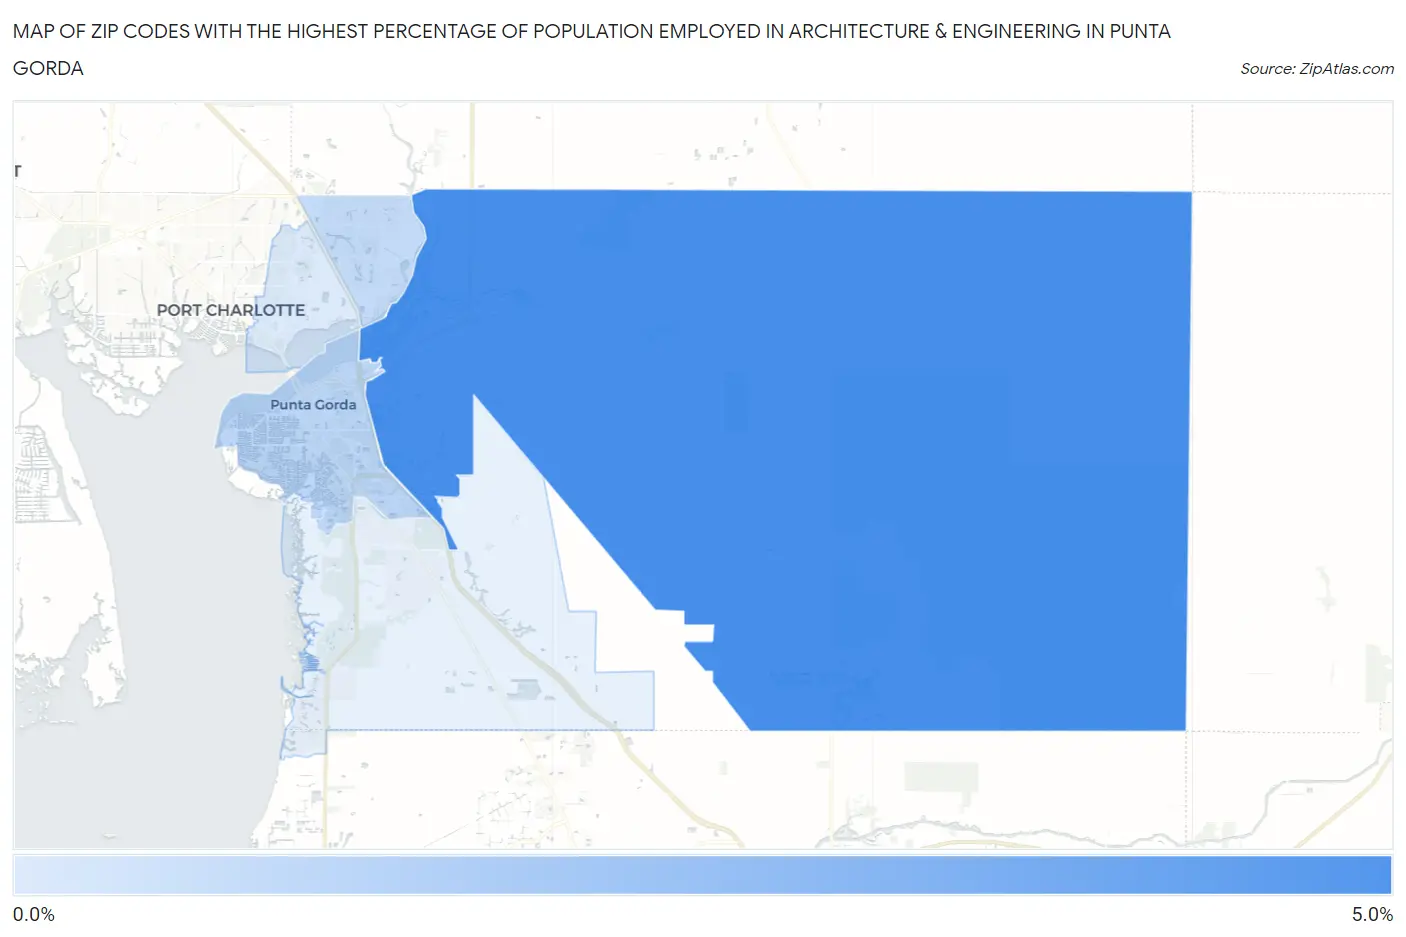
Map of Zip Codes with the Highest Percentage of Population Employed in Architecture & Engineering in Punta Gorda
0.17%
4.8%
Zip Codes with the Highest Percentage of Population Employed in Architecture & Engineering in Punta Gorda, FL
| Zip Code | % Employed | vs State | vs National | |
| 1. | 33982 | 4.8% | 1.6%(+3.24)#37 | 2.1%(+2.69)#1,797 |
| 2. | 33950 | 1.2% | 1.6%(-0.412)#505 | 2.1%(-0.962)#15,184 |
| 3. | 33983 | 0.97% | 1.6%(-0.629)#580 | 2.1%(-1.18)#16,838 |
| 4. | 33980 | 0.17% | 1.6%(-1.43)#833 | 2.1%(-1.98)#22,160 |
1
Common Questions
What are the Top 3 Zip Codes with the Highest Percentage of Population Employed in Architecture & Engineering in Punta Gorda, FL?
Top 3 Zip Codes with the Highest Percentage of Population Employed in Architecture & Engineering in Punta Gorda, FL are:
What zip code has the Highest Percentage of Population Employed in Architecture & Engineering in Punta Gorda, FL?
33982 has the Highest Percentage of Population Employed in Architecture & Engineering in Punta Gorda, FL with 4.8%.
What is the Percentage of Population Employed in Architecture & Engineering in Punta Gorda, FL?
Percentage of Population Employed in Architecture & Engineering in Punta Gorda is 1.1%.
What is the Percentage of Population Employed in Architecture & Engineering in Florida?
Percentage of Population Employed in Architecture & Engineering in Florida is 1.6%.
What is the Percentage of Population Employed in Architecture & Engineering in the United States?
Percentage of Population Employed in Architecture & Engineering in the United States is 2.1%.