Lake Mystic, FL Map & Demographics
Lake Mystic Map
Lake Mystic Overview
$34,874
PER CAPITA INCOME
$57,422
AVG HOUSEHOLD INCOME
0.41
INEQUALITY / GINI INDEX
529
TOTAL POPULATION
243
MALE POPULATION
286
FEMALE POPULATION
84.97
MALES / 100 FEMALES
117.70
FEMALES / 100 MALES
42.8
MEDIAN AGE
2.6
AVG FAMILY SIZE
2.5
AVG HOUSEHOLD SIZE
201
LABOR FORCE [ PEOPLE ]
46.7%
PERCENT IN LABOR FORCE
23.9%
UNEMPLOYMENT RATE
Income in Lake Mystic
Income Overview in Lake Mystic
| Characteristic | Number | Measure |
| Per Capita Income | 529 | $34,874 |
| Median Family Income | 174 | $0 |
| Mean Family Income | 174 | $86,756 |
| Median Household Income | 215 | $57,422 |
| Mean Household Income | 215 | $77,411 |
| Income Deficit | 174 | $0 |
| Wage / Income Gap (%) | 529 | 0.00% |
| Wage / Income Gap ($) | 529 | 100.00¢ per $1 |
| Gini / Inequality Index | 529 | 0.41 |
Earnings by Sex in Lake Mystic
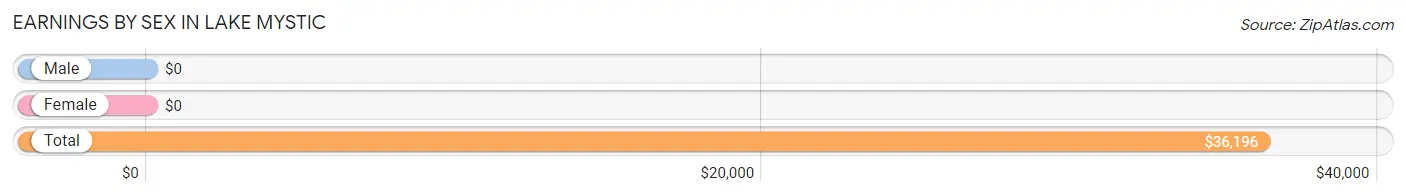
| Sex | Number | Average Earnings |
| Male | 117 (52.7%) | $0 |
| Female | 105 (47.3%) | $0 |
| Total | 222 (100.0%) | $36,196 |
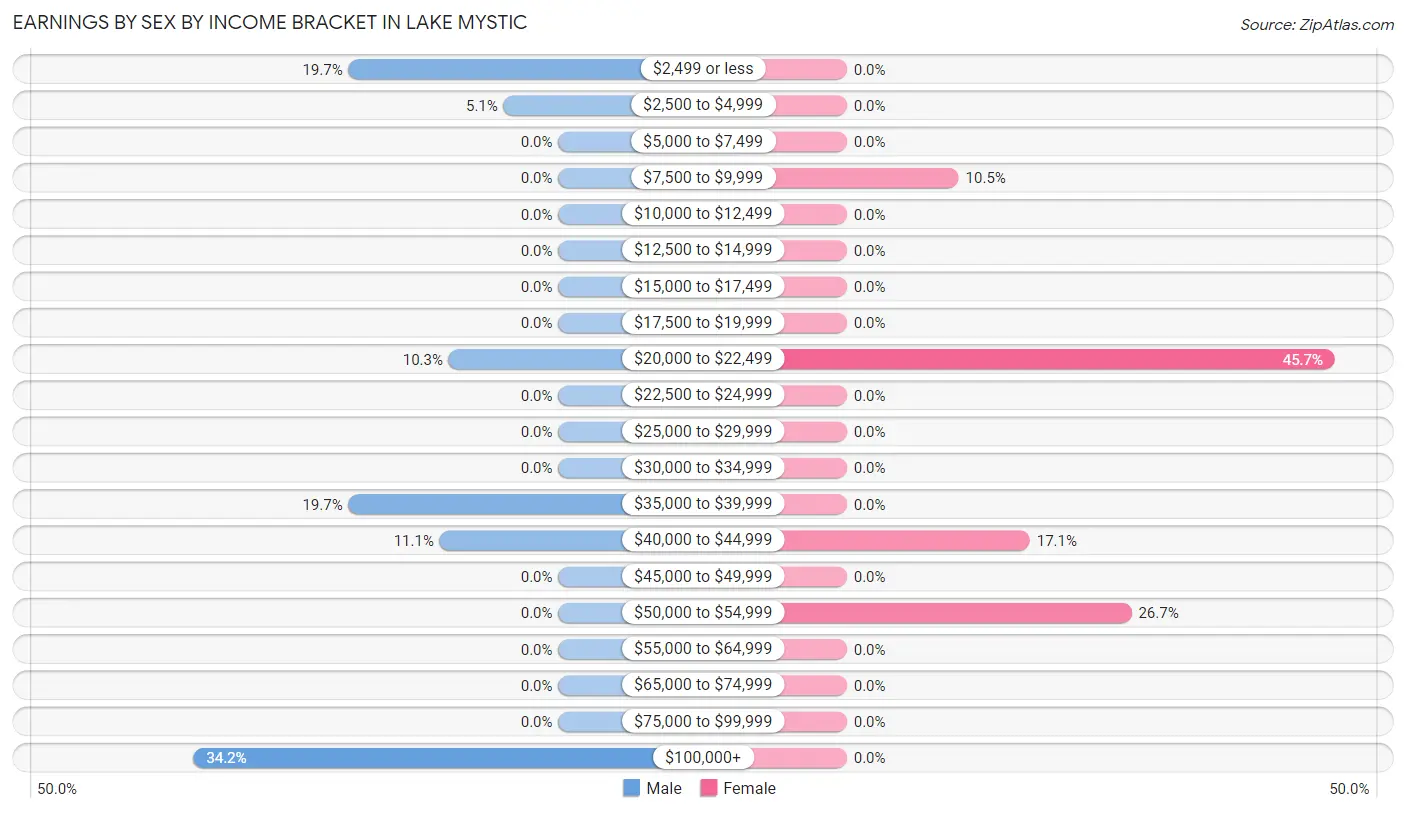
Earnings by Sex by Income Bracket in Lake Mystic
The most common earnings brackets in Lake Mystic are $100,000+ for men (40 | 34.2%) and $20,000 to $22,499 for women (48 | 45.7%).
| Income | Male | Female |
| $2,499 or less | 23 (19.7%) | 0 (0.0%) |
| $2,500 to $4,999 | 6 (5.1%) | 0 (0.0%) |
| $5,000 to $7,499 | 0 (0.0%) | 0 (0.0%) |
| $7,500 to $9,999 | 0 (0.0%) | 11 (10.5%) |
| $10,000 to $12,499 | 0 (0.0%) | 0 (0.0%) |
| $12,500 to $14,999 | 0 (0.0%) | 0 (0.0%) |
| $15,000 to $17,499 | 0 (0.0%) | 0 (0.0%) |
| $17,500 to $19,999 | 0 (0.0%) | 0 (0.0%) |
| $20,000 to $22,499 | 12 (10.3%) | 48 (45.7%) |
| $22,500 to $24,999 | 0 (0.0%) | 0 (0.0%) |
| $25,000 to $29,999 | 0 (0.0%) | 0 (0.0%) |
| $30,000 to $34,999 | 0 (0.0%) | 0 (0.0%) |
| $35,000 to $39,999 | 23 (19.7%) | 0 (0.0%) |
| $40,000 to $44,999 | 13 (11.1%) | 18 (17.1%) |
| $45,000 to $49,999 | 0 (0.0%) | 0 (0.0%) |
| $50,000 to $54,999 | 0 (0.0%) | 28 (26.7%) |
| $55,000 to $64,999 | 0 (0.0%) | 0 (0.0%) |
| $65,000 to $74,999 | 0 (0.0%) | 0 (0.0%) |
| $75,000 to $99,999 | 0 (0.0%) | 0 (0.0%) |
| $100,000+ | 40 (34.2%) | 0 (0.0%) |
| Total | 117 (100.0%) | 105 (100.0%) |
Earnings by Sex by Educational Attainment in Lake Mystic
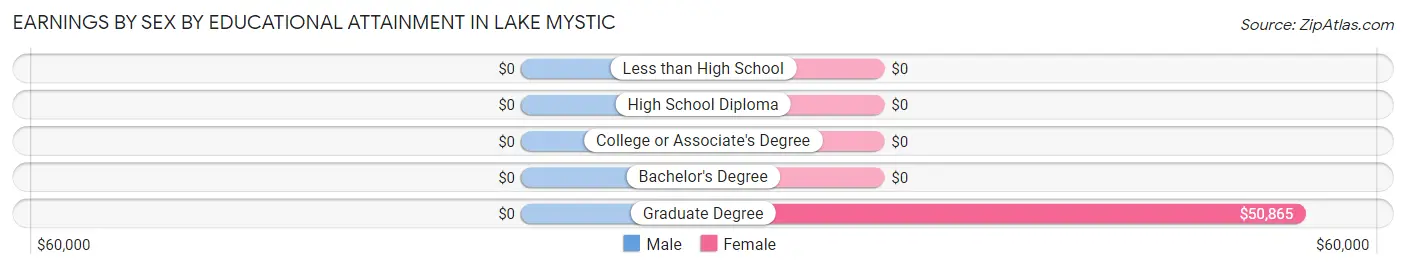
| Educational Attainment | Male Income | Female Income |
| Less than High School | - | - |
| High School Diploma | - | - |
| College or Associate's Degree | - | - |
| Bachelor's Degree | - | - |
| Graduate Degree | - | - |
| Total | - | - |
Family Income in Lake Mystic
Family Income Brackets in Lake Mystic
According to the Lake Mystic family income data, there are 59 families falling into the $50,000 to $74,999 income range, which is the most common income bracket and makes up 33.9% of all families.
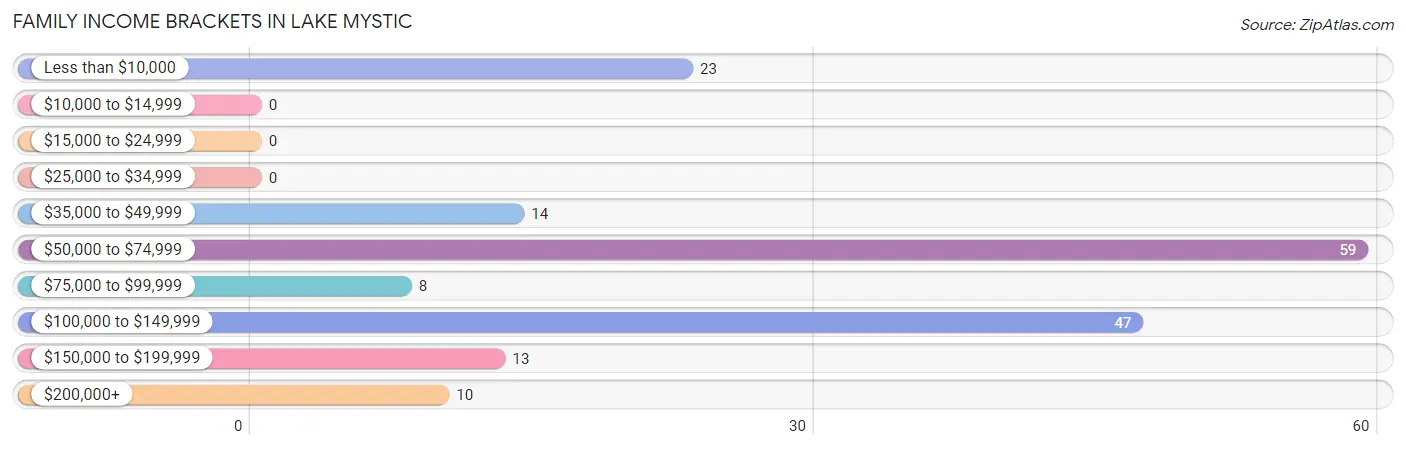
| Income Bracket | # Families | % Families |
| Less than $10,000 | 23 | 13.2% |
| $10,000 to $14,999 | 0 | 0.0% |
| $15,000 to $24,999 | 0 | 0.0% |
| $25,000 to $34,999 | 0 | 0.0% |
| $35,000 to $49,999 | 14 | 8.0% |
| $50,000 to $74,999 | 59 | 33.9% |
| $75,000 to $99,999 | 8 | 4.6% |
| $100,000 to $149,999 | 47 | 27.0% |
| $150,000 to $199,999 | 13 | 7.5% |
| $200,000+ | 10 | 5.7% |
Family Income by Famaliy Size in Lake Mystic
2-person families (103 | 59.2%) account for the highest median family income in Lake Mystic with $86,094 per family, while 2-person families (103 | 59.2%) have the highest median income of $43,047 per family member.
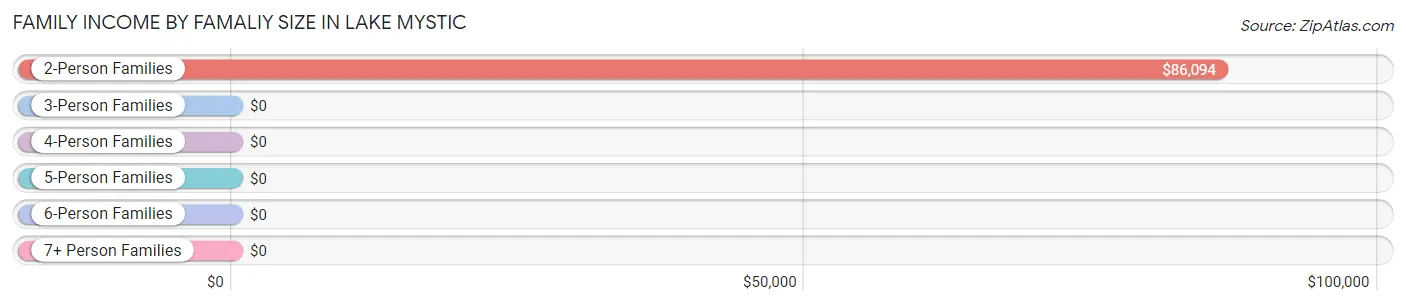
| Income Bracket | # Families | Median Income |
| 2-Person Families | 103 (59.2%) | $86,094 |
| 3-Person Families | 61 (35.1%) | $0 |
| 4-Person Families | 10 (5.8%) | $0 |
| 5-Person Families | 0 (0.0%) | $0 |
| 6-Person Families | 0 (0.0%) | $0 |
| 7+ Person Families | 0 (0.0%) | $0 |
| Total | 174 (100.0%) | $0 |
Family Income by Number of Earners in Lake Mystic
| Number of Earners | # Families | Median Income |
| No Earners | 45 (25.9%) | $0 |
| 1 Earner | 47 (27.0%) | $0 |
| 2 Earners | 82 (47.1%) | $0 |
| 3+ Earners | 0 (0.0%) | $0 |
| Total | 174 (100.0%) | $0 |
Household Income in Lake Mystic
Household Income Brackets in Lake Mystic
With 68 households falling in the category, the $50,000 to $74,999 income range is the most frequent in Lake Mystic, accounting for 31.6% of all households.
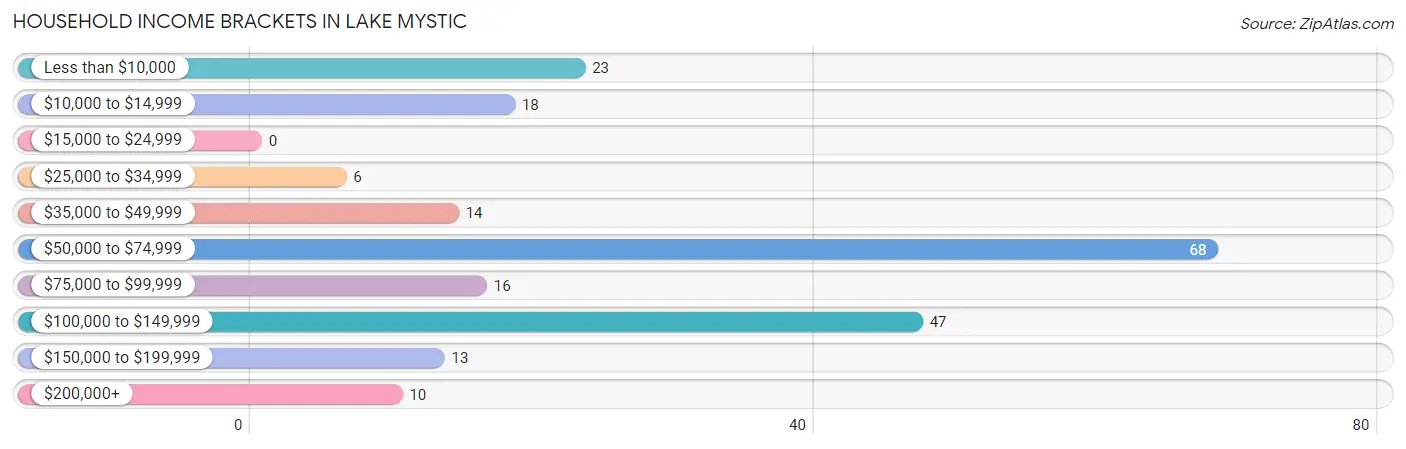
| Income Bracket | # Households | % Households |
| Less than $10,000 | 23 | 10.7% |
| $10,000 to $14,999 | 18 | 8.4% |
| $15,000 to $24,999 | 0 | 0.0% |
| $25,000 to $34,999 | 6 | 2.8% |
| $35,000 to $49,999 | 14 | 6.5% |
| $50,000 to $74,999 | 68 | 31.6% |
| $75,000 to $99,999 | 16 | 7.4% |
| $100,000 to $149,999 | 47 | 21.9% |
| $150,000 to $199,999 | 13 | 6.0% |
| $200,000+ | 10 | 4.7% |
Household Income by Householder Age in Lake Mystic
The median household income in Lake Mystic is $57,422, with the highest median household income of $105,781 found in the 65+ years age bracket for the primary householder. A total of 89 households (41.4%) fall into this category.
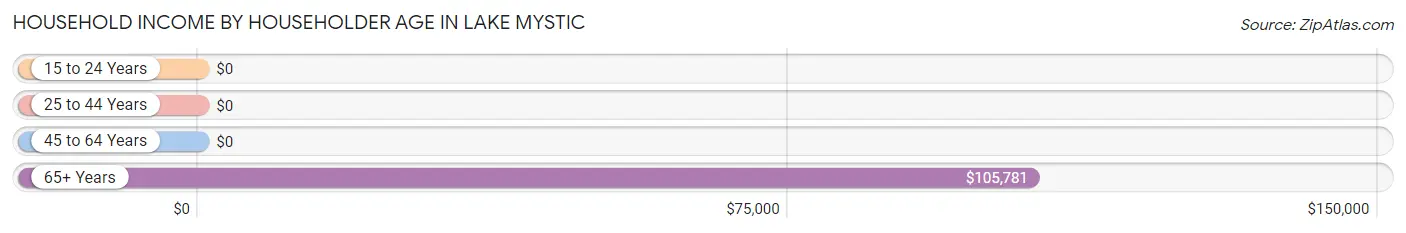
| Income Bracket | # Households | Median Income |
| 15 to 24 Years | 0 (0.0%) | $0 |
| 25 to 44 Years | 58 (27.0%) | $0 |
| 45 to 64 Years | 68 (31.6%) | $0 |
| 65+ Years | 89 (41.4%) | $105,781 |
| Total | 215 (100.0%) | $57,422 |
Poverty in Lake Mystic
Income Below Poverty by Sex and Age in Lake Mystic
With 9.5% poverty level for males and 31.1% for females among the residents of Lake Mystic, 45 to 54 year old males and 12 to 14 year old females are the most vulnerable to poverty, with 23 males (34.8%) and 32 females (80.0%) in their respective age groups living below the poverty level.
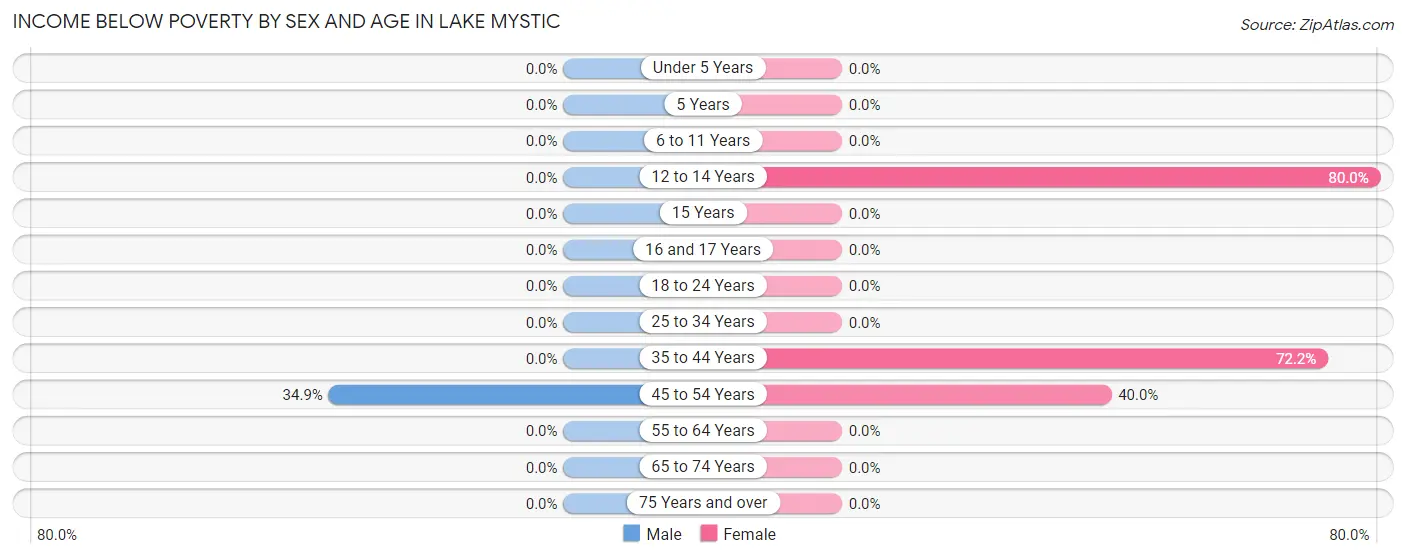
| Age Bracket | Male | Female |
| Under 5 Years | 0 (0.0%) | 0 (0.0%) |
| 5 Years | 0 (0.0%) | 0 (0.0%) |
| 6 to 11 Years | 0 (0.0%) | 0 (0.0%) |
| 12 to 14 Years | 0 (0.0%) | 32 (80.0%) |
| 15 Years | 0 (0.0%) | 0 (0.0%) |
| 16 and 17 Years | 0 (0.0%) | 0 (0.0%) |
| 18 to 24 Years | 0 (0.0%) | 0 (0.0%) |
| 25 to 34 Years | 0 (0.0%) | 0 (0.0%) |
| 35 to 44 Years | 0 (0.0%) | 39 (72.2%) |
| 45 to 54 Years | 23 (34.8%) | 18 (40.0%) |
| 55 to 64 Years | 0 (0.0%) | 0 (0.0%) |
| 65 to 74 Years | 0 (0.0%) | 0 (0.0%) |
| 75 Years and over | 0 (0.0%) | 0 (0.0%) |
| Total | 23 (9.5%) | 89 (31.1%) |
Income Above Poverty by Sex and Age in Lake Mystic
According to the poverty statistics in Lake Mystic, males aged 6 to 11 years and females aged 25 to 34 years are the age groups that are most secure financially, with 100.0% of males and 100.0% of females in these age groups living above the poverty line.
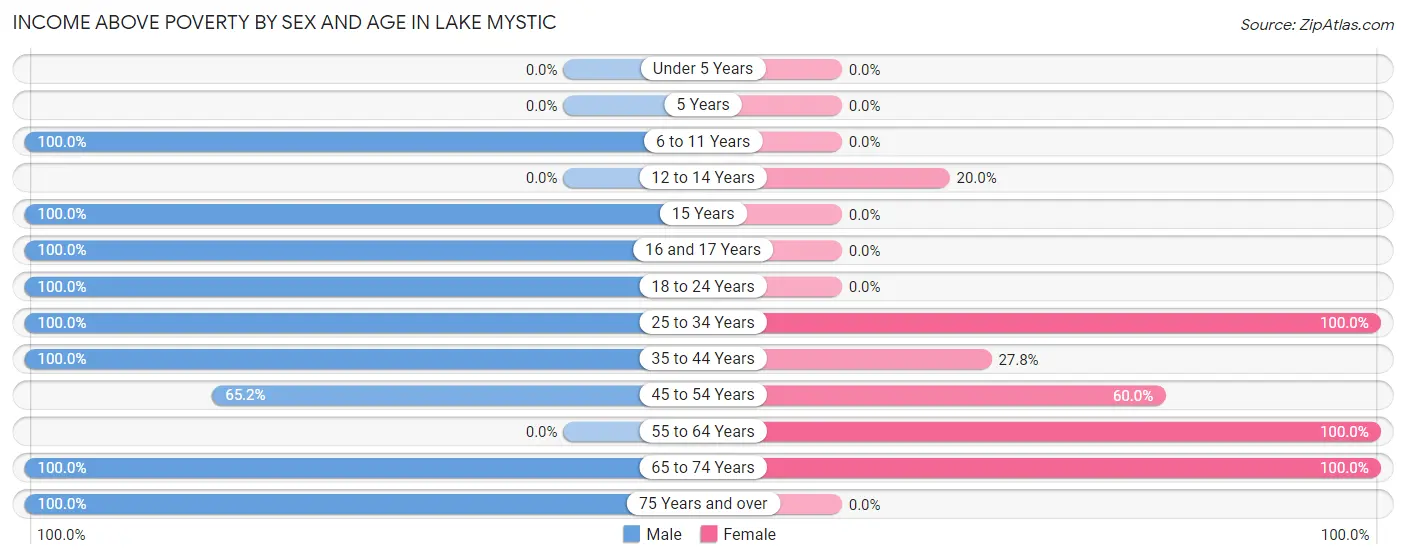
| Age Bracket | Male | Female |
| Under 5 Years | 0 (0.0%) | 0 (0.0%) |
| 5 Years | 0 (0.0%) | 0 (0.0%) |
| 6 to 11 Years | 48 (100.0%) | 0 (0.0%) |
| 12 to 14 Years | 0 (0.0%) | 8 (20.0%) |
| 15 Years | 11 (100.0%) | 0 (0.0%) |
| 16 and 17 Years | 22 (100.0%) | 0 (0.0%) |
| 18 to 24 Years | 12 (100.0%) | 0 (0.0%) |
| 25 to 34 Years | 23 (100.0%) | 48 (100.0%) |
| 35 to 44 Years | 10 (100.0%) | 15 (27.8%) |
| 45 to 54 Years | 43 (65.1%) | 27 (60.0%) |
| 55 to 64 Years | 0 (0.0%) | 55 (100.0%) |
| 65 to 74 Years | 14 (100.0%) | 44 (100.0%) |
| 75 Years and over | 37 (100.0%) | 0 (0.0%) |
| Total | 220 (90.5%) | 197 (68.9%) |
Income Below Poverty Among Married-Couple Families in Lake Mystic
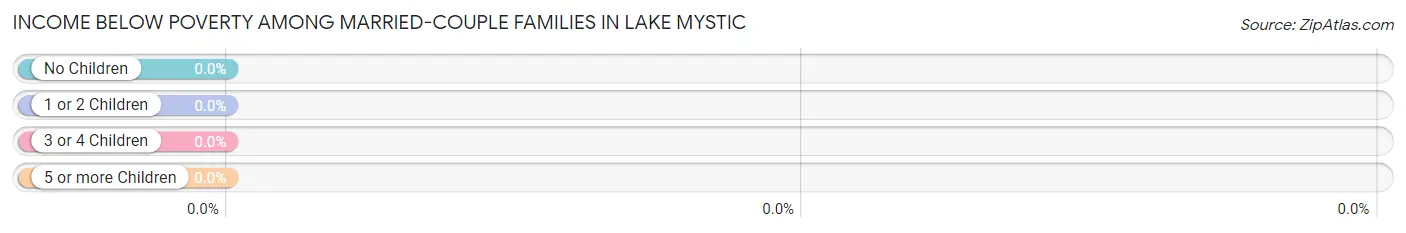
| Children | Above Poverty | Below Poverty |
| No Children | 47 (100.0%) | 0 (0.0%) |
| 1 or 2 Children | 71 (100.0%) | 0 (0.0%) |
| 3 or 4 Children | 0 (0.0%) | 0 (0.0%) |
| 5 or more Children | 0 (0.0%) | 0 (0.0%) |
| Total | 118 (100.0%) | 0 (0.0%) |
Income Below Poverty Among Single-Parent Households in Lake Mystic
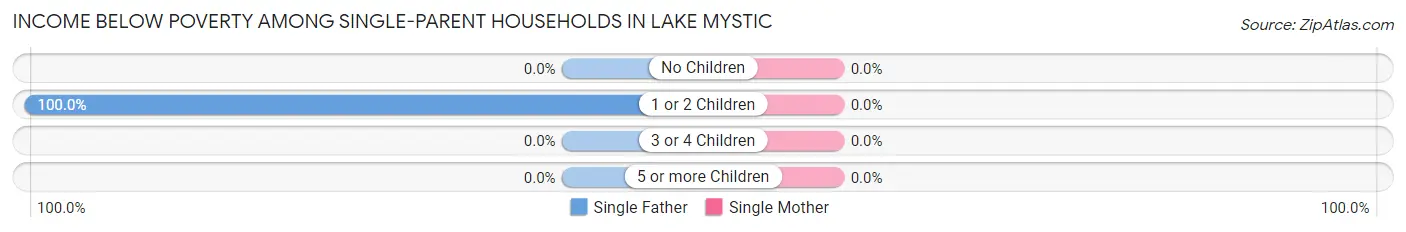
| Children | Single Father | Single Mother |
| No Children | 0 (0.0%) | 0 (0.0%) |
| 1 or 2 Children | 23 (100.0%) | 0 (0.0%) |
| 3 or 4 Children | 0 (0.0%) | 0 (0.0%) |
| 5 or more Children | 0 (0.0%) | 0 (0.0%) |
| Total | 23 (100.0%) | 0 (0.0%) |
Income Below Poverty Among Married-Couple vs Single-Parent Households in Lake Mystic
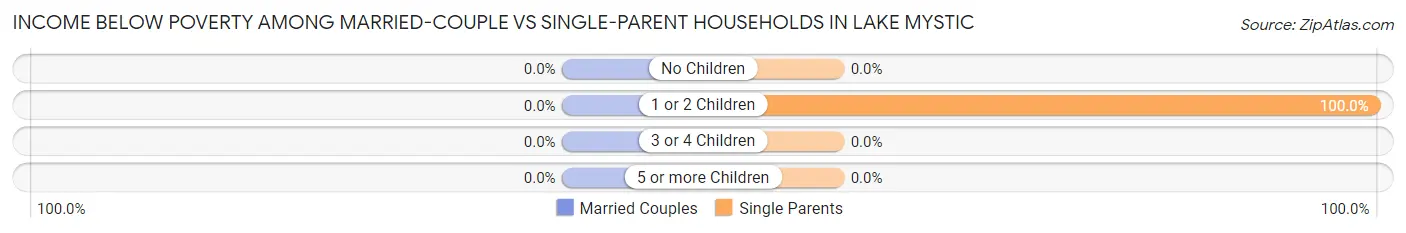
| Children | Married-Couple Families | Single-Parent Households |
| No Children | 0 (0.0%) | 0 (0.0%) |
| 1 or 2 Children | 0 (0.0%) | 23 (100.0%) |
| 3 or 4 Children | 0 (0.0%) | 0 (0.0%) |
| 5 or more Children | 0 (0.0%) | 0 (0.0%) |
| Total | 0 (0.0%) | 23 (41.1%) |
Race in Lake Mystic
The most populous races in Lake Mystic are White / Caucasian (494 | 93.4%), Native / Alaskan (23 | 4.3%), and Two or more Races (12 | 2.3%).
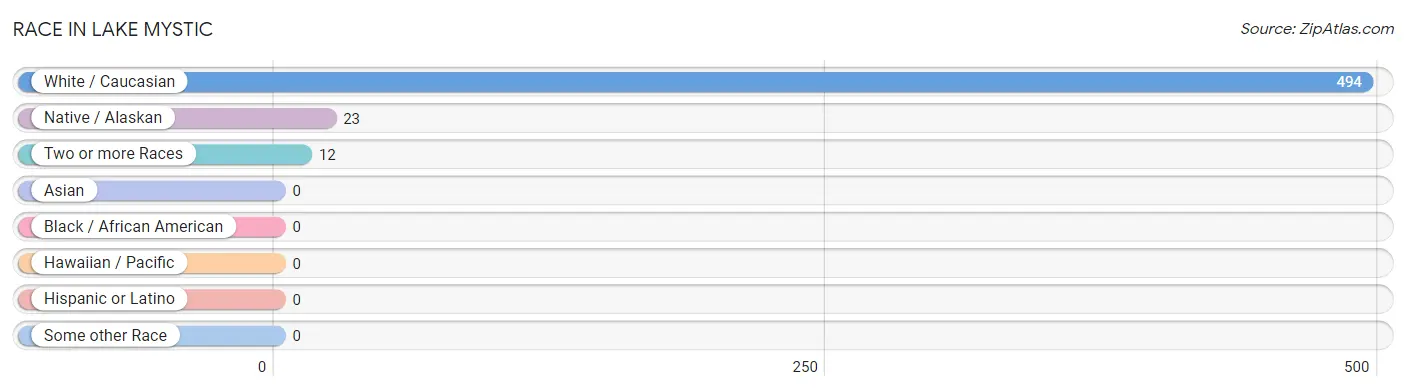
| Race | # Population | % Population |
| Asian | 0 | 0.0% |
| Black / African American | 0 | 0.0% |
| Hawaiian / Pacific | 0 | 0.0% |
| Hispanic or Latino | 0 | 0.0% |
| Native / Alaskan | 23 | 4.3% |
| White / Caucasian | 494 | 93.4% |
| Two or more Races | 12 | 2.3% |
| Some other Race | 0 | 0.0% |
| Total | 529 | 100.0% |
Ancestry in Lake Mystic
The most populous ancestries reported in Lake Mystic are American (153 | 28.9%), Irish (76 | 14.4%), English (55 | 10.4%), Scottish (29 | 5.5%), and Creek (23 | 4.3%), together accounting for 63.5% of all Lake Mystic residents.
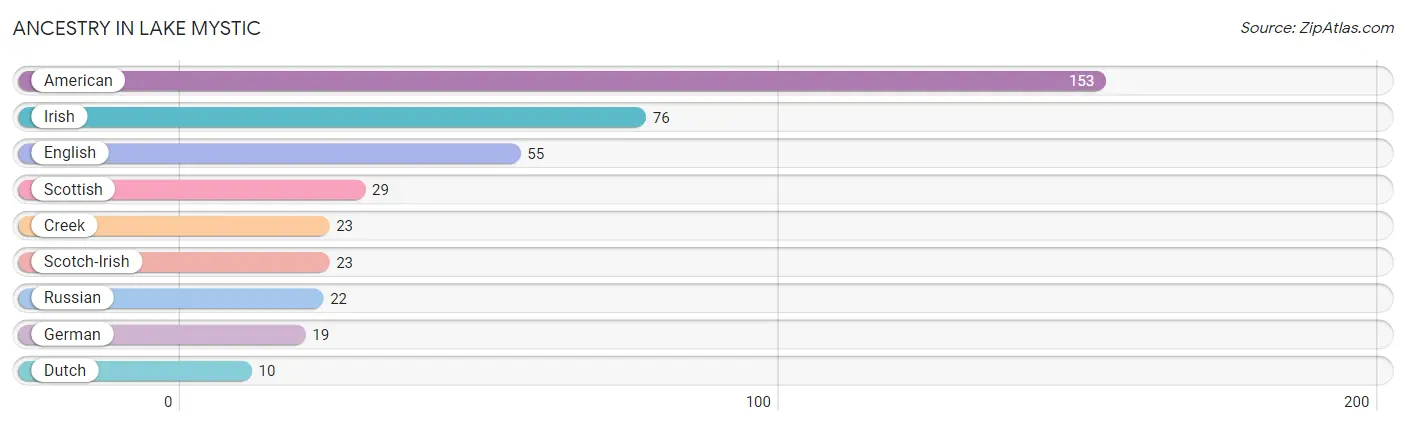
| Ancestry | # Population | % Population |
| American | 153 | 28.9% |
| Creek | 23 | 4.3% |
| Dutch | 10 | 1.9% |
| English | 55 | 10.4% |
| German | 19 | 3.6% |
| Irish | 76 | 14.4% |
| Russian | 22 | 4.2% |
| Scotch-Irish | 23 | 4.3% |
| Scottish | 29 | 5.5% | View All 9 Rows |
Immigrants in Lake Mystic
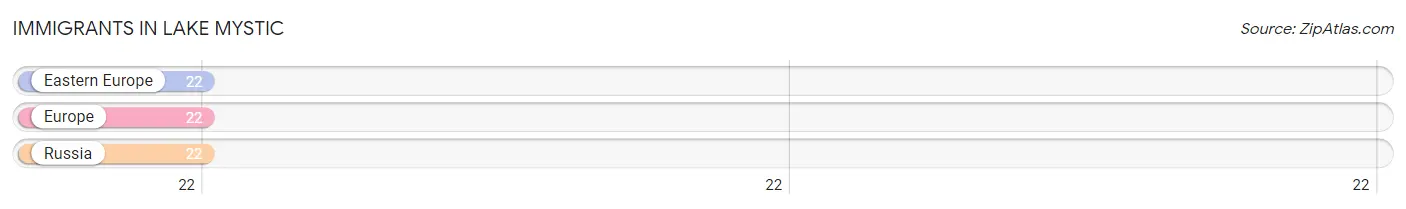
The most numerous immigrant groups reported in Lake Mystic came from Eastern Europe (22 | 4.2%), Europe (22 | 4.2%), and Russia (22 | 4.2%), together accounting for 12.5% of all Lake Mystic residents.
| Immigration Origin | # Population | % Population |
| Eastern Europe | 22 | 4.2% |
| Europe | 22 | 4.2% |
| Russia | 22 | 4.2% | View All 3 Rows |
Sex and Age in Lake Mystic
Sex and Age in Lake Mystic
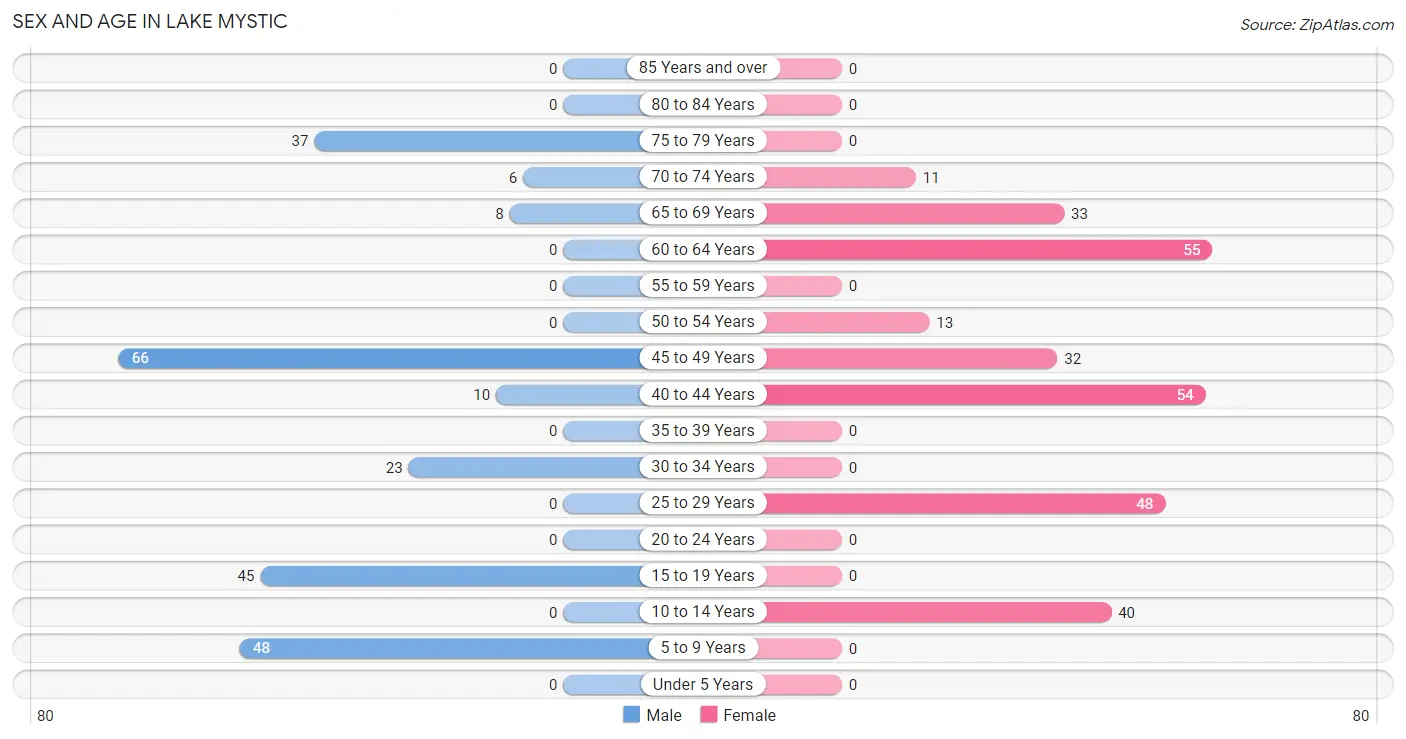
The most populous age groups in Lake Mystic are 45 to 49 Years (66 | 27.2%) for men and 60 to 64 Years (55 | 19.2%) for women.
| Age Bracket | Male | Female |
| Under 5 Years | 0 (0.0%) | 0 (0.0%) |
| 5 to 9 Years | 48 (19.8%) | 0 (0.0%) |
| 10 to 14 Years | 0 (0.0%) | 40 (14.0%) |
| 15 to 19 Years | 45 (18.5%) | 0 (0.0%) |
| 20 to 24 Years | 0 (0.0%) | 0 (0.0%) |
| 25 to 29 Years | 0 (0.0%) | 48 (16.8%) |
| 30 to 34 Years | 23 (9.5%) | 0 (0.0%) |
| 35 to 39 Years | 0 (0.0%) | 0 (0.0%) |
| 40 to 44 Years | 10 (4.1%) | 54 (18.9%) |
| 45 to 49 Years | 66 (27.2%) | 32 (11.2%) |
| 50 to 54 Years | 0 (0.0%) | 13 (4.5%) |
| 55 to 59 Years | 0 (0.0%) | 0 (0.0%) |
| 60 to 64 Years | 0 (0.0%) | 55 (19.2%) |
| 65 to 69 Years | 8 (3.3%) | 33 (11.5%) |
| 70 to 74 Years | 6 (2.5%) | 11 (3.8%) |
| 75 to 79 Years | 37 (15.2%) | 0 (0.0%) |
| 80 to 84 Years | 0 (0.0%) | 0 (0.0%) |
| 85 Years and over | 0 (0.0%) | 0 (0.0%) |
| Total | 243 (100.0%) | 286 (100.0%) |
Families and Households in Lake Mystic
Median Family Size in Lake Mystic
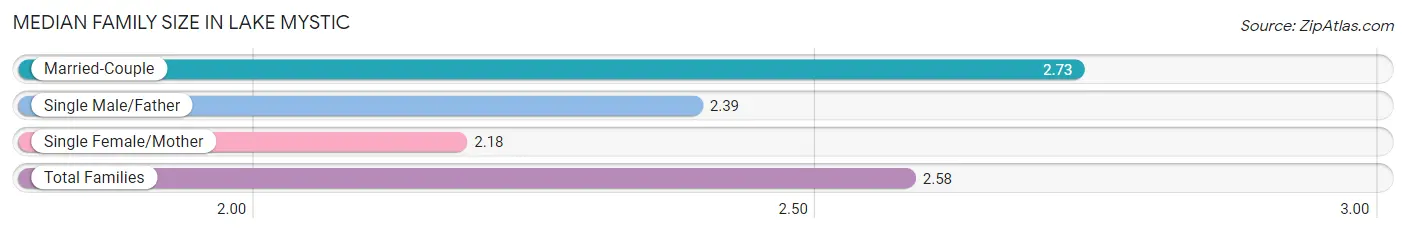
The median family size in Lake Mystic is 2.58 persons per family, with married-couple families (118 | 67.8%) accounting for the largest median family size of 2.73 persons per family. On the other hand, single female/mother families (33 | 19.0%) represent the smallest median family size with 2.18 persons per family.
| Family Type | # Families | Family Size |
| Married-Couple | 118 (67.8%) | 2.73 |
| Single Male/Father | 23 (13.2%) | 2.39 |
| Single Female/Mother | 33 (19.0%) | 2.18 |
| Total Families | 174 (100.0%) | 2.58 |
Median Household Size in Lake Mystic
| Household Type | # Households | Household Size |
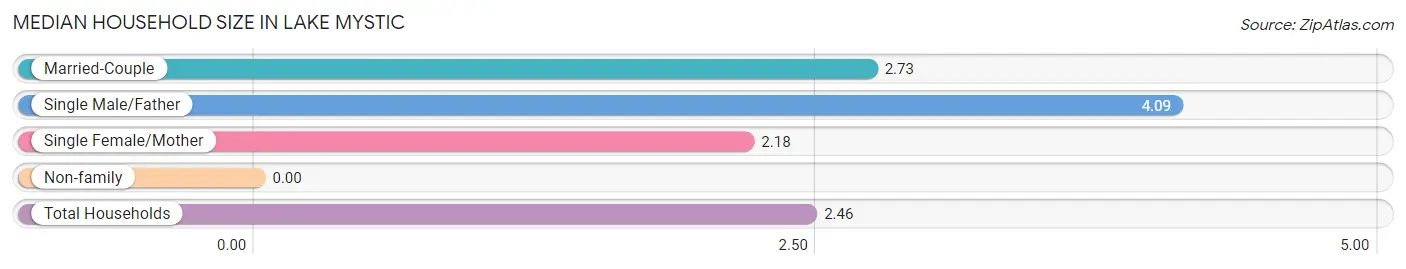
| Married-Couple | 118 (54.9%) | 2.73 |
| Single Male/Father | 23 (10.7%) | 4.09 |
| Single Female/Mother | 33 (15.3%) | 2.18 |
| Non-family | 41 (19.1%) | - |
| Total Households | 215 (100.0%) | 2.46 |
Household Size by Marriage Status in Lake Mystic
Out of a total of 215 households in Lake Mystic, 174 (80.9%) are family households, while 41 (19.1%) are nonfamily households. The most numerous type of family households are 3-person households, comprising 84, and the most common type of nonfamily households are 1-person households, comprising 41.
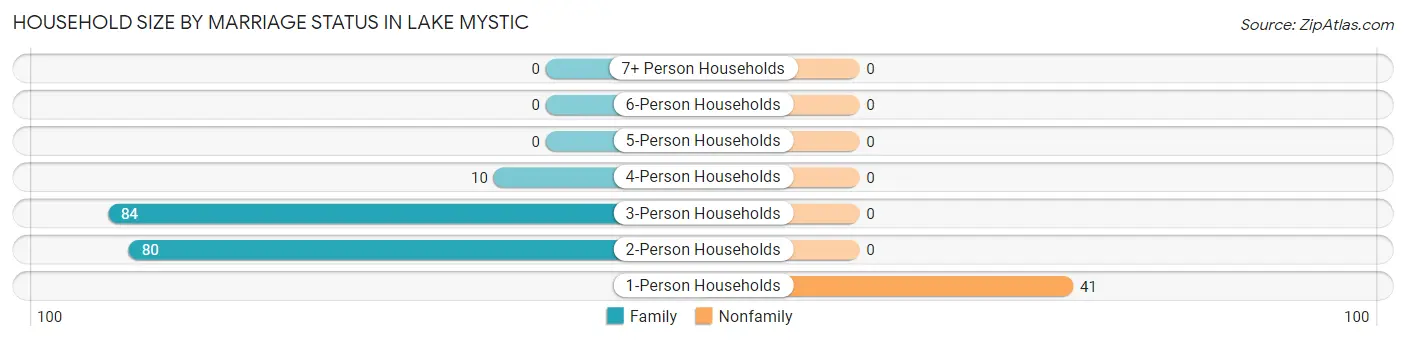
| Household Size | Family Households | Nonfamily Households |
| 1-Person Households | - | 41 (19.1%) |
| 2-Person Households | 80 (37.2%) | 0 (0.0%) |
| 3-Person Households | 84 (39.1%) | 0 (0.0%) |
| 4-Person Households | 10 (4.6%) | 0 (0.0%) |
| 5-Person Households | 0 (0.0%) | 0 (0.0%) |
| 6-Person Households | 0 (0.0%) | 0 (0.0%) |
| 7+ Person Households | 0 (0.0%) | 0 (0.0%) |
| Total | 174 (80.9%) | 41 (19.1%) |
Female Fertility in Lake Mystic
Fertility by Age in Lake Mystic
| Age Bracket | Women with Births | Births / 1,000 Women |
| 15 to 19 years | 0 (0.0%) | 0.0 |
| 20 to 34 years | 0 (0.0%) | 0.0 |
| 35 to 50 years | 0 (0.0%) | 0.0 |
| Total | 0 (0.0%) | 0.0 |
Fertility by Age by Marriage Status in Lake Mystic
| Age Bracket | Married | Unmarried |
| 15 to 19 years | 0 (0.0%) | 0 (0.0%) |
| 20 to 34 years | 0 (0.0%) | 0 (0.0%) |
| 35 to 50 years | 0 (0.0%) | 0 (0.0%) |
| Total | 0 (0.0%) | 0 (0.0%) |
Fertility by Education in Lake Mystic
| Educational Attainment | Women with Births | Births / 1,000 Women |
| Less than High School | 0 (0.0%) | 0.0 |
| High School Diploma | 0 (0.0%) | 0.0 |
| College or Associate's Degree | 0 (0.0%) | 0.0 |
| Bachelor's Degree | 0 (0.0%) | 0.0 |
| Graduate Degree | 0 (0.0%) | 0.0 |
| Total | 0 (0.0%) | 0.0 |
Fertility by Education by Marriage Status in Lake Mystic
| Educational Attainment | Married | Unmarried |
| Less than High School | 0 (0.0%) | 0 (0.0%) |
| High School Diploma | 0 (0.0%) | 0 (0.0%) |
| College or Associate's Degree | 0 (0.0%) | 0 (0.0%) |
| Bachelor's Degree | 0 (0.0%) | 0 (0.0%) |
| Graduate Degree | 0 (0.0%) | 0 (0.0%) |
| Total | 0 (0.0%) | 0 (0.0%) |
Employment Characteristics in Lake Mystic
Employment by Class of Employer in Lake Mystic
Among the 153 employed individuals in Lake Mystic, private company employees (79 | 51.6%), state government employees (30 | 19.6%), and local government employees (28 | 18.3%) make up the most common classes of employment.
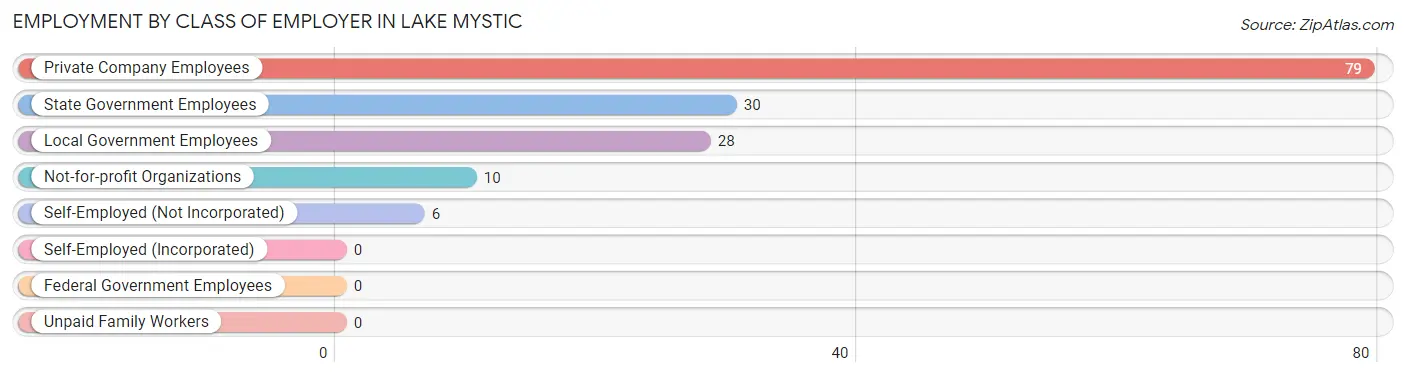
| Employer Class | # Employees | % Employees |
| Private Company Employees | 79 | 51.6% |
| Self-Employed (Incorporated) | 0 | 0.0% |
| Self-Employed (Not Incorporated) | 6 | 3.9% |
| Not-for-profit Organizations | 10 | 6.5% |
| Local Government Employees | 28 | 18.3% |
| State Government Employees | 30 | 19.6% |
| Federal Government Employees | 0 | 0.0% |
| Unpaid Family Workers | 0 | 0.0% |
| Total | 153 | 100.0% |
Employment Status by Age in Lake Mystic
According to the labor force statistics for Lake Mystic, out of the total population over 16 years of age (430), 46.7% or 201 individuals are in the labor force, with 23.9% or 48 of them unemployed. The age group with the highest labor force participation rate is 25 to 29 years, with 100.0% or 48 individuals in the labor force. Within the labor force, the 25 to 29 years age range has the highest percentage of unemployed individuals, with 100.0% or 48 of them being unemployed.
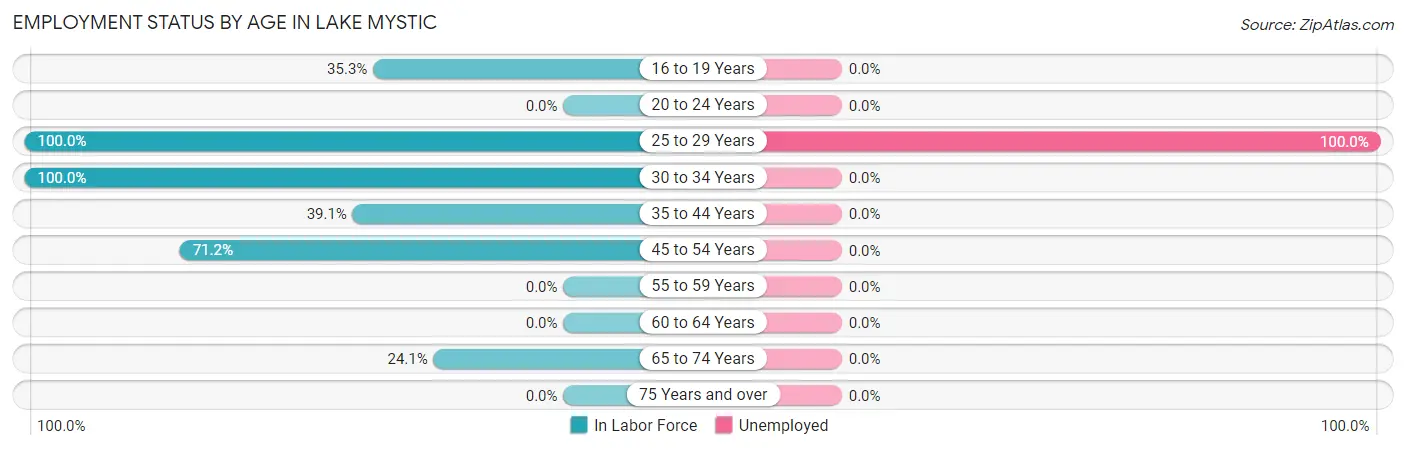
| Age Bracket | In Labor Force | Unemployed |
| 16 to 19 Years | 12 (35.3%) | 0 (0.0%) |
| 20 to 24 Years | 0 (0.0%) | 0 (0.0%) |
| 25 to 29 Years | 48 (100.0%) | 48 (100.0%) |
| 30 to 34 Years | 23 (100.0%) | 0 (0.0%) |
| 35 to 44 Years | 25 (39.1%) | 0 (0.0%) |
| 45 to 54 Years | 79 (71.2%) | 0 (0.0%) |
| 55 to 59 Years | 0 (0.0%) | 0 (0.0%) |
| 60 to 64 Years | 0 (0.0%) | 0 (0.0%) |
| 65 to 74 Years | 14 (24.1%) | 0 (0.0%) |
| 75 Years and over | 0 (0.0%) | 0 (0.0%) |
| Total | 201 (46.7%) | 48 (23.9%) |
Employment Status by Educational Attainment in Lake Mystic
According to labor force statistics for Lake Mystic, 58.1% of individuals (175) out of the total population between 25 and 64 years of age (301) are in the labor force, with 27.4% or 48 of them being unemployed. The group with the highest labor force participation rate are those with the educational attainment of less than high school, with 100.0% or 23 individuals in the labor force. Within the labor force, individuals with high school diploma education have the highest percentage of unemployment, with 67.6% or 48 of them being unemployed.
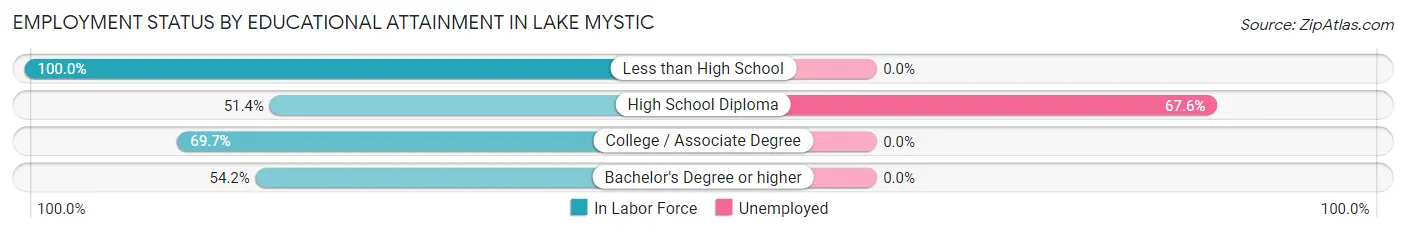
| Educational Attainment | In Labor Force | Unemployed |
| Less than High School | 23 (100.0%) | 0 (0.0%) |
| High School Diploma | 71 (51.4%) | 93 (67.6%) |
| College / Associate Degree | 23 (69.7%) | 0 (0.0%) |
| Bachelor's Degree or higher | 58 (54.2%) | 0 (0.0%) |
| Total | 175 (58.1%) | 82 (27.4%) |
Employment Occupations by Sex in Lake Mystic
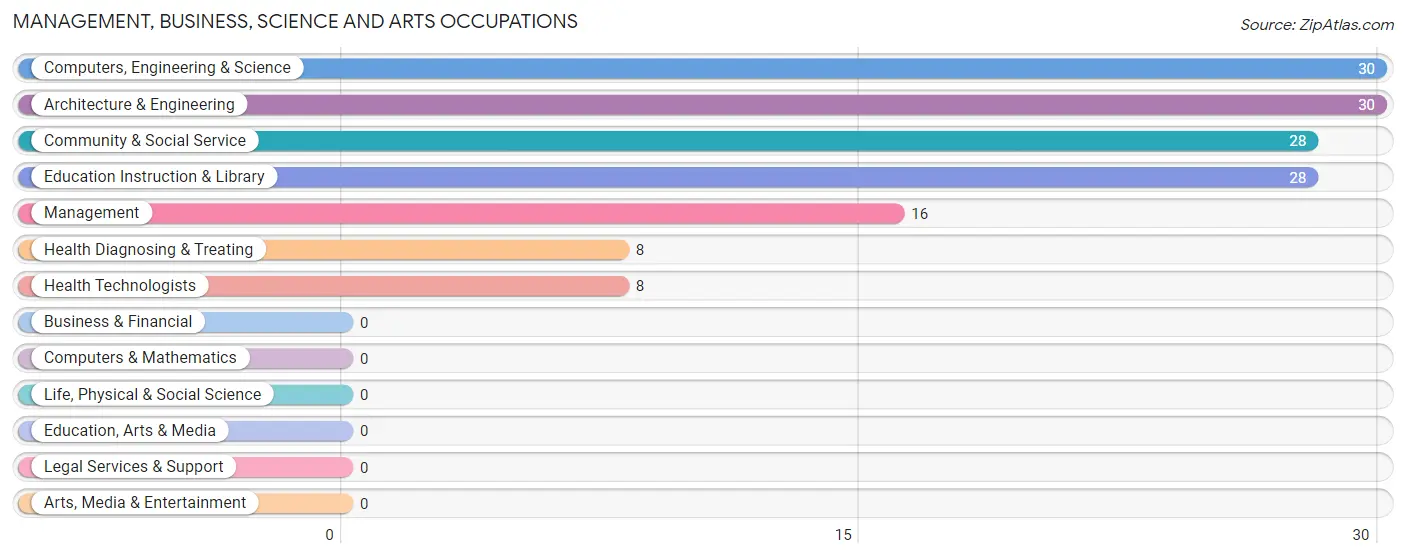
Management, Business, Science and Arts Occupations
The most common Management, Business, Science and Arts occupations in Lake Mystic are Computers, Engineering & Science (30 | 19.6%), Architecture & Engineering (30 | 19.6%), Community & Social Service (28 | 18.3%), Education Instruction & Library (28 | 18.3%), and Management (16 | 10.5%).
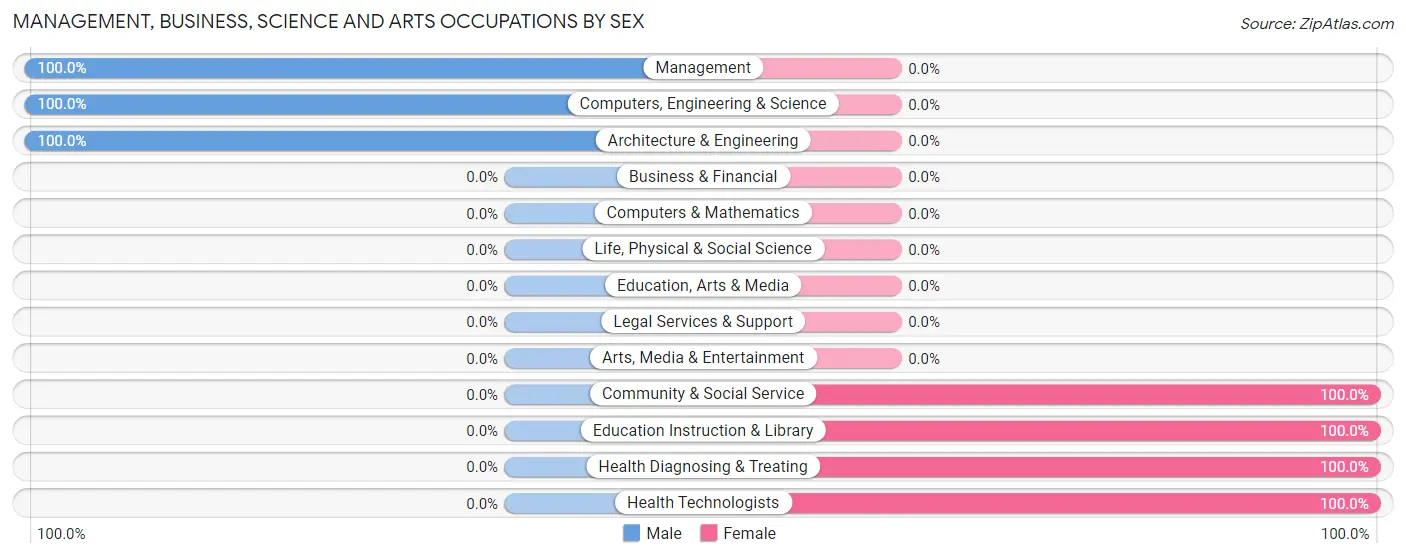
Management, Business, Science and Arts Occupations by Sex
Within the Management, Business, Science and Arts occupations in Lake Mystic, the most male-oriented occupations are Management (100.0%), Computers, Engineering & Science (100.0%), and Architecture & Engineering (100.0%), while the most female-oriented occupations are Community & Social Service (100.0%), Education Instruction & Library (100.0%), and Health Diagnosing & Treating (100.0%).
| Occupation | Male | Female |
| Management | 16 (100.0%) | 0 (0.0%) |
| Business & Financial | 0 (0.0%) | 0 (0.0%) |
| Computers, Engineering & Science | 30 (100.0%) | 0 (0.0%) |
| Computers & Mathematics | 0 (0.0%) | 0 (0.0%) |
| Architecture & Engineering | 30 (100.0%) | 0 (0.0%) |
| Life, Physical & Social Science | 0 (0.0%) | 0 (0.0%) |
| Community & Social Service | 0 (0.0%) | 28 (100.0%) |
| Education, Arts & Media | 0 (0.0%) | 0 (0.0%) |
| Legal Services & Support | 0 (0.0%) | 0 (0.0%) |
| Education Instruction & Library | 0 (0.0%) | 28 (100.0%) |
| Arts, Media & Entertainment | 0 (0.0%) | 0 (0.0%) |
| Health Diagnosing & Treating | 0 (0.0%) | 8 (100.0%) |
| Health Technologists | 0 (0.0%) | 8 (100.0%) |
| Total (Category) | 46 (56.1%) | 36 (43.9%) |
| Total (Overall) | 117 (76.5%) | 36 (23.5%) |
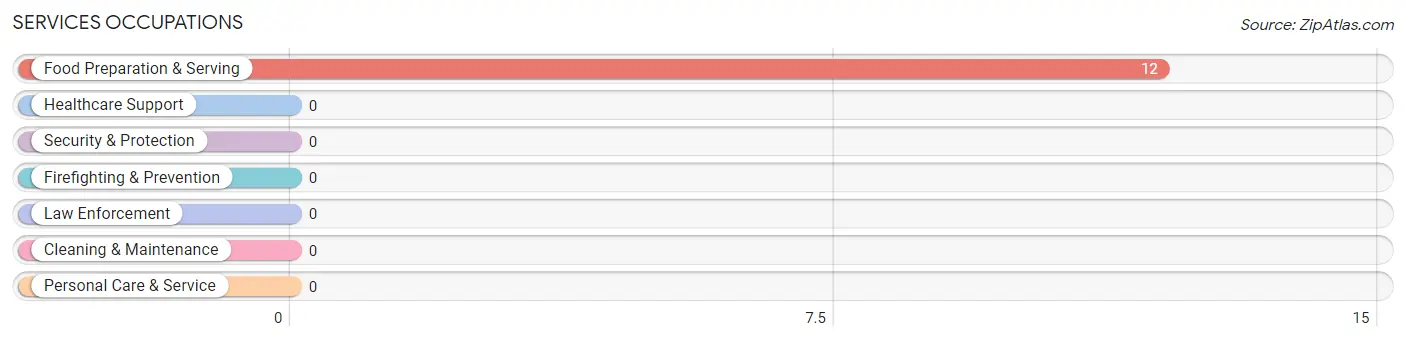
Services Occupations
The most common Services occupations in Lake Mystic are , and Food Preparation & Serving (12 | 7.8%).
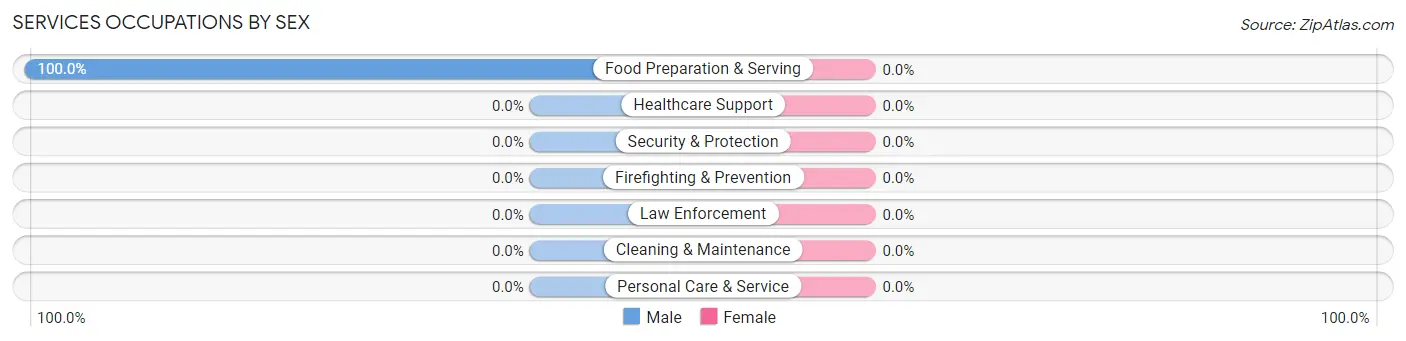
Services Occupations by Sex
| Occupation | Male | Female |
| Healthcare Support | 0 (0.0%) | 0 (0.0%) |
| Security & Protection | 0 (0.0%) | 0 (0.0%) |
| Firefighting & Prevention | 0 (0.0%) | 0 (0.0%) |
| Law Enforcement | 0 (0.0%) | 0 (0.0%) |
| Food Preparation & Serving | 12 (100.0%) | 0 (0.0%) |
| Cleaning & Maintenance | 0 (0.0%) | 0 (0.0%) |
| Personal Care & Service | 0 (0.0%) | 0 (0.0%) |
| Total (Category) | 12 (100.0%) | 0 (0.0%) |
| Total (Overall) | 117 (76.5%) | 36 (23.5%) |
Sales and Office Occupations
Sales and Office Occupations by Sex
| Occupation | Male | Female |
| Sales & Related | 0 (0.0%) | 0 (0.0%) |
| Office & Administration | 0 (0.0%) | 0 (0.0%) |
| Total (Category) | 0 (0.0%) | 0 (0.0%) |
| Total (Overall) | 117 (76.5%) | 36 (23.5%) |
Natural Resources, Construction and Maintenance Occupations
Natural Resources, Construction and Maintenance Occupations by Sex
| Occupation | Male | Female |
| Farming, Fishing & Forestry | 0 (0.0%) | 0 (0.0%) |
| Construction & Extraction | 0 (0.0%) | 0 (0.0%) |
| Installation, Maintenance & Repair | 0 (0.0%) | 0 (0.0%) |
| Total (Category) | 0 (0.0%) | 0 (0.0%) |
| Total (Overall) | 117 (76.5%) | 36 (23.5%) |
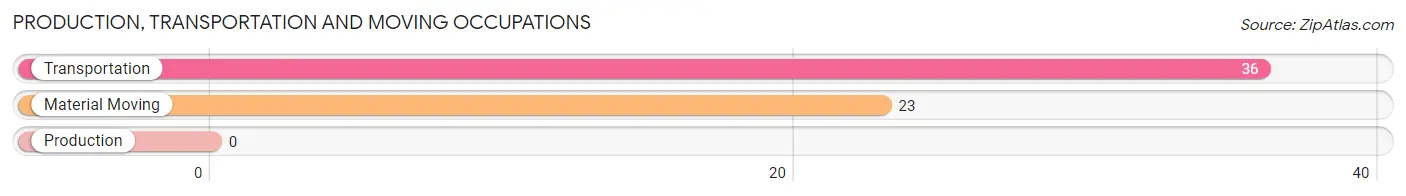
Production, Transportation and Moving Occupations
The most common Production, Transportation and Moving occupations in Lake Mystic are Transportation (36 | 23.5%), and Material Moving (23 | 15.0%).
Production, Transportation and Moving Occupations by Sex
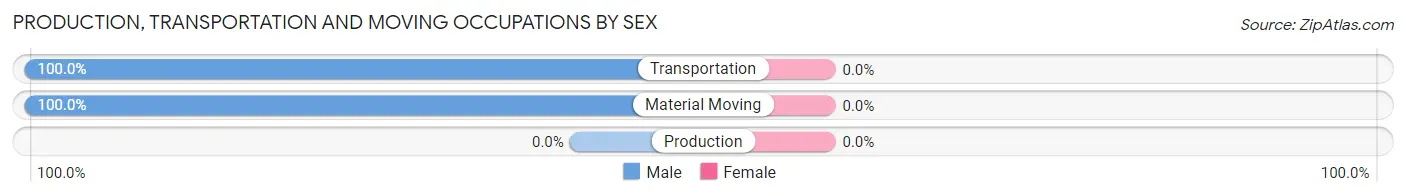
| Occupation | Male | Female |
| Production | 0 (0.0%) | 0 (0.0%) |
| Transportation | 36 (100.0%) | 0 (0.0%) |
| Material Moving | 23 (100.0%) | 0 (0.0%) |
| Total (Category) | 59 (100.0%) | 0 (0.0%) |
| Total (Overall) | 117 (76.5%) | 36 (23.5%) |
Employment Industries by Sex in Lake Mystic
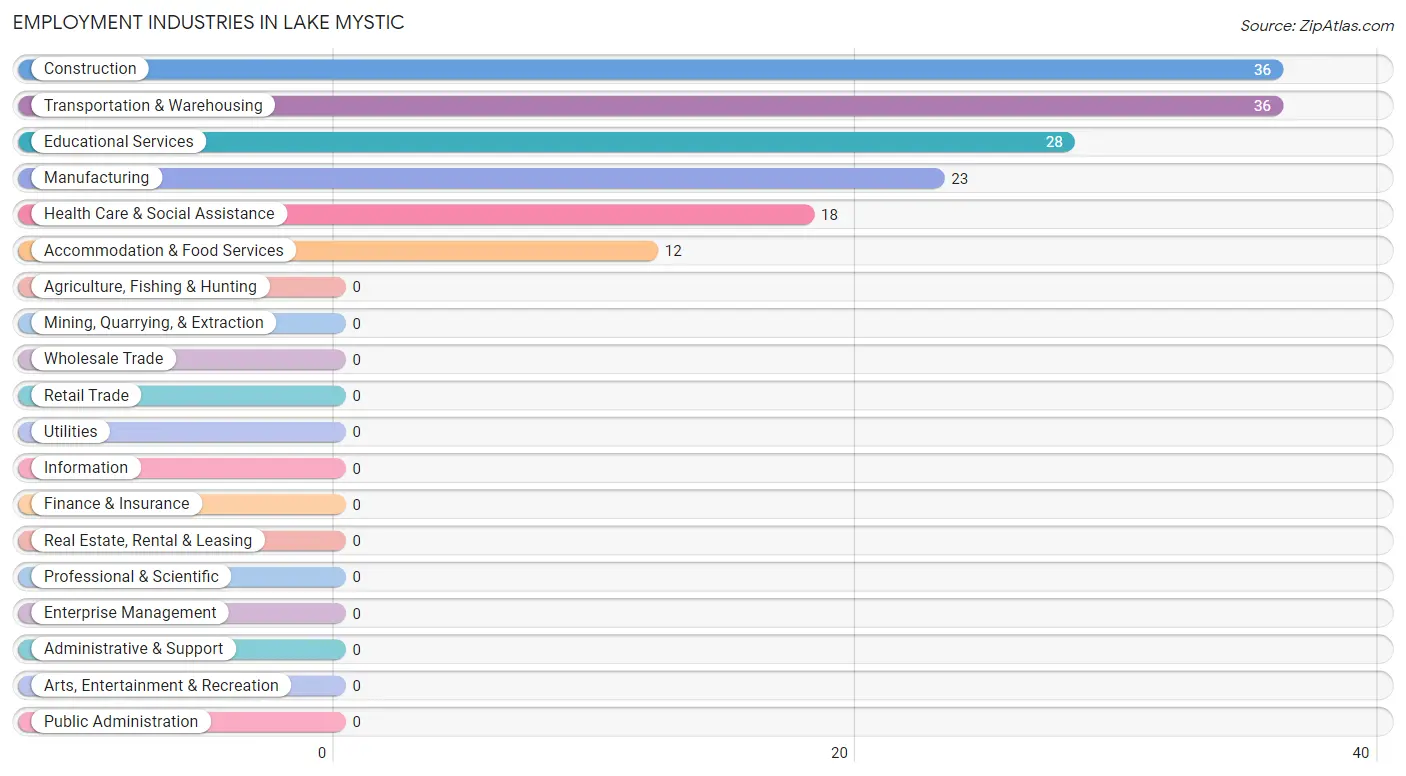
Employment Industries in Lake Mystic
The major employment industries in Lake Mystic include Construction (36 | 23.5%), Transportation & Warehousing (36 | 23.5%), Educational Services (28 | 18.3%), Manufacturing (23 | 15.0%), and Health Care & Social Assistance (18 | 11.8%).
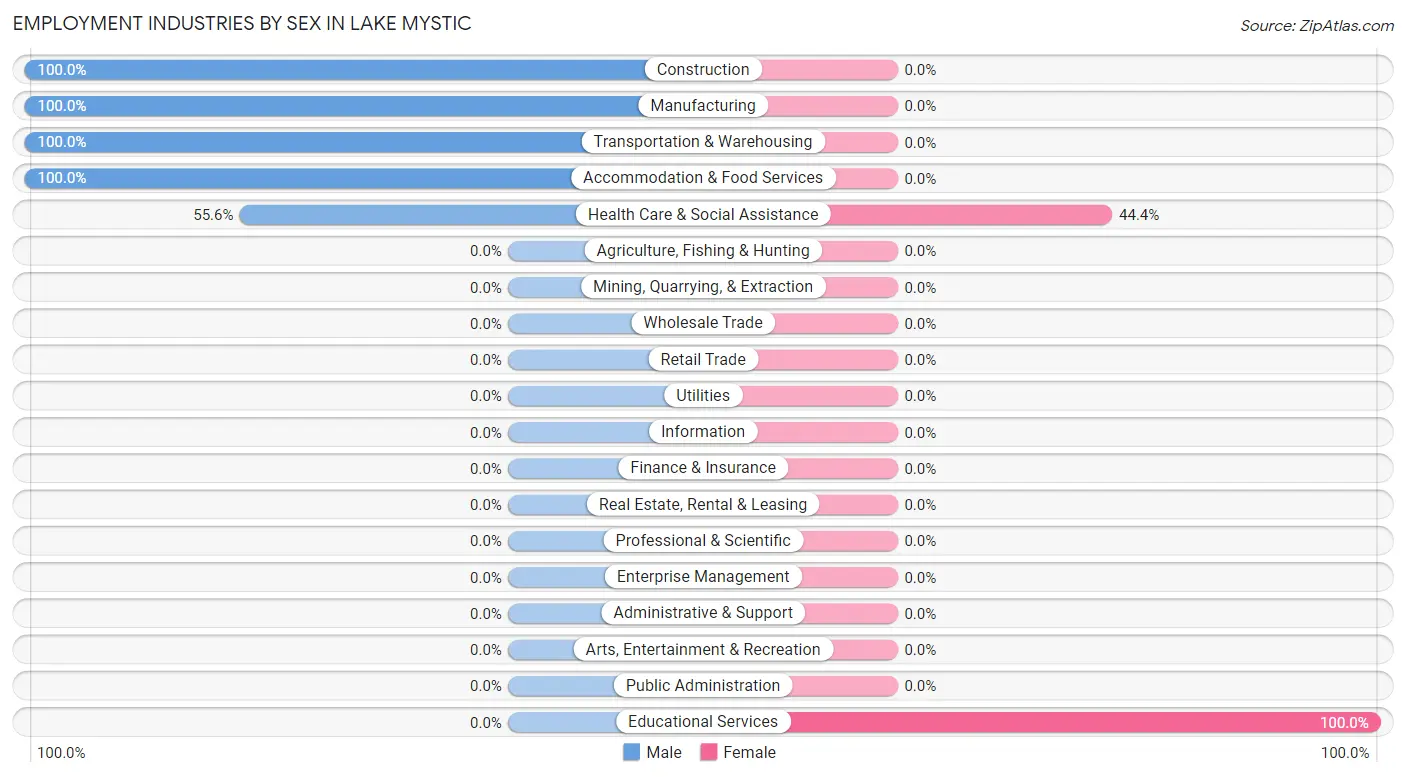
Employment Industries by Sex in Lake Mystic
The Lake Mystic industries that see more men than women are Construction (100.0%), Manufacturing (100.0%), and Transportation & Warehousing (100.0%), whereas the industries that tend to have a higher number of women are Educational Services (100.0%), and Health Care & Social Assistance (44.4%).
| Industry | Male | Female |
| Agriculture, Fishing & Hunting | 0 (0.0%) | 0 (0.0%) |
| Mining, Quarrying, & Extraction | 0 (0.0%) | 0 (0.0%) |
| Construction | 36 (100.0%) | 0 (0.0%) |
| Manufacturing | 23 (100.0%) | 0 (0.0%) |
| Wholesale Trade | 0 (0.0%) | 0 (0.0%) |
| Retail Trade | 0 (0.0%) | 0 (0.0%) |
| Transportation & Warehousing | 36 (100.0%) | 0 (0.0%) |
| Utilities | 0 (0.0%) | 0 (0.0%) |
| Information | 0 (0.0%) | 0 (0.0%) |
| Finance & Insurance | 0 (0.0%) | 0 (0.0%) |
| Real Estate, Rental & Leasing | 0 (0.0%) | 0 (0.0%) |
| Professional & Scientific | 0 (0.0%) | 0 (0.0%) |
| Enterprise Management | 0 (0.0%) | 0 (0.0%) |
| Administrative & Support | 0 (0.0%) | 0 (0.0%) |
| Educational Services | 0 (0.0%) | 28 (100.0%) |
| Health Care & Social Assistance | 10 (55.6%) | 8 (44.4%) |
| Arts, Entertainment & Recreation | 0 (0.0%) | 0 (0.0%) |
| Accommodation & Food Services | 12 (100.0%) | 0 (0.0%) |
| Public Administration | 0 (0.0%) | 0 (0.0%) |
| Total | 117 (76.5%) | 36 (23.5%) |
Education in Lake Mystic
School Enrollment in Lake Mystic
The most common levels of schooling among the 151 students in Lake Mystic are elementary school (48 | 31.8%), middle school (40 | 26.5%), and high school (33 | 21.8%).
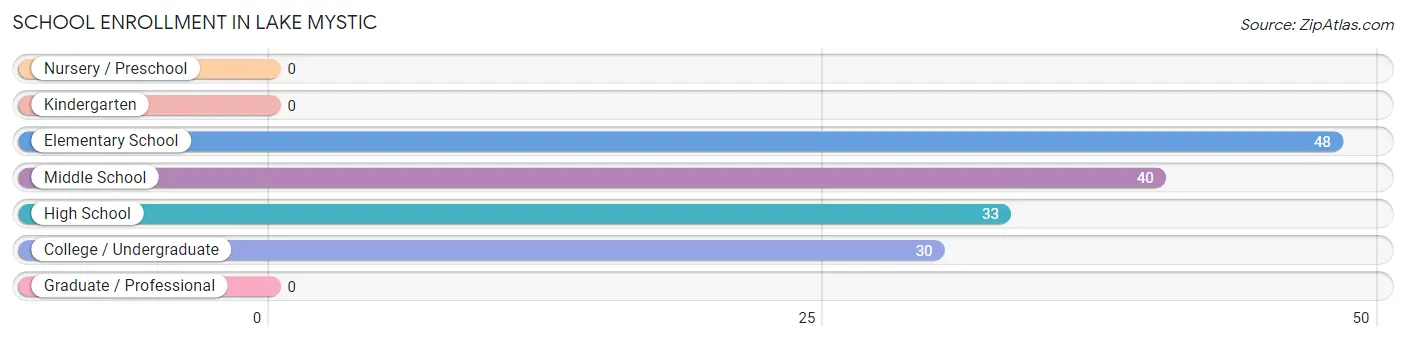
| School Level | # Students | % Students |
| Nursery / Preschool | 0 | 0.0% |
| Kindergarten | 0 | 0.0% |
| Elementary School | 48 | 31.8% |
| Middle School | 40 | 26.5% |
| High School | 33 | 21.8% |
| College / Undergraduate | 30 | 19.9% |
| Graduate / Professional | 0 | 0.0% |
| Total | 151 | 100.0% |
School Enrollment by Age by Funding Source in Lake Mystic
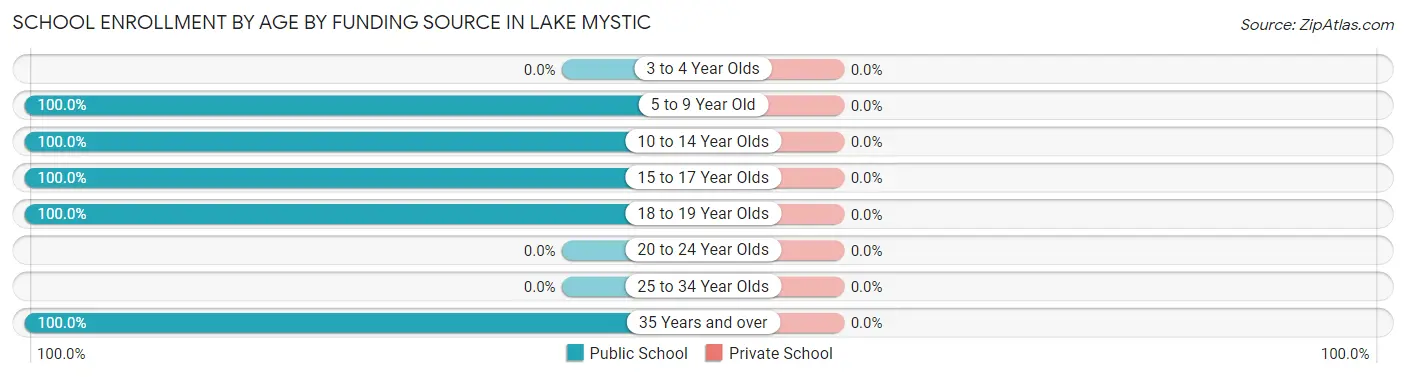
| Age Bracket | Public School | Private School |
| 3 to 4 Year Olds | 0 (0.0%) | 0 (0.0%) |
| 5 to 9 Year Old | 48 (100.0%) | 0 (0.0%) |
| 10 to 14 Year Olds | 40 (100.0%) | 0 (0.0%) |
| 15 to 17 Year Olds | 33 (100.0%) | 0 (0.0%) |
| 18 to 19 Year Olds | 12 (100.0%) | 0 (0.0%) |
| 20 to 24 Year Olds | 0 (0.0%) | 0 (0.0%) |
| 25 to 34 Year Olds | 0 (0.0%) | 0 (0.0%) |
| 35 Years and over | 18 (100.0%) | 0 (0.0%) |
| Total | 151 (100.0%) | 0 (0.0%) |
Educational Attainment by Field of Study in Lake Mystic
Education (52 | 25.9%), physical & health sciences (31 | 15.4%), engineering (30 | 14.9%), psychology (19 | 9.5%), and social sciences (19 | 9.5%) are the most common fields of study among 201 individuals in Lake Mystic who have obtained a bachelor's degree or higher.
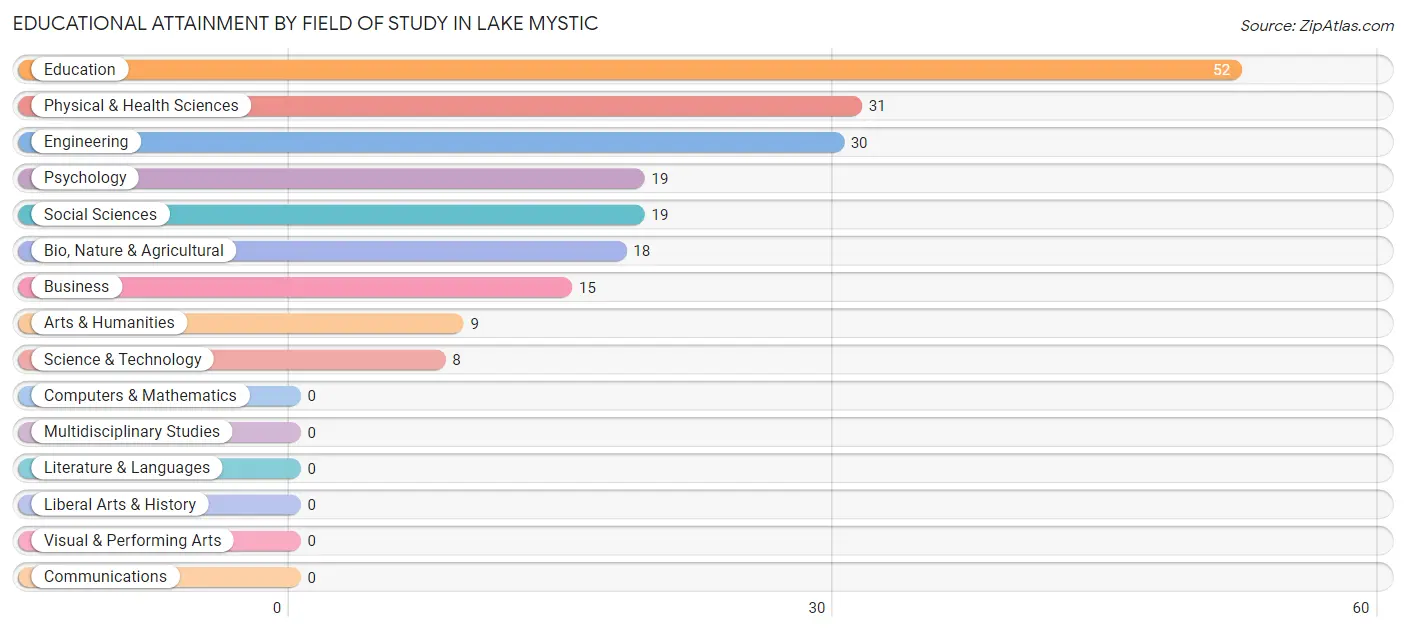
| Field of Study | # Graduates | % Graduates |
| Computers & Mathematics | 0 | 0.0% |
| Bio, Nature & Agricultural | 18 | 9.0% |
| Physical & Health Sciences | 31 | 15.4% |
| Psychology | 19 | 9.5% |
| Social Sciences | 19 | 9.5% |
| Engineering | 30 | 14.9% |
| Multidisciplinary Studies | 0 | 0.0% |
| Science & Technology | 8 | 4.0% |
| Business | 15 | 7.5% |
| Education | 52 | 25.9% |
| Literature & Languages | 0 | 0.0% |
| Liberal Arts & History | 0 | 0.0% |
| Visual & Performing Arts | 0 | 0.0% |
| Communications | 0 | 0.0% |
| Arts & Humanities | 9 | 4.5% |
| Total | 201 | 100.0% |
Transportation & Commute in Lake Mystic
Vehicle Availability by Sex in Lake Mystic
The most prevalent vehicle ownership categories in Lake Mystic are males with 2 vehicles (48, accounting for 41.0%) and females with 2 vehicles (8, making up 133.3%).
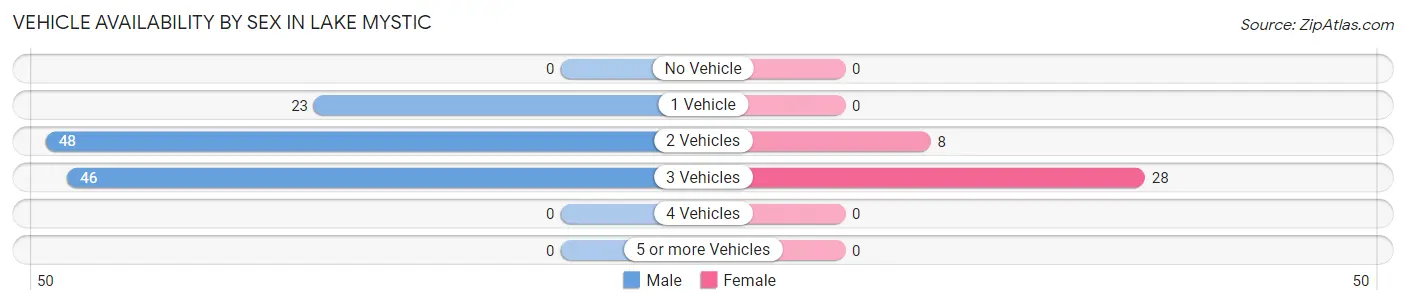
| Vehicles Available | Male | Female |
| No Vehicle | 0 (0.0%) | 0 (0.0%) |
| 1 Vehicle | 23 (19.7%) | 0 (0.0%) |
| 2 Vehicles | 48 (41.0%) | 8 (22.2%) |
| 3 Vehicles | 46 (39.3%) | 28 (77.8%) |
| 4 Vehicles | 0 (0.0%) | 0 (0.0%) |
| 5 or more Vehicles | 0 (0.0%) | 0 (0.0%) |
| Total | 117 (100.0%) | 36 (100.0%) |
Commute Time in Lake Mystic
The most frequently occuring commute durations in Lake Mystic are 20 to 24 minutes (59 commuters, 38.6%), 45 to 59 minutes (25 commuters, 16.3%), and less than 5 minutes (23 commuters, 15.0%).
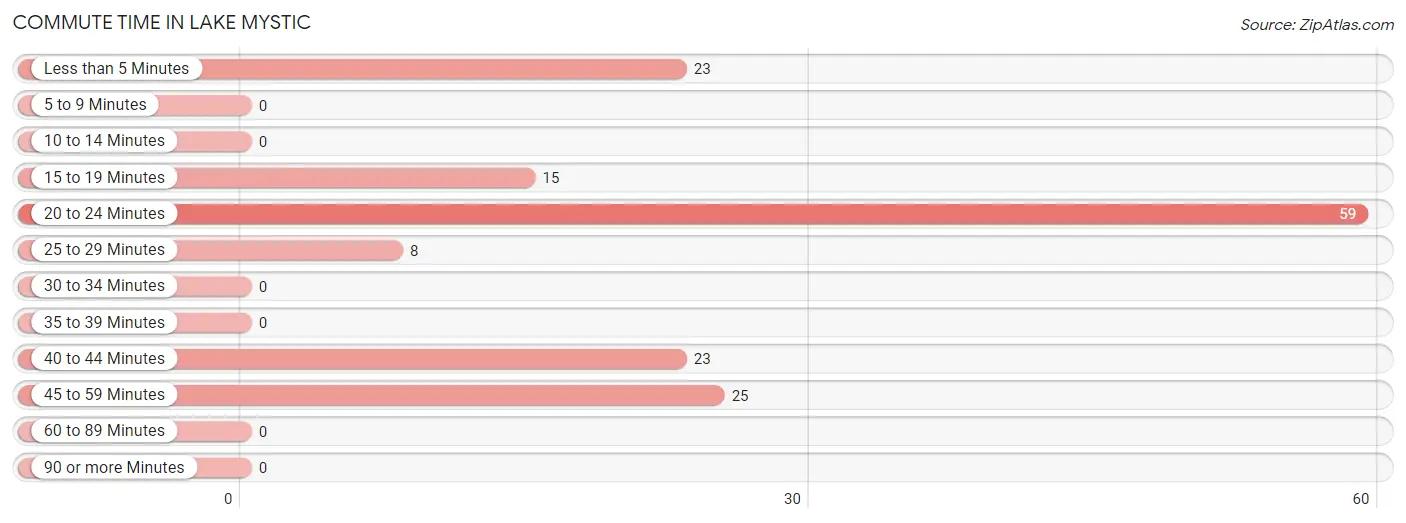
| Commute Time | # Commuters | % Commuters |
| Less than 5 Minutes | 23 | 15.0% |
| 5 to 9 Minutes | 0 | 0.0% |
| 10 to 14 Minutes | 0 | 0.0% |
| 15 to 19 Minutes | 15 | 9.8% |
| 20 to 24 Minutes | 59 | 38.6% |
| 25 to 29 Minutes | 8 | 5.2% |
| 30 to 34 Minutes | 0 | 0.0% |
| 35 to 39 Minutes | 0 | 0.0% |
| 40 to 44 Minutes | 23 | 15.0% |
| 45 to 59 Minutes | 25 | 16.3% |
| 60 to 89 Minutes | 0 | 0.0% |
| 90 or more Minutes | 0 | 0.0% |
Commute Time by Sex in Lake Mystic
The most common commute times in Lake Mystic are 20 to 24 minutes (59 commuters, 50.4%) for males and 15 to 19 minutes (15 commuters, 41.7%) for females.
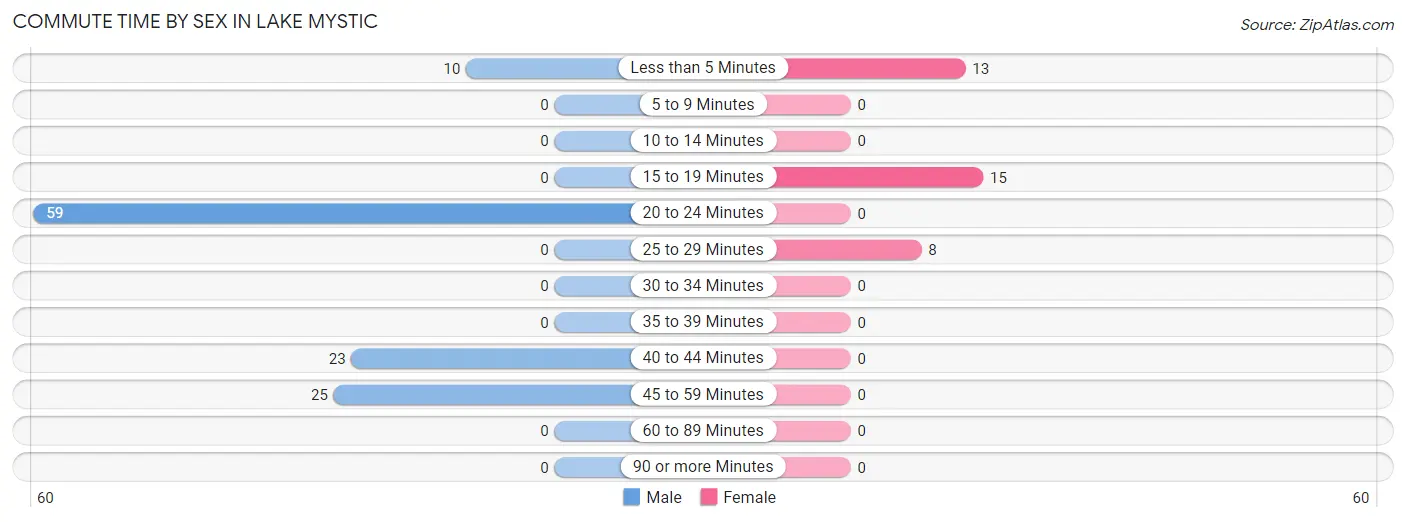
| Commute Time | Male | Female |
| Less than 5 Minutes | 10 (8.6%) | 13 (36.1%) |
| 5 to 9 Minutes | 0 (0.0%) | 0 (0.0%) |
| 10 to 14 Minutes | 0 (0.0%) | 0 (0.0%) |
| 15 to 19 Minutes | 0 (0.0%) | 15 (41.7%) |
| 20 to 24 Minutes | 59 (50.4%) | 0 (0.0%) |
| 25 to 29 Minutes | 0 (0.0%) | 8 (22.2%) |
| 30 to 34 Minutes | 0 (0.0%) | 0 (0.0%) |
| 35 to 39 Minutes | 0 (0.0%) | 0 (0.0%) |
| 40 to 44 Minutes | 23 (19.7%) | 0 (0.0%) |
| 45 to 59 Minutes | 25 (21.4%) | 0 (0.0%) |
| 60 to 89 Minutes | 0 (0.0%) | 0 (0.0%) |
| 90 or more Minutes | 0 (0.0%) | 0 (0.0%) |
Time of Departure to Work by Sex in Lake Mystic
The most frequent times of departure to work in Lake Mystic are 6:30 AM to 6:59 AM (30, 25.6%) for males and 7:30 AM to 7:59 AM (15, 41.7%) for females.
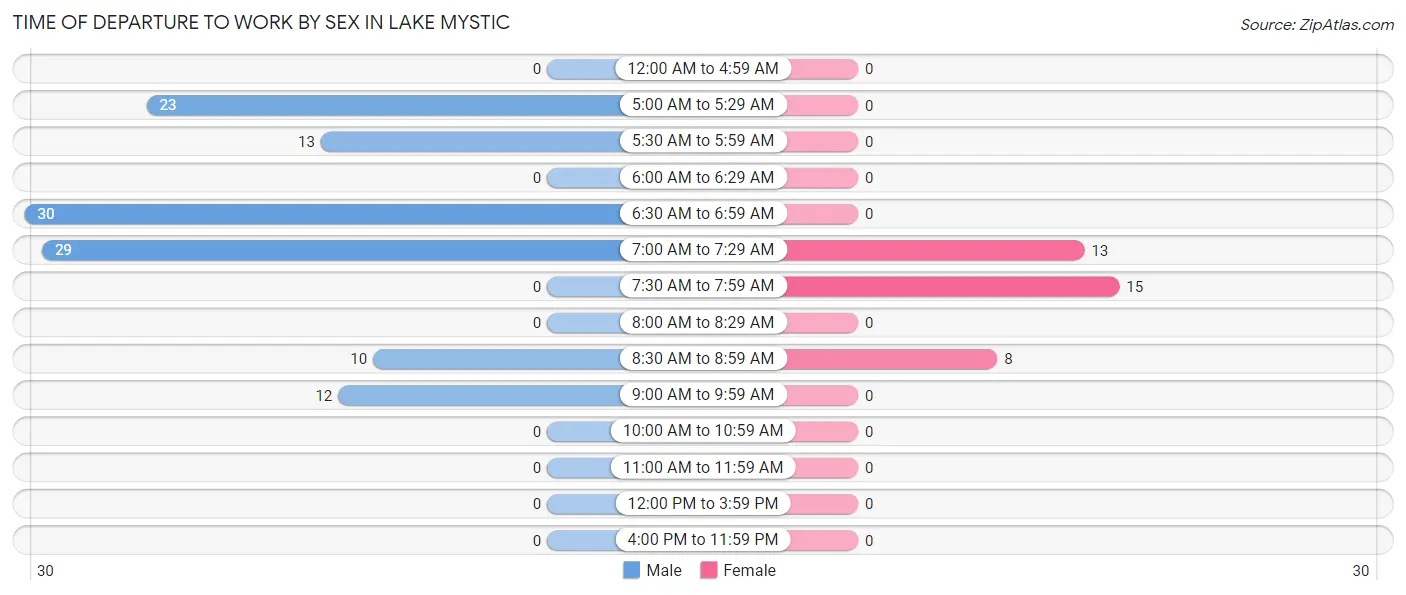
| Time of Departure | Male | Female |
| 12:00 AM to 4:59 AM | 0 (0.0%) | 0 (0.0%) |
| 5:00 AM to 5:29 AM | 23 (19.7%) | 0 (0.0%) |
| 5:30 AM to 5:59 AM | 13 (11.1%) | 0 (0.0%) |
| 6:00 AM to 6:29 AM | 0 (0.0%) | 0 (0.0%) |
| 6:30 AM to 6:59 AM | 30 (25.6%) | 0 (0.0%) |
| 7:00 AM to 7:29 AM | 29 (24.8%) | 13 (36.1%) |
| 7:30 AM to 7:59 AM | 0 (0.0%) | 15 (41.7%) |
| 8:00 AM to 8:29 AM | 0 (0.0%) | 0 (0.0%) |
| 8:30 AM to 8:59 AM | 10 (8.6%) | 8 (22.2%) |
| 9:00 AM to 9:59 AM | 12 (10.3%) | 0 (0.0%) |
| 10:00 AM to 10:59 AM | 0 (0.0%) | 0 (0.0%) |
| 11:00 AM to 11:59 AM | 0 (0.0%) | 0 (0.0%) |
| 12:00 PM to 3:59 PM | 0 (0.0%) | 0 (0.0%) |
| 4:00 PM to 11:59 PM | 0 (0.0%) | 0 (0.0%) |
| Total | 117 (100.0%) | 36 (100.0%) |
Housing Occupancy in Lake Mystic
Occupancy by Ownership in Lake Mystic
Of the total 215 dwellings in Lake Mystic, owner-occupied units account for 102 (47.4%), while renter-occupied units make up 113 (52.6%).
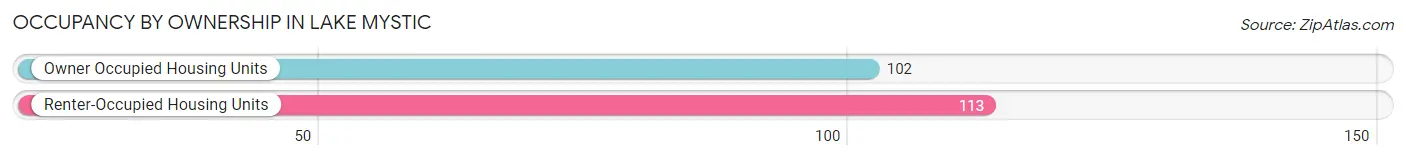
| Occupancy | # Housing Units | % Housing Units |
| Owner Occupied Housing Units | 102 | 47.4% |
| Renter-Occupied Housing Units | 113 | 52.6% |
| Total Occupied Housing Units | 215 | 100.0% |
Occupancy by Household Size in Lake Mystic
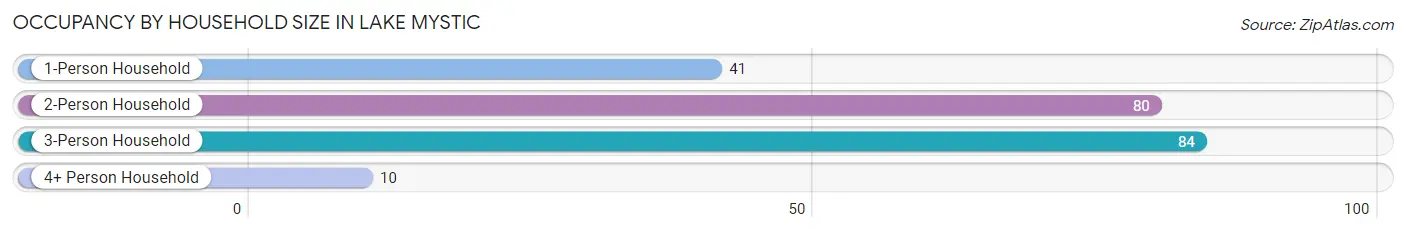
| Household Size | # Housing Units | % Housing Units |
| 1-Person Household | 41 | 19.1% |
| 2-Person Household | 80 | 37.2% |
| 3-Person Household | 84 | 39.1% |
| 4+ Person Household | 10 | 4.6% |
| Total Housing Units | 215 | 100.0% |
Occupancy by Ownership by Household Size in Lake Mystic
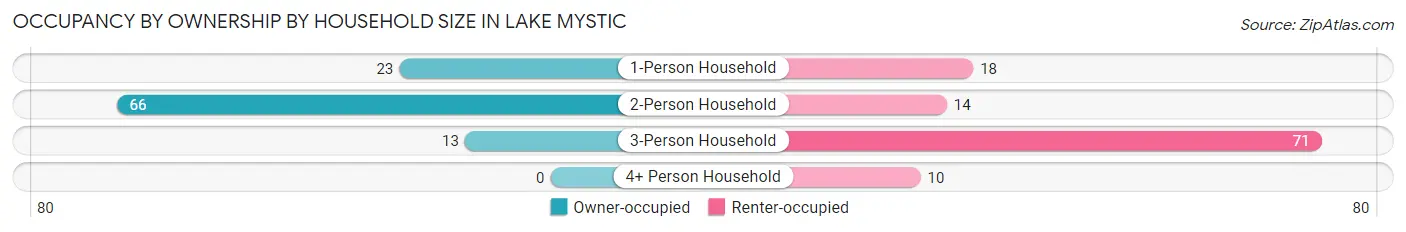
| Household Size | Owner-occupied | Renter-occupied |
| 1-Person Household | 23 (56.1%) | 18 (43.9%) |
| 2-Person Household | 66 (82.5%) | 14 (17.5%) |
| 3-Person Household | 13 (15.5%) | 71 (84.5%) |
| 4+ Person Household | 0 (0.0%) | 10 (100.0%) |
| Total Housing Units | 102 (47.4%) | 113 (52.6%) |
Occupancy by Educational Attainment in Lake Mystic
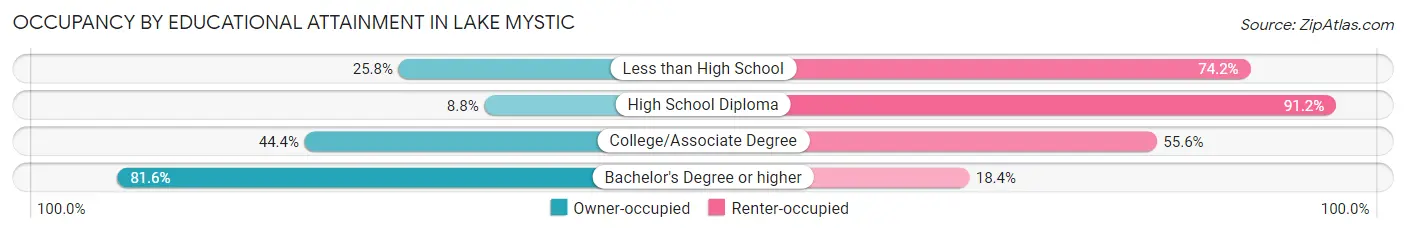
| Household Size | Owner-occupied | Renter-occupied |
| Less than High School | 8 (25.8%) | 23 (74.2%) |
| High School Diploma | 6 (8.8%) | 62 (91.2%) |
| College/Associate Degree | 8 (44.4%) | 10 (55.6%) |
| Bachelor's Degree or higher | 80 (81.6%) | 18 (18.4%) |
Occupancy by Age of Householder in Lake Mystic
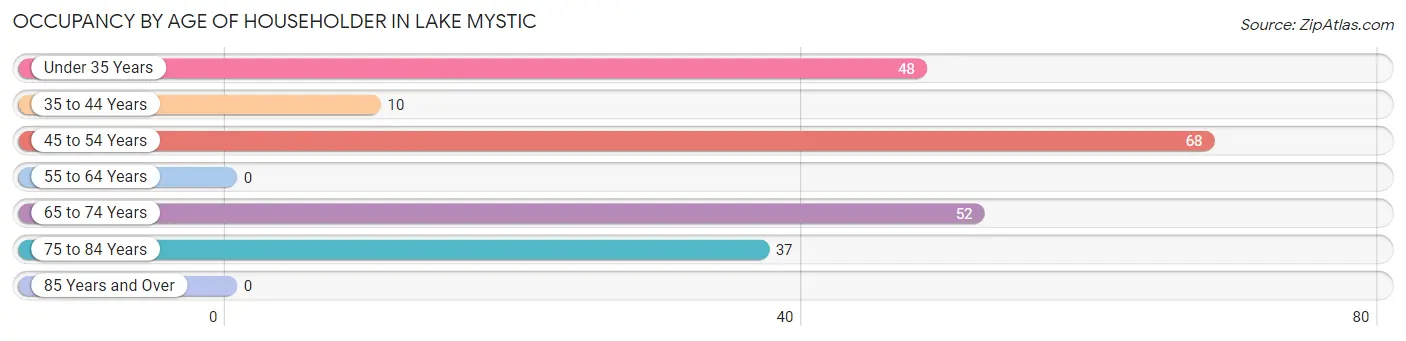
| Age Bracket | # Households | % Households |
| Under 35 Years | 48 | 22.3% |
| 35 to 44 Years | 10 | 4.6% |
| 45 to 54 Years | 68 | 31.6% |
| 55 to 64 Years | 0 | 0.0% |
| 65 to 74 Years | 52 | 24.2% |
| 75 to 84 Years | 37 | 17.2% |
| 85 Years and Over | 0 | 0.0% |
| Total | 215 | 100.0% |
Housing Finances in Lake Mystic
Median Income by Occupancy in Lake Mystic
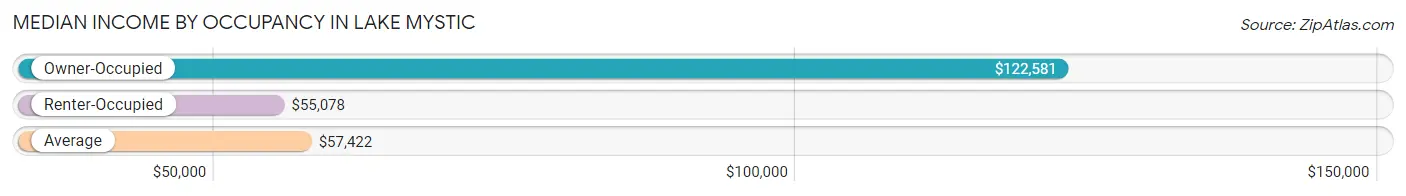
| Occupancy Type | # Households | Median Income |
| Owner-Occupied | 102 (47.4%) | $122,581 |
| Renter-Occupied | 113 (52.6%) | $55,078 |
| Average | 215 (100.0%) | $57,422 |
Occupancy by Householder Income Bracket in Lake Mystic
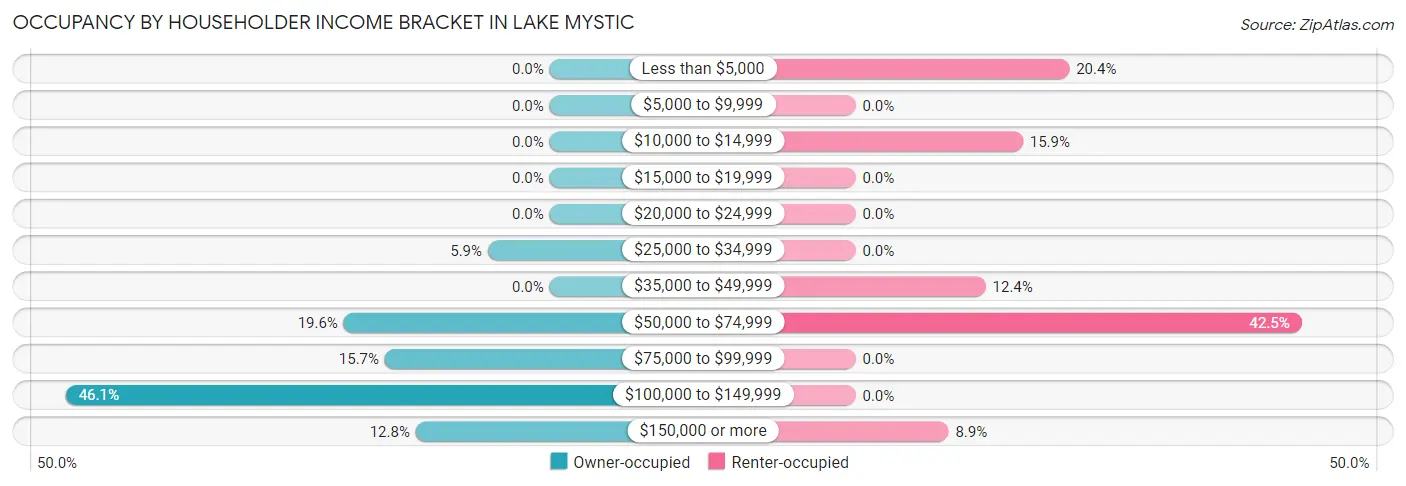
| Income Bracket | Owner-occupied | Renter-occupied |
| Less than $5,000 | 0 (0.0%) | 23 (20.3%) |
| $5,000 to $9,999 | 0 (0.0%) | 0 (0.0%) |
| $10,000 to $14,999 | 0 (0.0%) | 18 (15.9%) |
| $15,000 to $19,999 | 0 (0.0%) | 0 (0.0%) |
| $20,000 to $24,999 | 0 (0.0%) | 0 (0.0%) |
| $25,000 to $34,999 | 6 (5.9%) | 0 (0.0%) |
| $35,000 to $49,999 | 0 (0.0%) | 14 (12.4%) |
| $50,000 to $74,999 | 20 (19.6%) | 48 (42.5%) |
| $75,000 to $99,999 | 16 (15.7%) | 0 (0.0%) |
| $100,000 to $149,999 | 47 (46.1%) | 0 (0.0%) |
| $150,000 or more | 13 (12.8%) | 10 (8.8%) |
| Total | 102 (100.0%) | 113 (100.0%) |
Monthly Housing Cost Tiers in Lake Mystic
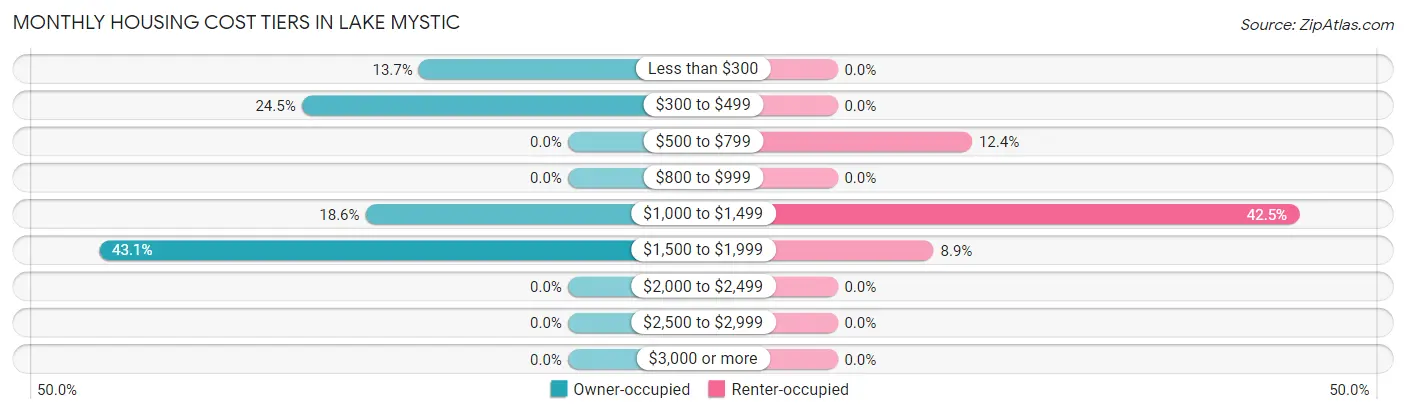
| Monthly Cost | Owner-occupied | Renter-occupied |
| Less than $300 | 14 (13.7%) | 0 (0.0%) |
| $300 to $499 | 25 (24.5%) | 0 (0.0%) |
| $500 to $799 | 0 (0.0%) | 14 (12.4%) |
| $800 to $999 | 0 (0.0%) | 0 (0.0%) |
| $1,000 to $1,499 | 19 (18.6%) | 48 (42.5%) |
| $1,500 to $1,999 | 44 (43.1%) | 10 (8.8%) |
| $2,000 to $2,499 | 0 (0.0%) | 0 (0.0%) |
| $2,500 to $2,999 | 0 (0.0%) | 0 (0.0%) |
| $3,000 or more | 0 (0.0%) | 0 (0.0%) |
| Total | 102 (100.0%) | 113 (100.0%) |
Physical Housing Characteristics in Lake Mystic
Housing Structures in Lake Mystic
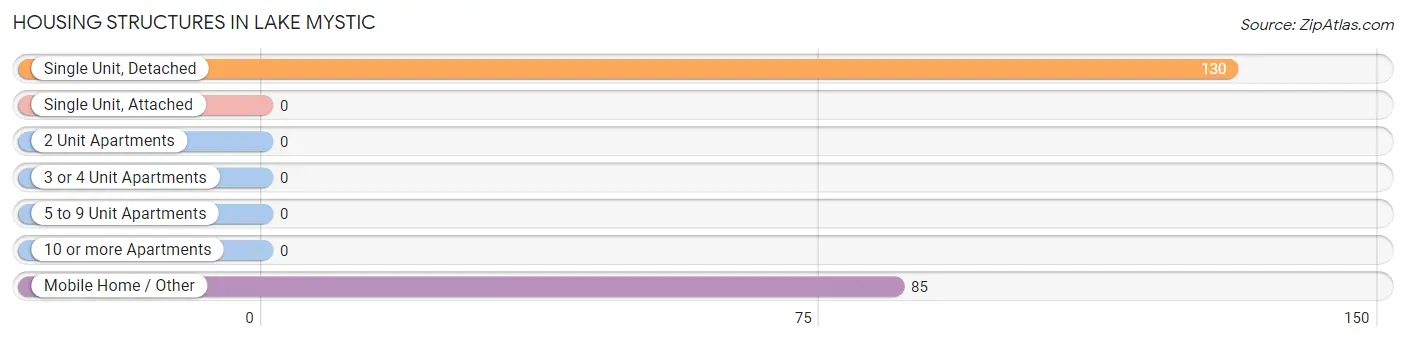
| Structure Type | # Housing Units | % Housing Units |
| Single Unit, Detached | 130 | 60.5% |
| Single Unit, Attached | 0 | 0.0% |
| 2 Unit Apartments | 0 | 0.0% |
| 3 or 4 Unit Apartments | 0 | 0.0% |
| 5 to 9 Unit Apartments | 0 | 0.0% |
| 10 or more Apartments | 0 | 0.0% |
| Mobile Home / Other | 85 | 39.5% |
| Total | 215 | 100.0% |
Housing Structures by Occupancy in Lake Mystic
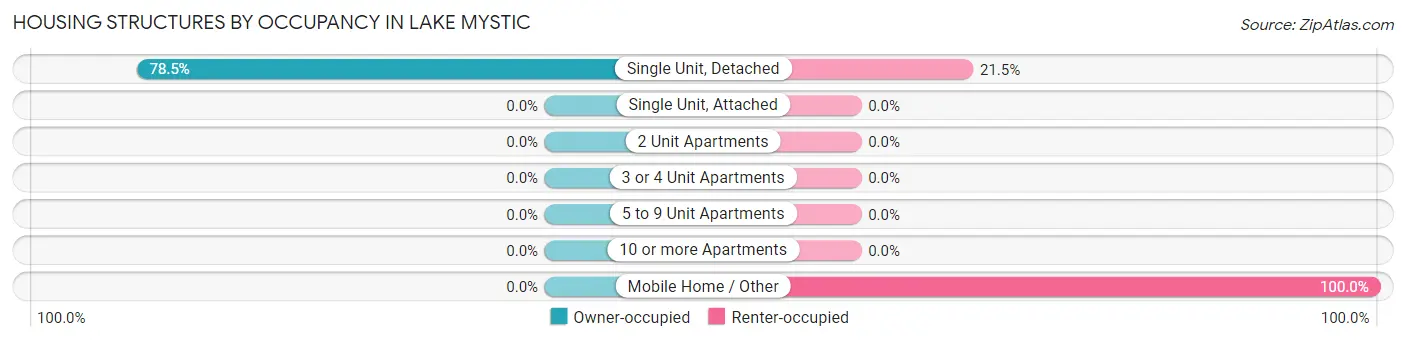
| Structure Type | Owner-occupied | Renter-occupied |
| Single Unit, Detached | 102 (78.5%) | 28 (21.5%) |
| Single Unit, Attached | 0 (0.0%) | 0 (0.0%) |
| 2 Unit Apartments | 0 (0.0%) | 0 (0.0%) |
| 3 or 4 Unit Apartments | 0 (0.0%) | 0 (0.0%) |
| 5 to 9 Unit Apartments | 0 (0.0%) | 0 (0.0%) |
| 10 or more Apartments | 0 (0.0%) | 0 (0.0%) |
| Mobile Home / Other | 0 (0.0%) | 85 (100.0%) |
| Total | 102 (47.4%) | 113 (52.6%) |
Housing Structures by Number of Rooms in Lake Mystic
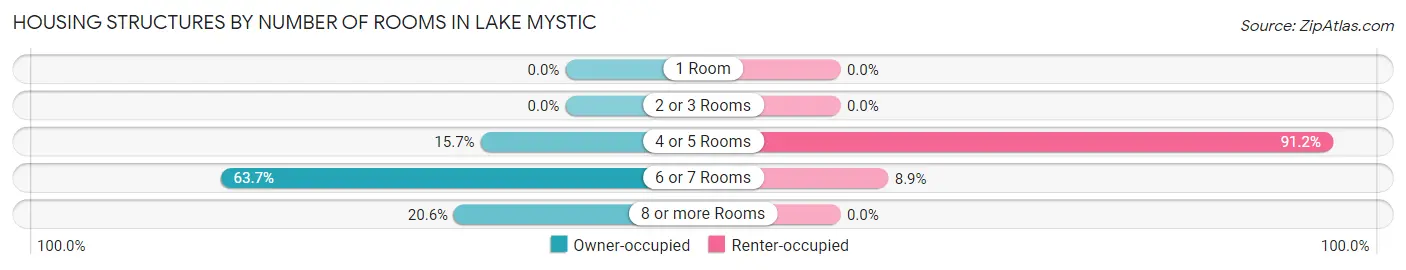
| Number of Rooms | Owner-occupied | Renter-occupied |
| 1 Room | 0 (0.0%) | 0 (0.0%) |
| 2 or 3 Rooms | 0 (0.0%) | 0 (0.0%) |
| 4 or 5 Rooms | 16 (15.7%) | 103 (91.1%) |
| 6 or 7 Rooms | 65 (63.7%) | 10 (8.8%) |
| 8 or more Rooms | 21 (20.6%) | 0 (0.0%) |
| Total | 102 (100.0%) | 113 (100.0%) |
Housing Structure by Heating Type in Lake Mystic
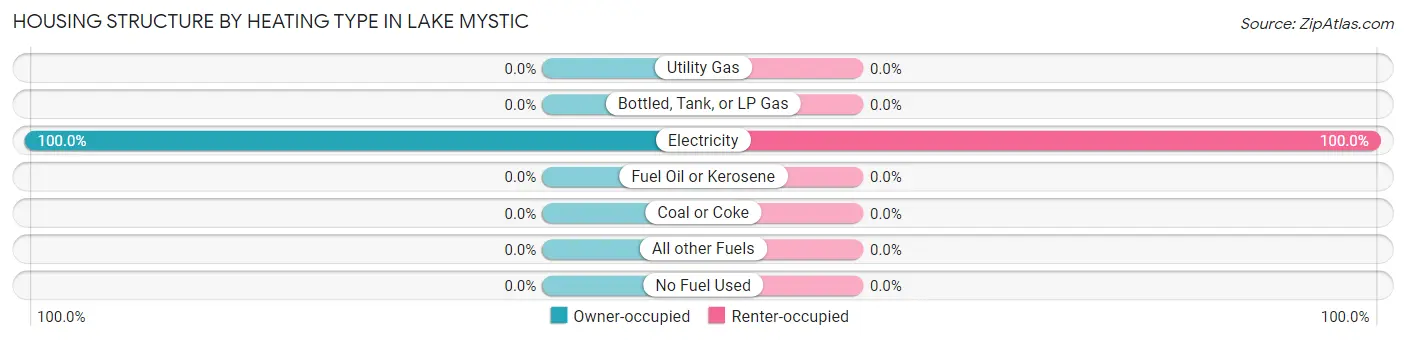
| Heating Type | Owner-occupied | Renter-occupied |
| Utility Gas | 0 (0.0%) | 0 (0.0%) |
| Bottled, Tank, or LP Gas | 0 (0.0%) | 0 (0.0%) |
| Electricity | 102 (100.0%) | 113 (100.0%) |
| Fuel Oil or Kerosene | 0 (0.0%) | 0 (0.0%) |
| Coal or Coke | 0 (0.0%) | 0 (0.0%) |
| All other Fuels | 0 (0.0%) | 0 (0.0%) |
| No Fuel Used | 0 (0.0%) | 0 (0.0%) |
| Total | 102 (100.0%) | 113 (100.0%) |
Household Vehicle Usage in Lake Mystic
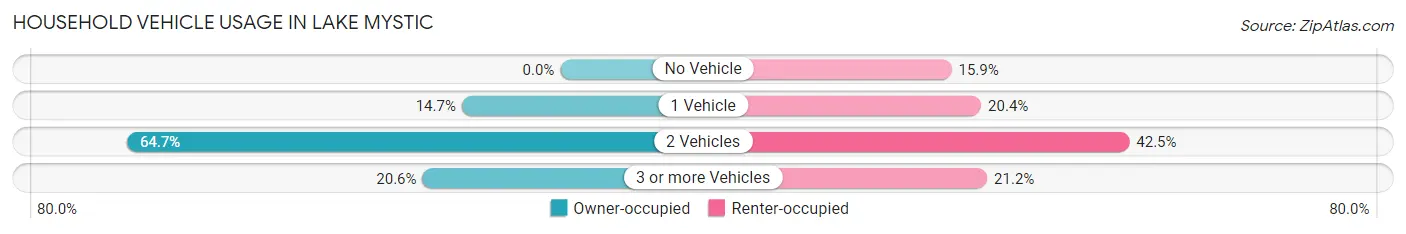
| Vehicles per Household | Owner-occupied | Renter-occupied |
| No Vehicle | 0 (0.0%) | 18 (15.9%) |
| 1 Vehicle | 15 (14.7%) | 23 (20.3%) |
| 2 Vehicles | 66 (64.7%) | 48 (42.5%) |
| 3 or more Vehicles | 21 (20.6%) | 24 (21.2%) |
| Total | 102 (100.0%) | 113 (100.0%) |
Real Estate & Mortgages in Lake Mystic
Real Estate and Mortgage Overview in Lake Mystic
| Characteristic | Without Mortgage | With Mortgage |
| Housing Units | 39 | 63 |
| Median Property Value | $220,800 | $328,400 |
| Median Household Income | $86,406 | $13 |
| Monthly Housing Costs | $381 | $0 |
| Real Estate Taxes | $1,297 | $0 |
Property Value by Mortgage Status in Lake Mystic
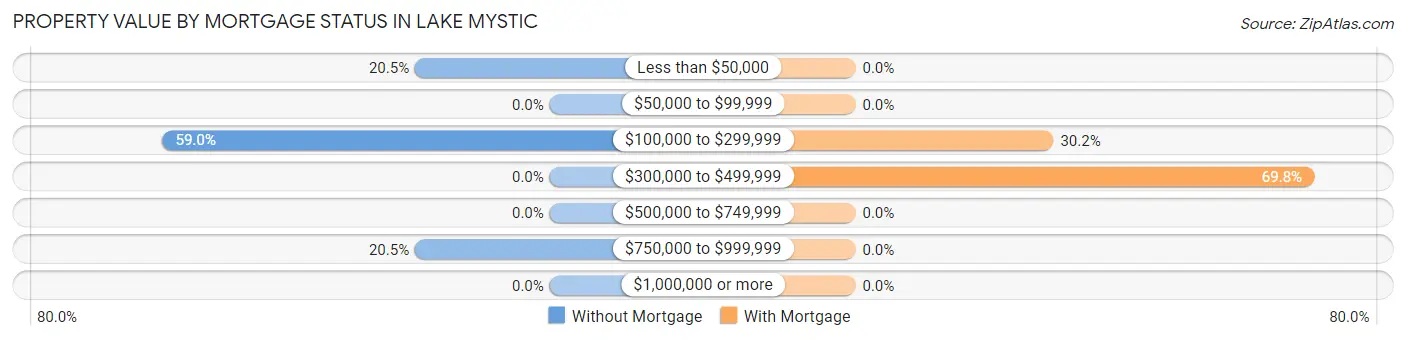
| Property Value | Without Mortgage | With Mortgage |
| Less than $50,000 | 8 (20.5%) | 0 (0.0%) |
| $50,000 to $99,999 | 0 (0.0%) | 0 (0.0%) |
| $100,000 to $299,999 | 23 (59.0%) | 19 (30.2%) |
| $300,000 to $499,999 | 0 (0.0%) | 44 (69.8%) |
| $500,000 to $749,999 | 0 (0.0%) | 0 (0.0%) |
| $750,000 to $999,999 | 8 (20.5%) | 0 (0.0%) |
| $1,000,000 or more | 0 (0.0%) | 0 (0.0%) |
| Total | 39 (100.0%) | 63 (100.0%) |
Household Income by Mortgage Status in Lake Mystic
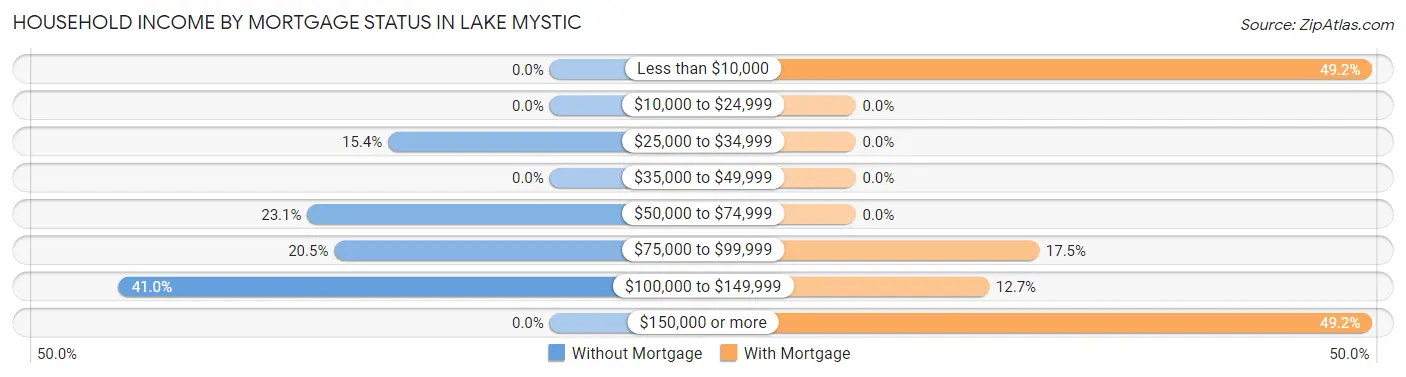
| Household Income | Without Mortgage | With Mortgage |
| Less than $10,000 | 0 (0.0%) | 31 (49.2%) |
| $10,000 to $24,999 | 0 (0.0%) | 0 (0.0%) |
| $25,000 to $34,999 | 6 (15.4%) | 0 (0.0%) |
| $35,000 to $49,999 | 0 (0.0%) | 0 (0.0%) |
| $50,000 to $74,999 | 9 (23.1%) | 0 (0.0%) |
| $75,000 to $99,999 | 8 (20.5%) | 11 (17.5%) |
| $100,000 to $149,999 | 16 (41.0%) | 8 (12.7%) |
| $150,000 or more | 0 (0.0%) | 31 (49.2%) |
| Total | 39 (100.0%) | 63 (100.0%) |
Property Value to Household Income Ratio in Lake Mystic
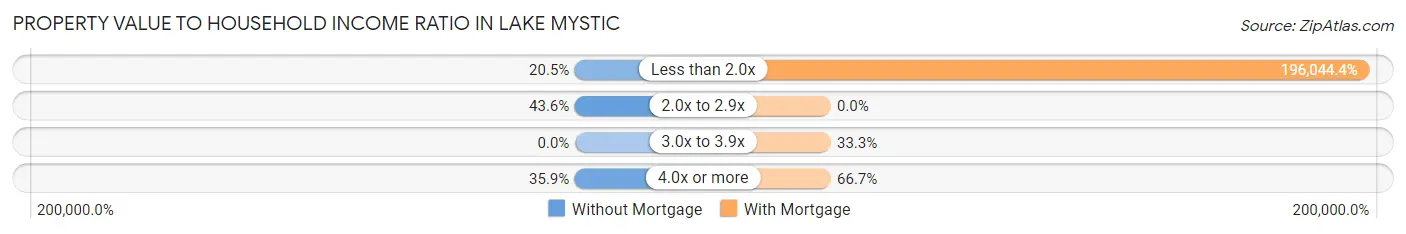
| Value-to-Income Ratio | Without Mortgage | With Mortgage |
| Less than 2.0x | 8 (20.5%) | 123,508 (196,044.4%) |
| 2.0x to 2.9x | 17 (43.6%) | 0 (0.0%) |
| 3.0x to 3.9x | 0 (0.0%) | 21 (33.3%) |
| 4.0x or more | 14 (35.9%) | 42 (66.7%) |
| Total | 39 (100.0%) | 63 (100.0%) |
Real Estate Taxes by Mortgage Status in Lake Mystic
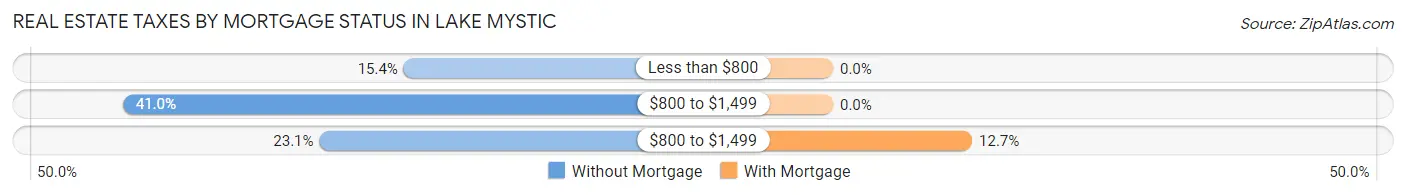
| Property Taxes | Without Mortgage | With Mortgage |
| Less than $800 | 6 (15.4%) | 0 (0.0%) |
| $800 to $1,499 | 16 (41.0%) | 0 (0.0%) |
| $800 to $1,499 | 9 (23.1%) | 8 (12.7%) |
| Total | 39 (100.0%) | 63 (100.0%) |
Health & Disability in Lake Mystic
Health Insurance Coverage by Age in Lake Mystic
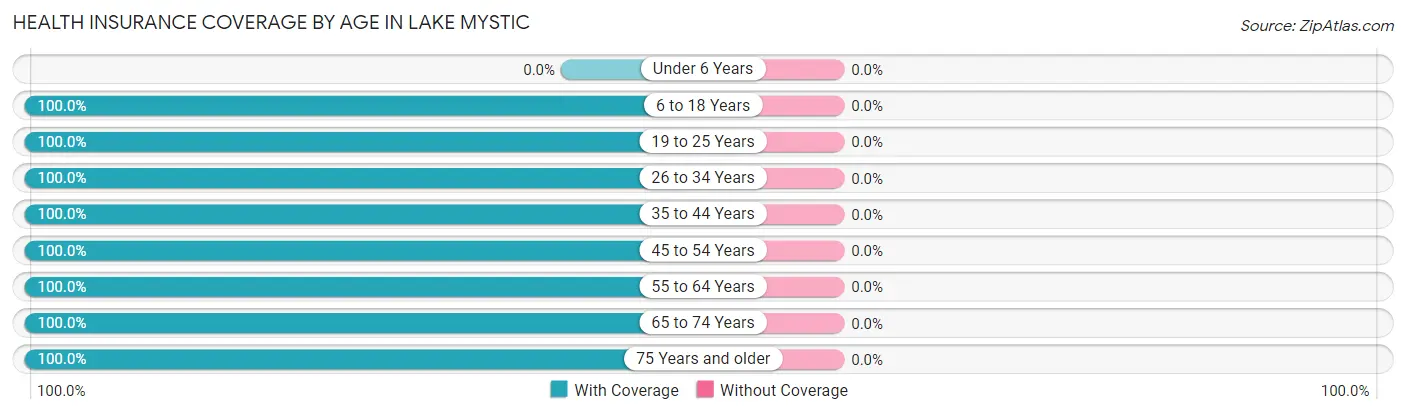
| Age Bracket | With Coverage | Without Coverage |
| Under 6 Years | 0 (0.0%) | 0 (0.0%) |
| 6 to 18 Years | 121 (100.0%) | 0 (0.0%) |
| 19 to 25 Years | 12 (100.0%) | 0 (0.0%) |
| 26 to 34 Years | 71 (100.0%) | 0 (0.0%) |
| 35 to 44 Years | 64 (100.0%) | 0 (0.0%) |
| 45 to 54 Years | 111 (100.0%) | 0 (0.0%) |
| 55 to 64 Years | 55 (100.0%) | 0 (0.0%) |
| 65 to 74 Years | 58 (100.0%) | 0 (0.0%) |
| 75 Years and older | 37 (100.0%) | 0 (0.0%) |
| Total | 529 (100.0%) | 0 (0.0%) |
Health Insurance Coverage by Citizenship Status in Lake Mystic
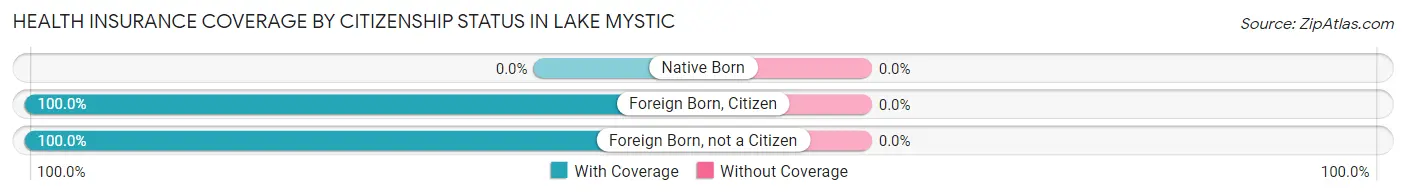
| Citizenship Status | With Coverage | Without Coverage |
| Native Born | 0 (0.0%) | 0 (0.0%) |
| Foreign Born, Citizen | 121 (100.0%) | 0 (0.0%) |
| Foreign Born, not a Citizen | 12 (100.0%) | 0 (0.0%) |
Health Insurance Coverage by Household Income in Lake Mystic
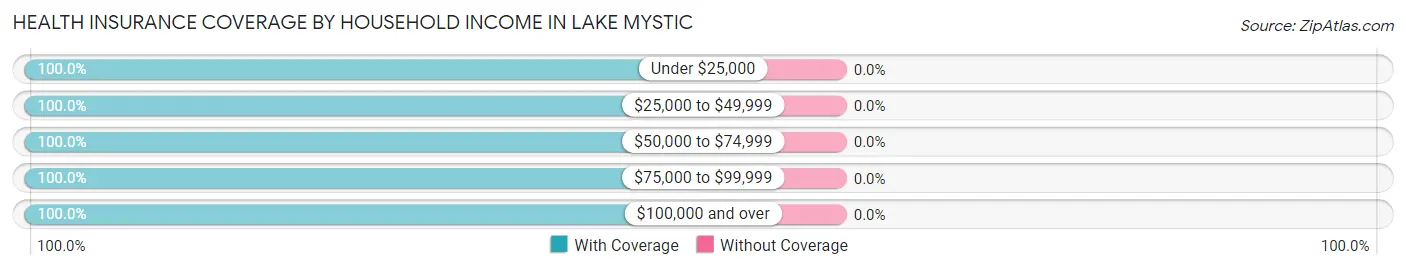
| Household Income | With Coverage | Without Coverage |
| Under $25,000 | 112 (100.0%) | 0 (0.0%) |
| $25,000 to $49,999 | 34 (100.0%) | 0 (0.0%) |
| $50,000 to $74,999 | 151 (100.0%) | 0 (0.0%) |
| $75,000 to $99,999 | 22 (100.0%) | 0 (0.0%) |
| $100,000 and over | 210 (100.0%) | 0 (0.0%) |
Public vs Private Health Insurance Coverage by Age in Lake Mystic
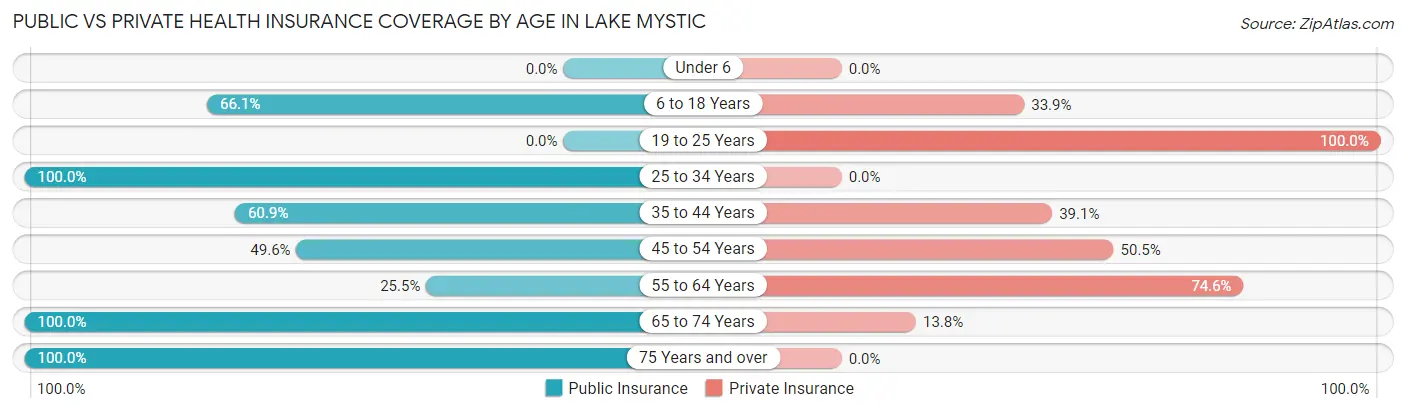
| Age Bracket | Public Insurance | Private Insurance |
| Under 6 | 0 (0.0%) | 0 (0.0%) |
| 6 to 18 Years | 80 (66.1%) | 41 (33.9%) |
| 19 to 25 Years | 0 (0.0%) | 12 (100.0%) |
| 25 to 34 Years | 71 (100.0%) | 0 (0.0%) |
| 35 to 44 Years | 39 (60.9%) | 25 (39.1%) |
| 45 to 54 Years | 55 (49.5%) | 56 (50.4%) |
| 55 to 64 Years | 14 (25.5%) | 41 (74.6%) |
| 65 to 74 Years | 58 (100.0%) | 8 (13.8%) |
| 75 Years and over | 37 (100.0%) | 0 (0.0%) |
| Total | 354 (66.9%) | 183 (34.6%) |
Disability Status by Sex by Age in Lake Mystic
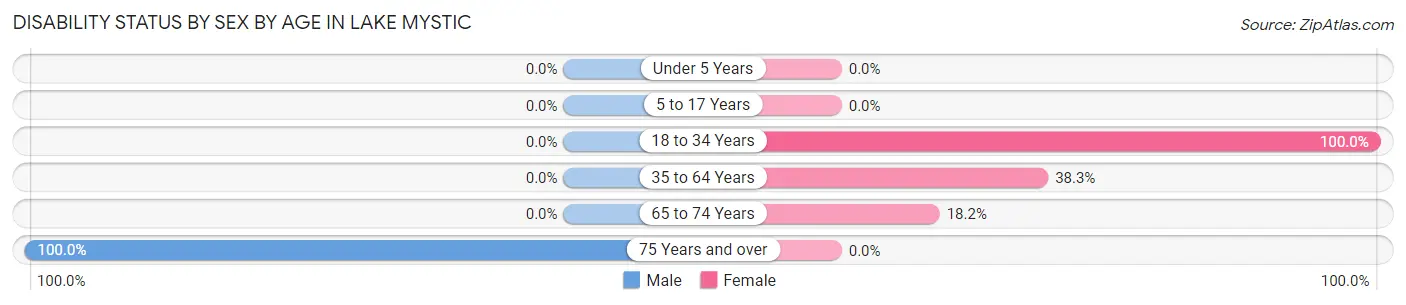
| Age Bracket | Male | Female |
| Under 5 Years | 0 (0.0%) | 0 (0.0%) |
| 5 to 17 Years | 0 (0.0%) | 0 (0.0%) |
| 18 to 34 Years | 0 (0.0%) | 48 (100.0%) |
| 35 to 64 Years | 0 (0.0%) | 59 (38.3%) |
| 65 to 74 Years | 0 (0.0%) | 8 (18.2%) |
| 75 Years and over | 37 (100.0%) | 0 (0.0%) |
Disability Class by Sex by Age in Lake Mystic
Disability Class: Hearing Difficulty
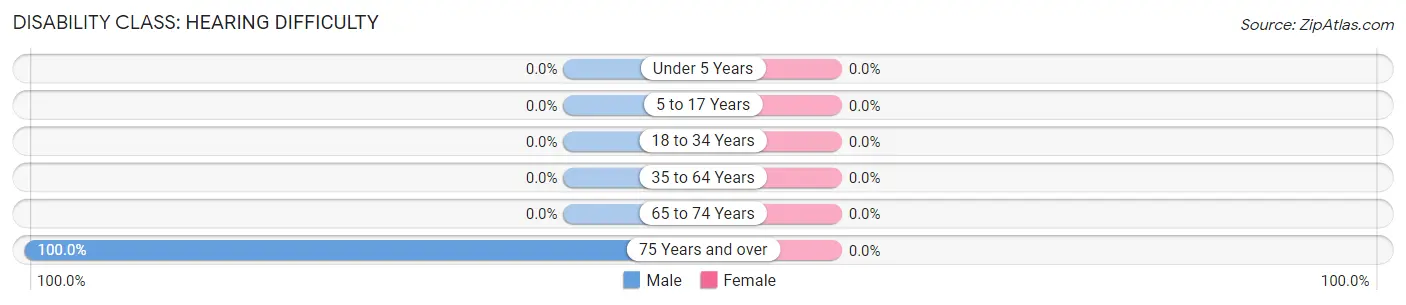
| Age Bracket | Male | Female |
| Under 5 Years | 0 (0.0%) | 0 (0.0%) |
| 5 to 17 Years | 0 (0.0%) | 0 (0.0%) |
| 18 to 34 Years | 0 (0.0%) | 0 (0.0%) |
| 35 to 64 Years | 0 (0.0%) | 0 (0.0%) |
| 65 to 74 Years | 0 (0.0%) | 0 (0.0%) |
| 75 Years and over | 37 (100.0%) | 0 (0.0%) |
Disability Class: Vision Difficulty
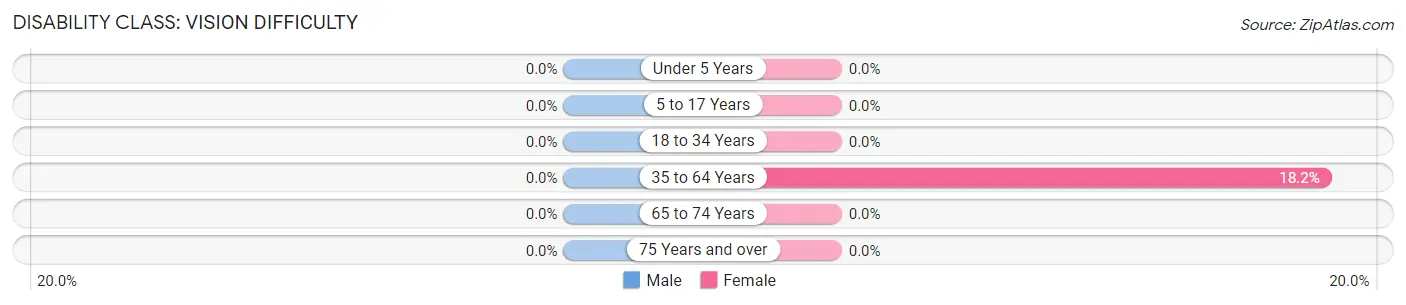
| Age Bracket | Male | Female |
| Under 5 Years | 0 (0.0%) | 0 (0.0%) |
| 5 to 17 Years | 0 (0.0%) | 0 (0.0%) |
| 18 to 34 Years | 0 (0.0%) | 0 (0.0%) |
| 35 to 64 Years | 0 (0.0%) | 28 (18.2%) |
| 65 to 74 Years | 0 (0.0%) | 0 (0.0%) |
| 75 Years and over | 0 (0.0%) | 0 (0.0%) |
Disability Class: Cognitive Difficulty
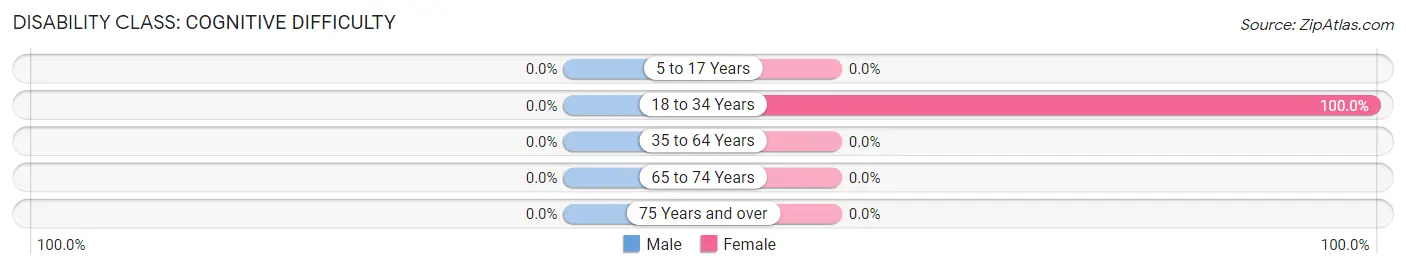
| Age Bracket | Male | Female |
| 5 to 17 Years | 0 (0.0%) | 0 (0.0%) |
| 18 to 34 Years | 0 (0.0%) | 48 (100.0%) |
| 35 to 64 Years | 0 (0.0%) | 0 (0.0%) |
| 65 to 74 Years | 0 (0.0%) | 0 (0.0%) |
| 75 Years and over | 0 (0.0%) | 0 (0.0%) |
Disability Class: Ambulatory Difficulty
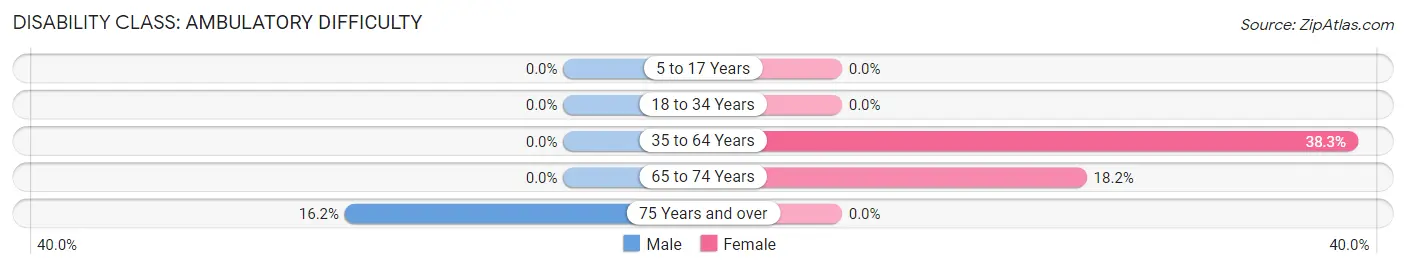
| Age Bracket | Male | Female |
| 5 to 17 Years | 0 (0.0%) | 0 (0.0%) |
| 18 to 34 Years | 0 (0.0%) | 0 (0.0%) |
| 35 to 64 Years | 0 (0.0%) | 59 (38.3%) |
| 65 to 74 Years | 0 (0.0%) | 8 (18.2%) |
| 75 Years and over | 6 (16.2%) | 0 (0.0%) |
Disability Class: Self-Care Difficulty
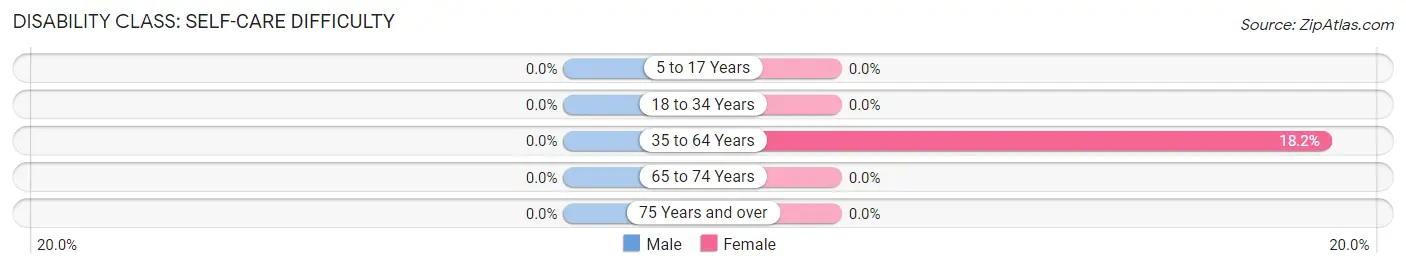
| Age Bracket | Male | Female |
| 5 to 17 Years | 0 (0.0%) | 0 (0.0%) |
| 18 to 34 Years | 0 (0.0%) | 0 (0.0%) |
| 35 to 64 Years | 0 (0.0%) | 28 (18.2%) |
| 65 to 74 Years | 0 (0.0%) | 0 (0.0%) |
| 75 Years and over | 0 (0.0%) | 0 (0.0%) |
Technology Access in Lake Mystic
Computing Device Access in Lake Mystic
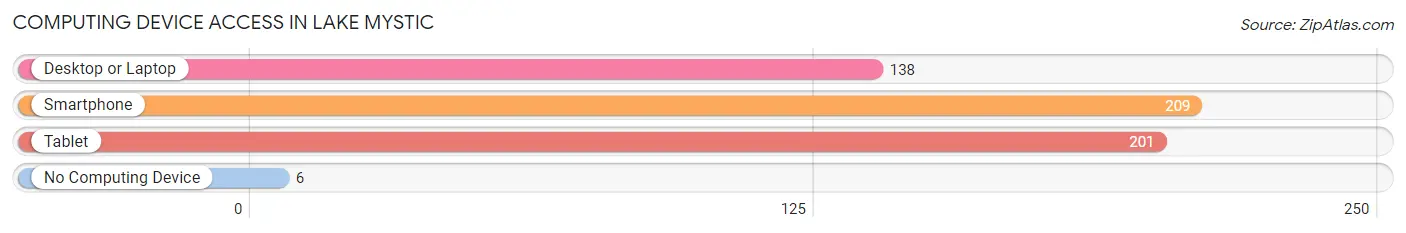
| Device Type | # Households | % Households |
| Desktop or Laptop | 138 | 64.2% |
| Smartphone | 209 | 97.2% |
| Tablet | 201 | 93.5% |
| No Computing Device | 6 | 2.8% |
| Total | 215 | 100.0% |
Internet Access in Lake Mystic
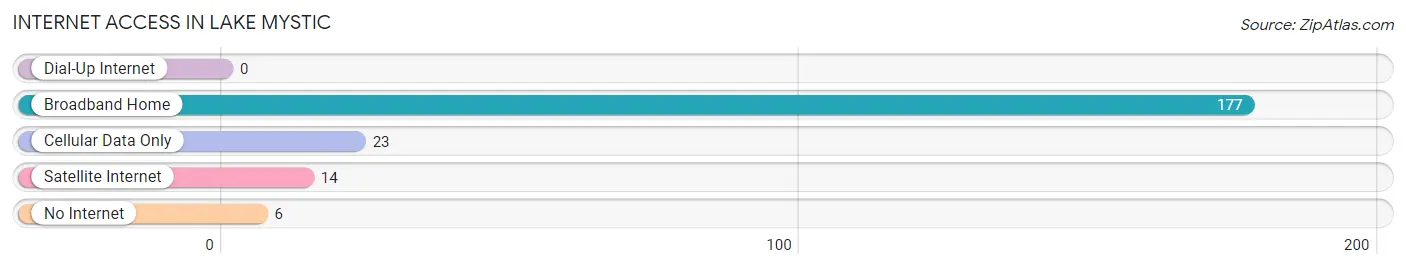
| Internet Type | # Households | % Households |
| Dial-Up Internet | 0 | 0.0% |
| Broadband Home | 177 | 82.3% |
| Cellular Data Only | 23 | 10.7% |
| Satellite Internet | 14 | 6.5% |
| No Internet | 6 | 2.8% |
| Total | 215 | 100.0% |
Lake Mystic Summary
History
Lake Mystic is a small lake located in the Florida Panhandle, in the town of Sneads, Jackson County. It is a popular destination for fishing, swimming, and other recreational activities. The lake was formed in the early 1900s when the Apalachicola River was dammed to create a reservoir for the nearby town of Sneads. The lake was named after the nearby Mystic Creek, which was named after a Seminole Indian chief who lived in the area.
The area around Lake Mystic has a long and varied history. The first inhabitants of the area were Native Americans, including the Apalachee, Creek, and Seminole tribes. The area was also home to a number of Spanish missions, which were established in the late 1600s. In the early 1800s, the area was part of the Spanish colony of West Florida. After the United States acquired the area in 1821, the area was part of the Territory of Florida.
In the late 1800s, the area around Lake Mystic began to be developed for agriculture. The area was home to a number of cotton plantations, as well as other crops such as corn, peanuts, and sweet potatoes. The area was also home to a number of sawmills and turpentine stills.
In the early 1900s, the area around Lake Mystic began to be developed for recreational purposes. The lake was dammed in the early 1900s to create a reservoir for the nearby town of Sneads. The lake was named after the nearby Mystic Creek, which was named after a Seminole Indian chief who lived in the area.
The area around Lake Mystic has been a popular destination for fishing, swimming, and other recreational activities since the early 1900s. The lake is home to a variety of fish, including largemouth bass, bluegill, and catfish. The lake is also home to a variety of wildlife, including deer, turkey, and alligators.
Geography
Lake Mystic is located in the Florida Panhandle, in the town of Sneads, Jackson County. The lake is approximately 1,000 acres in size and is located at an elevation of approximately 100 feet above sea level. The lake is fed by the Apalachicola River and is surrounded by a variety of natural habitats, including cypress swamps, hardwood forests, and wetlands.
The lake is located in a rural area, with the nearest major city being Tallahassee, which is approximately 40 miles away. The lake is accessible by a number of roads, including US Highway 90 and State Road 71.
Economy
The economy of the area around Lake Mystic is largely based on tourism and recreation. The lake is a popular destination for fishing, swimming, and other recreational activities. The lake is also home to a number of marinas, boat ramps, and other recreational facilities.
The area is also home to a number of businesses, including restaurants, convenience stores, and gas stations. The area is also home to a number of agricultural operations, including cotton plantations, corn farms, and peanut farms.
Demographics
The population of the area around Lake Mystic is approximately 4,000 people. The population is largely white, with approximately 75% of the population being white. The remaining 25% of the population is made up of African Americans, Hispanics, and other ethnicities.
The median household income in the area is approximately $35,000 per year. The median home value is approximately $100,000. The area is largely rural, with the nearest major city being Tallahassee, which is approximately 40 miles away.
Common Questions
What is Per Capita Income in Lake Mystic?
Per Capita income in Lake Mystic is $34,874.
What is the Median Household income in Lake Mystic?
Median Household Income in Lake Mystic is $57,422.
What is Inequality or Gini Index in Lake Mystic?
Inequality or Gini Index in Lake Mystic is 0.41.
What is the Total Population of Lake Mystic?
Total Population of Lake Mystic is 529.
What is the Total Male Population of Lake Mystic?
Total Male Population of Lake Mystic is 243.
What is the Total Female Population of Lake Mystic?
Total Female Population of Lake Mystic is 286.
What is the Ratio of Males per 100 Females in Lake Mystic?
There are 84.97 Males per 100 Females in Lake Mystic.
What is the Ratio of Females per 100 Males in Lake Mystic?
There are 117.70 Females per 100 Males in Lake Mystic.
What is the Median Population Age in Lake Mystic?
Median Population Age in Lake Mystic is 42.8 Years.
What is the Average Family Size in Lake Mystic
Average Family Size in Lake Mystic is 2.6 People.
What is the Average Household Size in Lake Mystic
Average Household Size in Lake Mystic is 2.5 People.
How Large is the Labor Force in Lake Mystic?
There are 201 People in the Labor Forcein in Lake Mystic.
What is the Percentage of People in the Labor Force in Lake Mystic?
46.7% of People are in the Labor Force in Lake Mystic.
What is the Unemployment Rate in Lake Mystic?
Unemployment Rate in Lake Mystic is 23.9%.