South Patrick Shores, FL Map & Demographics
South Patrick Shores Map
South Patrick Shores Overview
$52,461
PER CAPITA INCOME
$105,208
AVG FAMILY INCOME
$81,964
AVG HOUSEHOLD INCOME
15.9%
WAGE / INCOME GAP [ % ]
84.1¢/ $1
WAGE / INCOME GAP [ $ ]
0.45
INEQUALITY / GINI INDEX
6,899
TOTAL POPULATION
3,359
MALE POPULATION
3,540
FEMALE POPULATION
94.89
MALES / 100 FEMALES
105.39
FEMALES / 100 MALES
52.4
MEDIAN AGE
3.1
AVG FAMILY SIZE
2.3
AVG HOUSEHOLD SIZE
3,384
LABOR FORCE [ PEOPLE ]
56.0%
PERCENT IN LABOR FORCE
3.5%
UNEMPLOYMENT RATE
Income in South Patrick Shores
Income Overview in South Patrick Shores
Per Capita Income in South Patrick Shores is $52,461, while median incomes of families and households are $105,208 and $81,964 respectively.
| Characteristic | Number | Measure |
| Per Capita Income | 6,899 | $52,461 |
| Median Family Income | 1,804 | $105,208 |
| Mean Family Income | 1,804 | $148,353 |
| Median Household Income | 2,976 | $81,964 |
| Mean Household Income | 2,976 | $119,111 |
| Income Deficit | 1,804 | $0 |
| Wage / Income Gap (%) | 6,899 | 15.85% |
| Wage / Income Gap ($) | 6,899 | 84.15¢ per $1 |
| Gini / Inequality Index | 6,899 | 0.45 |
Earnings by Sex in South Patrick Shores
Average Earnings in South Patrick Shores are $46,684, $53,851 for men and $45,315 for women, a difference of 15.9%.
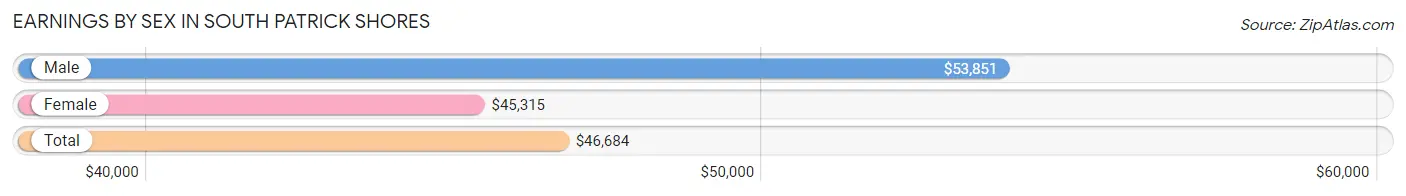
| Sex | Number | Average Earnings |
| Male | 1,718 (50.2%) | $53,851 |
| Female | 1,702 (49.8%) | $45,315 |
| Total | 3,420 (100.0%) | $46,684 |
Earnings by Sex by Income Bracket in South Patrick Shores
The most common earnings brackets in South Patrick Shores are $100,000+ for men (557 | 32.4%) and $75,000 to $99,999 for women (245 | 14.4%).
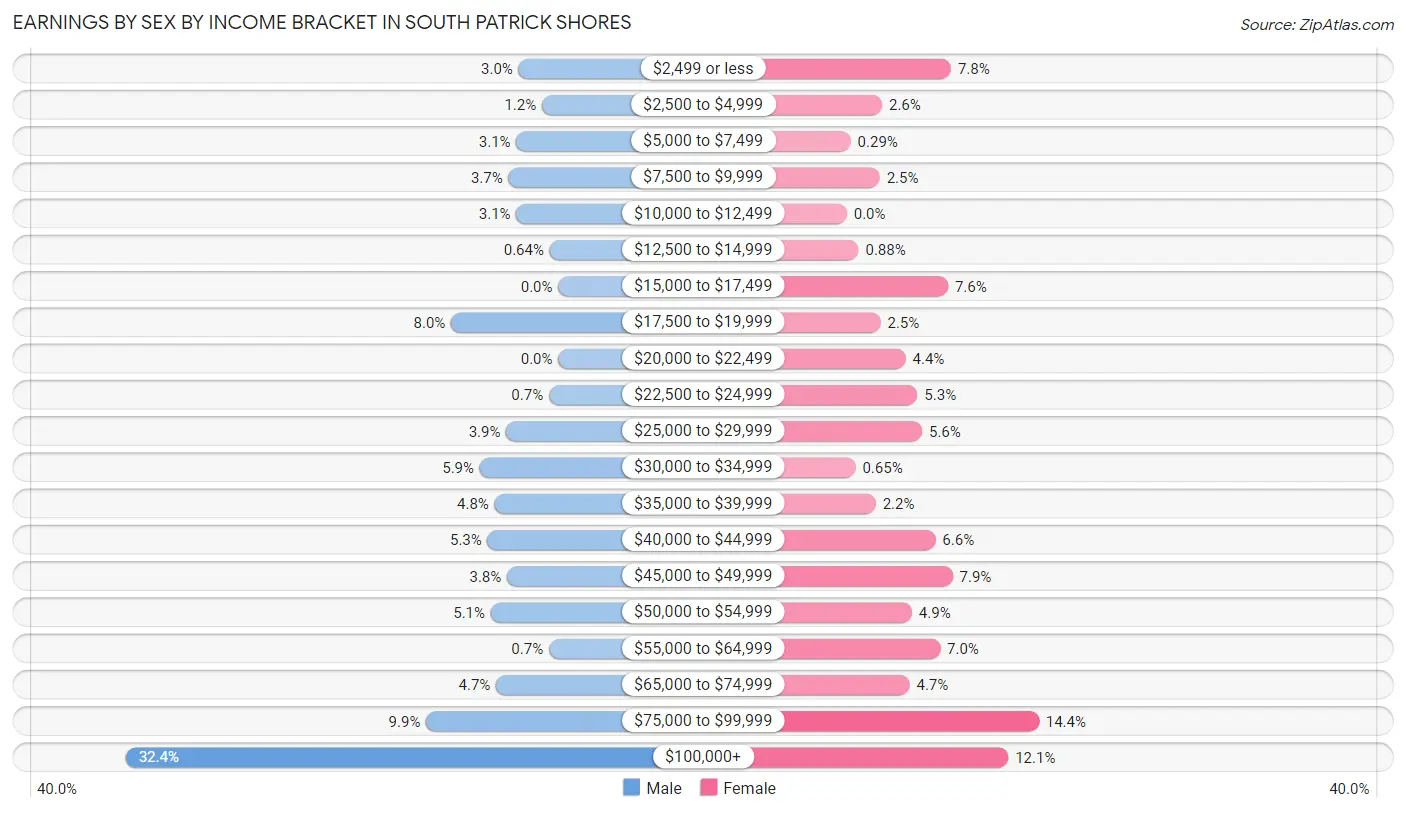
| Income | Male | Female |
| $2,499 or less | 51 (3.0%) | 133 (7.8%) |
| $2,500 to $4,999 | 21 (1.2%) | 45 (2.6%) |
| $5,000 to $7,499 | 54 (3.1%) | 5 (0.3%) |
| $7,500 to $9,999 | 64 (3.7%) | 42 (2.5%) |
| $10,000 to $12,499 | 54 (3.1%) | 0 (0.0%) |
| $12,500 to $14,999 | 11 (0.6%) | 15 (0.9%) |
| $15,000 to $17,499 | 0 (0.0%) | 129 (7.6%) |
| $17,500 to $19,999 | 138 (8.0%) | 43 (2.5%) |
| $20,000 to $22,499 | 0 (0.0%) | 75 (4.4%) |
| $22,500 to $24,999 | 12 (0.7%) | 90 (5.3%) |
| $25,000 to $29,999 | 67 (3.9%) | 96 (5.6%) |
| $30,000 to $34,999 | 101 (5.9%) | 11 (0.6%) |
| $35,000 to $39,999 | 82 (4.8%) | 37 (2.2%) |
| $40,000 to $44,999 | 91 (5.3%) | 113 (6.6%) |
| $45,000 to $49,999 | 66 (3.8%) | 135 (7.9%) |
| $50,000 to $54,999 | 87 (5.1%) | 83 (4.9%) |
| $55,000 to $64,999 | 12 (0.7%) | 119 (7.0%) |
| $65,000 to $74,999 | 80 (4.7%) | 80 (4.7%) |
| $75,000 to $99,999 | 170 (9.9%) | 245 (14.4%) |
| $100,000+ | 557 (32.4%) | 206 (12.1%) |
| Total | 1,718 (100.0%) | 1,702 (100.0%) |
Earnings by Sex by Educational Attainment in South Patrick Shores
Average earnings in South Patrick Shores are $75,223 for men and $46,102 for women, a difference of 38.7%. Men with an educational attainment of graduate degree enjoy the highest average annual earnings of $135,774, while those with high school diploma education earn the least with $42,431. Women with an educational attainment of bachelor's degree earn the most with the average annual earnings of $46,588, while those with college or associate's degree education have the smallest earnings of $43,525.
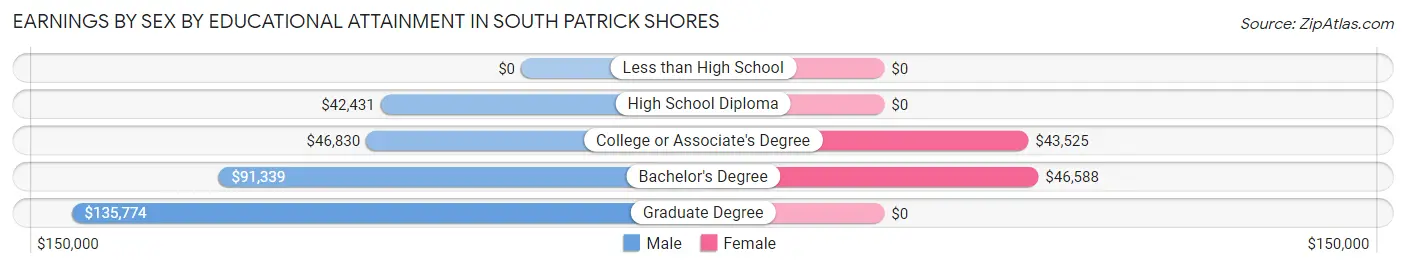
| Educational Attainment | Male Income | Female Income |
| Less than High School | - | - |
| High School Diploma | $42,431 | $0 |
| College or Associate's Degree | $46,830 | $43,525 |
| Bachelor's Degree | $91,339 | $46,588 |
| Graduate Degree | $135,774 | $0 |
| Total | $75,223 | $46,102 |
Family Income in South Patrick Shores
Family Income Brackets in South Patrick Shores
According to the South Patrick Shores family income data, there are 444 families falling into the $200,000+ income range, which is the most common income bracket and makes up 24.6% of all families.
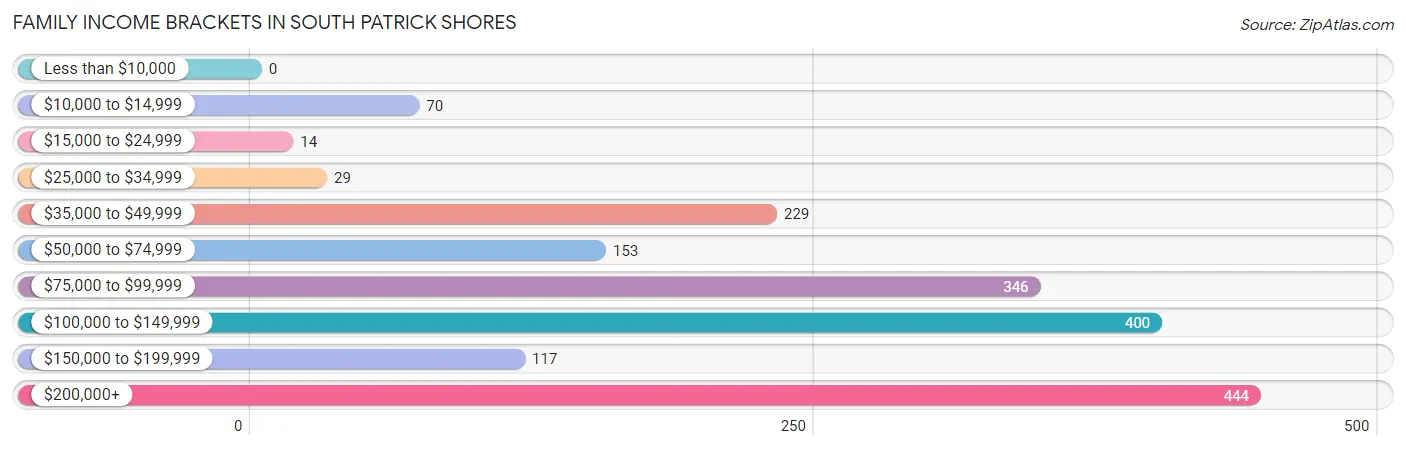
| Income Bracket | # Families | % Families |
| Less than $10,000 | 0 | 0.0% |
| $10,000 to $14,999 | 70 | 3.9% |
| $15,000 to $24,999 | 14 | 0.8% |
| $25,000 to $34,999 | 29 | 1.6% |
| $35,000 to $49,999 | 229 | 12.7% |
| $50,000 to $74,999 | 153 | 8.5% |
| $75,000 to $99,999 | 346 | 19.2% |
| $100,000 to $149,999 | 400 | 22.2% |
| $150,000 to $199,999 | 117 | 6.5% |
| $200,000+ | 444 | 24.6% |
Family Income by Famaliy Size in South Patrick Shores
5-person families (168 | 9.3%) account for the highest median family income in South Patrick Shores with $210,608 per family, while 2-person families (1,037 | 57.5%) have the highest median income of $49,453 per family member.
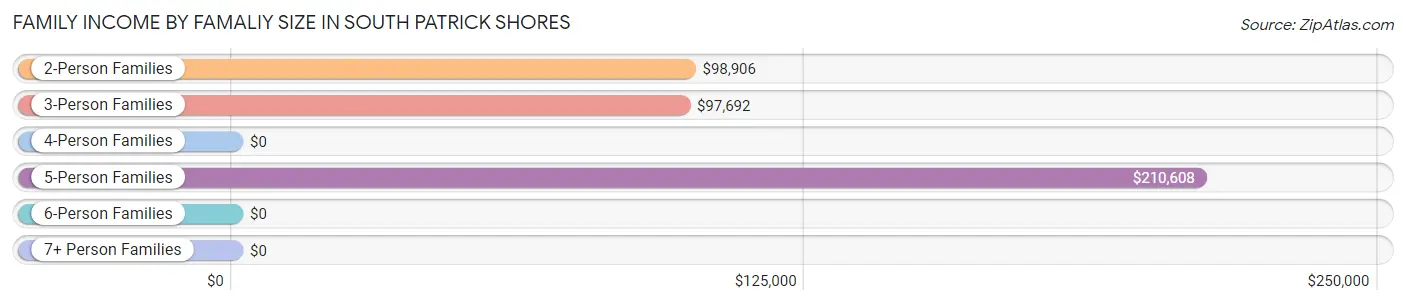
| Income Bracket | # Families | Median Income |
| 2-Person Families | 1,037 (57.5%) | $98,906 |
| 3-Person Families | 428 (23.7%) | $97,692 |
| 4-Person Families | 140 (7.8%) | $0 |
| 5-Person Families | 168 (9.3%) | $210,608 |
| 6-Person Families | 31 (1.7%) | $0 |
| 7+ Person Families | 0 (0.0%) | $0 |
| Total | 1,804 (100.0%) | $105,208 |
Family Income by Number of Earners in South Patrick Shores
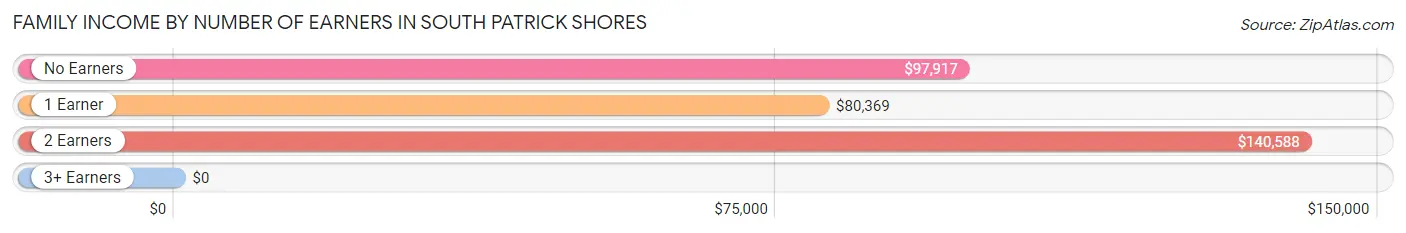
| Number of Earners | # Families | Median Income |
| No Earners | 430 (23.8%) | $97,917 |
| 1 Earner | 622 (34.5%) | $80,369 |
| 2 Earners | 550 (30.5%) | $140,588 |
| 3+ Earners | 202 (11.2%) | $0 |
| Total | 1,804 (100.0%) | $105,208 |
Household Income in South Patrick Shores
Household Income Brackets in South Patrick Shores
With 512 households falling in the category, the $100,000 to $149,999 income range is the most frequent in South Patrick Shores, accounting for 17.2% of all households. In contrast, only 62 households (2.1%) fall into the less than $10,000 income bracket, making it the least populous group.
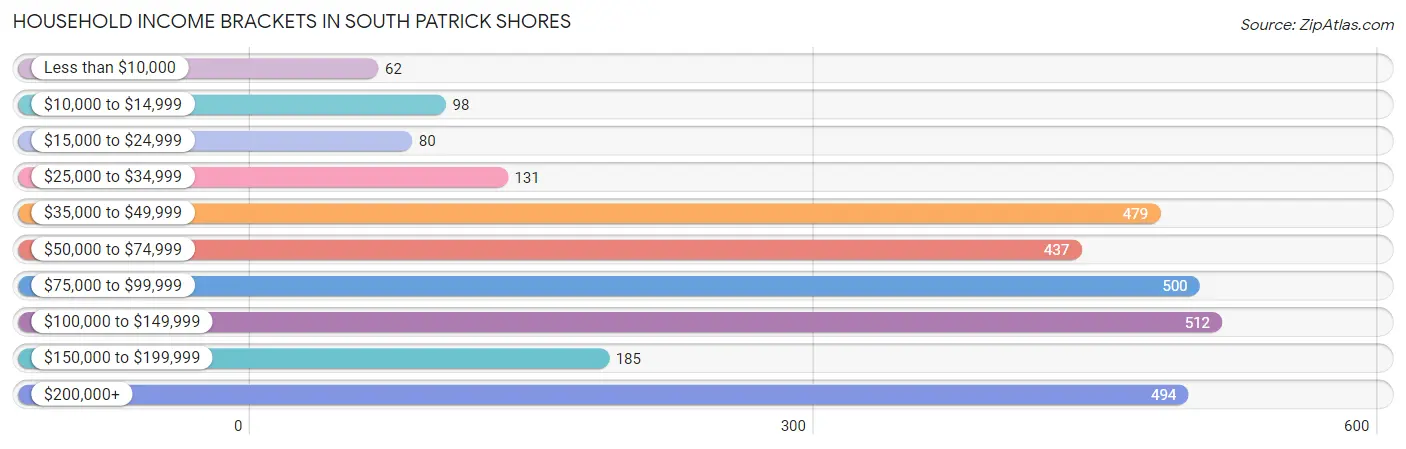
| Income Bracket | # Households | % Households |
| Less than $10,000 | 62 | 2.1% |
| $10,000 to $14,999 | 98 | 3.3% |
| $15,000 to $24,999 | 80 | 2.7% |
| $25,000 to $34,999 | 131 | 4.4% |
| $35,000 to $49,999 | 479 | 16.1% |
| $50,000 to $74,999 | 437 | 14.7% |
| $75,000 to $99,999 | 500 | 16.8% |
| $100,000 to $149,999 | 512 | 17.2% |
| $150,000 to $199,999 | 185 | 6.2% |
| $200,000+ | 494 | 16.6% |
Household Income by Householder Age in South Patrick Shores
The median household income in South Patrick Shores is $81,964, with the highest median household income of $103,750 found in the 25 to 44 years age bracket for the primary householder. A total of 546 households (18.3%) fall into this category. Meanwhile, the 15 to 24 years age bracket for the primary householder has the lowest median household income of $0, with 94 households (3.2%) in this group.
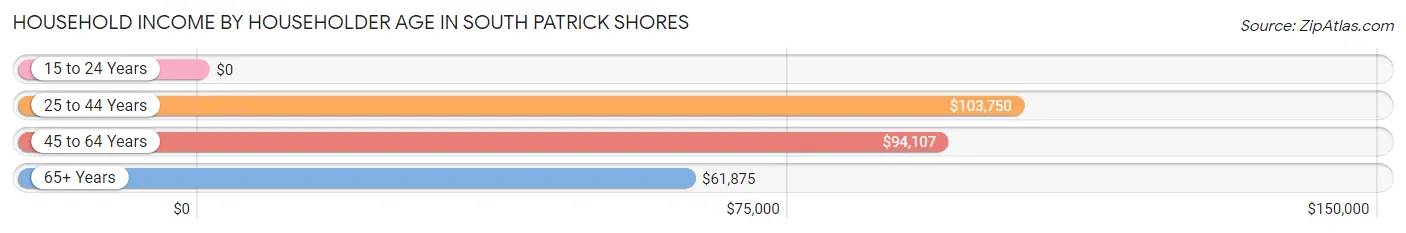
| Income Bracket | # Households | Median Income |
| 15 to 24 Years | 94 (3.2%) | $0 |
| 25 to 44 Years | 546 (18.3%) | $103,750 |
| 45 to 64 Years | 1,413 (47.5%) | $94,107 |
| 65+ Years | 923 (31.0%) | $61,875 |
| Total | 2,976 (100.0%) | $81,964 |
Poverty in South Patrick Shores
Income Below Poverty by Sex and Age in South Patrick Shores
With 3.2% poverty level for males and 4.8% for females among the residents of South Patrick Shores, 65 to 74 year old males and 18 to 24 year old females are the most vulnerable to poverty, with 59 males (15.9%) and 35 females (31.8%) in their respective age groups living below the poverty level.
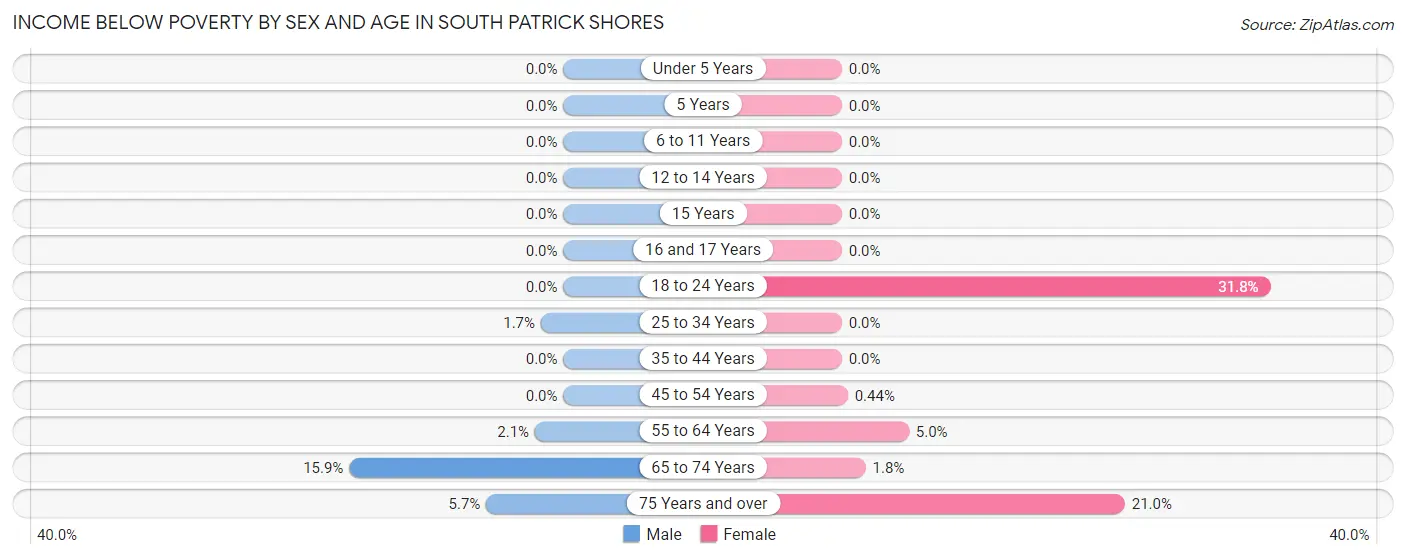
| Age Bracket | Male | Female |
| Under 5 Years | 0 (0.0%) | 0 (0.0%) |
| 5 Years | 0 (0.0%) | 0 (0.0%) |
| 6 to 11 Years | 0 (0.0%) | 0 (0.0%) |
| 12 to 14 Years | 0 (0.0%) | 0 (0.0%) |
| 15 Years | 0 (0.0%) | 0 (0.0%) |
| 16 and 17 Years | 0 (0.0%) | 0 (0.0%) |
| 18 to 24 Years | 0 (0.0%) | 35 (31.8%) |
| 25 to 34 Years | 8 (1.7%) | 0 (0.0%) |
| 35 to 44 Years | 0 (0.0%) | 0 (0.0%) |
| 45 to 54 Years | 0 (0.0%) | 2 (0.4%) |
| 55 to 64 Years | 13 (2.1%) | 41 (5.0%) |
| 65 to 74 Years | 59 (15.9%) | 12 (1.8%) |
| 75 Years and over | 26 (5.7%) | 79 (21.0%) |
| Total | 106 (3.2%) | 169 (4.8%) |
Income Above Poverty by Sex and Age in South Patrick Shores
According to the poverty statistics in South Patrick Shores, males aged under 5 years and females aged under 5 years are the age groups that are most secure financially, with 100.0% of males and 100.0% of females in these age groups living above the poverty line.
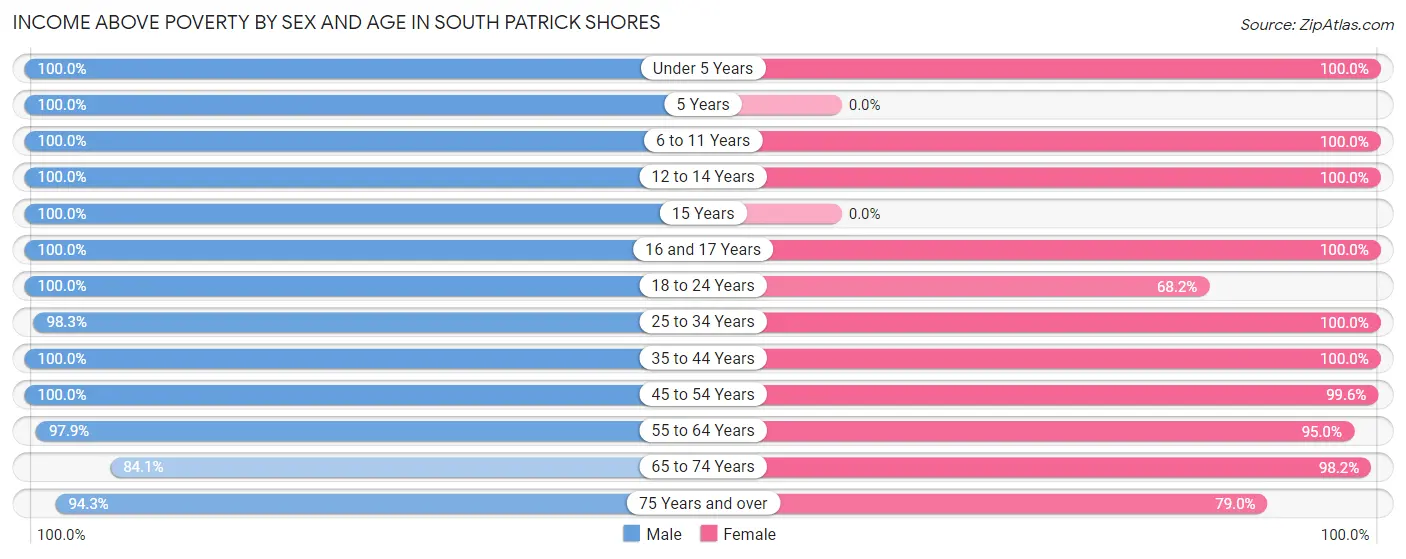
| Age Bracket | Male | Female |
| Under 5 Years | 12 (100.0%) | 167 (100.0%) |
| 5 Years | 32 (100.0%) | 0 (0.0%) |
| 6 to 11 Years | 303 (100.0%) | 112 (100.0%) |
| 12 to 14 Years | 21 (100.0%) | 103 (100.0%) |
| 15 Years | 107 (100.0%) | 0 (0.0%) |
| 16 and 17 Years | 72 (100.0%) | 52 (100.0%) |
| 18 to 24 Years | 458 (100.0%) | 75 (68.2%) |
| 25 to 34 Years | 471 (98.3%) | 355 (100.0%) |
| 35 to 44 Years | 201 (100.0%) | 305 (100.0%) |
| 45 to 54 Years | 234 (100.0%) | 456 (99.6%) |
| 55 to 64 Years | 602 (97.9%) | 782 (95.0%) |
| 65 to 74 Years | 312 (84.1%) | 667 (98.2%) |
| 75 Years and over | 428 (94.3%) | 297 (79.0%) |
| Total | 3,253 (96.8%) | 3,371 (95.2%) |
Income Below Poverty Among Married-Couple Families in South Patrick Shores
The poverty statistics for married-couple families in South Patrick Shores show that 4.7% or 70 of the total 1,493 families live below the poverty line. Families with no children have the highest poverty rate of 6.1%, comprising of 70 families. On the other hand, families with 1 or 2 children have the lowest poverty rate of 0.0%, which includes 0 families.
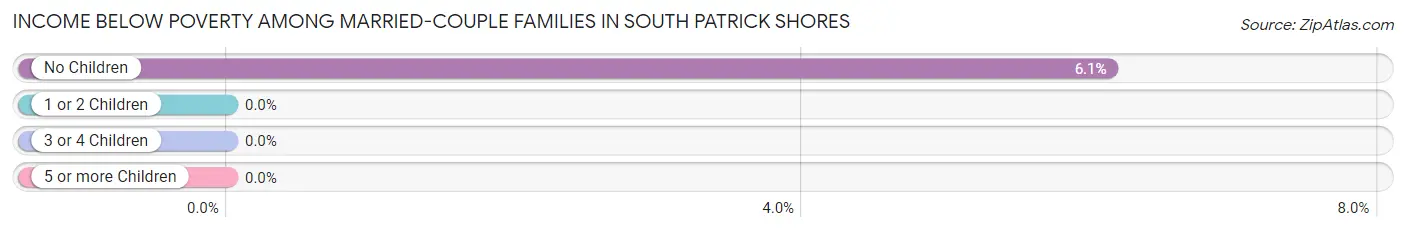
| Children | Above Poverty | Below Poverty |
| No Children | 1,071 (93.9%) | 70 (6.1%) |
| 1 or 2 Children | 265 (100.0%) | 0 (0.0%) |
| 3 or 4 Children | 87 (100.0%) | 0 (0.0%) |
| 5 or more Children | 0 (0.0%) | 0 (0.0%) |
| Total | 1,423 (95.3%) | 70 (4.7%) |
Income Below Poverty Among Single-Parent Households in South Patrick Shores
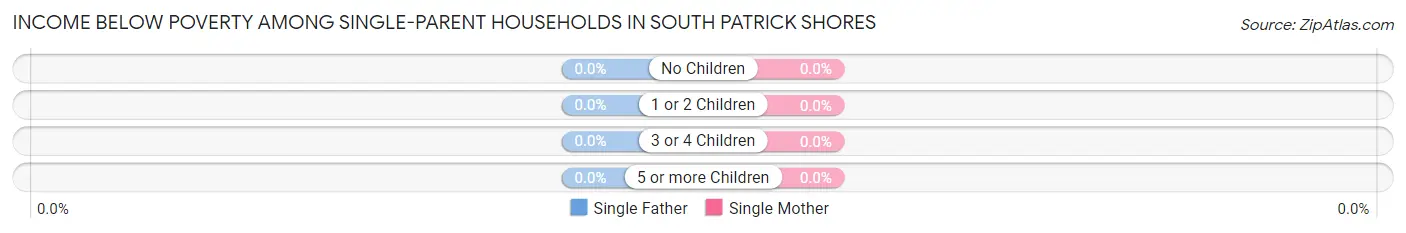
| Children | Single Father | Single Mother |
| No Children | 0 (0.0%) | 0 (0.0%) |
| 1 or 2 Children | 0 (0.0%) | 0 (0.0%) |
| 3 or 4 Children | 0 (0.0%) | 0 (0.0%) |
| 5 or more Children | 0 (0.0%) | 0 (0.0%) |
| Total | 0 (0.0%) | 0 (0.0%) |
Income Below Poverty Among Married-Couple vs Single-Parent Households in South Patrick Shores
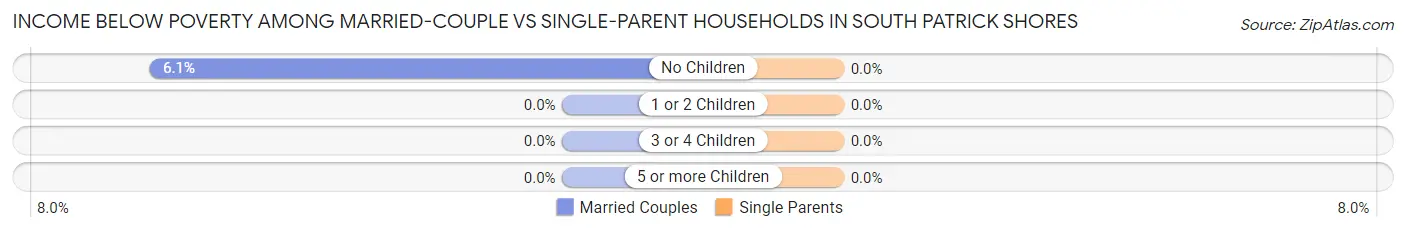
| Children | Married-Couple Families | Single-Parent Households |
| No Children | 70 (6.1%) | 0 (0.0%) |
| 1 or 2 Children | 0 (0.0%) | 0 (0.0%) |
| 3 or 4 Children | 0 (0.0%) | 0 (0.0%) |
| 5 or more Children | 0 (0.0%) | 0 (0.0%) |
| Total | 70 (4.7%) | 0 (0.0%) |
Race in South Patrick Shores
The most populous races in South Patrick Shores are White / Caucasian (5,939 | 86.1%), Hispanic or Latino (406 | 5.9%), and Two or more Races (391 | 5.7%).
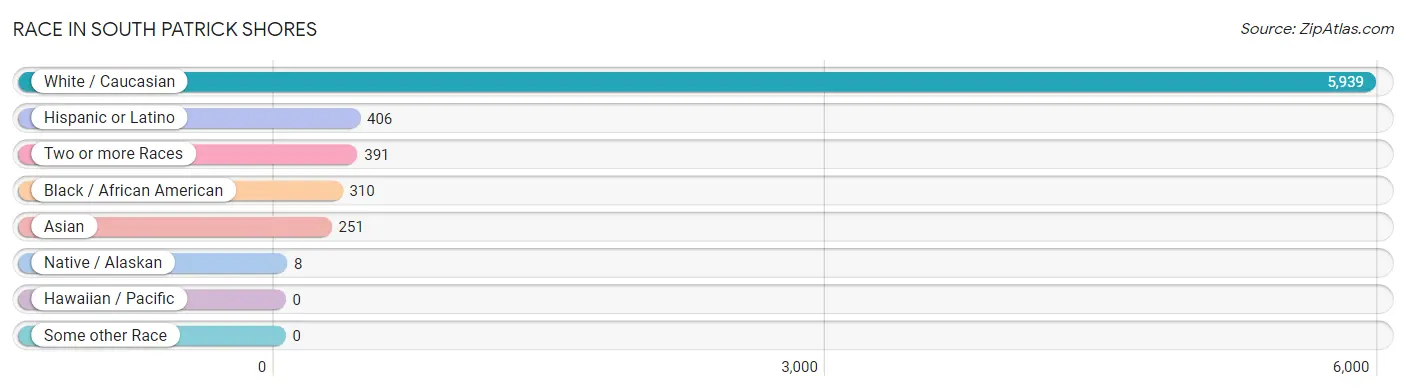
| Race | # Population | % Population |
| Asian | 251 | 3.6% |
| Black / African American | 310 | 4.5% |
| Hawaiian / Pacific | 0 | 0.0% |
| Hispanic or Latino | 406 | 5.9% |
| Native / Alaskan | 8 | 0.1% |
| White / Caucasian | 5,939 | 86.1% |
| Two or more Races | 391 | 5.7% |
| Some other Race | 0 | 0.0% |
| Total | 6,899 | 100.0% |
Ancestry in South Patrick Shores
The most populous ancestries reported in South Patrick Shores are English (1,190 | 17.2%), Irish (1,183 | 17.2%), German (1,142 | 16.6%), American (520 | 7.5%), and Italian (492 | 7.1%), together accounting for 65.6% of all South Patrick Shores residents.
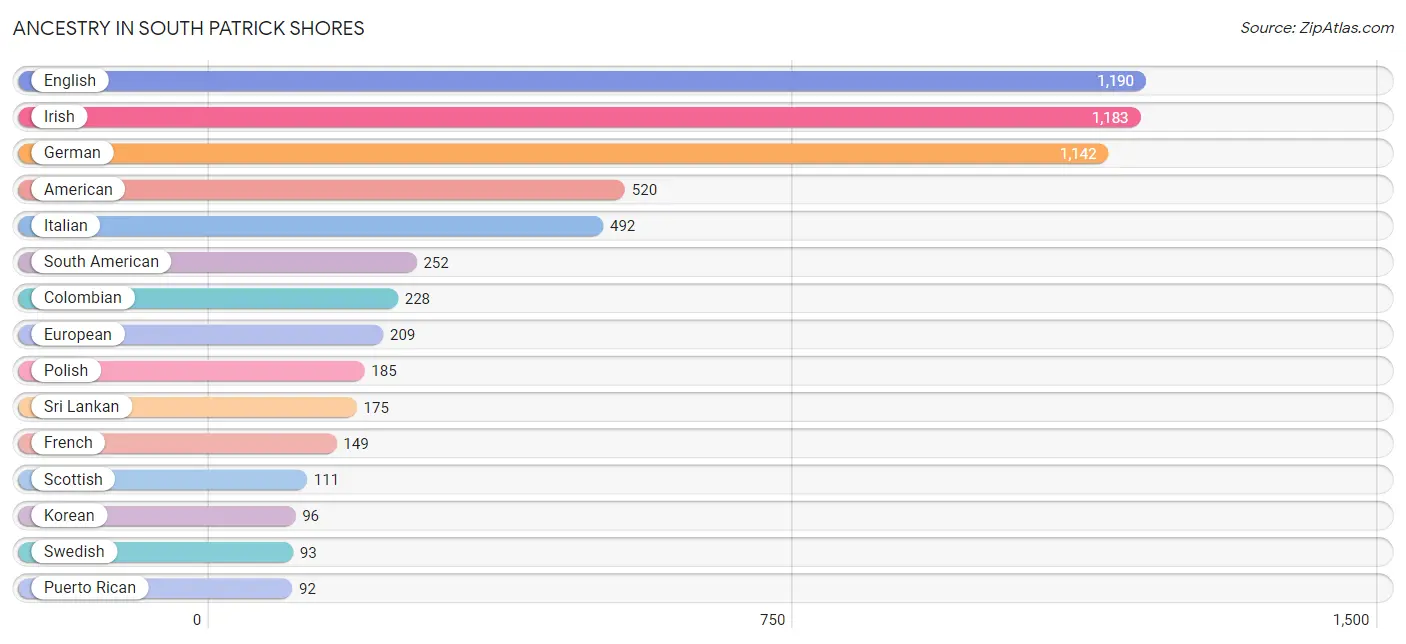
| Ancestry | # Population | % Population |
| American | 520 | 7.5% |
| Arab | 30 | 0.4% |
| Basque | 24 | 0.4% |
| Bhutanese | 46 | 0.7% |
| British | 75 | 1.1% |
| Burmese | 6 | 0.1% |
| Canadian | 17 | 0.3% |
| Chilean | 8 | 0.1% |
| Colombian | 228 | 3.3% |
| Cuban | 43 | 0.6% |
| Czechoslovakian | 9 | 0.1% |
| Danish | 6 | 0.1% |
| Dutch | 53 | 0.8% |
| Eastern European | 56 | 0.8% |
| English | 1,190 | 17.2% |
| Estonian | 27 | 0.4% |
| European | 209 | 3.0% |
| French | 149 | 2.2% |
| German | 1,142 | 16.6% |
| Greek | 54 | 0.8% |
| Hungarian | 25 | 0.4% |
| Indian (Asian) | 9 | 0.1% |
| Irish | 1,183 | 17.2% |
| Italian | 492 | 7.1% |
| Jamaican | 1 | 0.0% |
| Korean | 96 | 1.4% |
| Lebanese | 30 | 0.4% |
| Mexican | 8 | 0.1% |
| Norwegian | 66 | 1.0% |
| Peruvian | 16 | 0.2% |
| Polish | 185 | 2.7% |
| Portuguese | 24 | 0.4% |
| Puerto Rican | 92 | 1.3% |
| Russian | 43 | 0.6% |
| Scotch-Irish | 64 | 0.9% |
| Scottish | 111 | 1.6% |
| Slovak | 14 | 0.2% |
| South African | 46 | 0.7% |
| South American | 252 | 3.6% |
| Spaniard | 11 | 0.2% |
| Sri Lankan | 175 | 2.5% |
| Subsaharan African | 46 | 0.7% |
| Swedish | 93 | 1.3% |
| Turkish | 4 | 0.1% |
| Ukrainian | 33 | 0.5% |
| West Indian | 22 | 0.3% | View All 46 Rows |
Immigrants in South Patrick Shores
The most numerous immigrant groups reported in South Patrick Shores came from Europe (242 | 3.5%), Northern Europe (148 | 2.1%), Western Europe (83 | 1.2%), England (82 | 1.2%), and Latin America (57 | 0.8%), together accounting for 8.9% of all South Patrick Shores residents.
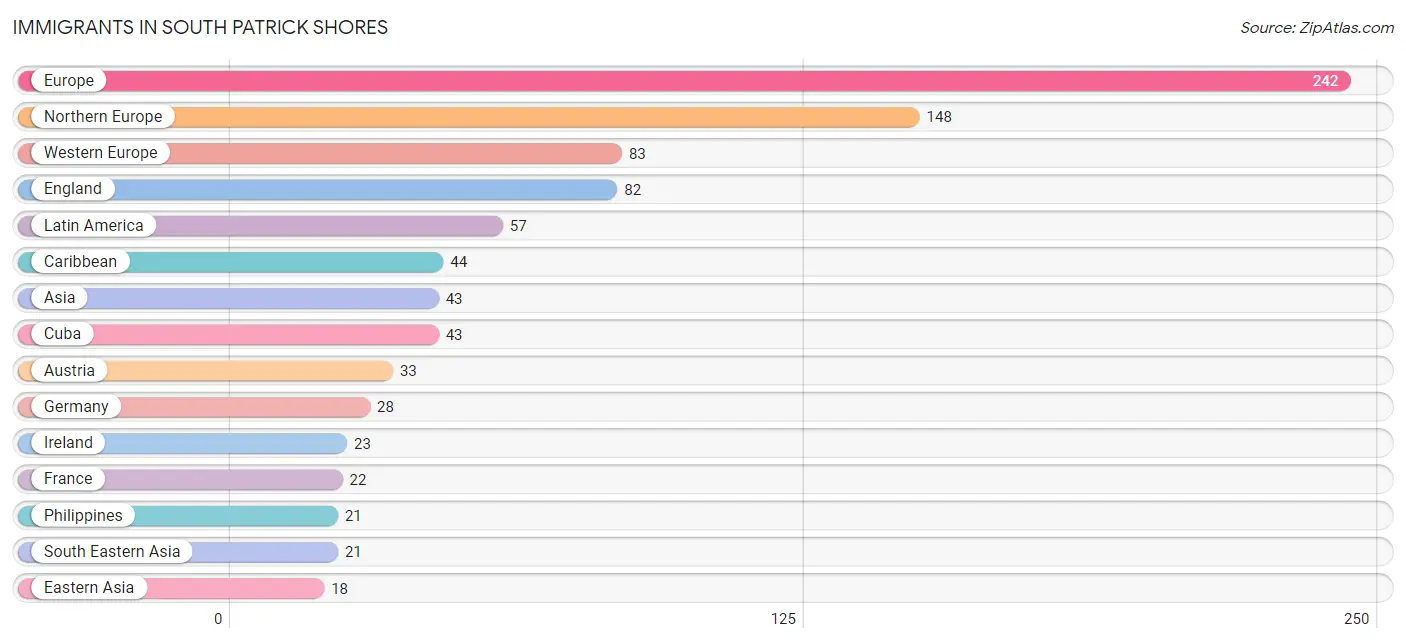
| Immigration Origin | # Population | % Population |
| Asia | 43 | 0.6% |
| Austria | 33 | 0.5% |
| Canada | 11 | 0.2% |
| Caribbean | 44 | 0.6% |
| Chile | 8 | 0.1% |
| China | 9 | 0.1% |
| Cuba | 43 | 0.6% |
| Eastern Asia | 18 | 0.3% |
| England | 82 | 1.2% |
| Europe | 242 | 3.5% |
| France | 22 | 0.3% |
| Germany | 28 | 0.4% |
| Ireland | 23 | 0.3% |
| Jamaica | 1 | 0.0% |
| Japan | 9 | 0.1% |
| Latin America | 57 | 0.8% |
| Northern Europe | 148 | 2.1% |
| Peru | 5 | 0.1% |
| Philippines | 21 | 0.3% |
| South America | 13 | 0.2% |
| South Eastern Asia | 21 | 0.3% |
| Southern Europe | 11 | 0.2% |
| Spain | 11 | 0.2% |
| Taiwan | 9 | 0.1% |
| Turkey | 4 | 0.1% |
| Western Asia | 4 | 0.1% |
| Western Europe | 83 | 1.2% | View All 27 Rows |
Sex and Age in South Patrick Shores
Sex and Age in South Patrick Shores
The most populous age groups in South Patrick Shores are 20 to 24 Years (458 | 13.6%) for men and 70 to 74 Years (437 | 12.3%) for women.
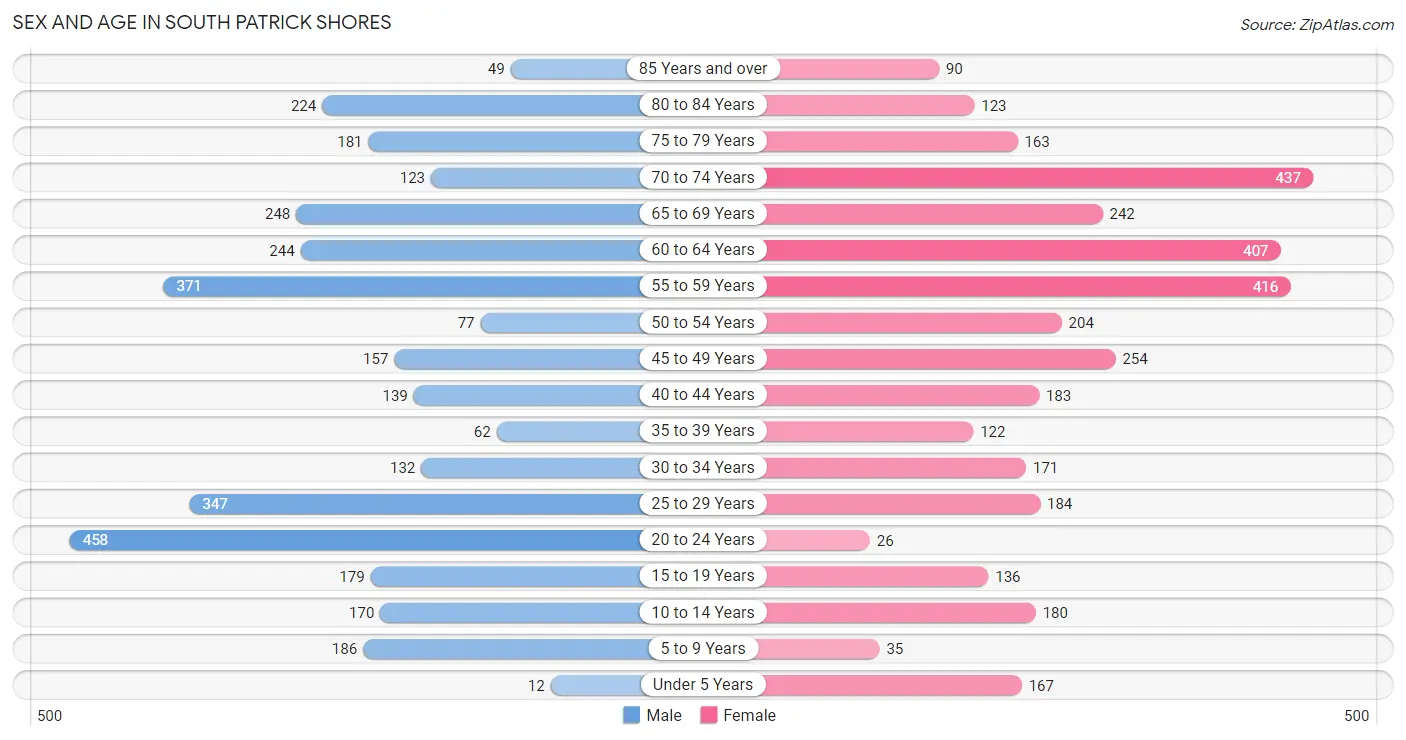
| Age Bracket | Male | Female |
| Under 5 Years | 12 (0.4%) | 167 (4.7%) |
| 5 to 9 Years | 186 (5.5%) | 35 (1.0%) |
| 10 to 14 Years | 170 (5.1%) | 180 (5.1%) |
| 15 to 19 Years | 179 (5.3%) | 136 (3.8%) |
| 20 to 24 Years | 458 (13.6%) | 26 (0.7%) |
| 25 to 29 Years | 347 (10.3%) | 184 (5.2%) |
| 30 to 34 Years | 132 (3.9%) | 171 (4.8%) |
| 35 to 39 Years | 62 (1.8%) | 122 (3.5%) |
| 40 to 44 Years | 139 (4.1%) | 183 (5.2%) |
| 45 to 49 Years | 157 (4.7%) | 254 (7.2%) |
| 50 to 54 Years | 77 (2.3%) | 204 (5.8%) |
| 55 to 59 Years | 371 (11.0%) | 416 (11.7%) |
| 60 to 64 Years | 244 (7.3%) | 407 (11.5%) |
| 65 to 69 Years | 248 (7.4%) | 242 (6.8%) |
| 70 to 74 Years | 123 (3.7%) | 437 (12.3%) |
| 75 to 79 Years | 181 (5.4%) | 163 (4.6%) |
| 80 to 84 Years | 224 (6.7%) | 123 (3.5%) |
| 85 Years and over | 49 (1.5%) | 90 (2.5%) |
| Total | 3,359 (100.0%) | 3,540 (100.0%) |
Families and Households in South Patrick Shores
Median Family Size in South Patrick Shores
The median family size in South Patrick Shores is 3.06 persons per family, with single female/mother families (235 | 13.0%) accounting for the largest median family size of 3.97 persons per family. On the other hand, single male/father families (76 | 4.2%) represent the smallest median family size with 2.79 persons per family.
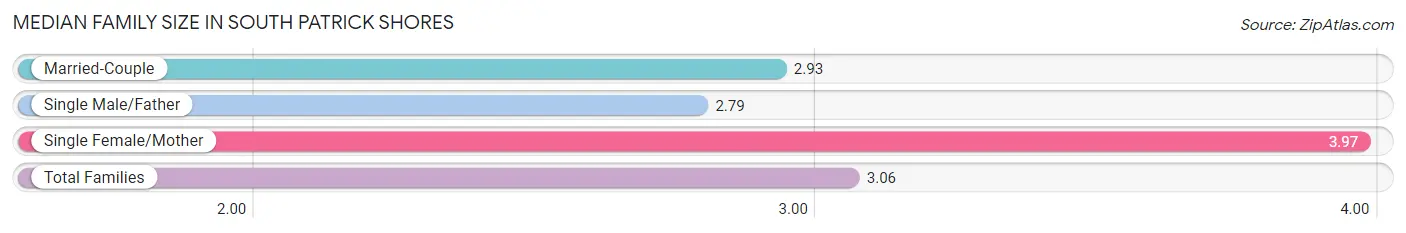
| Family Type | # Families | Family Size |
| Married-Couple | 1,493 (82.8%) | 2.93 |
| Single Male/Father | 76 (4.2%) | 2.79 |
| Single Female/Mother | 235 (13.0%) | 3.97 |
| Total Families | 1,804 (100.0%) | 3.06 |
Median Household Size in South Patrick Shores
The median household size in South Patrick Shores is 2.32 persons per household, with single female/mother households (235 | 7.9%) accounting for the largest median household size of 4.09 persons per household. non-family households (1,172 | 39.4%) represent the smallest median household size with 1.13 persons per household.
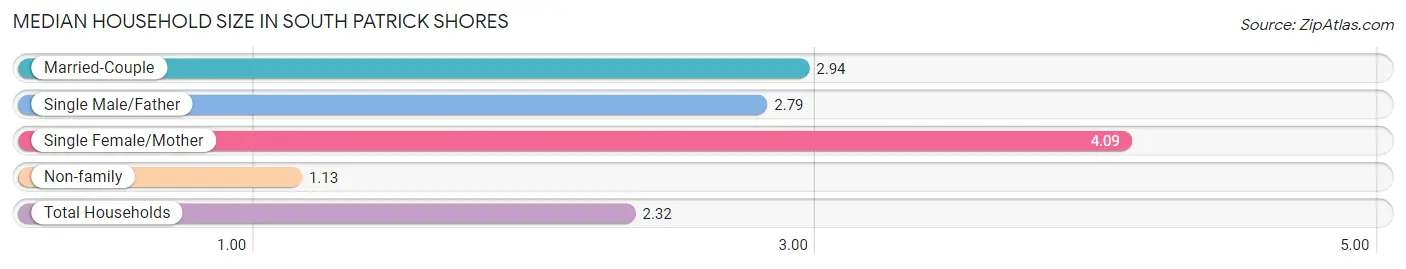
| Household Type | # Households | Household Size |
| Married-Couple | 1,493 (50.2%) | 2.94 |
| Single Male/Father | 76 (2.5%) | 2.79 |
| Single Female/Mother | 235 (7.9%) | 4.09 |
| Non-family | 1,172 (39.4%) | 1.13 |
| Total Households | 2,976 (100.0%) | 2.32 |
Household Size by Marriage Status in South Patrick Shores
Out of a total of 2,976 households in South Patrick Shores, 1,804 (60.6%) are family households, while 1,172 (39.4%) are nonfamily households. The most numerous type of family households are 2-person households, comprising 1,037, and the most common type of nonfamily households are 1-person households, comprising 1,058.
| Household Size | Family Households | Nonfamily Households |
| 1-Person Households | - | 1,058 (35.5%) |
| 2-Person Households | 1,037 (34.8%) | 114 (3.8%) |
| 3-Person Households | 403 (13.5%) | 0 (0.0%) |
| 4-Person Households | 148 (5.0%) | 0 (0.0%) |
| 5-Person Households | 185 (6.2%) | 0 (0.0%) |
| 6-Person Households | 31 (1.0%) | 0 (0.0%) |
| 7+ Person Households | 0 (0.0%) | 0 (0.0%) |
| Total | 1,804 (60.6%) | 1,172 (39.4%) |
Female Fertility in South Patrick Shores
Fertility by Age in South Patrick Shores
Average fertility rate in South Patrick Shores is 27.0 births per 1,000 women. Women in the age bracket of 35 to 50 years have the highest fertility rate with 48.0 births per 1,000 women. Women in the age bracket of 35 to 50 years acount for 100.0% of all women with births.
| Age Bracket | Women with Births | Births / 1,000 Women |
| 15 to 19 years | 0 (0.0%) | 0.0 |
| 20 to 34 years | 0 (0.0%) | 0.0 |
| 35 to 50 years | 31 (100.0%) | 48.0 |
| Total | 31 (100.0%) | 27.0 |
Fertility by Age by Marriage Status in South Patrick Shores
| Age Bracket | Married | Unmarried |
| 15 to 19 years | 0 (0.0%) | 0 (0.0%) |
| 20 to 34 years | 0 (0.0%) | 0 (0.0%) |
| 35 to 50 years | 31 (100.0%) | 0 (0.0%) |
| Total | 31 (100.0%) | 0 (0.0%) |
Fertility by Education in South Patrick Shores
| Educational Attainment | Women with Births | Births / 1,000 Women |
| Less than High School | 0 (0.0%) | 0.0 |
| High School Diploma | 0 (0.0%) | 0.0 |
| College or Associate's Degree | 31 (100.0%) | 74.0 |
| Bachelor's Degree | 0 (0.0%) | 0.0 |
| Graduate Degree | 0 (0.0%) | 0.0 |
| Total | 31 (100.0%) | 27.0 |
Fertility by Education by Marriage Status in South Patrick Shores
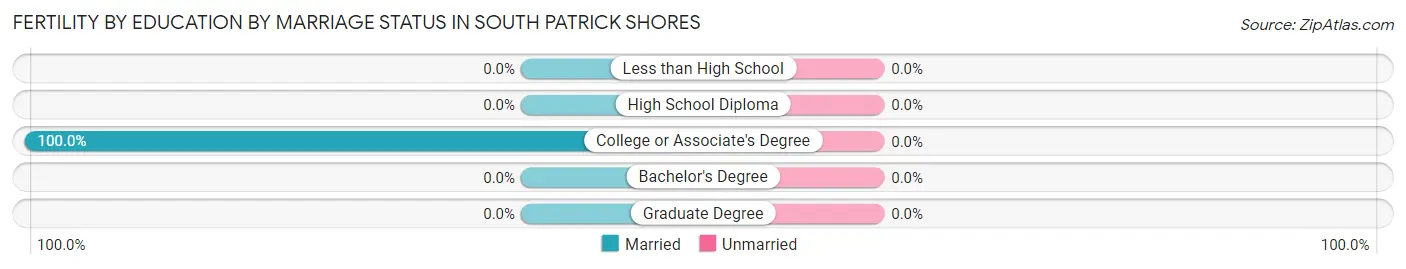
| Educational Attainment | Married | Unmarried |
| Less than High School | 0 (0.0%) | 0 (0.0%) |
| High School Diploma | 0 (0.0%) | 0 (0.0%) |
| College or Associate's Degree | 31 (100.0%) | 0 (0.0%) |
| Bachelor's Degree | 0 (0.0%) | 0 (0.0%) |
| Graduate Degree | 0 (0.0%) | 0 (0.0%) |
| Total | 31 (100.0%) | 0 (0.0%) |
Employment Characteristics in South Patrick Shores
Employment by Class of Employer in South Patrick Shores
Among the 3,258 employed individuals in South Patrick Shores, private company employees (2,022 | 62.1%), not-for-profit organizations (303 | 9.3%), and federal government employees (303 | 9.3%) make up the most common classes of employment.
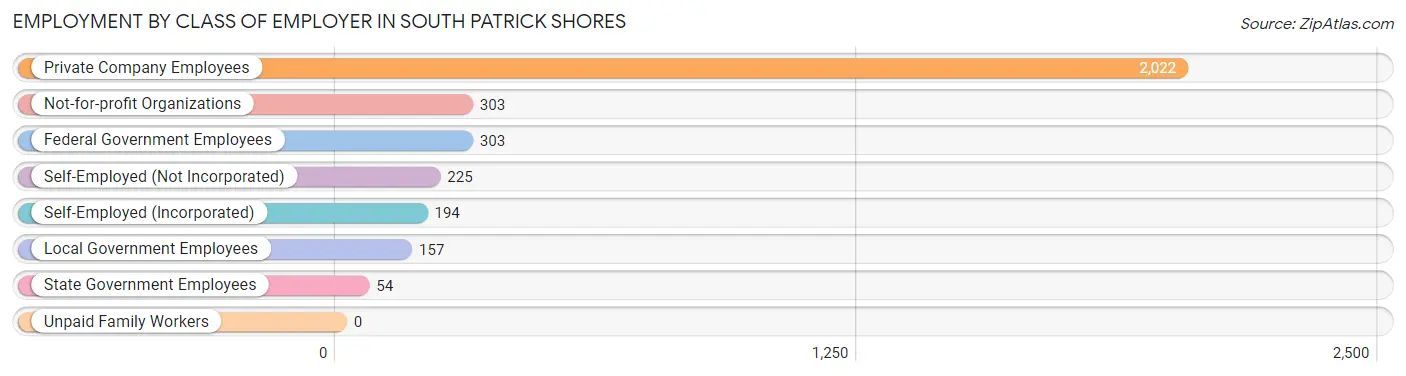
| Employer Class | # Employees | % Employees |
| Private Company Employees | 2,022 | 62.1% |
| Self-Employed (Incorporated) | 194 | 5.9% |
| Self-Employed (Not Incorporated) | 225 | 6.9% |
| Not-for-profit Organizations | 303 | 9.3% |
| Local Government Employees | 157 | 4.8% |
| State Government Employees | 54 | 1.7% |
| Federal Government Employees | 303 | 9.3% |
| Unpaid Family Workers | 0 | 0.0% |
| Total | 3,258 | 100.0% |
Employment Status by Age in South Patrick Shores
According to the labor force statistics for South Patrick Shores, out of the total population over 16 years of age (6,042), 56.0% or 3,384 individuals are in the labor force, with 3.5% or 118 of them unemployed. The age group with the highest labor force participation rate is 35 to 44 years, with 100.0% or 506 individuals in the labor force. Within the labor force, the 30 to 34 years age range has the highest percentage of unemployed individuals, with 18.1% or 47 of them being unemployed.
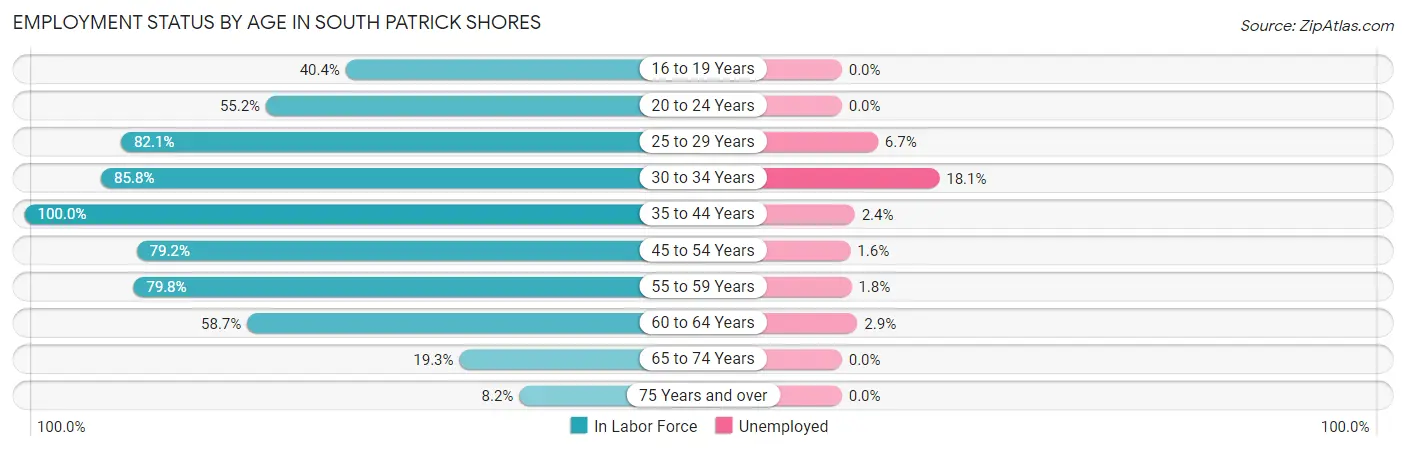
| Age Bracket | In Labor Force | Unemployed |
| 16 to 19 Years | 84 (40.4%) | 0 (0.0%) |
| 20 to 24 Years | 267 (55.2%) | 0 (0.0%) |
| 25 to 29 Years | 436 (82.1%) | 29 (6.7%) |
| 30 to 34 Years | 260 (85.8%) | 47 (18.1%) |
| 35 to 44 Years | 506 (100.0%) | 12 (2.4%) |
| 45 to 54 Years | 548 (79.2%) | 9 (1.6%) |
| 55 to 59 Years | 628 (79.8%) | 11 (1.8%) |
| 60 to 64 Years | 382 (58.7%) | 11 (2.9%) |
| 65 to 74 Years | 203 (19.3%) | 0 (0.0%) |
| 75 Years and over | 68 (8.2%) | 0 (0.0%) |
| Total | 3,384 (56.0%) | 118 (3.5%) |
Employment Status by Educational Attainment in South Patrick Shores
According to labor force statistics for South Patrick Shores, 79.5% of individuals (2,759) out of the total population between 25 and 64 years of age (3,470) are in the labor force, with 4.4% or 121 of them being unemployed. The group with the highest labor force participation rate are those with the educational attainment of less than high school, with 100.0% or 5 individuals in the labor force. Within the labor force, individuals with less than high school education have the highest percentage of unemployment, with 100.0% or 5 of them being unemployed.
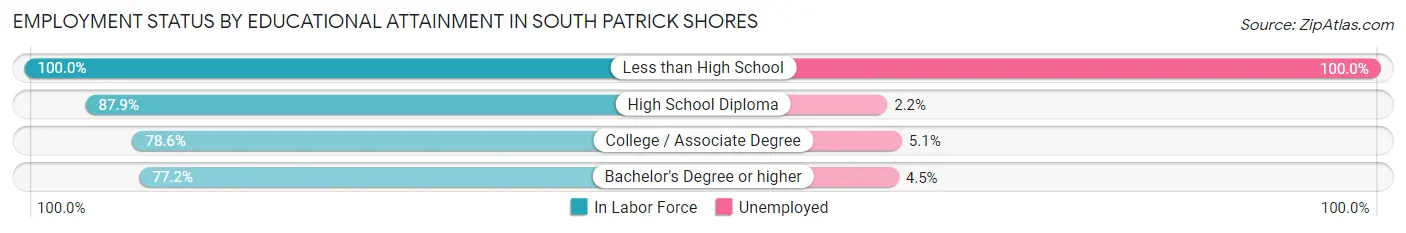
| Educational Attainment | In Labor Force | Unemployed |
| Less than High School | 5 (100.0%) | 5 (100.0%) |
| High School Diploma | 538 (87.9%) | 13 (2.2%) |
| College / Associate Degree | 819 (78.6%) | 53 (5.1%) |
| Bachelor's Degree or higher | 1,398 (77.2%) | 81 (4.5%) |
| Total | 2,759 (79.5%) | 153 (4.4%) |
Employment Occupations by Sex in South Patrick Shores
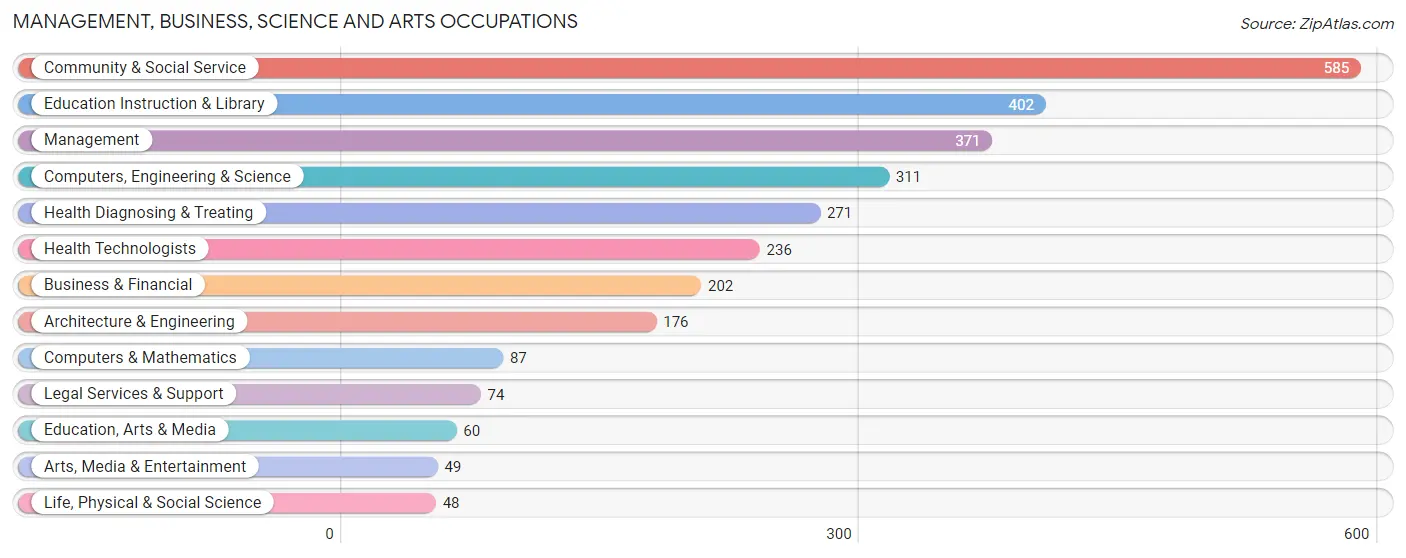
Management, Business, Science and Arts Occupations
The most common Management, Business, Science and Arts occupations in South Patrick Shores are Community & Social Service (585 | 18.9%), Education Instruction & Library (402 | 13.0%), Management (371 | 12.0%), Computers, Engineering & Science (311 | 10.1%), and Health Diagnosing & Treating (271 | 8.8%).
Management, Business, Science and Arts Occupations by Sex
Within the Management, Business, Science and Arts occupations in South Patrick Shores, the most male-oriented occupations are Life, Physical & Social Science (100.0%), Computers & Mathematics (90.8%), and Computers, Engineering & Science (74.3%), while the most female-oriented occupations are Arts, Media & Entertainment (100.0%), Health Technologists (87.7%), and Health Diagnosing & Treating (85.6%).
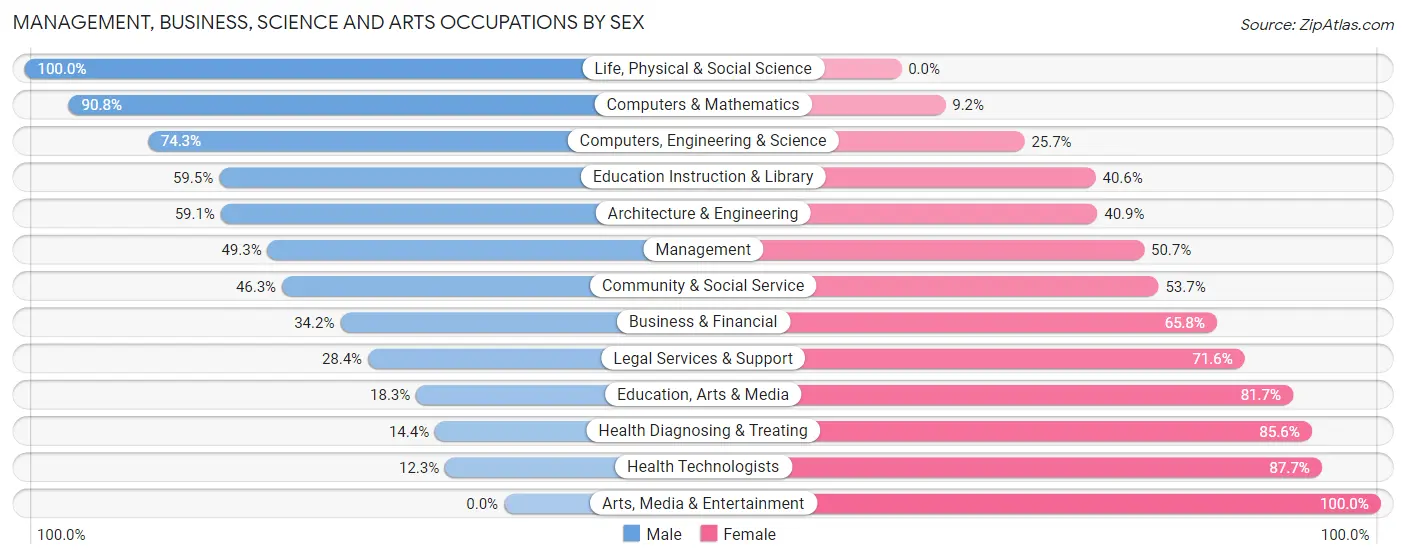
| Occupation | Male | Female |
| Management | 183 (49.3%) | 188 (50.7%) |
| Business & Financial | 69 (34.2%) | 133 (65.8%) |
| Computers, Engineering & Science | 231 (74.3%) | 80 (25.7%) |
| Computers & Mathematics | 79 (90.8%) | 8 (9.2%) |
| Architecture & Engineering | 104 (59.1%) | 72 (40.9%) |
| Life, Physical & Social Science | 48 (100.0%) | 0 (0.0%) |
| Community & Social Service | 271 (46.3%) | 314 (53.7%) |
| Education, Arts & Media | 11 (18.3%) | 49 (81.7%) |
| Legal Services & Support | 21 (28.4%) | 53 (71.6%) |
| Education Instruction & Library | 239 (59.5%) | 163 (40.6%) |
| Arts, Media & Entertainment | 0 (0.0%) | 49 (100.0%) |
| Health Diagnosing & Treating | 39 (14.4%) | 232 (85.6%) |
| Health Technologists | 29 (12.3%) | 207 (87.7%) |
| Total (Category) | 793 (45.6%) | 947 (54.4%) |
| Total (Overall) | 1,436 (46.5%) | 1,654 (53.5%) |
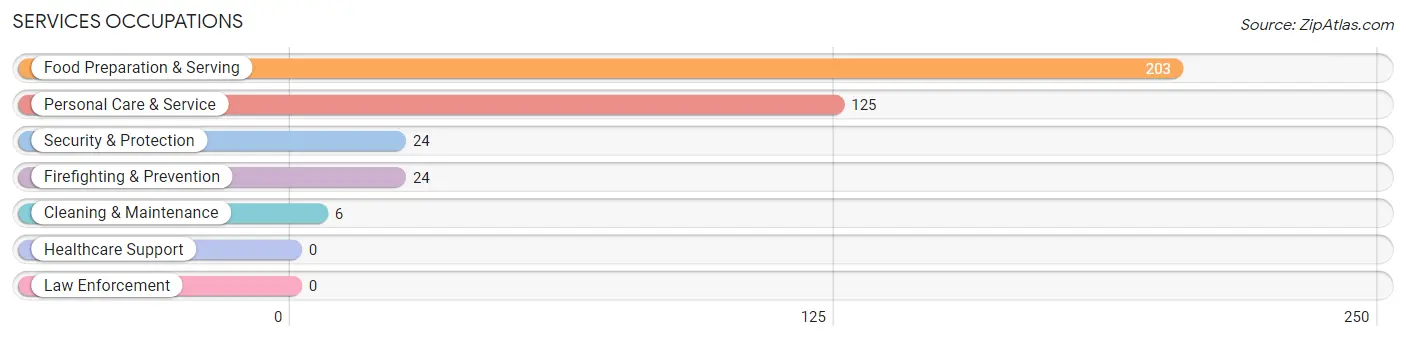
Services Occupations
The most common Services occupations in South Patrick Shores are Food Preparation & Serving (203 | 6.6%), Personal Care & Service (125 | 4.1%), Security & Protection (24 | 0.8%), Firefighting & Prevention (24 | 0.8%), and Cleaning & Maintenance (6 | 0.2%).
Services Occupations by Sex
Within the Services occupations in South Patrick Shores, the most male-oriented occupations are Security & Protection (100.0%), Firefighting & Prevention (100.0%), and Cleaning & Maintenance (100.0%), while the most female-oriented occupations are Personal Care & Service (80.8%), and Food Preparation & Serving (53.2%).
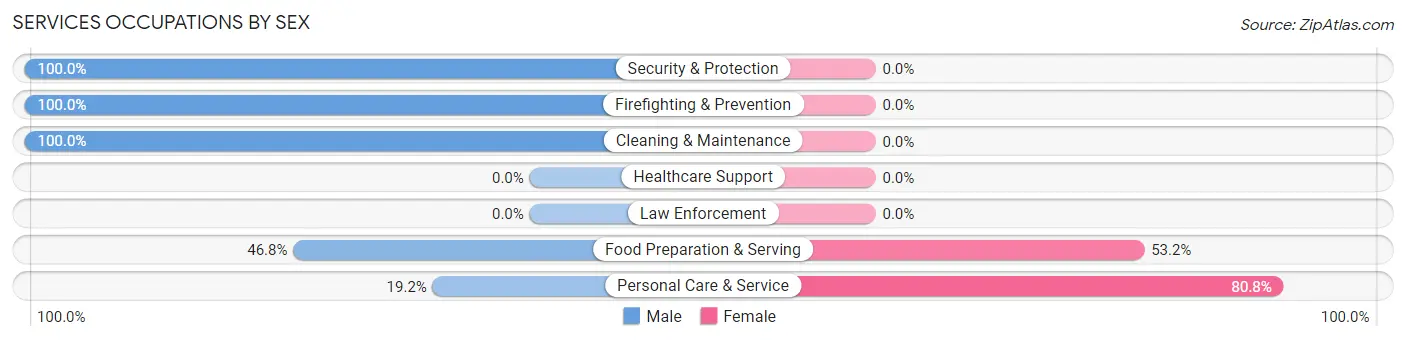
| Occupation | Male | Female |
| Healthcare Support | 0 (0.0%) | 0 (0.0%) |
| Security & Protection | 24 (100.0%) | 0 (0.0%) |
| Firefighting & Prevention | 24 (100.0%) | 0 (0.0%) |
| Law Enforcement | 0 (0.0%) | 0 (0.0%) |
| Food Preparation & Serving | 95 (46.8%) | 108 (53.2%) |
| Cleaning & Maintenance | 6 (100.0%) | 0 (0.0%) |
| Personal Care & Service | 24 (19.2%) | 101 (80.8%) |
| Total (Category) | 149 (41.6%) | 209 (58.4%) |
| Total (Overall) | 1,436 (46.5%) | 1,654 (53.5%) |
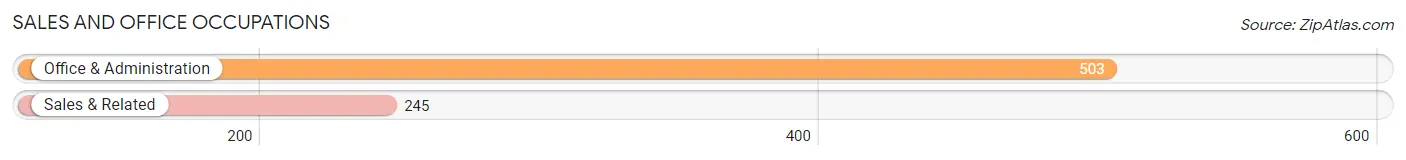
Sales and Office Occupations
The most common Sales and Office occupations in South Patrick Shores are Office & Administration (503 | 16.3%), and Sales & Related (245 | 7.9%).
Sales and Office Occupations by Sex
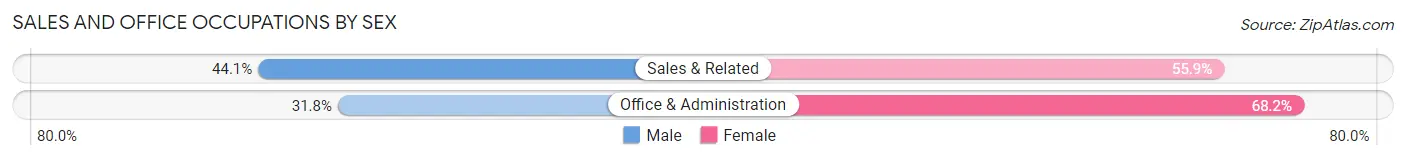
| Occupation | Male | Female |
| Sales & Related | 108 (44.1%) | 137 (55.9%) |
| Office & Administration | 160 (31.8%) | 343 (68.2%) |
| Total (Category) | 268 (35.8%) | 480 (64.2%) |
| Total (Overall) | 1,436 (46.5%) | 1,654 (53.5%) |
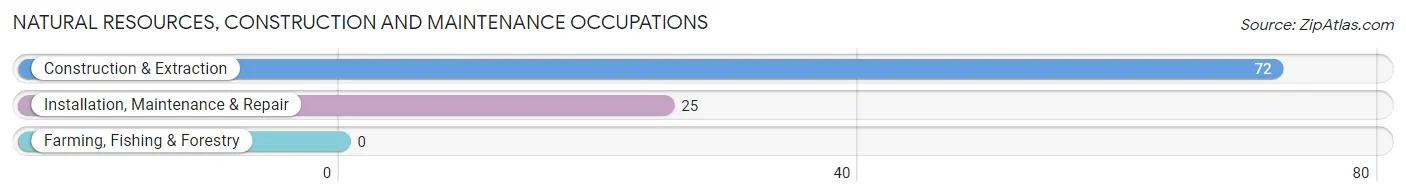
Natural Resources, Construction and Maintenance Occupations
The most common Natural Resources, Construction and Maintenance occupations in South Patrick Shores are Construction & Extraction (72 | 2.3%), and Installation, Maintenance & Repair (25 | 0.8%).
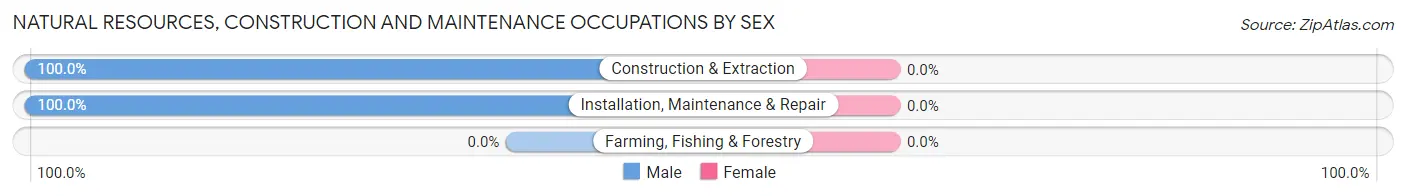
Natural Resources, Construction and Maintenance Occupations by Sex
| Occupation | Male | Female |
| Farming, Fishing & Forestry | 0 (0.0%) | 0 (0.0%) |
| Construction & Extraction | 72 (100.0%) | 0 (0.0%) |
| Installation, Maintenance & Repair | 25 (100.0%) | 0 (0.0%) |
| Total (Category) | 97 (100.0%) | 0 (0.0%) |
| Total (Overall) | 1,436 (46.5%) | 1,654 (53.5%) |
Production, Transportation and Moving Occupations
The most common Production, Transportation and Moving occupations in South Patrick Shores are Production (63 | 2.0%), Material Moving (54 | 1.8%), and Transportation (30 | 1.0%).
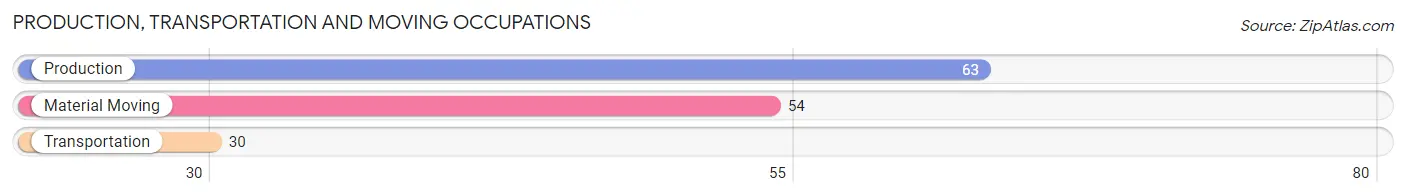
Production, Transportation and Moving Occupations by Sex
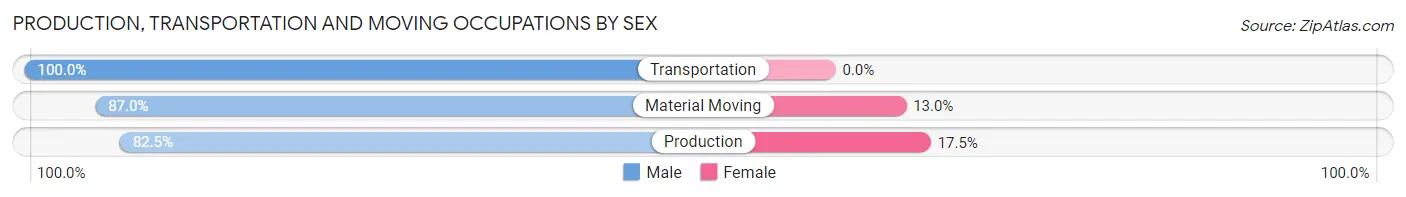
| Occupation | Male | Female |
| Production | 52 (82.5%) | 11 (17.5%) |
| Transportation | 30 (100.0%) | 0 (0.0%) |
| Material Moving | 47 (87.0%) | 7 (13.0%) |
| Total (Category) | 129 (87.8%) | 18 (12.2%) |
| Total (Overall) | 1,436 (46.5%) | 1,654 (53.5%) |
Employment Industries by Sex in South Patrick Shores
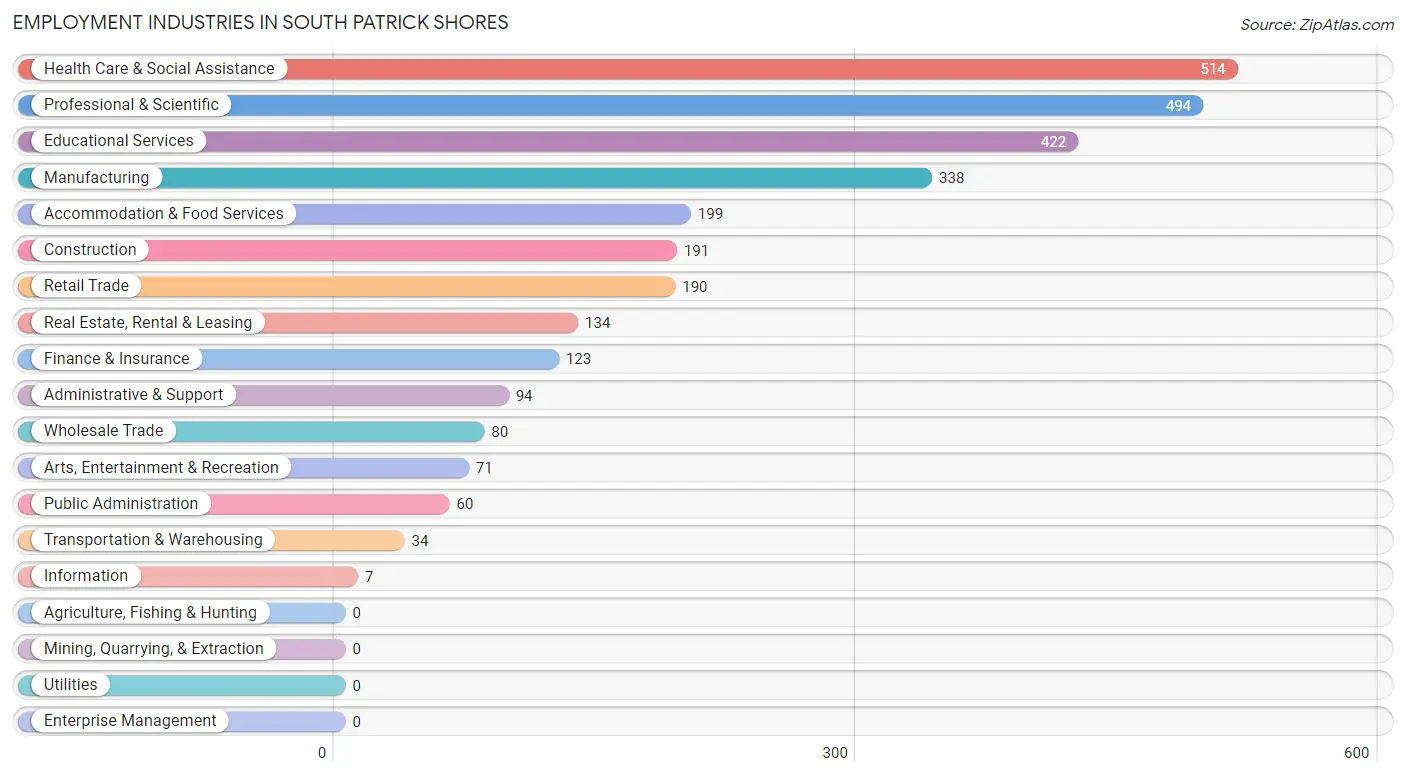
Employment Industries in South Patrick Shores
The major employment industries in South Patrick Shores include Health Care & Social Assistance (514 | 16.6%), Professional & Scientific (494 | 16.0%), Educational Services (422 | 13.7%), Manufacturing (338 | 10.9%), and Accommodation & Food Services (199 | 6.4%).
Employment Industries by Sex in South Patrick Shores
The South Patrick Shores industries that see more men than women are Wholesale Trade (100.0%), Information (100.0%), and Construction (91.1%), whereas the industries that tend to have a higher number of women are Finance & Insurance (100.0%), Real Estate, Rental & Leasing (100.0%), and Health Care & Social Assistance (73.0%).
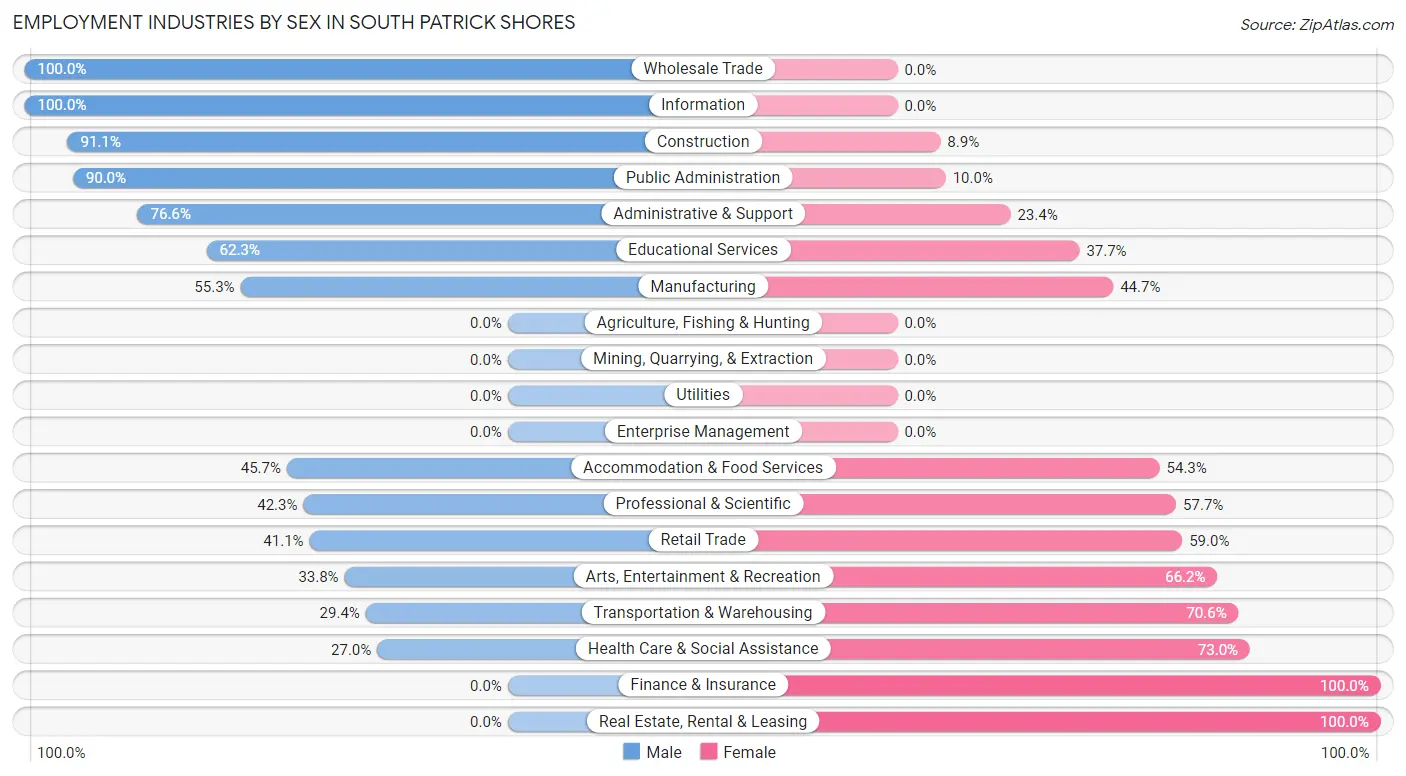
| Industry | Male | Female |
| Agriculture, Fishing & Hunting | 0 (0.0%) | 0 (0.0%) |
| Mining, Quarrying, & Extraction | 0 (0.0%) | 0 (0.0%) |
| Construction | 174 (91.1%) | 17 (8.9%) |
| Manufacturing | 187 (55.3%) | 151 (44.7%) |
| Wholesale Trade | 80 (100.0%) | 0 (0.0%) |
| Retail Trade | 78 (41.0%) | 112 (59.0%) |
| Transportation & Warehousing | 10 (29.4%) | 24 (70.6%) |
| Utilities | 0 (0.0%) | 0 (0.0%) |
| Information | 7 (100.0%) | 0 (0.0%) |
| Finance & Insurance | 0 (0.0%) | 123 (100.0%) |
| Real Estate, Rental & Leasing | 0 (0.0%) | 134 (100.0%) |
| Professional & Scientific | 209 (42.3%) | 285 (57.7%) |
| Enterprise Management | 0 (0.0%) | 0 (0.0%) |
| Administrative & Support | 72 (76.6%) | 22 (23.4%) |
| Educational Services | 263 (62.3%) | 159 (37.7%) |
| Health Care & Social Assistance | 139 (27.0%) | 375 (73.0%) |
| Arts, Entertainment & Recreation | 24 (33.8%) | 47 (66.2%) |
| Accommodation & Food Services | 91 (45.7%) | 108 (54.3%) |
| Public Administration | 54 (90.0%) | 6 (10.0%) |
| Total | 1,436 (46.5%) | 1,654 (53.5%) |
Education in South Patrick Shores
School Enrollment in South Patrick Shores
The most common levels of schooling among the 1,713 students in South Patrick Shores are college / undergraduate (471 | 27.5%), middle school (386 | 22.5%), and graduate / professional (363 | 21.2%).
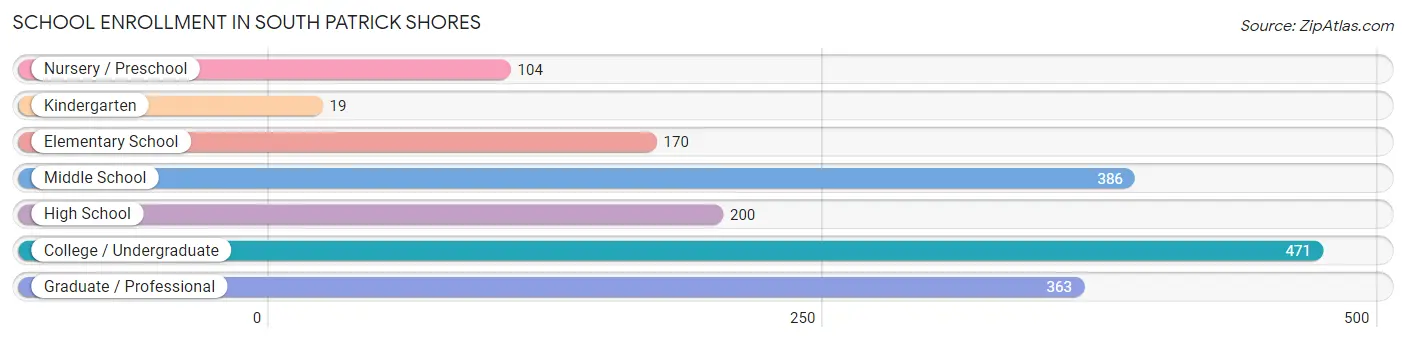
| School Level | # Students | % Students |
| Nursery / Preschool | 104 | 6.1% |
| Kindergarten | 19 | 1.1% |
| Elementary School | 170 | 9.9% |
| Middle School | 386 | 22.5% |
| High School | 200 | 11.7% |
| College / Undergraduate | 471 | 27.5% |
| Graduate / Professional | 363 | 21.2% |
| Total | 1,713 | 100.0% |
School Enrollment by Age by Funding Source in South Patrick Shores
Out of a total of 1,713 students who are enrolled in schools in South Patrick Shores, 420 (24.5%) attend a private institution, while the remaining 1,293 (75.5%) are enrolled in public schools. The age group of 35 years and over has the highest likelihood of being enrolled in private schools, with 69 (69.0% in the age bracket) enrolled. Conversely, the age group of 10 to 14 year olds has the lowest likelihood of being enrolled in a private school, with 350 (100.0% in the age bracket) attending a public institution.
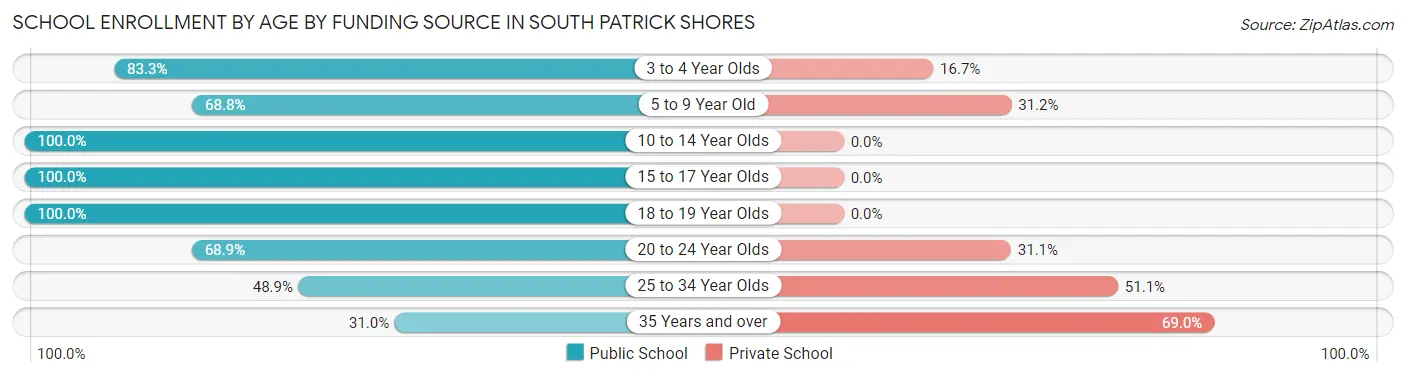
| Age Bracket | Public School | Private School |
| 3 to 4 Year Olds | 60 (83.3%) | 12 (16.7%) |
| 5 to 9 Year Old | 152 (68.8%) | 69 (31.2%) |
| 10 to 14 Year Olds | 350 (100.0%) | 0 (0.0%) |
| 15 to 17 Year Olds | 231 (100.0%) | 0 (0.0%) |
| 18 to 19 Year Olds | 50 (100.0%) | 0 (0.0%) |
| 20 to 24 Year Olds | 283 (68.9%) | 128 (31.1%) |
| 25 to 34 Year Olds | 136 (48.9%) | 142 (51.1%) |
| 35 Years and over | 31 (31.0%) | 69 (69.0%) |
| Total | 1,293 (75.5%) | 420 (24.5%) |
Educational Attainment by Field of Study in South Patrick Shores
Business (581 | 21.1%), engineering (375 | 13.6%), education (297 | 10.8%), science & technology (261 | 9.5%), and computers & mathematics (240 | 8.7%) are the most common fields of study among 2,755 individuals in South Patrick Shores who have obtained a bachelor's degree or higher.
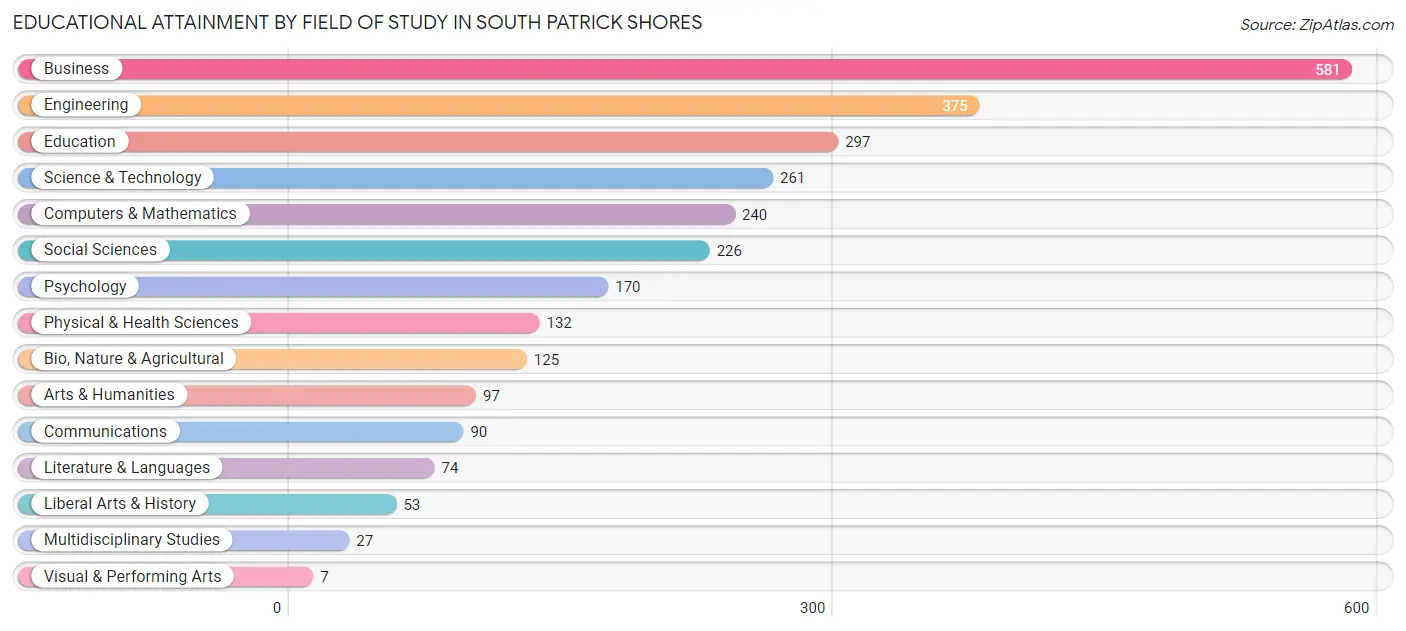
| Field of Study | # Graduates | % Graduates |
| Computers & Mathematics | 240 | 8.7% |
| Bio, Nature & Agricultural | 125 | 4.5% |
| Physical & Health Sciences | 132 | 4.8% |
| Psychology | 170 | 6.2% |
| Social Sciences | 226 | 8.2% |
| Engineering | 375 | 13.6% |
| Multidisciplinary Studies | 27 | 1.0% |
| Science & Technology | 261 | 9.5% |
| Business | 581 | 21.1% |
| Education | 297 | 10.8% |
| Literature & Languages | 74 | 2.7% |
| Liberal Arts & History | 53 | 1.9% |
| Visual & Performing Arts | 7 | 0.3% |
| Communications | 90 | 3.3% |
| Arts & Humanities | 97 | 3.5% |
| Total | 2,755 | 100.0% |
Transportation & Commute in South Patrick Shores
Vehicle Availability by Sex in South Patrick Shores
The most prevalent vehicle ownership categories in South Patrick Shores are males with 3 vehicles (545, accounting for 34.3%) and females with 3 vehicles (283, making up 32.7%).
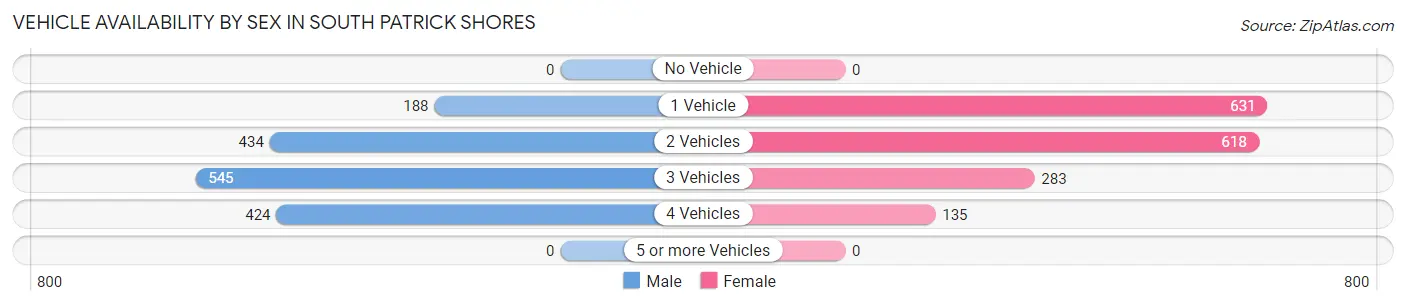
| Vehicles Available | Male | Female |
| No Vehicle | 0 (0.0%) | 0 (0.0%) |
| 1 Vehicle | 188 (11.8%) | 631 (37.9%) |
| 2 Vehicles | 434 (27.3%) | 618 (37.1%) |
| 3 Vehicles | 545 (34.3%) | 283 (17.0%) |
| 4 Vehicles | 424 (26.7%) | 135 (8.1%) |
| 5 or more Vehicles | 0 (0.0%) | 0 (0.0%) |
| Total | 1,591 (100.0%) | 1,667 (100.0%) |
Commute Time in South Patrick Shores
The most frequently occuring commute durations in South Patrick Shores are 30 to 34 minutes (618 commuters, 21.8%), 20 to 24 minutes (578 commuters, 20.4%), and 15 to 19 minutes (482 commuters, 17.0%).
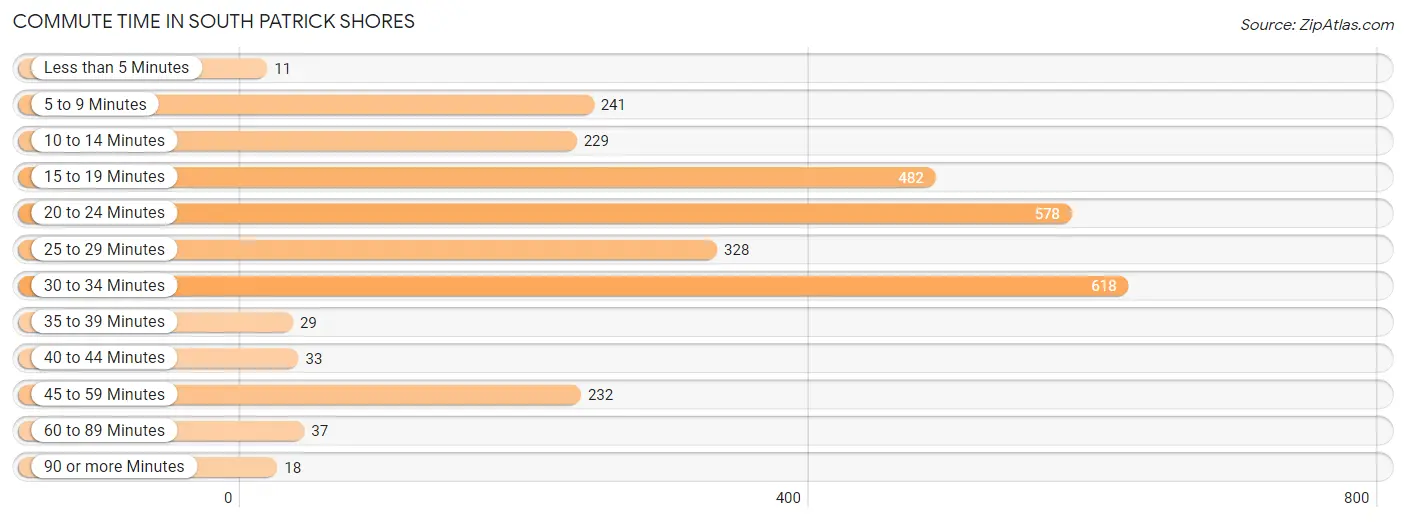
| Commute Time | # Commuters | % Commuters |
| Less than 5 Minutes | 11 | 0.4% |
| 5 to 9 Minutes | 241 | 8.5% |
| 10 to 14 Minutes | 229 | 8.1% |
| 15 to 19 Minutes | 482 | 17.0% |
| 20 to 24 Minutes | 578 | 20.4% |
| 25 to 29 Minutes | 328 | 11.6% |
| 30 to 34 Minutes | 618 | 21.8% |
| 35 to 39 Minutes | 29 | 1.0% |
| 40 to 44 Minutes | 33 | 1.2% |
| 45 to 59 Minutes | 232 | 8.2% |
| 60 to 89 Minutes | 37 | 1.3% |
| 90 or more Minutes | 18 | 0.6% |
Commute Time by Sex in South Patrick Shores
The most common commute times in South Patrick Shores are 30 to 34 minutes (309 commuters, 21.5%) for males and 30 to 34 minutes (309 commuters, 22.1%) for females.
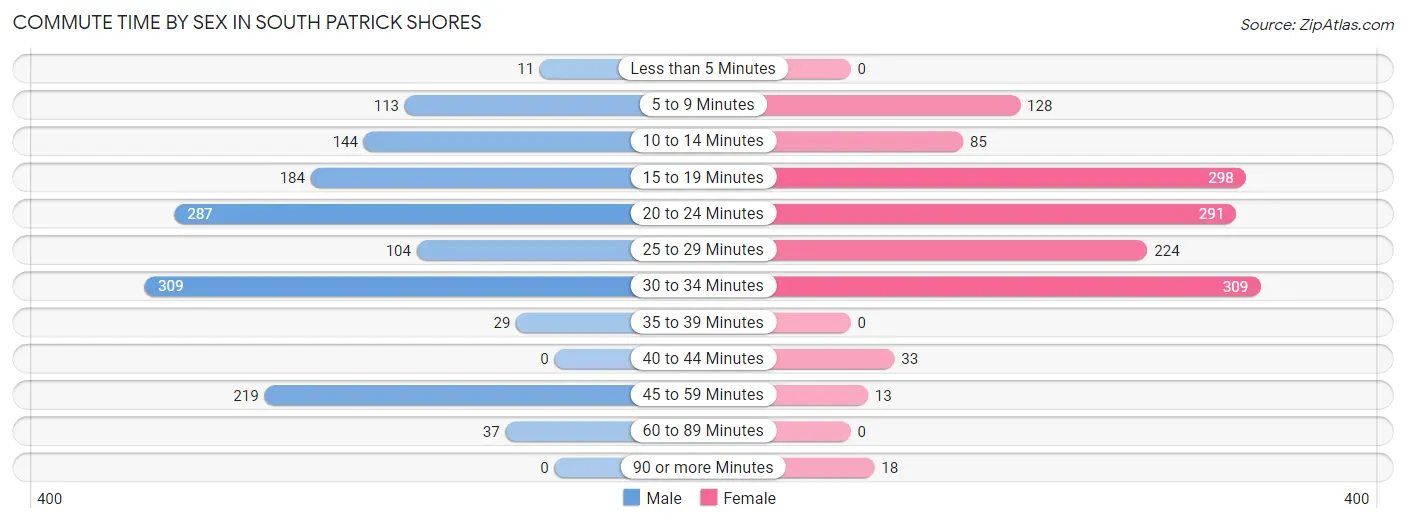
| Commute Time | Male | Female |
| Less than 5 Minutes | 11 (0.8%) | 0 (0.0%) |
| 5 to 9 Minutes | 113 (7.9%) | 128 (9.1%) |
| 10 to 14 Minutes | 144 (10.0%) | 85 (6.1%) |
| 15 to 19 Minutes | 184 (12.8%) | 298 (21.3%) |
| 20 to 24 Minutes | 287 (20.0%) | 291 (20.8%) |
| 25 to 29 Minutes | 104 (7.2%) | 224 (16.0%) |
| 30 to 34 Minutes | 309 (21.5%) | 309 (22.1%) |
| 35 to 39 Minutes | 29 (2.0%) | 0 (0.0%) |
| 40 to 44 Minutes | 0 (0.0%) | 33 (2.4%) |
| 45 to 59 Minutes | 219 (15.2%) | 13 (0.9%) |
| 60 to 89 Minutes | 37 (2.6%) | 0 (0.0%) |
| 90 or more Minutes | 0 (0.0%) | 18 (1.3%) |
Time of Departure to Work by Sex in South Patrick Shores
The most frequent times of departure to work in South Patrick Shores are 9:00 AM to 9:59 AM (239, 16.6%) for males and 6:30 AM to 6:59 AM (233, 16.7%) for females.
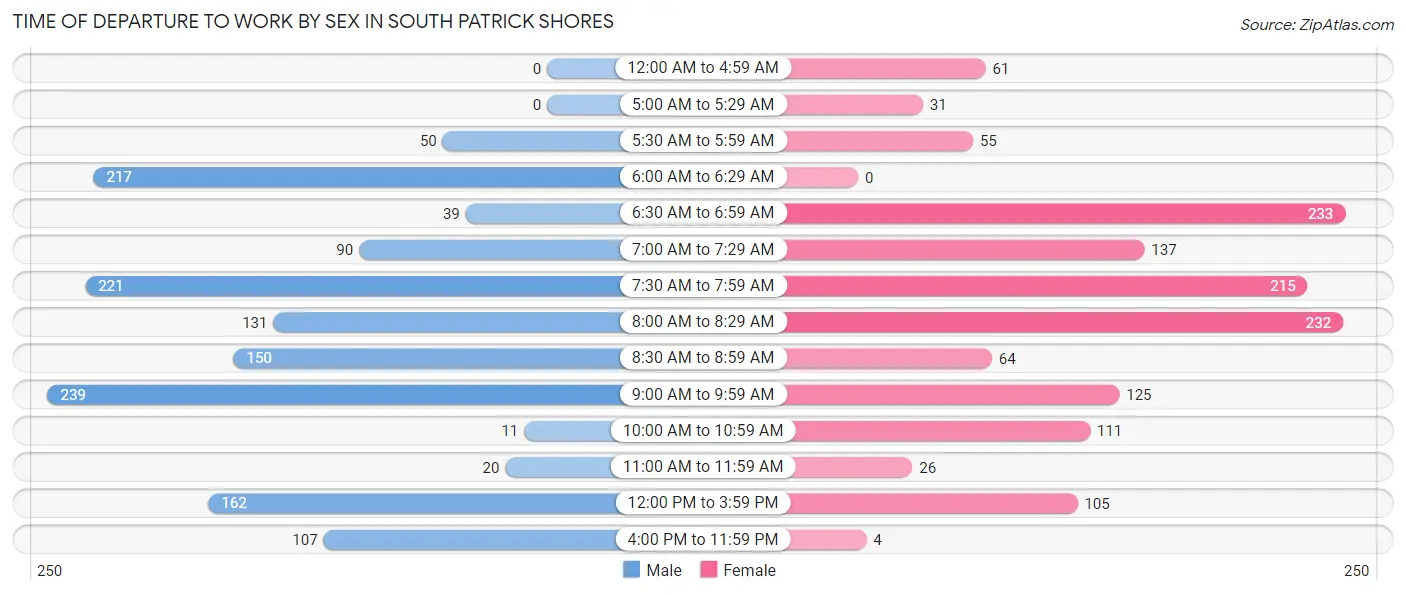
| Time of Departure | Male | Female |
| 12:00 AM to 4:59 AM | 0 (0.0%) | 61 (4.4%) |
| 5:00 AM to 5:29 AM | 0 (0.0%) | 31 (2.2%) |
| 5:30 AM to 5:59 AM | 50 (3.5%) | 55 (3.9%) |
| 6:00 AM to 6:29 AM | 217 (15.1%) | 0 (0.0%) |
| 6:30 AM to 6:59 AM | 39 (2.7%) | 233 (16.7%) |
| 7:00 AM to 7:29 AM | 90 (6.3%) | 137 (9.8%) |
| 7:30 AM to 7:59 AM | 221 (15.4%) | 215 (15.4%) |
| 8:00 AM to 8:29 AM | 131 (9.1%) | 232 (16.6%) |
| 8:30 AM to 8:59 AM | 150 (10.4%) | 64 (4.6%) |
| 9:00 AM to 9:59 AM | 239 (16.6%) | 125 (8.9%) |
| 10:00 AM to 10:59 AM | 11 (0.8%) | 111 (7.9%) |
| 11:00 AM to 11:59 AM | 20 (1.4%) | 26 (1.9%) |
| 12:00 PM to 3:59 PM | 162 (11.3%) | 105 (7.5%) |
| 4:00 PM to 11:59 PM | 107 (7.4%) | 4 (0.3%) |
| Total | 1,437 (100.0%) | 1,399 (100.0%) |
Housing Occupancy in South Patrick Shores
Occupancy by Ownership in South Patrick Shores
Of the total 2,976 dwellings in South Patrick Shores, owner-occupied units account for 2,460 (82.7%), while renter-occupied units make up 516 (17.3%).
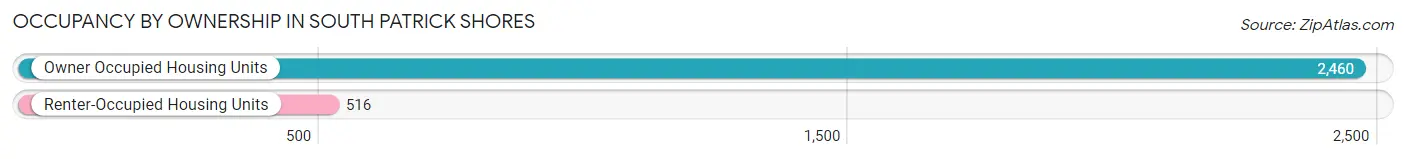
| Occupancy | # Housing Units | % Housing Units |
| Owner Occupied Housing Units | 2,460 | 82.7% |
| Renter-Occupied Housing Units | 516 | 17.3% |
| Total Occupied Housing Units | 2,976 | 100.0% |
Occupancy by Household Size in South Patrick Shores
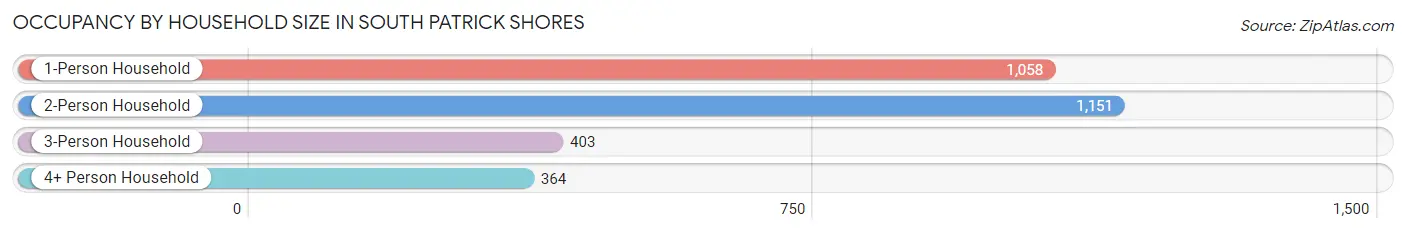
| Household Size | # Housing Units | % Housing Units |
| 1-Person Household | 1,058 | 35.5% |
| 2-Person Household | 1,151 | 38.7% |
| 3-Person Household | 403 | 13.5% |
| 4+ Person Household | 364 | 12.2% |
| Total Housing Units | 2,976 | 100.0% |
Occupancy by Ownership by Household Size in South Patrick Shores
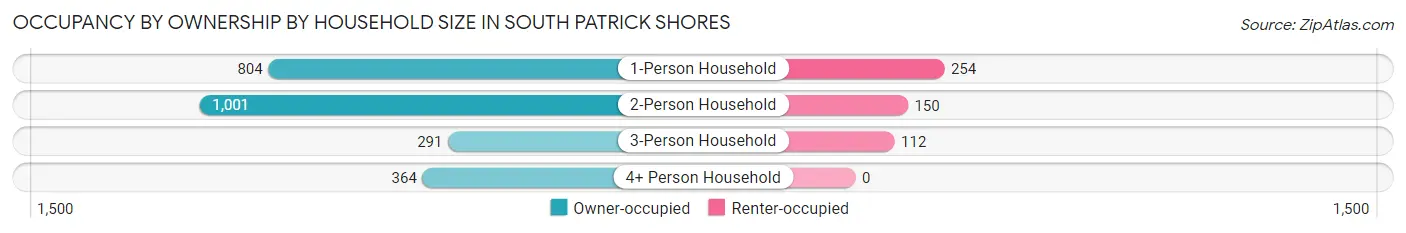
| Household Size | Owner-occupied | Renter-occupied |
| 1-Person Household | 804 (76.0%) | 254 (24.0%) |
| 2-Person Household | 1,001 (87.0%) | 150 (13.0%) |
| 3-Person Household | 291 (72.2%) | 112 (27.8%) |
| 4+ Person Household | 364 (100.0%) | 0 (0.0%) |
| Total Housing Units | 2,460 (82.7%) | 516 (17.3%) |
Occupancy by Educational Attainment in South Patrick Shores
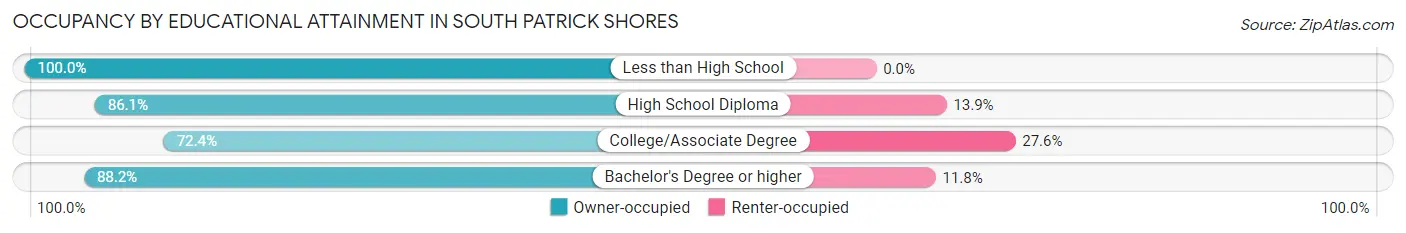
| Household Size | Owner-occupied | Renter-occupied |
| Less than High School | 23 (100.0%) | 0 (0.0%) |
| High School Diploma | 383 (86.1%) | 62 (13.9%) |
| College/Associate Degree | 727 (72.4%) | 277 (27.6%) |
| Bachelor's Degree or higher | 1,327 (88.2%) | 177 (11.8%) |
Occupancy by Age of Householder in South Patrick Shores
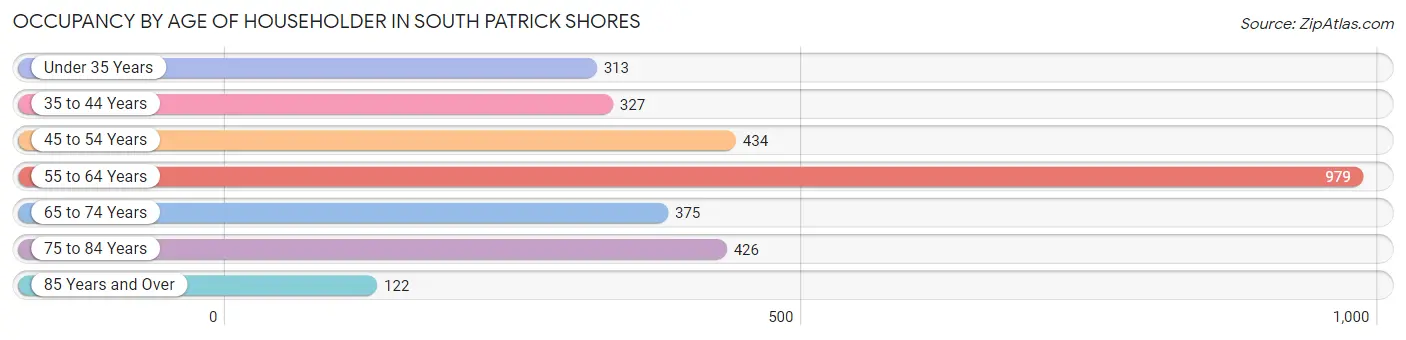
| Age Bracket | # Households | % Households |
| Under 35 Years | 313 | 10.5% |
| 35 to 44 Years | 327 | 11.0% |
| 45 to 54 Years | 434 | 14.6% |
| 55 to 64 Years | 979 | 32.9% |
| 65 to 74 Years | 375 | 12.6% |
| 75 to 84 Years | 426 | 14.3% |
| 85 Years and Over | 122 | 4.1% |
| Total | 2,976 | 100.0% |
Housing Finances in South Patrick Shores
Median Income by Occupancy in South Patrick Shores
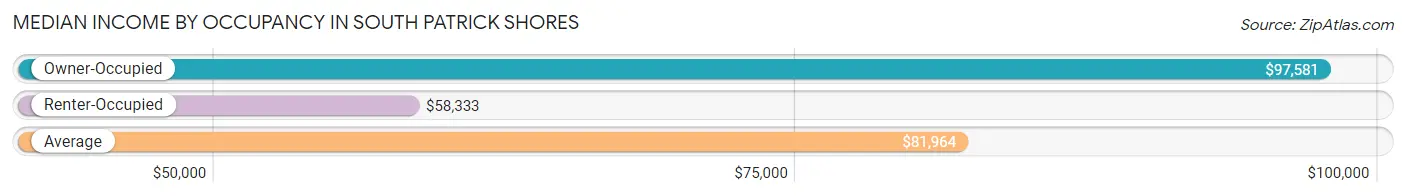
| Occupancy Type | # Households | Median Income |
| Owner-Occupied | 2,460 (82.7%) | $97,581 |
| Renter-Occupied | 516 (17.3%) | $58,333 |
| Average | 2,976 (100.0%) | $81,964 |
Occupancy by Householder Income Bracket in South Patrick Shores
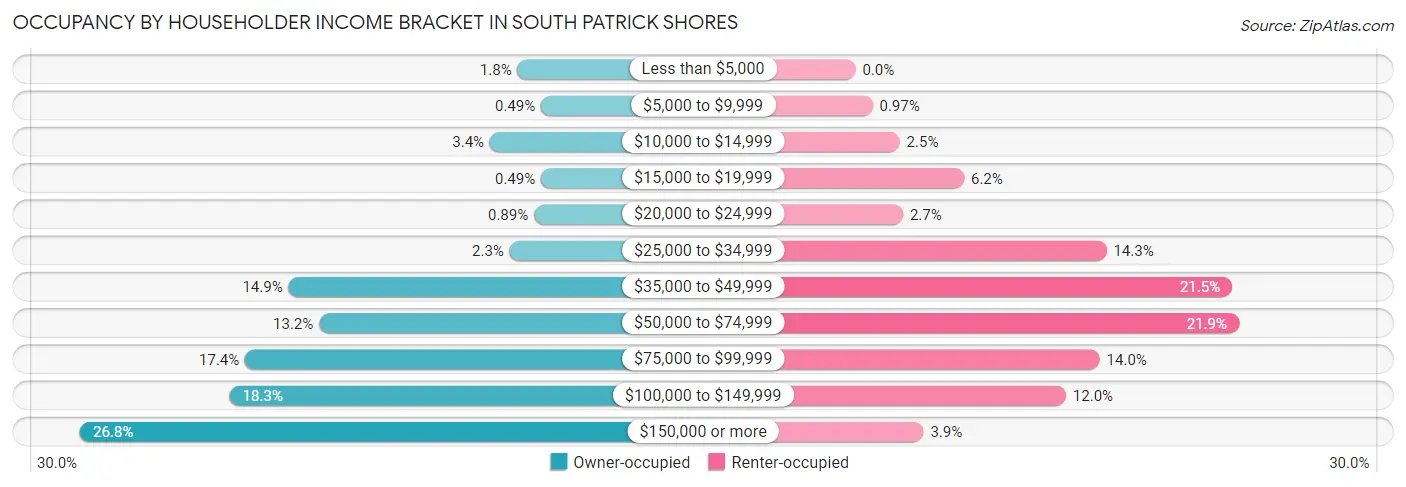
| Income Bracket | Owner-occupied | Renter-occupied |
| Less than $5,000 | 45 (1.8%) | 0 (0.0%) |
| $5,000 to $9,999 | 12 (0.5%) | 5 (1.0%) |
| $10,000 to $14,999 | 84 (3.4%) | 13 (2.5%) |
| $15,000 to $19,999 | 12 (0.5%) | 32 (6.2%) |
| $20,000 to $24,999 | 22 (0.9%) | 14 (2.7%) |
| $25,000 to $34,999 | 56 (2.3%) | 74 (14.3%) |
| $35,000 to $49,999 | 367 (14.9%) | 111 (21.5%) |
| $50,000 to $74,999 | 324 (13.2%) | 113 (21.9%) |
| $75,000 to $99,999 | 428 (17.4%) | 72 (14.0%) |
| $100,000 to $149,999 | 450 (18.3%) | 62 (12.0%) |
| $150,000 or more | 660 (26.8%) | 20 (3.9%) |
| Total | 2,460 (100.0%) | 516 (100.0%) |
Monthly Housing Cost Tiers in South Patrick Shores
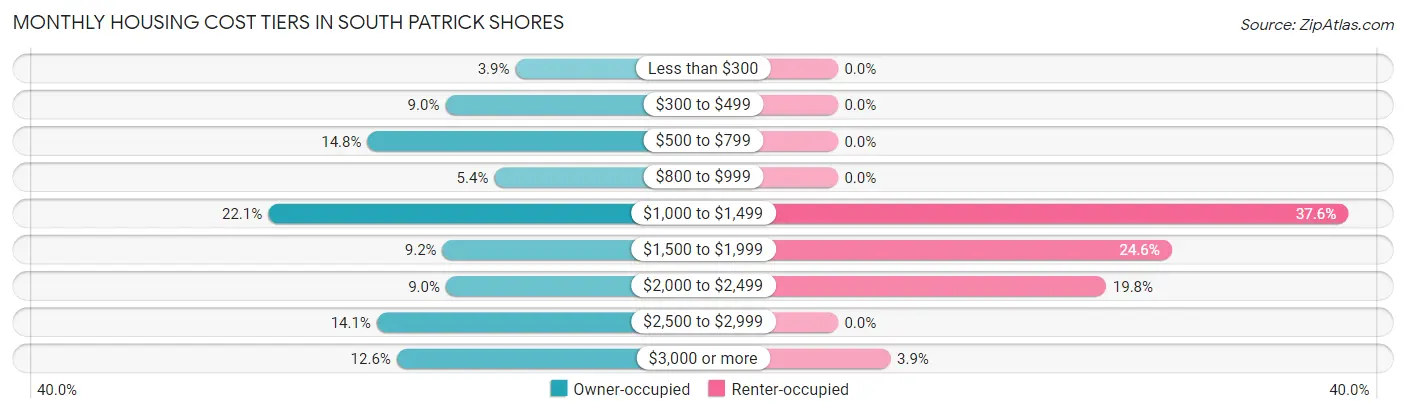
| Monthly Cost | Owner-occupied | Renter-occupied |
| Less than $300 | 95 (3.9%) | 0 (0.0%) |
| $300 to $499 | 222 (9.0%) | 0 (0.0%) |
| $500 to $799 | 363 (14.8%) | 0 (0.0%) |
| $800 to $999 | 133 (5.4%) | 0 (0.0%) |
| $1,000 to $1,499 | 543 (22.1%) | 194 (37.6%) |
| $1,500 to $1,999 | 227 (9.2%) | 127 (24.6%) |
| $2,000 to $2,499 | 221 (9.0%) | 102 (19.8%) |
| $2,500 to $2,999 | 346 (14.1%) | 0 (0.0%) |
| $3,000 or more | 310 (12.6%) | 20 (3.9%) |
| Total | 2,460 (100.0%) | 516 (100.0%) |
Physical Housing Characteristics in South Patrick Shores
Housing Structures in South Patrick Shores
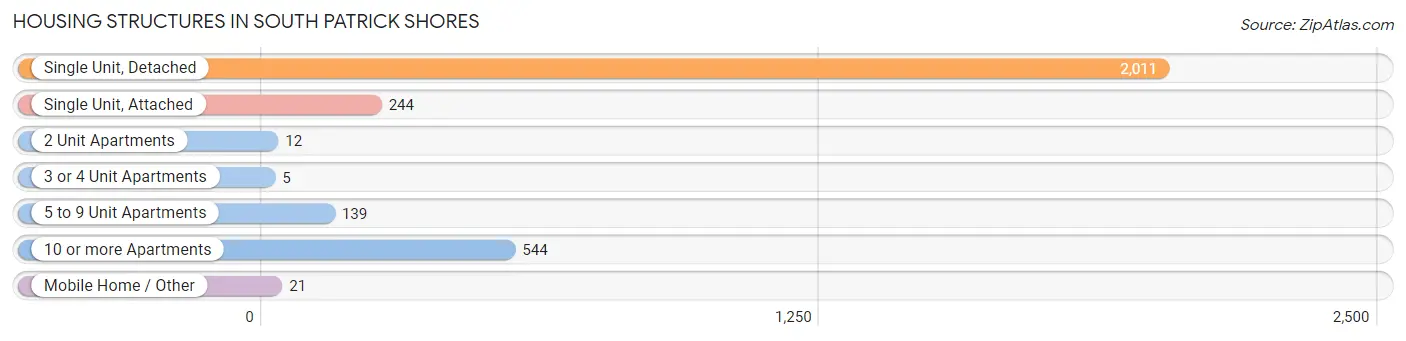
| Structure Type | # Housing Units | % Housing Units |
| Single Unit, Detached | 2,011 | 67.6% |
| Single Unit, Attached | 244 | 8.2% |
| 2 Unit Apartments | 12 | 0.4% |
| 3 or 4 Unit Apartments | 5 | 0.2% |
| 5 to 9 Unit Apartments | 139 | 4.7% |
| 10 or more Apartments | 544 | 18.3% |
| Mobile Home / Other | 21 | 0.7% |
| Total | 2,976 | 100.0% |
Housing Structures by Occupancy in South Patrick Shores
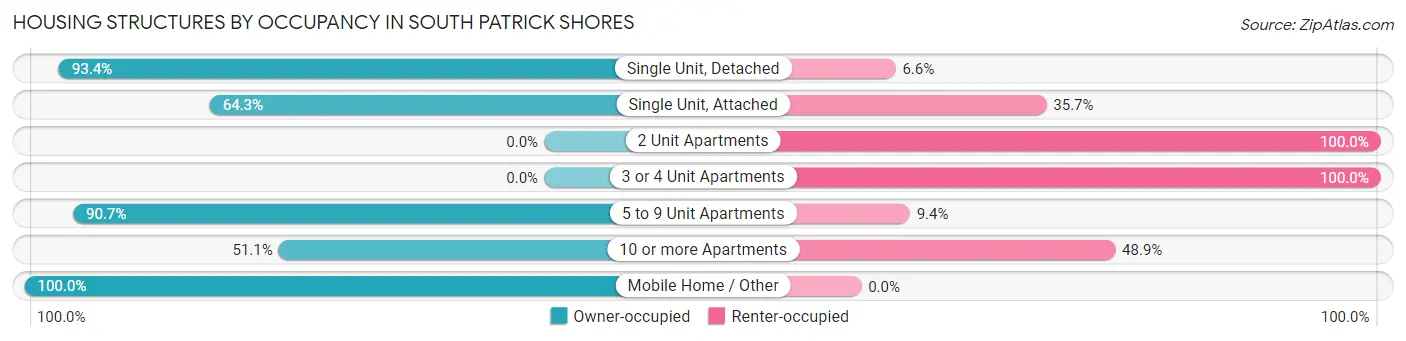
| Structure Type | Owner-occupied | Renter-occupied |
| Single Unit, Detached | 1,878 (93.4%) | 133 (6.6%) |
| Single Unit, Attached | 157 (64.3%) | 87 (35.7%) |
| 2 Unit Apartments | 0 (0.0%) | 12 (100.0%) |
| 3 or 4 Unit Apartments | 0 (0.0%) | 5 (100.0%) |
| 5 to 9 Unit Apartments | 126 (90.6%) | 13 (9.3%) |
| 10 or more Apartments | 278 (51.1%) | 266 (48.9%) |
| Mobile Home / Other | 21 (100.0%) | 0 (0.0%) |
| Total | 2,460 (82.7%) | 516 (17.3%) |
Housing Structures by Number of Rooms in South Patrick Shores
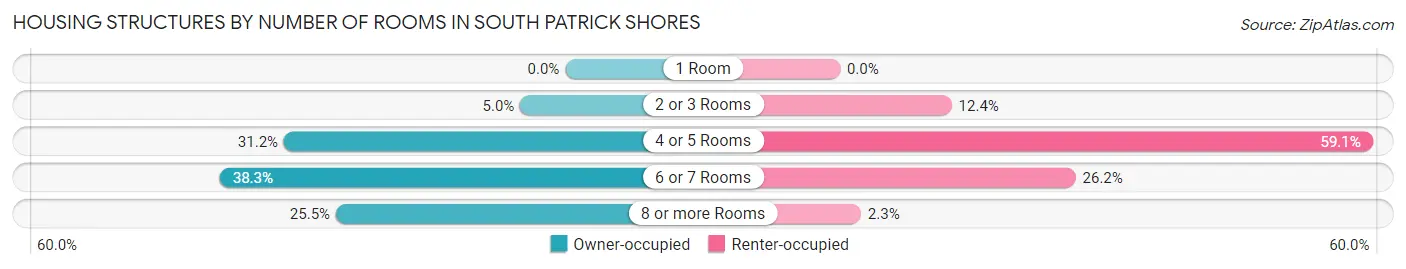
| Number of Rooms | Owner-occupied | Renter-occupied |
| 1 Room | 0 (0.0%) | 0 (0.0%) |
| 2 or 3 Rooms | 123 (5.0%) | 64 (12.4%) |
| 4 or 5 Rooms | 768 (31.2%) | 305 (59.1%) |
| 6 or 7 Rooms | 943 (38.3%) | 135 (26.2%) |
| 8 or more Rooms | 626 (25.5%) | 12 (2.3%) |
| Total | 2,460 (100.0%) | 516 (100.0%) |
Housing Structure by Heating Type in South Patrick Shores
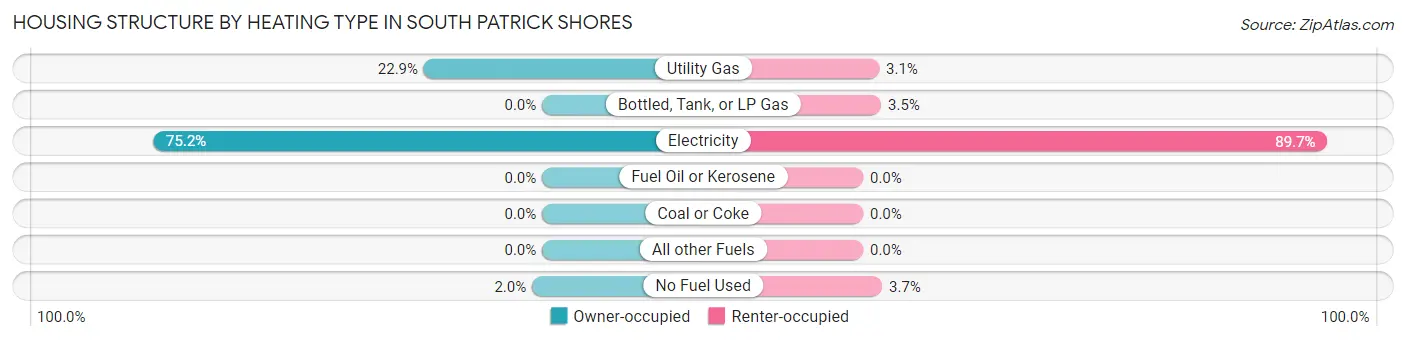
| Heating Type | Owner-occupied | Renter-occupied |
| Utility Gas | 562 (22.9%) | 16 (3.1%) |
| Bottled, Tank, or LP Gas | 0 (0.0%) | 18 (3.5%) |
| Electricity | 1,850 (75.2%) | 463 (89.7%) |
| Fuel Oil or Kerosene | 0 (0.0%) | 0 (0.0%) |
| Coal or Coke | 0 (0.0%) | 0 (0.0%) |
| All other Fuels | 0 (0.0%) | 0 (0.0%) |
| No Fuel Used | 48 (1.9%) | 19 (3.7%) |
| Total | 2,460 (100.0%) | 516 (100.0%) |
Household Vehicle Usage in South Patrick Shores
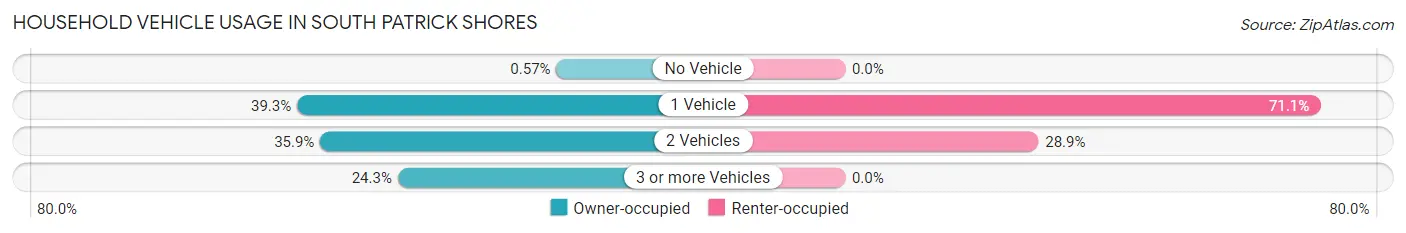
| Vehicles per Household | Owner-occupied | Renter-occupied |
| No Vehicle | 14 (0.6%) | 0 (0.0%) |
| 1 Vehicle | 967 (39.3%) | 367 (71.1%) |
| 2 Vehicles | 882 (35.8%) | 149 (28.9%) |
| 3 or more Vehicles | 597 (24.3%) | 0 (0.0%) |
| Total | 2,460 (100.0%) | 516 (100.0%) |
Real Estate & Mortgages in South Patrick Shores
Real Estate and Mortgage Overview in South Patrick Shores
| Characteristic | Without Mortgage | With Mortgage |
| Housing Units | 968 | 1,492 |
| Median Property Value | $320,900 | $424,700 |
| Median Household Income | $62,576 | $471 |
| Monthly Housing Costs | $684 | $310 |
| Real Estate Taxes | $2,674 | $45 |
Property Value by Mortgage Status in South Patrick Shores
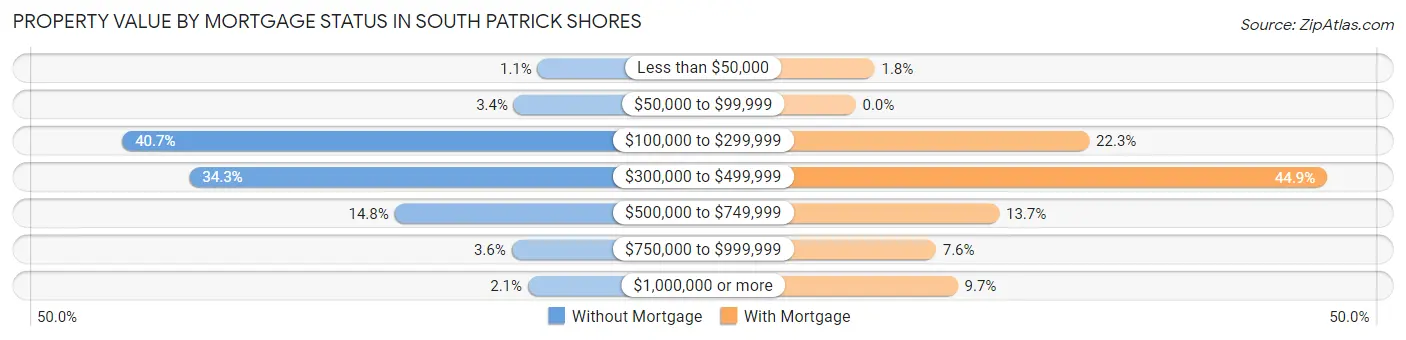
| Property Value | Without Mortgage | With Mortgage |
| Less than $50,000 | 11 (1.1%) | 27 (1.8%) |
| $50,000 to $99,999 | 33 (3.4%) | 0 (0.0%) |
| $100,000 to $299,999 | 394 (40.7%) | 332 (22.3%) |
| $300,000 to $499,999 | 332 (34.3%) | 670 (44.9%) |
| $500,000 to $749,999 | 143 (14.8%) | 204 (13.7%) |
| $750,000 to $999,999 | 35 (3.6%) | 114 (7.6%) |
| $1,000,000 or more | 20 (2.1%) | 145 (9.7%) |
| Total | 968 (100.0%) | 1,492 (100.0%) |
Household Income by Mortgage Status in South Patrick Shores
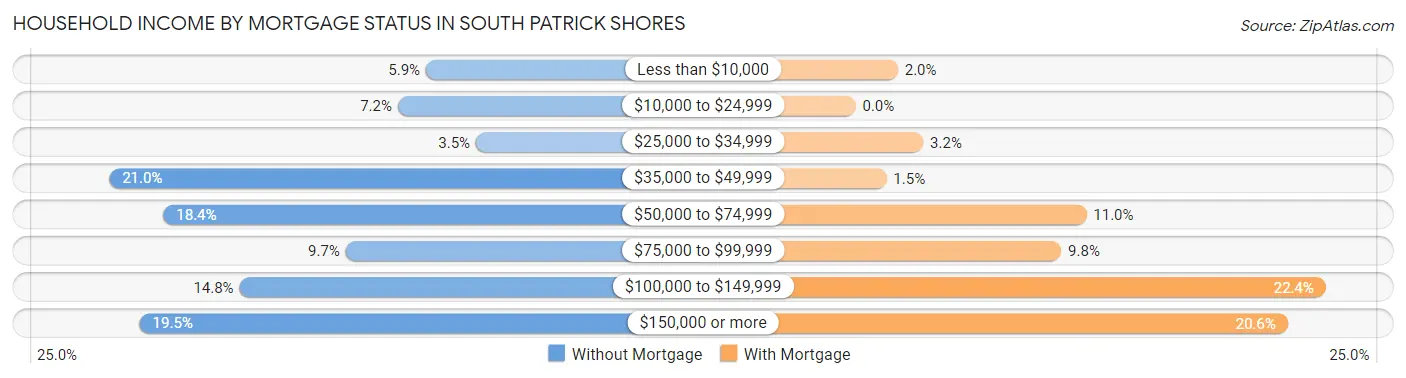
| Household Income | Without Mortgage | With Mortgage |
| Less than $10,000 | 57 (5.9%) | 30 (2.0%) |
| $10,000 to $24,999 | 70 (7.2%) | 0 (0.0%) |
| $25,000 to $34,999 | 34 (3.5%) | 48 (3.2%) |
| $35,000 to $49,999 | 203 (21.0%) | 22 (1.5%) |
| $50,000 to $74,999 | 178 (18.4%) | 164 (11.0%) |
| $75,000 to $99,999 | 94 (9.7%) | 146 (9.8%) |
| $100,000 to $149,999 | 143 (14.8%) | 334 (22.4%) |
| $150,000 or more | 189 (19.5%) | 307 (20.6%) |
| Total | 968 (100.0%) | 1,492 (100.0%) |
Property Value to Household Income Ratio in South Patrick Shores
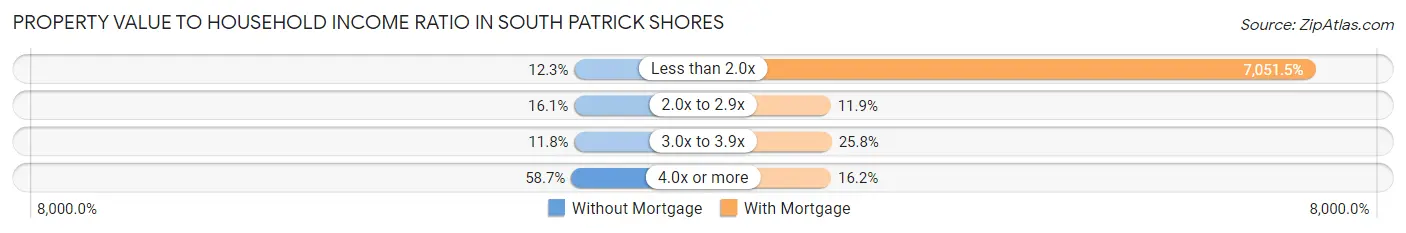
| Value-to-Income Ratio | Without Mortgage | With Mortgage |
| Less than 2.0x | 119 (12.3%) | 105,208 (7,051.5%) |
| 2.0x to 2.9x | 156 (16.1%) | 178 (11.9%) |
| 3.0x to 3.9x | 114 (11.8%) | 385 (25.8%) |
| 4.0x or more | 568 (58.7%) | 242 (16.2%) |
| Total | 968 (100.0%) | 1,492 (100.0%) |
Real Estate Taxes by Mortgage Status in South Patrick Shores
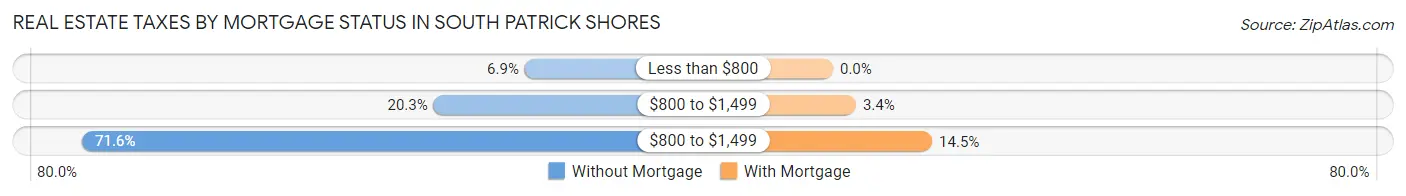
| Property Taxes | Without Mortgage | With Mortgage |
| Less than $800 | 67 (6.9%) | 0 (0.0%) |
| $800 to $1,499 | 196 (20.3%) | 50 (3.4%) |
| $800 to $1,499 | 693 (71.6%) | 216 (14.5%) |
| Total | 968 (100.0%) | 1,492 (100.0%) |
Health & Disability in South Patrick Shores
Health Insurance Coverage by Age in South Patrick Shores
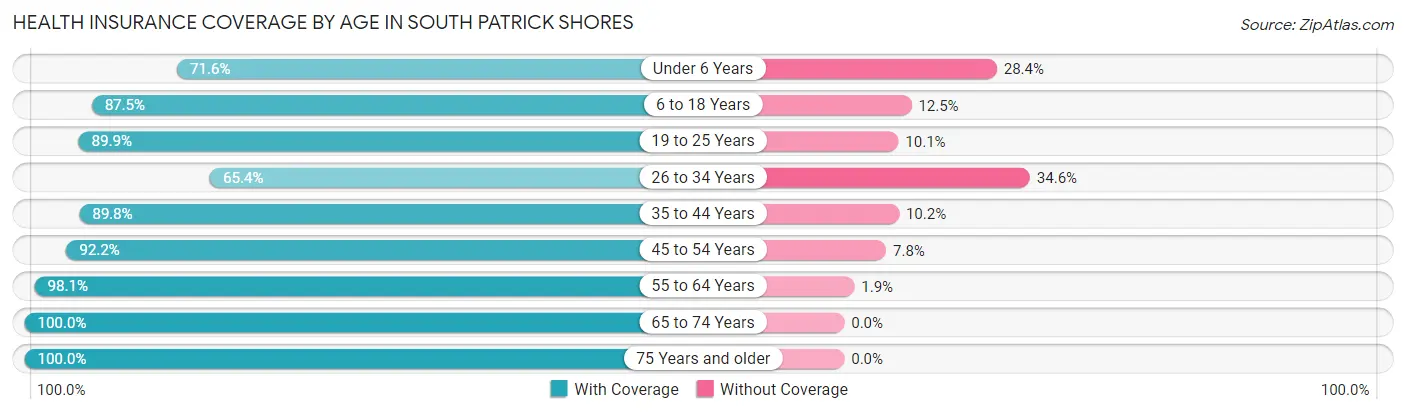
| Age Bracket | With Coverage | Without Coverage |
| Under 6 Years | 151 (71.6%) | 60 (28.4%) |
| 6 to 18 Years | 678 (87.5%) | 97 (12.5%) |
| 19 to 25 Years | 731 (89.9%) | 82 (10.1%) |
| 26 to 34 Years | 342 (65.4%) | 181 (34.6%) |
| 35 to 44 Years | 440 (89.8%) | 50 (10.2%) |
| 45 to 54 Years | 544 (92.2%) | 46 (7.8%) |
| 55 to 64 Years | 1,411 (98.1%) | 27 (1.9%) |
| 65 to 74 Years | 1,050 (100.0%) | 0 (0.0%) |
| 75 Years and older | 830 (100.0%) | 0 (0.0%) |
| Total | 6,177 (91.9%) | 543 (8.1%) |
Health Insurance Coverage by Citizenship Status in South Patrick Shores
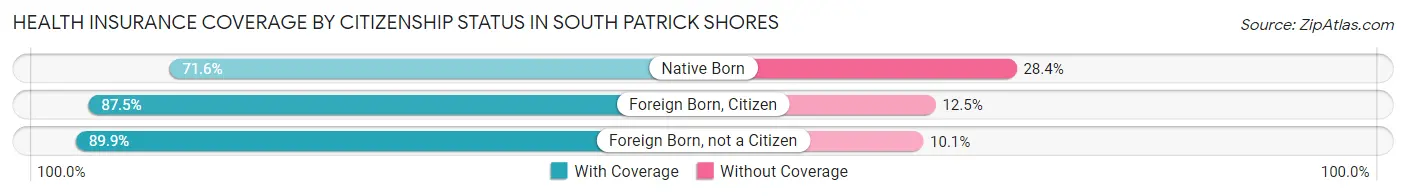
| Citizenship Status | With Coverage | Without Coverage |
| Native Born | 151 (71.6%) | 60 (28.4%) |
| Foreign Born, Citizen | 678 (87.5%) | 97 (12.5%) |
| Foreign Born, not a Citizen | 731 (89.9%) | 82 (10.1%) |
Health Insurance Coverage by Household Income in South Patrick Shores
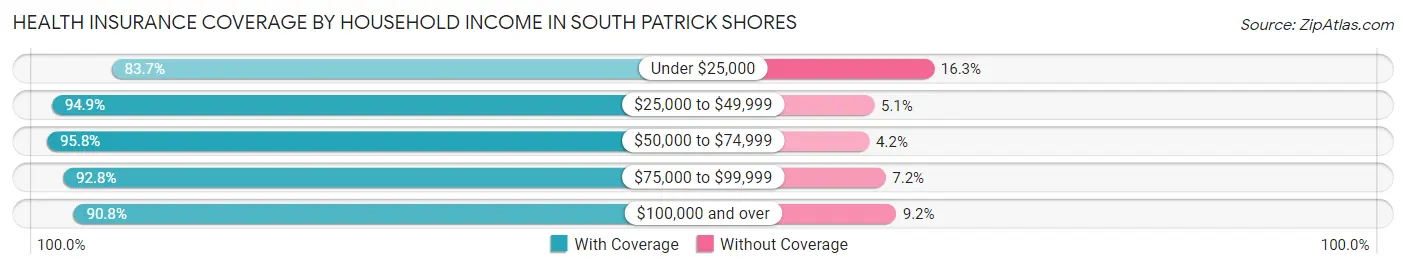
| Household Income | With Coverage | Without Coverage |
| Under $25,000 | 277 (83.7%) | 54 (16.3%) |
| $25,000 to $49,999 | 930 (94.9%) | 50 (5.1%) |
| $50,000 to $74,999 | 617 (95.8%) | 27 (4.2%) |
| $75,000 to $99,999 | 1,286 (92.8%) | 100 (7.2%) |
| $100,000 and over | 3,066 (90.8%) | 310 (9.2%) |
Public vs Private Health Insurance Coverage by Age in South Patrick Shores
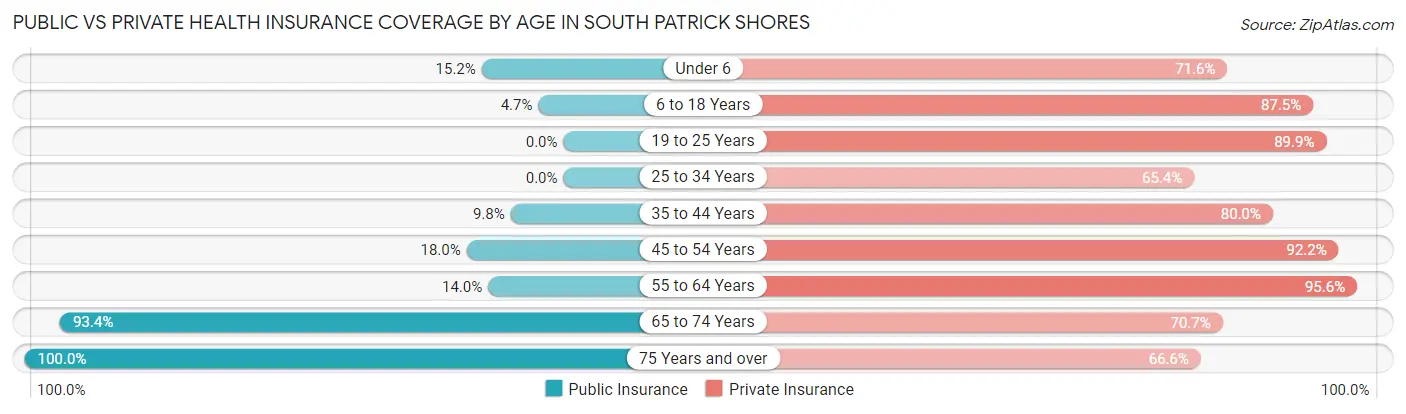
| Age Bracket | Public Insurance | Private Insurance |
| Under 6 | 32 (15.2%) | 151 (71.6%) |
| 6 to 18 Years | 36 (4.6%) | 678 (87.5%) |
| 19 to 25 Years | 0 (0.0%) | 731 (89.9%) |
| 25 to 34 Years | 0 (0.0%) | 342 (65.4%) |
| 35 to 44 Years | 48 (9.8%) | 392 (80.0%) |
| 45 to 54 Years | 106 (18.0%) | 544 (92.2%) |
| 55 to 64 Years | 201 (14.0%) | 1,375 (95.6%) |
| 65 to 74 Years | 981 (93.4%) | 742 (70.7%) |
| 75 Years and over | 830 (100.0%) | 553 (66.6%) |
| Total | 2,234 (33.2%) | 5,508 (82.0%) |
Disability Status by Sex by Age in South Patrick Shores
| Age Bracket | Male | Female |
| Under 5 Years | 0 (0.0%) | 0 (0.0%) |
| 5 to 17 Years | 19 (3.5%) | 29 (10.9%) |
| 18 to 34 Years | 263 (29.4%) | 0 (0.0%) |
| 35 to 64 Years | 186 (20.0%) | 217 (13.7%) |
| 65 to 74 Years | 33 (8.9%) | 79 (11.6%) |
| 75 Years and over | 164 (36.1%) | 138 (36.7%) |
Disability Class by Sex by Age in South Patrick Shores
Disability Class: Hearing Difficulty
| Age Bracket | Male | Female |
| Under 5 Years | 0 (0.0%) | 0 (0.0%) |
| 5 to 17 Years | 0 (0.0%) | 0 (0.0%) |
| 18 to 34 Years | 0 (0.0%) | 0 (0.0%) |
| 35 to 64 Years | 99 (10.6%) | 26 (1.6%) |
| 65 to 74 Years | 0 (0.0%) | 39 (5.7%) |
| 75 Years and over | 137 (30.2%) | 70 (18.6%) |
Disability Class: Vision Difficulty
| Age Bracket | Male | Female |
| Under 5 Years | 0 (0.0%) | 0 (0.0%) |
| 5 to 17 Years | 0 (0.0%) | 0 (0.0%) |
| 18 to 34 Years | 0 (0.0%) | 0 (0.0%) |
| 35 to 64 Years | 0 (0.0%) | 42 (2.6%) |
| 65 to 74 Years | 0 (0.0%) | 0 (0.0%) |
| 75 Years and over | 22 (4.9%) | 0 (0.0%) |
Disability Class: Cognitive Difficulty
| Age Bracket | Male | Female |
| 5 to 17 Years | 0 (0.0%) | 29 (10.9%) |
| 18 to 34 Years | 263 (29.4%) | 0 (0.0%) |
| 35 to 64 Years | 65 (7.0%) | 28 (1.8%) |
| 65 to 74 Years | 33 (8.9%) | 0 (0.0%) |
| 75 Years and over | 55 (12.1%) | 66 (17.5%) |
Disability Class: Ambulatory Difficulty
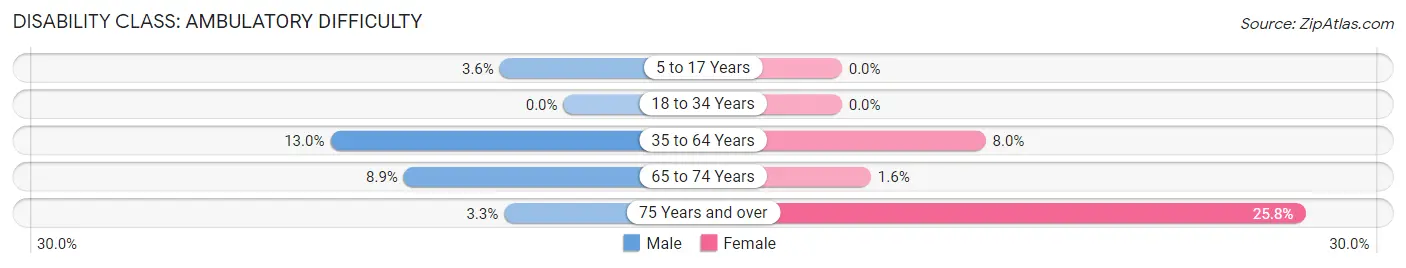
| Age Bracket | Male | Female |
| 5 to 17 Years | 19 (3.5%) | 0 (0.0%) |
| 18 to 34 Years | 0 (0.0%) | 0 (0.0%) |
| 35 to 64 Years | 121 (13.0%) | 127 (8.0%) |
| 65 to 74 Years | 33 (8.9%) | 11 (1.6%) |
| 75 Years and over | 15 (3.3%) | 97 (25.8%) |
Disability Class: Self-Care Difficulty
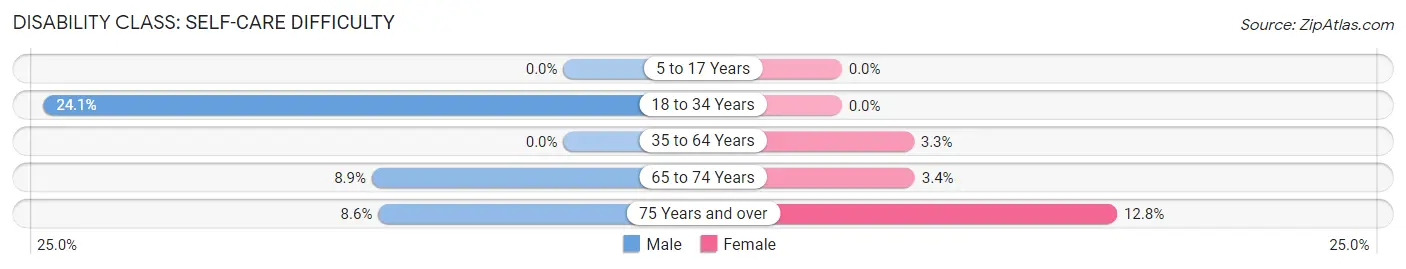
| Age Bracket | Male | Female |
| 5 to 17 Years | 0 (0.0%) | 0 (0.0%) |
| 18 to 34 Years | 216 (24.1%) | 0 (0.0%) |
| 35 to 64 Years | 0 (0.0%) | 53 (3.3%) |
| 65 to 74 Years | 33 (8.9%) | 23 (3.4%) |
| 75 Years and over | 39 (8.6%) | 48 (12.8%) |
Technology Access in South Patrick Shores
Computing Device Access in South Patrick Shores
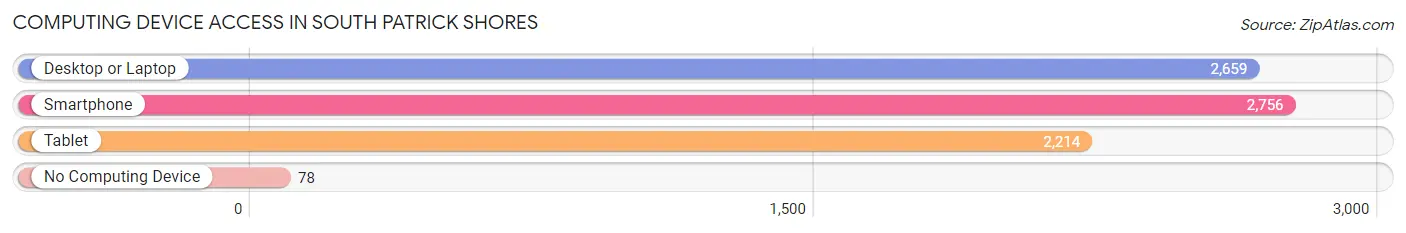
| Device Type | # Households | % Households |
| Desktop or Laptop | 2,659 | 89.3% |
| Smartphone | 2,756 | 92.6% |
| Tablet | 2,214 | 74.4% |
| No Computing Device | 78 | 2.6% |
| Total | 2,976 | 100.0% |
Internet Access in South Patrick Shores
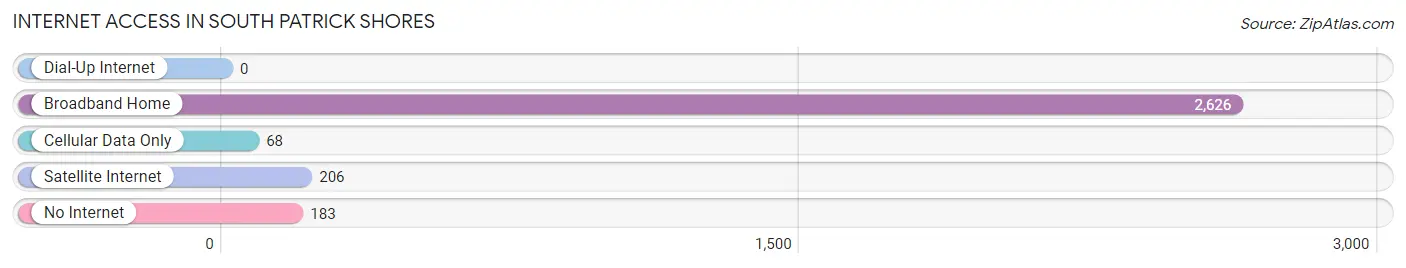
| Internet Type | # Households | % Households |
| Dial-Up Internet | 0 | 0.0% |
| Broadband Home | 2,626 | 88.2% |
| Cellular Data Only | 68 | 2.3% |
| Satellite Internet | 206 | 6.9% |
| No Internet | 183 | 6.1% |
| Total | 2,976 | 100.0% |
South Patrick Shores Summary
Patrick Shores is a census-designated place (CDP) located in Brevard County, Florida, United States. It is part of the Palm Bay–Melbourne–Titusville Metropolitan Statistical Area. The population was 5,845 at the 2010 census.
History
The area now known as South Patrick Shores was originally inhabited by the Ais Indians, who were part of the Seminole tribe. The Ais Indians lived in the area for centuries before the arrival of Europeans. The first Europeans to settle in the area were Spanish explorers in the late 1500s. The area was then part of the Spanish colony of Florida until 1821, when it became part of the United States.
In the early 1900s, the area was sparsely populated and was mostly used for cattle ranching. In the 1950s, the area began to be developed as a residential community. The first homes were built in the area in the late 1950s and early 1960s. The area was officially incorporated as the Town of South Patrick Shores in 1962.
Geography
South Patrick Shores is located at 28°10'25" North, 80°36'17" West (28.173611, -80.604722). According to the United States Census Bureau, the CDP has a total area of 4.2 square miles (10.8 km2), of which 4.1 square miles (10.6 km2) is land and 0.1 square miles (0.2 km2) (2.44%) is water.
Economy
South Patrick Shores is a primarily residential community, with most of its residents employed in the nearby cities of Melbourne and Palm Bay. The area is home to several small businesses, including restaurants, retail stores, and professional services. The area is also home to several marinas, which provide access to the Indian River Lagoon and the Atlantic Ocean.
Demographics
As of the census of 2000, there were 5,845 people, 2,541 households, and 1,717 families residing in the CDP. The population density was 1,427.3 people per square mile (550.9/km2). There were 2,817 housing units at an average density of 690.2/sq mi (266.3/km2). The racial makeup of the CDP was 94.45% White, 2.45% African American, 0.17% Native American, 1.17% Asian, 0.02% Pacific Islander, 0.72% from other races, and 0.94% from two or more races. Hispanic or Latino of any race were 3.45% of the population.
There were 2,541 households, out of which 22.2% had children under the age of 18 living with them, 56.2% were married couples living together, 8.7% had a female householder with no husband present, and 32.2% were non-families. 26.2% of all households were made up of individuals, and 11.2% had someone living alone who was 65 years of age or older. The average household size was 2.30 and the average family size was 2.76.
In the CDP, the population was spread out, with 19.2% under the age of 18, 5.2% from 18 to 24, 24.2% from 25 to 44, 28.2% from 45 to 64, and 23.2% who were 65 years of age or older. The median age was 45 years. For every 100 females, there were 94.2 males. For every 100 females age 18 and over, there were 91.2 males.
The median income for a household in the CDP was $45,938, and the median income for a family was $51,944. Males had a median income of $40,938 versus $27,917 for females. The per capita income for the CDP was $25,945. About 4.2% of families and 6.2% of the population were below the poverty line, including 8.2% of those under age 18 and 4.2% of those age 65 or over.
Common Questions
What is Per Capita Income in South Patrick Shores?
Per Capita income in South Patrick Shores is $52,461.
What is the Median Family Income in South Patrick Shores?
Median Family Income in South Patrick Shores is $105,208.
What is the Median Household income in South Patrick Shores?
Median Household Income in South Patrick Shores is $81,964.
What is Income or Wage Gap in South Patrick Shores?
Income or Wage Gap in South Patrick Shores is 15.9%.
Women in South Patrick Shores earn 84.1 cents for every dollar earned by a man.
What is Inequality or Gini Index in South Patrick Shores?
Inequality or Gini Index in South Patrick Shores is 0.45.
What is the Total Population of South Patrick Shores?
Total Population of South Patrick Shores is 6,899.
What is the Total Male Population of South Patrick Shores?
Total Male Population of South Patrick Shores is 3,359.
What is the Total Female Population of South Patrick Shores?
Total Female Population of South Patrick Shores is 3,540.
What is the Ratio of Males per 100 Females in South Patrick Shores?
There are 94.89 Males per 100 Females in South Patrick Shores.
What is the Ratio of Females per 100 Males in South Patrick Shores?
There are 105.39 Females per 100 Males in South Patrick Shores.
What is the Median Population Age in South Patrick Shores?
Median Population Age in South Patrick Shores is 52.4 Years.
What is the Average Family Size in South Patrick Shores
Average Family Size in South Patrick Shores is 3.1 People.
What is the Average Household Size in South Patrick Shores
Average Household Size in South Patrick Shores is 2.3 People.
How Large is the Labor Force in South Patrick Shores?
There are 3,384 People in the Labor Forcein in South Patrick Shores.
What is the Percentage of People in the Labor Force in South Patrick Shores?
56.0% of People are in the Labor Force in South Patrick Shores.
What is the Unemployment Rate in South Patrick Shores?
Unemployment Rate in South Patrick Shores is 3.5%.