Zip Codes with the Highest Percentage of Population Employed in Architecture & Engineering in Deland, FL
RELATED REPORTS & OPTIONS
Architecture & Engineering
Deland
Compare Zip Codes
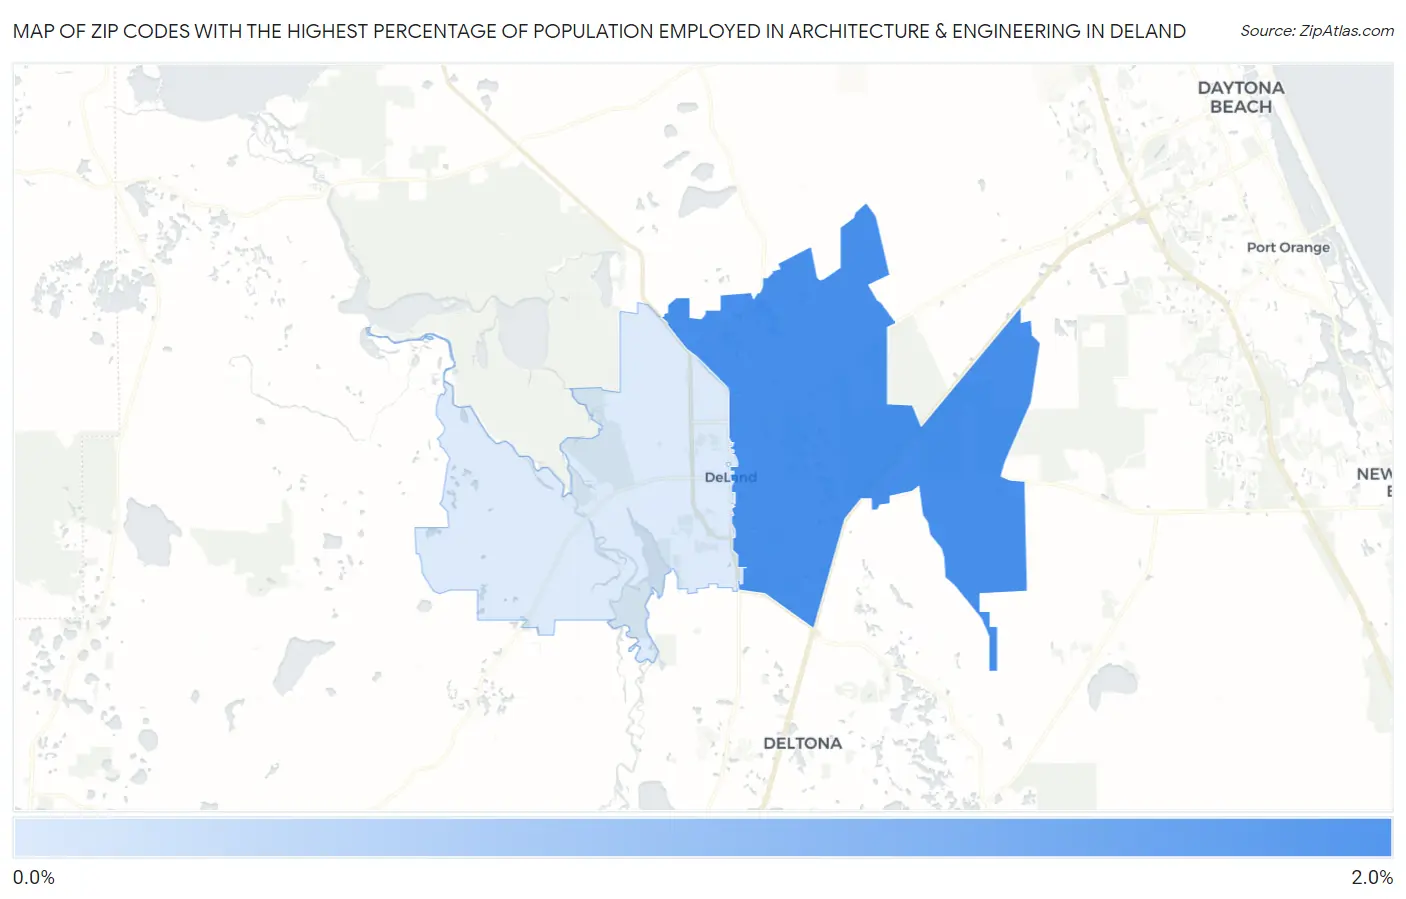
Map of Zip Codes with the Highest Percentage of Population Employed in Architecture & Engineering in Deland
0.97%
1.8%
Zip Codes with the Highest Percentage of Population Employed in Architecture & Engineering in Deland, FL
| Zip Code | % Employed | vs State | vs National | |
| 1. | 32724 | 1.8% | 1.6%(+0.184)#282 | 2.1%(-0.366)#10,932 |
| 2. | 32720 | 0.97% | 1.6%(-0.625)#578 | 2.1%(-1.18)#16,804 |
1
Common Questions
What are the Top Zip Codes with the Highest Percentage of Population Employed in Architecture & Engineering in Deland, FL?
Top Zip Codes with the Highest Percentage of Population Employed in Architecture & Engineering in Deland, FL are:
What zip code has the Highest Percentage of Population Employed in Architecture & Engineering in Deland, FL?
32724 has the Highest Percentage of Population Employed in Architecture & Engineering in Deland, FL with 1.8%.
What is the Percentage of Population Employed in Architecture & Engineering in Deland, FL?
Percentage of Population Employed in Architecture & Engineering in Deland is 1.7%.
What is the Percentage of Population Employed in Architecture & Engineering in Florida?
Percentage of Population Employed in Architecture & Engineering in Florida is 1.6%.
What is the Percentage of Population Employed in Architecture & Engineering in the United States?
Percentage of Population Employed in Architecture & Engineering in the United States is 2.1%.