Daytona Beach Shores, FL Map & Demographics
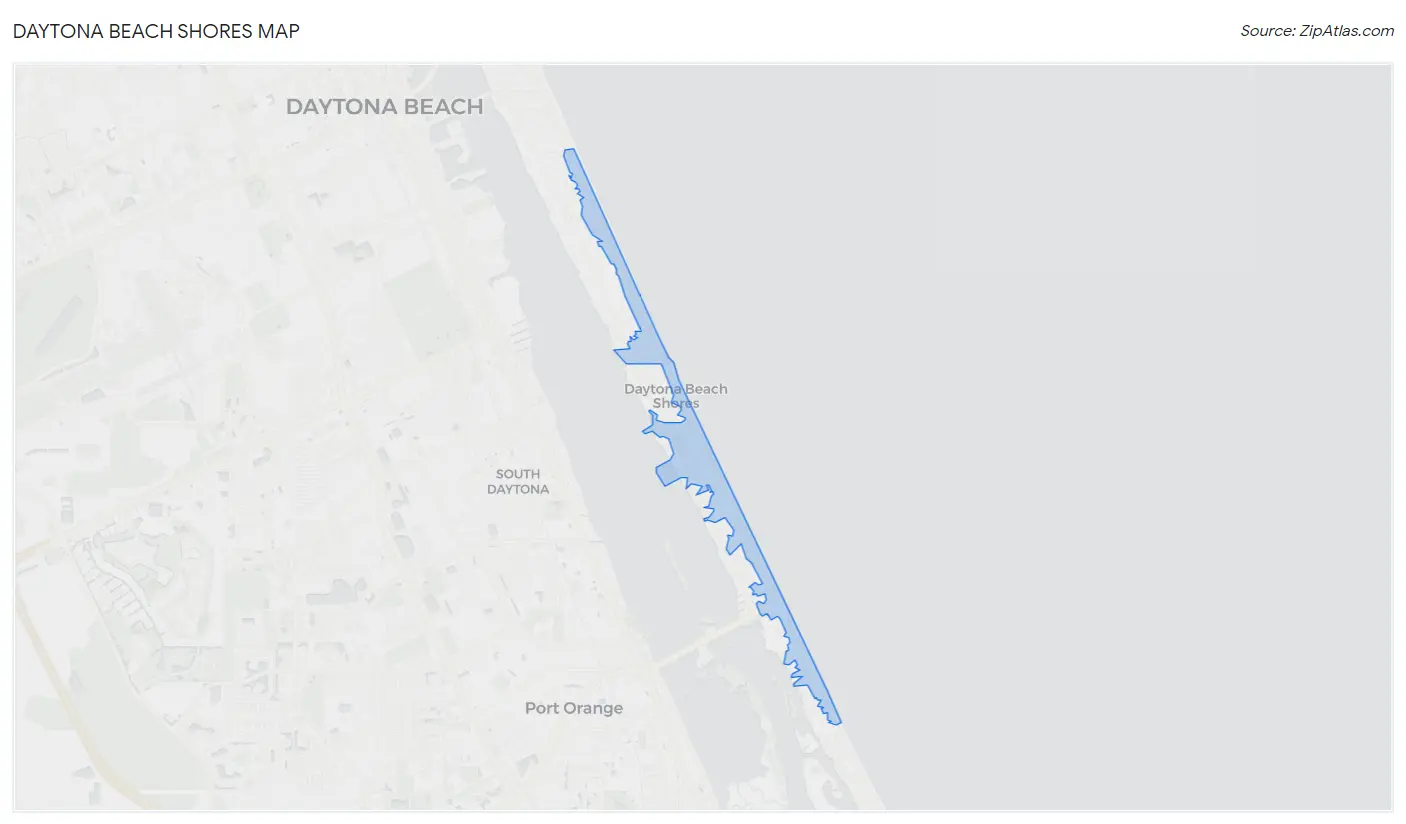
Daytona Beach Shores Map
Daytona Beach Shores Overview
$52,894
PER CAPITA INCOME
$95,000
AVG FAMILY INCOME
$65,334
AVG HOUSEHOLD INCOME
25.7%
WAGE / INCOME GAP [ % ]
74.3¢/ $1
WAGE / INCOME GAP [ $ ]
$4,805
FAMILY INCOME DEFICIT
0.46
INEQUALITY / GINI INDEX
5,087
TOTAL POPULATION
2,277
MALE POPULATION
2,810
FEMALE POPULATION
81.03
MALES / 100 FEMALES
123.41
FEMALES / 100 MALES
65.8
MEDIAN AGE
2.2
AVG FAMILY SIZE
1.6
AVG HOUSEHOLD SIZE
1,579
LABOR FORCE [ PEOPLE ]
32.0%
PERCENT IN LABOR FORCE
4.9%
UNEMPLOYMENT RATE
Daytona Beach Shores Area Codes
Income in Daytona Beach Shores
Income Overview in Daytona Beach Shores
Per Capita Income in Daytona Beach Shores is $52,894, while median incomes of families and households are $95,000 and $65,334 respectively.
| Characteristic | Number | Measure |
| Per Capita Income | 5,087 | $52,894 |
| Median Family Income | 1,314 | $95,000 |
| Mean Family Income | 1,314 | $118,782 |
| Median Household Income | 3,223 | $65,334 |
| Mean Household Income | 3,223 | $82,423 |
| Income Deficit | 1,314 | $4,805 |
| Wage / Income Gap (%) | 5,087 | 25.67% |
| Wage / Income Gap ($) | 5,087 | 74.33¢ per $1 |
| Gini / Inequality Index | 5,087 | 0.46 |
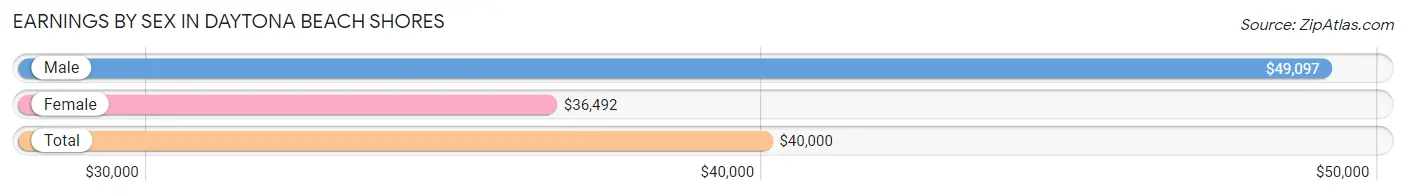
Earnings by Sex in Daytona Beach Shores
Average Earnings in Daytona Beach Shores are $40,000, $49,097 for men and $36,492 for women, a difference of 25.7%.
| Sex | Number | Average Earnings |
| Male | 827 (45.9%) | $49,097 |
| Female | 973 (54.1%) | $36,492 |
| Total | 1,800 (100.0%) | $40,000 |
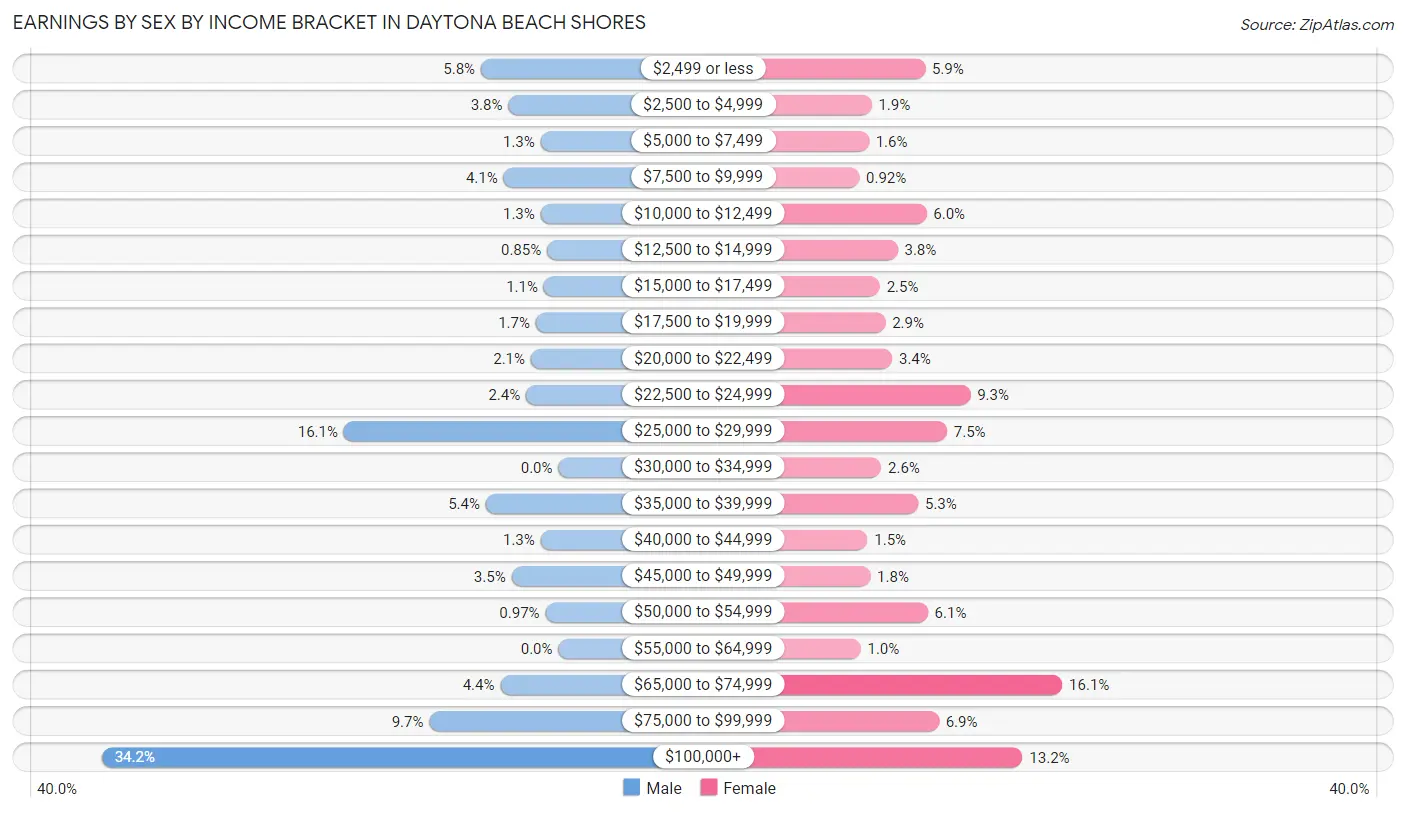
Earnings by Sex by Income Bracket in Daytona Beach Shores
The most common earnings brackets in Daytona Beach Shores are $100,000+ for men (283 | 34.2%) and $65,000 to $74,999 for women (157 | 16.1%).
| Income | Male | Female |
| $2,499 or less | 48 (5.8%) | 57 (5.9%) |
| $2,500 to $4,999 | 31 (3.7%) | 18 (1.8%) |
| $5,000 to $7,499 | 11 (1.3%) | 16 (1.6%) |
| $7,500 to $9,999 | 34 (4.1%) | 9 (0.9%) |
| $10,000 to $12,499 | 11 (1.3%) | 58 (6.0%) |
| $12,500 to $14,999 | 7 (0.9%) | 37 (3.8%) |
| $15,000 to $17,499 | 9 (1.1%) | 24 (2.5%) |
| $17,500 to $19,999 | 14 (1.7%) | 28 (2.9%) |
| $20,000 to $22,499 | 17 (2.1%) | 33 (3.4%) |
| $22,500 to $24,999 | 20 (2.4%) | 90 (9.2%) |
| $25,000 to $29,999 | 133 (16.1%) | 73 (7.5%) |
| $30,000 to $34,999 | 0 (0.0%) | 25 (2.6%) |
| $35,000 to $39,999 | 45 (5.4%) | 52 (5.3%) |
| $40,000 to $44,999 | 11 (1.3%) | 15 (1.5%) |
| $45,000 to $49,999 | 29 (3.5%) | 17 (1.8%) |
| $50,000 to $54,999 | 8 (1.0%) | 59 (6.1%) |
| $55,000 to $64,999 | 0 (0.0%) | 10 (1.0%) |
| $65,000 to $74,999 | 36 (4.3%) | 157 (16.1%) |
| $75,000 to $99,999 | 80 (9.7%) | 67 (6.9%) |
| $100,000+ | 283 (34.2%) | 128 (13.2%) |
| Total | 827 (100.0%) | 973 (100.0%) |
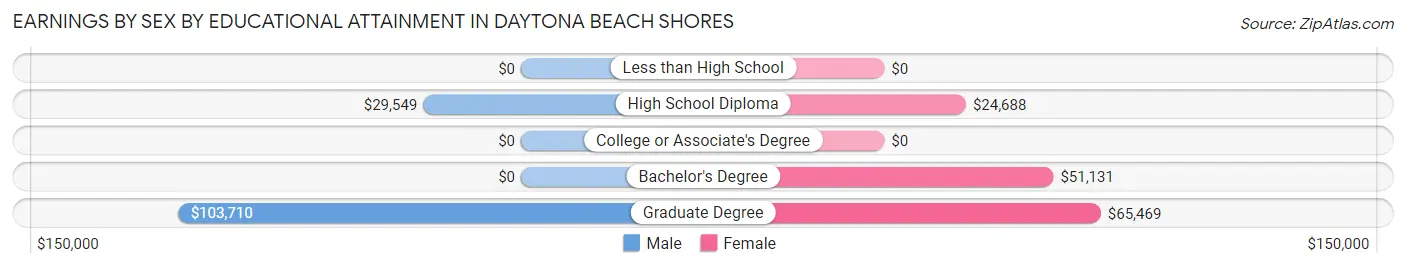
Earnings by Sex by Educational Attainment in Daytona Beach Shores
Average earnings in Daytona Beach Shores are $54,844 for men and $36,895 for women, a difference of 32.7%. Men with an educational attainment of graduate degree enjoy the highest average annual earnings of $103,710, while those with high school diploma education earn the least with $29,549. Women with an educational attainment of graduate degree earn the most with the average annual earnings of $65,469, while those with high school diploma education have the smallest earnings of $24,688.
| Educational Attainment | Male Income | Female Income |
| Less than High School | - | - |
| High School Diploma | $29,549 | $24,688 |
| College or Associate's Degree | - | - |
| Bachelor's Degree | - | - |
| Graduate Degree | $103,710 | $65,469 |
| Total | $54,844 | $36,895 |
Family Income in Daytona Beach Shores
Family Income Brackets in Daytona Beach Shores
According to the Daytona Beach Shores family income data, there are 264 families falling into the $100,000 to $149,999 income range, which is the most common income bracket and makes up 20.1% of all families.
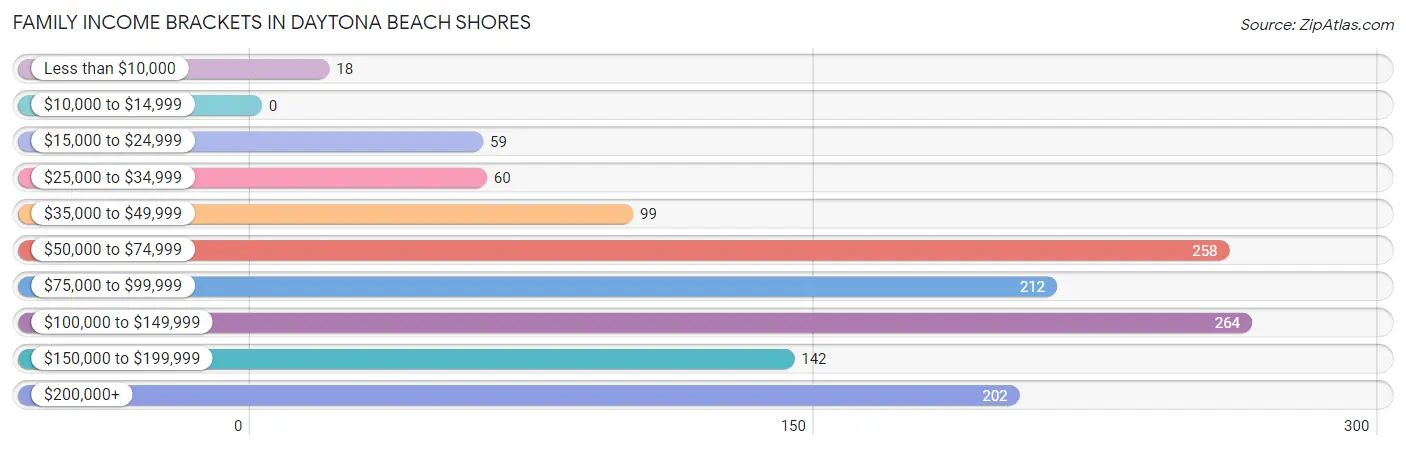
| Income Bracket | # Families | % Families |
| Less than $10,000 | 18 | 1.4% |
| $10,000 to $14,999 | 0 | 0.0% |
| $15,000 to $24,999 | 59 | 4.5% |
| $25,000 to $34,999 | 60 | 4.6% |
| $35,000 to $49,999 | 99 | 7.5% |
| $50,000 to $74,999 | 258 | 19.6% |
| $75,000 to $99,999 | 212 | 16.1% |
| $100,000 to $149,999 | 264 | 20.1% |
| $150,000 to $199,999 | 142 | 10.8% |
| $200,000+ | 202 | 15.4% |
Family Income by Famaliy Size in Daytona Beach Shores
4-person families (74 | 5.6%) account for the highest median family income in Daytona Beach Shores with $193,100 per family, while 4-person families (74 | 5.6%) have the highest median income of $48,275 per family member.
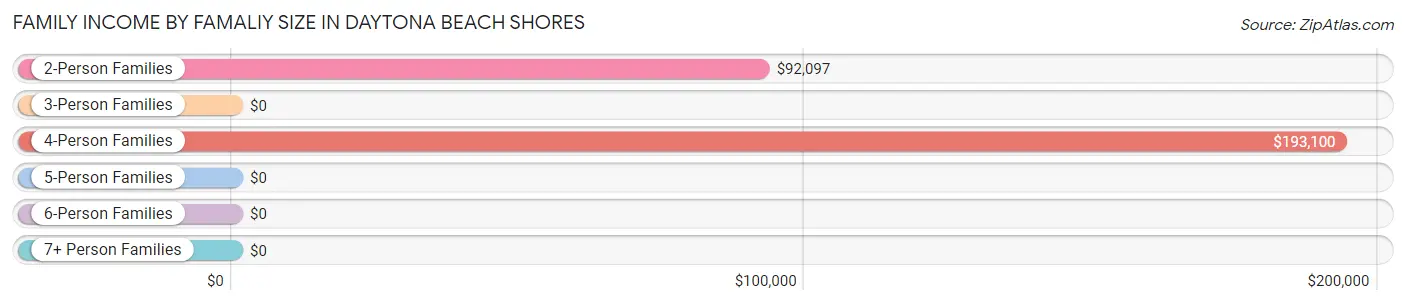
| Income Bracket | # Families | Median Income |
| 2-Person Families | 1,152 (87.7%) | $92,097 |
| 3-Person Families | 81 (6.2%) | $0 |
| 4-Person Families | 74 (5.6%) | $193,100 |
| 5-Person Families | 7 (0.5%) | $0 |
| 6-Person Families | 0 (0.0%) | $0 |
| 7+ Person Families | 0 (0.0%) | $0 |
| Total | 1,314 (100.0%) | $95,000 |
Family Income by Number of Earners in Daytona Beach Shores
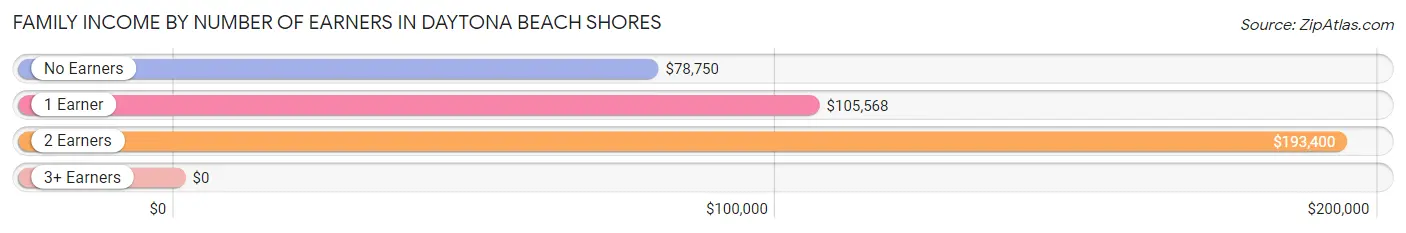
| Number of Earners | # Families | Median Income |
| No Earners | 780 (59.4%) | $78,750 |
| 1 Earner | 302 (23.0%) | $105,568 |
| 2 Earners | 220 (16.7%) | $193,400 |
| 3+ Earners | 12 (0.9%) | $0 |
| Total | 1,314 (100.0%) | $95,000 |
Household Income in Daytona Beach Shores
Household Income Brackets in Daytona Beach Shores
With 657 households falling in the category, the $50,000 to $74,999 income range is the most frequent in Daytona Beach Shores, accounting for 20.4% of all households. In contrast, only 116 households (3.6%) fall into the $10,000 to $14,999 income bracket, making it the least populous group.
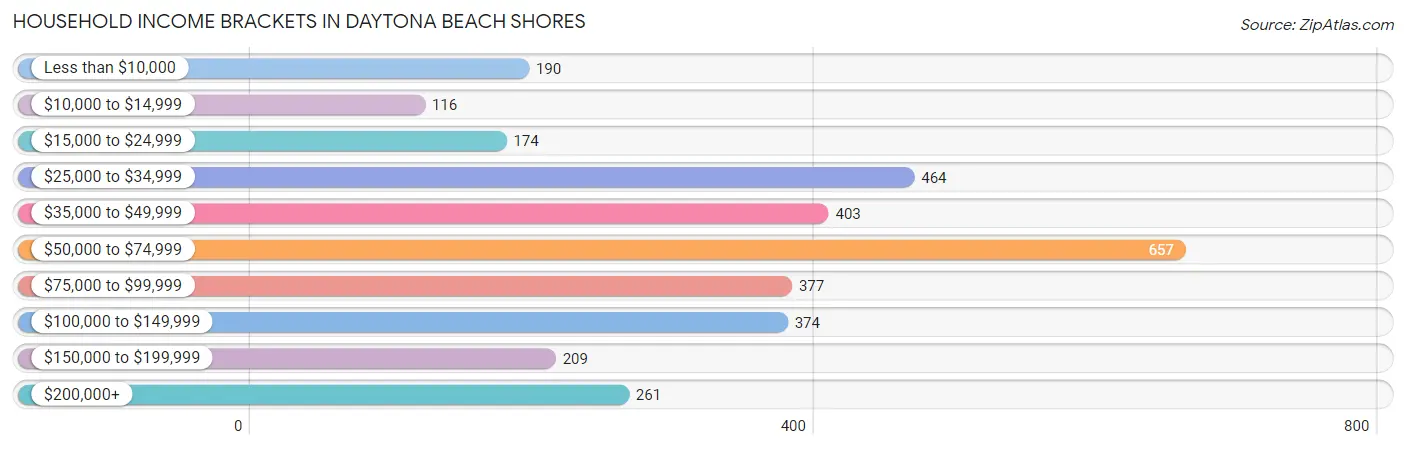
| Income Bracket | # Households | % Households |
| Less than $10,000 | 190 | 5.9% |
| $10,000 to $14,999 | 116 | 3.6% |
| $15,000 to $24,999 | 174 | 5.4% |
| $25,000 to $34,999 | 464 | 14.4% |
| $35,000 to $49,999 | 403 | 12.5% |
| $50,000 to $74,999 | 657 | 20.4% |
| $75,000 to $99,999 | 377 | 11.7% |
| $100,000 to $149,999 | 374 | 11.6% |
| $150,000 to $199,999 | 209 | 6.5% |
| $200,000+ | 261 | 8.1% |
Household Income by Householder Age in Daytona Beach Shores
The median household income in Daytona Beach Shores is $65,334, with the highest median household income of $67,681 found in the 65+ years age bracket for the primary householder. A total of 1,796 households (55.7%) fall into this category. Meanwhile, the 15 to 24 years age bracket for the primary householder has the lowest median household income of $0, with 28 households (0.9%) in this group.
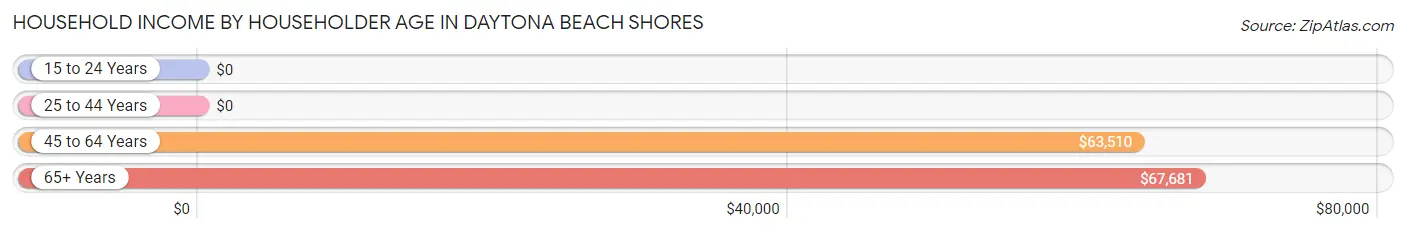
| Income Bracket | # Households | Median Income |
| 15 to 24 Years | 28 (0.9%) | $0 |
| 25 to 44 Years | 230 (7.1%) | $0 |
| 45 to 64 Years | 1,169 (36.3%) | $63,510 |
| 65+ Years | 1,796 (55.7%) | $67,681 |
| Total | 3,223 (100.0%) | $65,334 |
Poverty in Daytona Beach Shores
Income Below Poverty by Sex and Age in Daytona Beach Shores
With 7.6% poverty level for males and 9.3% for females among the residents of Daytona Beach Shores, 18 to 24 year old males and 25 to 34 year old females are the most vulnerable to poverty, with 28 males (66.7%) and 29 females (25.4%) in their respective age groups living below the poverty level.
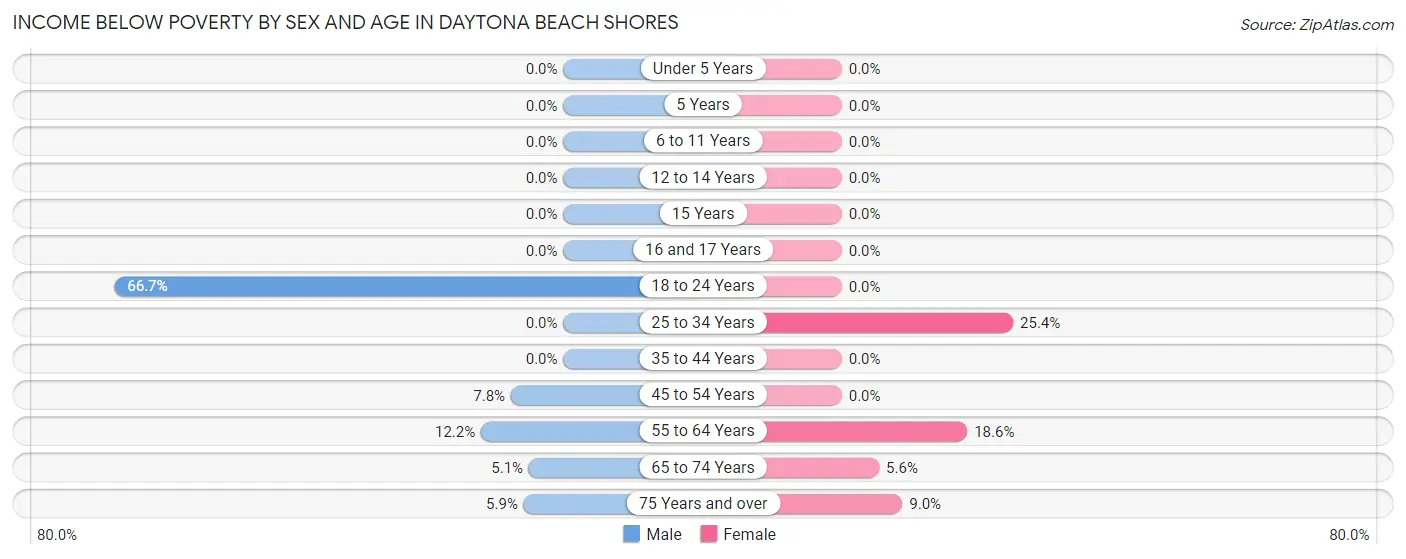
| Age Bracket | Male | Female |
| Under 5 Years | 0 (0.0%) | 0 (0.0%) |
| 5 Years | 0 (0.0%) | 0 (0.0%) |
| 6 to 11 Years | 0 (0.0%) | 0 (0.0%) |
| 12 to 14 Years | 0 (0.0%) | 0 (0.0%) |
| 15 Years | 0 (0.0%) | 0 (0.0%) |
| 16 and 17 Years | 0 (0.0%) | 0 (0.0%) |
| 18 to 24 Years | 28 (66.7%) | 0 (0.0%) |
| 25 to 34 Years | 0 (0.0%) | 29 (25.4%) |
| 35 to 44 Years | 0 (0.0%) | 0 (0.0%) |
| 45 to 54 Years | 12 (7.8%) | 0 (0.0%) |
| 55 to 64 Years | 60 (12.2%) | 133 (18.6%) |
| 65 to 74 Years | 36 (5.1%) | 41 (5.6%) |
| 75 Years and over | 37 (5.9%) | 56 (9.0%) |
| Total | 173 (7.6%) | 259 (9.3%) |
Income Above Poverty by Sex and Age in Daytona Beach Shores
According to the poverty statistics in Daytona Beach Shores, males aged under 5 years and females aged under 5 years are the age groups that are most secure financially, with 100.0% of males and 100.0% of females in these age groups living above the poverty line.
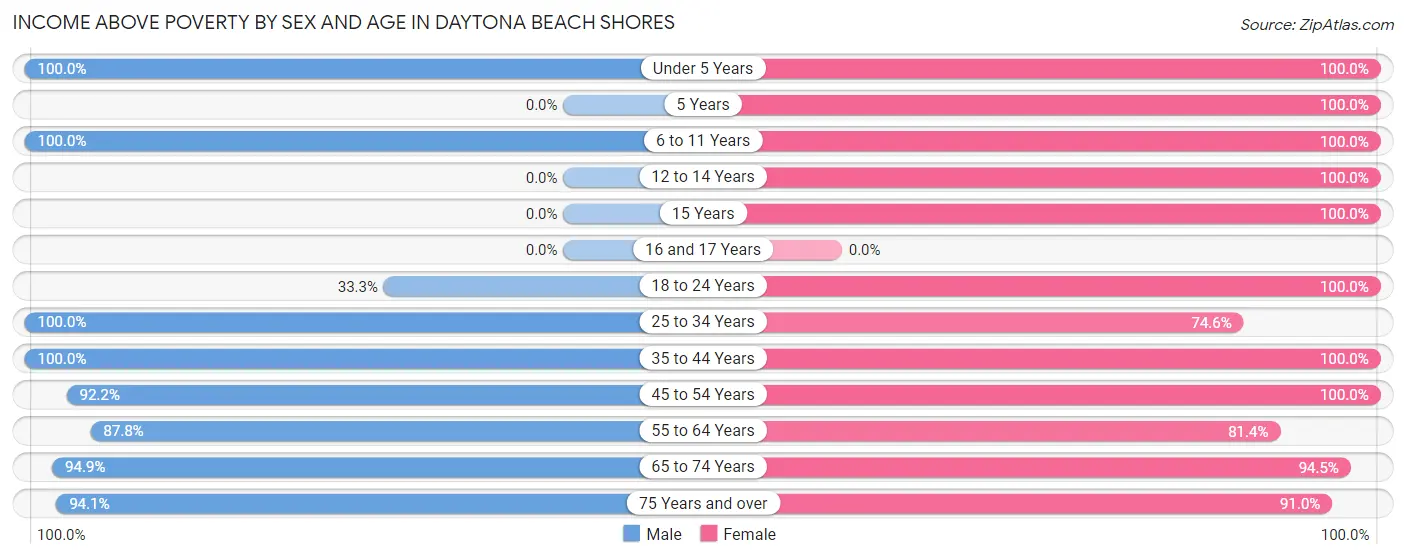
| Age Bracket | Male | Female |
| Under 5 Years | 9 (100.0%) | 12 (100.0%) |
| 5 Years | 0 (0.0%) | 10 (100.0%) |
| 6 to 11 Years | 33 (100.0%) | 24 (100.0%) |
| 12 to 14 Years | 0 (0.0%) | 41 (100.0%) |
| 15 Years | 0 (0.0%) | 23 (100.0%) |
| 16 and 17 Years | 0 (0.0%) | 0 (0.0%) |
| 18 to 24 Years | 14 (33.3%) | 52 (100.0%) |
| 25 to 34 Years | 134 (100.0%) | 85 (74.6%) |
| 35 to 44 Years | 81 (100.0%) | 180 (100.0%) |
| 45 to 54 Years | 142 (92.2%) | 266 (100.0%) |
| 55 to 64 Years | 431 (87.8%) | 581 (81.4%) |
| 65 to 74 Years | 668 (94.9%) | 698 (94.5%) |
| 75 Years and over | 592 (94.1%) | 567 (91.0%) |
| Total | 2,104 (92.4%) | 2,539 (90.7%) |
Income Below Poverty Among Married-Couple Families in Daytona Beach Shores
The poverty statistics for married-couple families in Daytona Beach Shores show that 5.1% or 61 of the total 1,192 families live below the poverty line. Families with no children have the highest poverty rate of 5.5%, comprising of 61 families. On the other hand, families with 1 or 2 children have the lowest poverty rate of 0.0%, which includes 0 families.
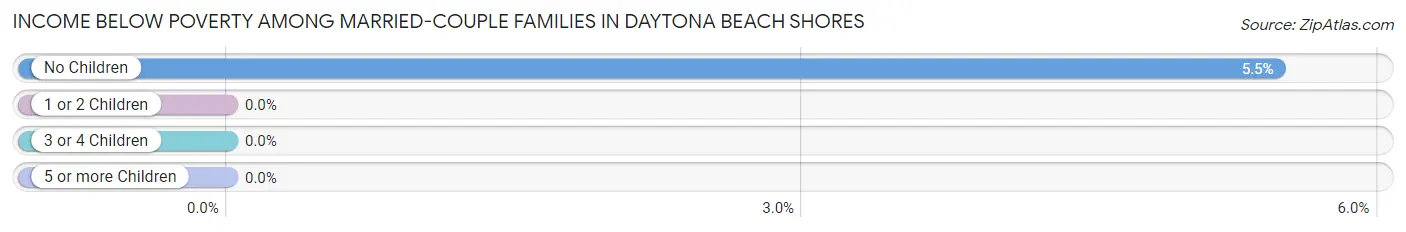
| Children | Above Poverty | Below Poverty |
| No Children | 1,055 (94.5%) | 61 (5.5%) |
| 1 or 2 Children | 76 (100.0%) | 0 (0.0%) |
| 3 or 4 Children | 0 (0.0%) | 0 (0.0%) |
| 5 or more Children | 0 (0.0%) | 0 (0.0%) |
| Total | 1,131 (94.9%) | 61 (5.1%) |
Income Below Poverty Among Single-Parent Households in Daytona Beach Shores
| Children | Single Father | Single Mother |
| No Children | 0 (0.0%) | 0 (0.0%) |
| 1 or 2 Children | 0 (0.0%) | 0 (0.0%) |
| 3 or 4 Children | 0 (0.0%) | 0 (0.0%) |
| 5 or more Children | 0 (0.0%) | 0 (0.0%) |
| Total | 0 (0.0%) | 0 (0.0%) |
Income Below Poverty Among Married-Couple vs Single-Parent Households in Daytona Beach Shores
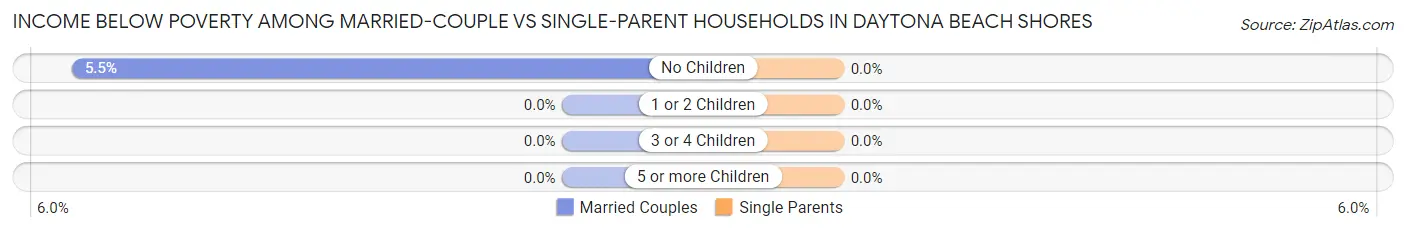
| Children | Married-Couple Families | Single-Parent Households |
| No Children | 61 (5.5%) | 0 (0.0%) |
| 1 or 2 Children | 0 (0.0%) | 0 (0.0%) |
| 3 or 4 Children | 0 (0.0%) | 0 (0.0%) |
| 5 or more Children | 0 (0.0%) | 0 (0.0%) |
| Total | 61 (5.1%) | 0 (0.0%) |
Race in Daytona Beach Shores
The most populous races in Daytona Beach Shores are White / Caucasian (4,526 | 89.0%), Two or more Races (229 | 4.5%), and Hispanic or Latino (209 | 4.1%).
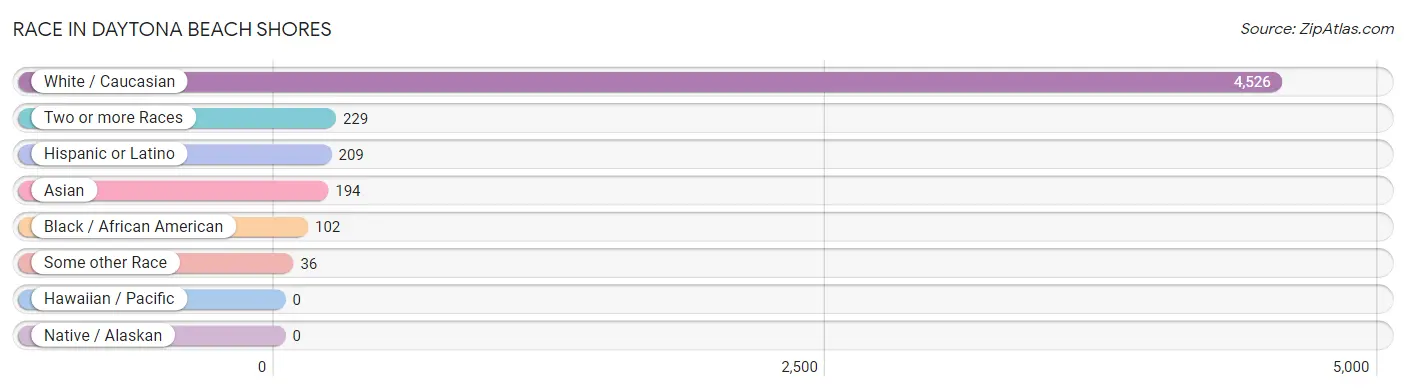
| Race | # Population | % Population |
| Asian | 194 | 3.8% |
| Black / African American | 102 | 2.0% |
| Hawaiian / Pacific | 0 | 0.0% |
| Hispanic or Latino | 209 | 4.1% |
| Native / Alaskan | 0 | 0.0% |
| White / Caucasian | 4,526 | 89.0% |
| Two or more Races | 229 | 4.5% |
| Some other Race | 36 | 0.7% |
| Total | 5,087 | 100.0% |
Ancestry in Daytona Beach Shores
The most populous ancestries reported in Daytona Beach Shores are German (943 | 18.5%), English (912 | 17.9%), Irish (912 | 17.9%), American (403 | 7.9%), and Italian (196 | 3.8%), together accounting for 66.2% of all Daytona Beach Shores residents.
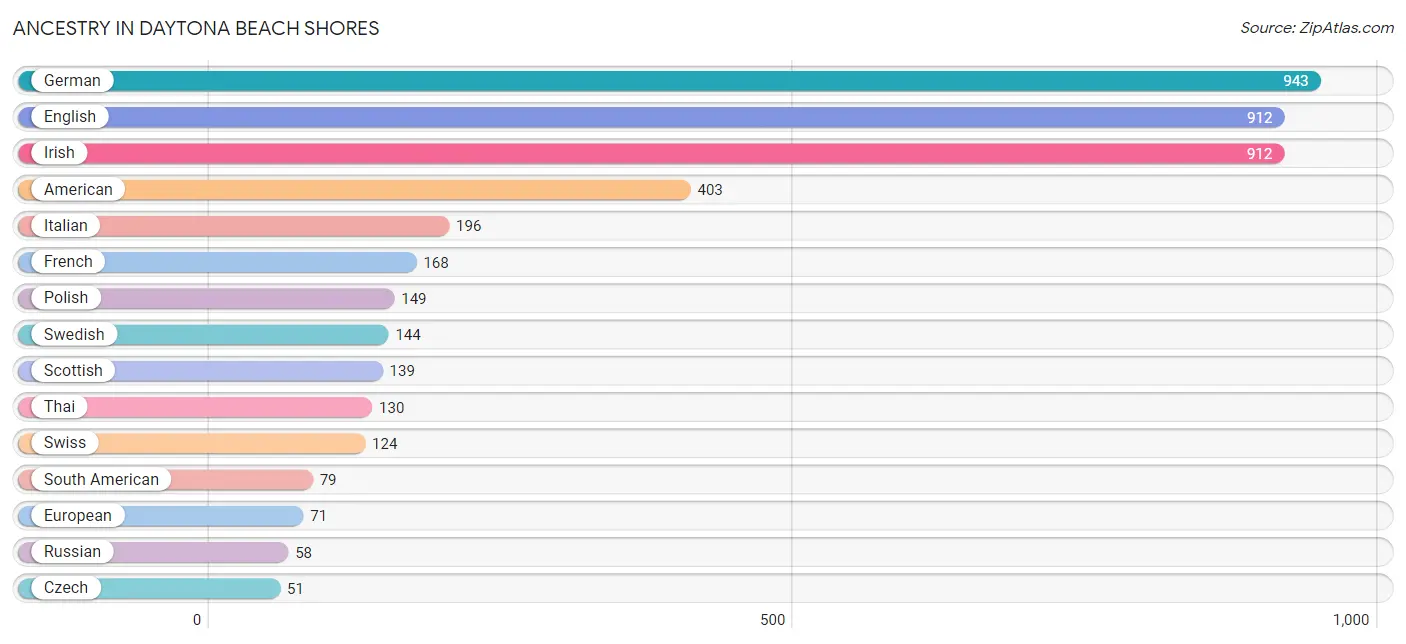
| Ancestry | # Population | % Population |
| American | 403 | 7.9% |
| Arab | 33 | 0.6% |
| Argentinean | 10 | 0.2% |
| Belgian | 21 | 0.4% |
| Bhutanese | 6 | 0.1% |
| British | 40 | 0.8% |
| Canadian | 37 | 0.7% |
| Cherokee | 28 | 0.5% |
| Colombian | 37 | 0.7% |
| Cuban | 17 | 0.3% |
| Czech | 51 | 1.0% |
| Czechoslovakian | 21 | 0.4% |
| Danish | 48 | 0.9% |
| Dominican | 13 | 0.3% |
| Dutch | 44 | 0.9% |
| Eastern European | 15 | 0.3% |
| Egyptian | 23 | 0.4% |
| English | 912 | 17.9% |
| European | 71 | 1.4% |
| Filipino | 7 | 0.1% |
| French | 168 | 3.3% |
| French Canadian | 27 | 0.5% |
| German | 943 | 18.5% |
| German Russian | 11 | 0.2% |
| Greek | 36 | 0.7% |
| Hungarian | 46 | 0.9% |
| Indian (Asian) | 42 | 0.8% |
| Indonesian | 3 | 0.1% |
| Irish | 912 | 17.9% |
| Italian | 196 | 3.8% |
| Korean | 12 | 0.2% |
| Lebanese | 10 | 0.2% |
| Lithuanian | 9 | 0.2% |
| Mexican | 38 | 0.7% |
| Norwegian | 50 | 1.0% |
| Pennsylvania German | 6 | 0.1% |
| Peruvian | 28 | 0.5% |
| Polish | 149 | 2.9% |
| Portuguese | 10 | 0.2% |
| Puerto Rican | 27 | 0.5% |
| Romanian | 10 | 0.2% |
| Russian | 58 | 1.1% |
| Scotch-Irish | 36 | 0.7% |
| Scottish | 139 | 2.7% |
| Slovak | 11 | 0.2% |
| South American | 79 | 1.5% |
| Spaniard | 35 | 0.7% |
| Swedish | 144 | 2.8% |
| Swiss | 124 | 2.4% |
| Thai | 130 | 2.6% |
| Trinidadian and Tobagonian | 27 | 0.5% |
| Turkish | 24 | 0.5% |
| Ukrainian | 7 | 0.1% |
| Venezuelan | 4 | 0.1% |
| Welsh | 20 | 0.4% | View All 55 Rows |
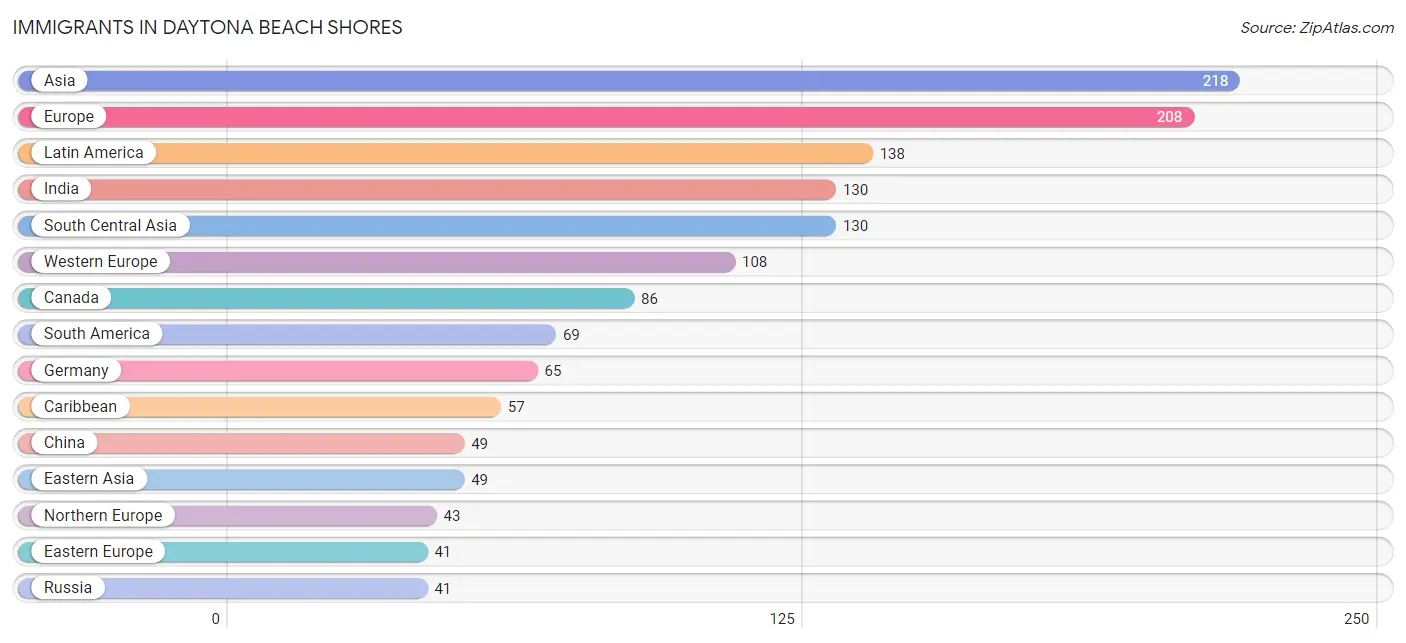
Immigrants in Daytona Beach Shores
The most numerous immigrant groups reported in Daytona Beach Shores came from Asia (218 | 4.3%), Europe (208 | 4.1%), Latin America (138 | 2.7%), India (130 | 2.6%), and South Central Asia (130 | 2.6%), together accounting for 16.2% of all Daytona Beach Shores residents.
| Immigration Origin | # Population | % Population |
| Africa | 23 | 0.4% |
| Argentina | 10 | 0.2% |
| Asia | 218 | 4.3% |
| Austria | 12 | 0.2% |
| Canada | 86 | 1.7% |
| Caribbean | 57 | 1.1% |
| Central America | 12 | 0.2% |
| China | 49 | 1.0% |
| Colombia | 12 | 0.2% |
| Cuba | 17 | 0.3% |
| Dominican Republic | 13 | 0.3% |
| Eastern Asia | 49 | 1.0% |
| Eastern Europe | 41 | 0.8% |
| Ecuador | 15 | 0.3% |
| Egypt | 23 | 0.4% |
| England | 24 | 0.5% |
| Europe | 208 | 4.1% |
| Germany | 65 | 1.3% |
| Greece | 6 | 0.1% |
| India | 130 | 2.6% |
| Italy | 10 | 0.2% |
| Latin America | 138 | 2.7% |
| Mexico | 12 | 0.2% |
| Northern Africa | 23 | 0.4% |
| Northern Europe | 43 | 0.9% |
| Peru | 28 | 0.5% |
| Philippines | 12 | 0.2% |
| Russia | 41 | 0.8% |
| Scotland | 7 | 0.1% |
| South America | 69 | 1.4% |
| South Central Asia | 130 | 2.6% |
| South Eastern Asia | 15 | 0.3% |
| Southern Europe | 16 | 0.3% |
| Switzerland | 31 | 0.6% |
| Taiwan | 7 | 0.1% |
| Trinidad and Tobago | 27 | 0.5% |
| Turkey | 24 | 0.5% |
| Venezuela | 4 | 0.1% |
| Western Asia | 24 | 0.5% |
| Western Europe | 108 | 2.1% | View All 40 Rows |
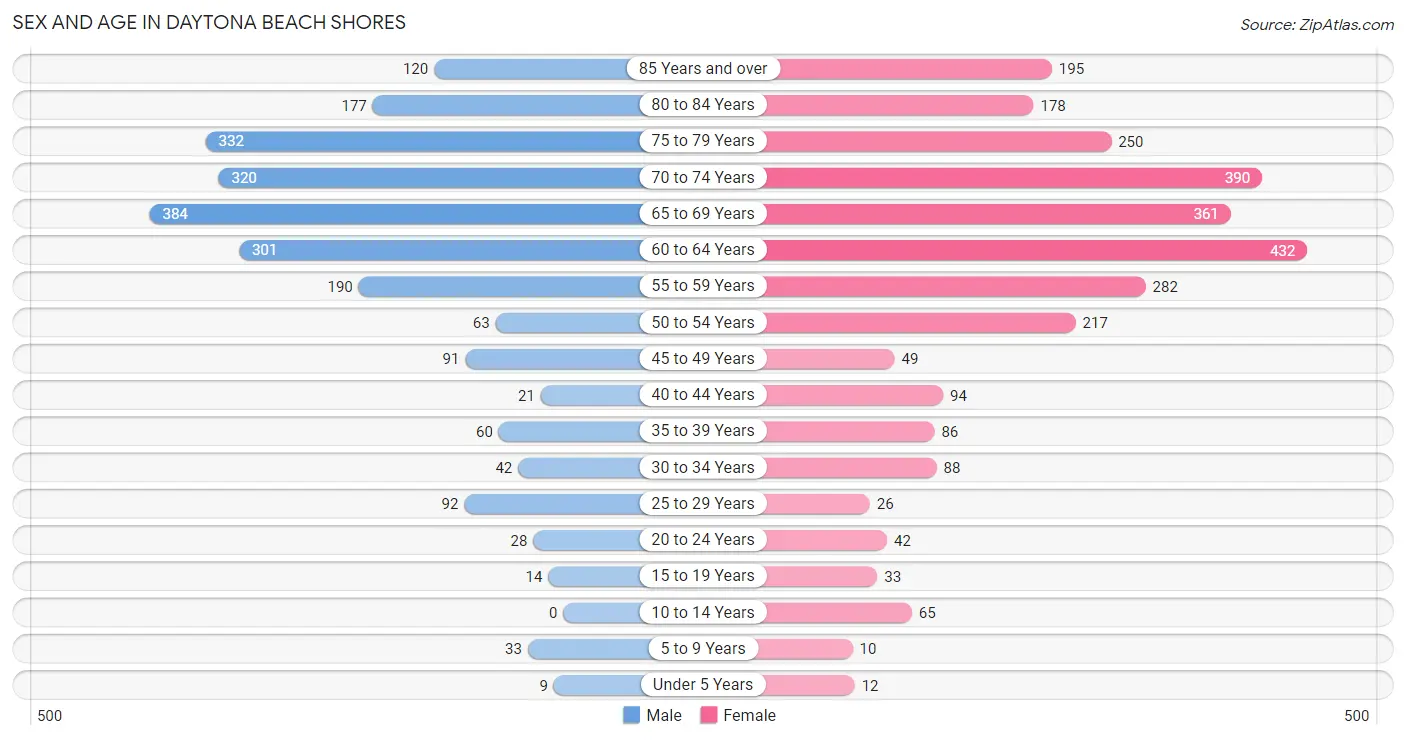
Sex and Age in Daytona Beach Shores
Sex and Age in Daytona Beach Shores
The most populous age groups in Daytona Beach Shores are 65 to 69 Years (384 | 16.9%) for men and 60 to 64 Years (432 | 15.4%) for women.
| Age Bracket | Male | Female |
| Under 5 Years | 9 (0.4%) | 12 (0.4%) |
| 5 to 9 Years | 33 (1.5%) | 10 (0.4%) |
| 10 to 14 Years | 0 (0.0%) | 65 (2.3%) |
| 15 to 19 Years | 14 (0.6%) | 33 (1.2%) |
| 20 to 24 Years | 28 (1.2%) | 42 (1.5%) |
| 25 to 29 Years | 92 (4.0%) | 26 (0.9%) |
| 30 to 34 Years | 42 (1.8%) | 88 (3.1%) |
| 35 to 39 Years | 60 (2.6%) | 86 (3.1%) |
| 40 to 44 Years | 21 (0.9%) | 94 (3.4%) |
| 45 to 49 Years | 91 (4.0%) | 49 (1.7%) |
| 50 to 54 Years | 63 (2.8%) | 217 (7.7%) |
| 55 to 59 Years | 190 (8.3%) | 282 (10.0%) |
| 60 to 64 Years | 301 (13.2%) | 432 (15.4%) |
| 65 to 69 Years | 384 (16.9%) | 361 (12.9%) |
| 70 to 74 Years | 320 (14.1%) | 390 (13.9%) |
| 75 to 79 Years | 332 (14.6%) | 250 (8.9%) |
| 80 to 84 Years | 177 (7.8%) | 178 (6.3%) |
| 85 Years and over | 120 (5.3%) | 195 (6.9%) |
| Total | 2,277 (100.0%) | 2,810 (100.0%) |
Families and Households in Daytona Beach Shores
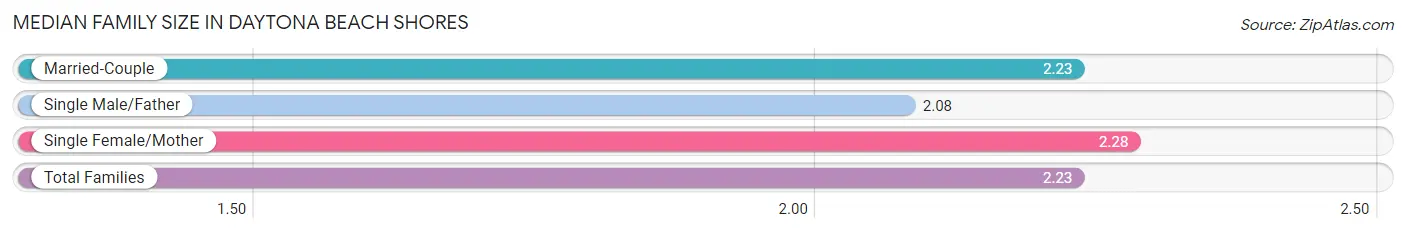
Median Family Size in Daytona Beach Shores
The median family size in Daytona Beach Shores is 2.23 persons per family, with single female/mother families (109 | 8.3%) accounting for the largest median family size of 2.28 persons per family. On the other hand, single male/father families (13 | 1.0%) represent the smallest median family size with 2.08 persons per family.
| Family Type | # Families | Family Size |
| Married-Couple | 1,192 (90.7%) | 2.23 |
| Single Male/Father | 13 (1.0%) | 2.08 |
| Single Female/Mother | 109 (8.3%) | 2.28 |
| Total Families | 1,314 (100.0%) | 2.23 |
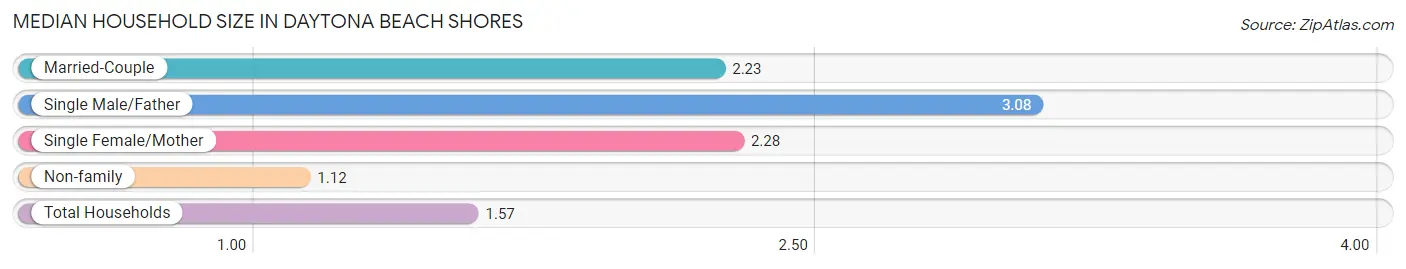
Median Household Size in Daytona Beach Shores
The median household size in Daytona Beach Shores is 1.57 persons per household, with single male/father households (13 | 0.4%) accounting for the largest median household size of 3.08 persons per household. non-family households (1,909 | 59.2%) represent the smallest median household size with 1.12 persons per household.
| Household Type | # Households | Household Size |
| Married-Couple | 1,192 (37.0%) | 2.23 |
| Single Male/Father | 13 (0.4%) | 3.08 |
| Single Female/Mother | 109 (3.4%) | 2.28 |
| Non-family | 1,909 (59.2%) | 1.12 |
| Total Households | 3,223 (100.0%) | 1.57 |
Household Size by Marriage Status in Daytona Beach Shores
Out of a total of 3,223 households in Daytona Beach Shores, 1,314 (40.8%) are family households, while 1,909 (59.2%) are nonfamily households. The most numerous type of family households are 2-person households, comprising 1,140, and the most common type of nonfamily households are 1-person households, comprising 1,735.
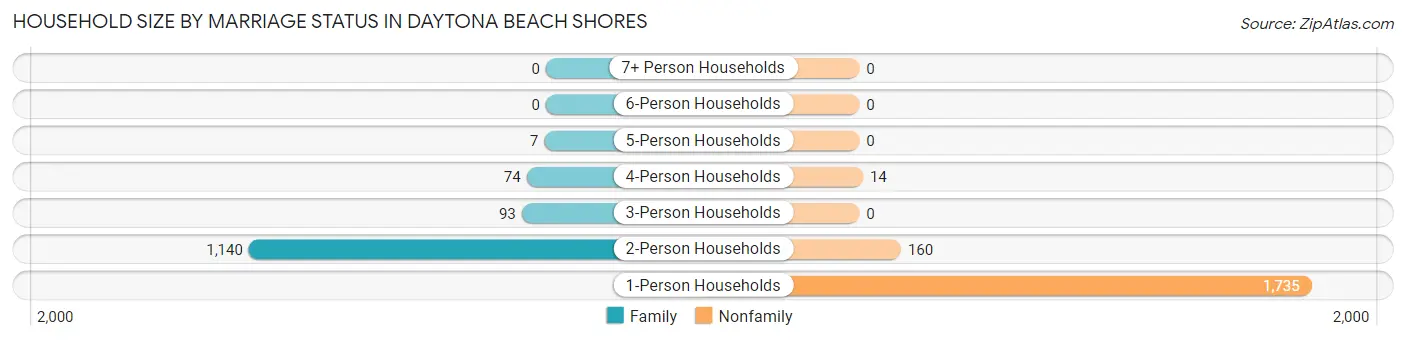
| Household Size | Family Households | Nonfamily Households |
| 1-Person Households | - | 1,735 (53.8%) |
| 2-Person Households | 1,140 (35.4%) | 160 (5.0%) |
| 3-Person Households | 93 (2.9%) | 0 (0.0%) |
| 4-Person Households | 74 (2.3%) | 14 (0.4%) |
| 5-Person Households | 7 (0.2%) | 0 (0.0%) |
| 6-Person Households | 0 (0.0%) | 0 (0.0%) |
| 7+ Person Households | 0 (0.0%) | 0 (0.0%) |
| Total | 1,314 (40.8%) | 1,909 (59.2%) |
Female Fertility in Daytona Beach Shores
Fertility by Age in Daytona Beach Shores
Average fertility rate in Daytona Beach Shores is 24.0 births per 1,000 women. Women in the age bracket of 20 to 34 years have the highest fertility rate with 64.0 births per 1,000 women. Women in the age bracket of 20 to 34 years acount for 100.0% of all women with births.
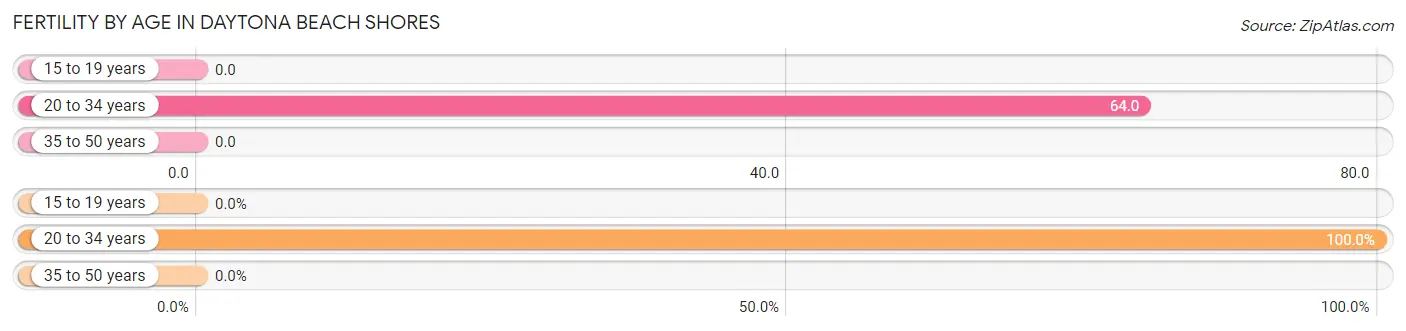
| Age Bracket | Women with Births | Births / 1,000 Women |
| 15 to 19 years | 0 (0.0%) | 0.0 |
| 20 to 34 years | 10 (100.0%) | 64.0 |
| 35 to 50 years | 0 (0.0%) | 0.0 |
| Total | 10 (100.0%) | 24.0 |
Fertility by Age by Marriage Status in Daytona Beach Shores
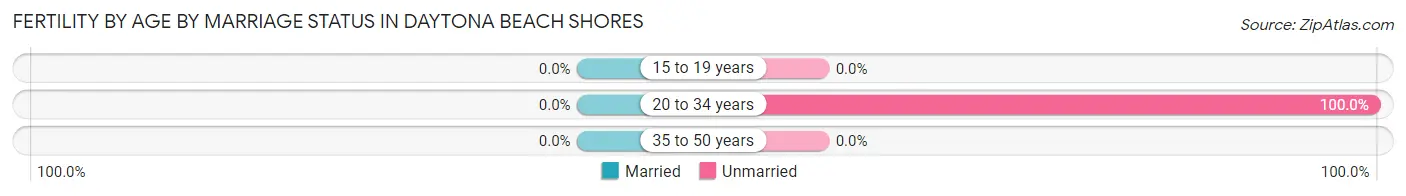
| Age Bracket | Married | Unmarried |
| 15 to 19 years | 0 (0.0%) | 0 (0.0%) |
| 20 to 34 years | 0 (0.0%) | 10 (100.0%) |
| 35 to 50 years | 0 (0.0%) | 0 (0.0%) |
| Total | 0 (0.0%) | 10 (100.0%) |
Fertility by Education in Daytona Beach Shores
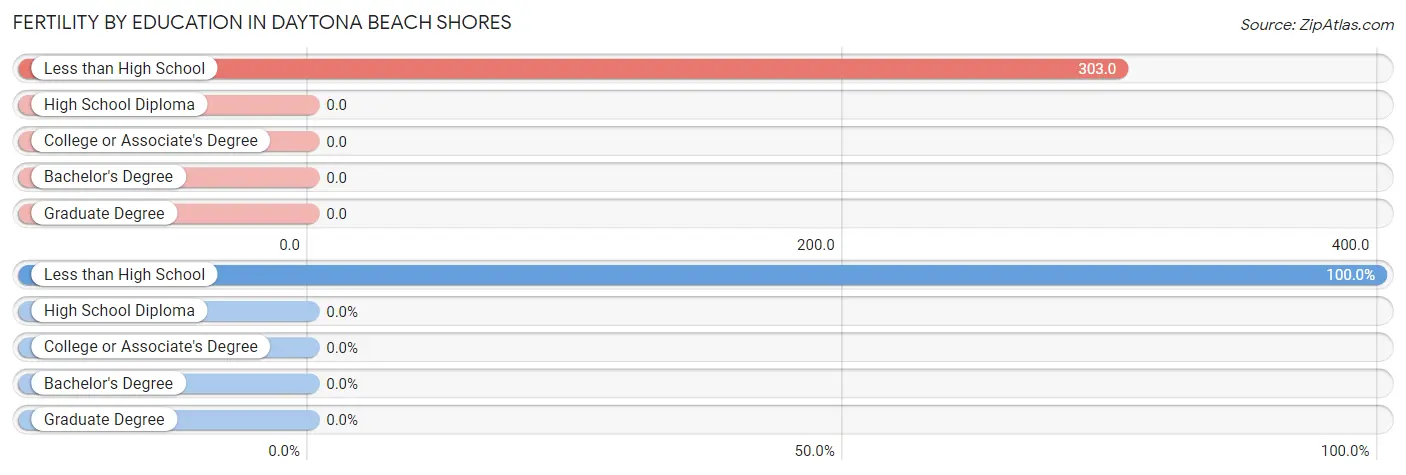
| Educational Attainment | Women with Births | Births / 1,000 Women |
| Less than High School | 10 (100.0%) | 303.0 |
| High School Diploma | 0 (0.0%) | 0.0 |
| College or Associate's Degree | 0 (0.0%) | 0.0 |
| Bachelor's Degree | 0 (0.0%) | 0.0 |
| Graduate Degree | 0 (0.0%) | 0.0 |
| Total | 10 (100.0%) | 24.0 |
Fertility by Education by Marriage Status in Daytona Beach Shores
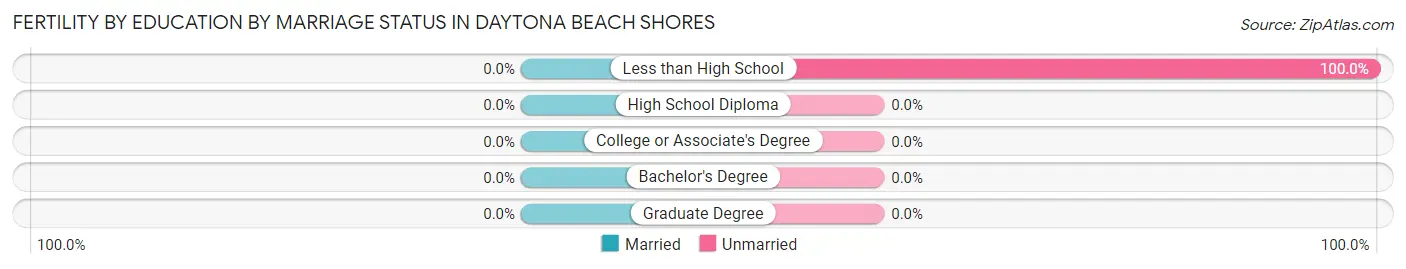
| Educational Attainment | Married | Unmarried |
| Less than High School | 0 (0.0%) | 10 (100.0%) |
| High School Diploma | 0 (0.0%) | 0 (0.0%) |
| College or Associate's Degree | 0 (0.0%) | 0 (0.0%) |
| Bachelor's Degree | 0 (0.0%) | 0 (0.0%) |
| Graduate Degree | 0 (0.0%) | 0 (0.0%) |
| Total | 0 (0.0%) | 10 (100.0%) |
Employment Characteristics in Daytona Beach Shores
Employment by Class of Employer in Daytona Beach Shores
Among the 1,479 employed individuals in Daytona Beach Shores, private company employees (901 | 60.9%), not-for-profit organizations (177 | 12.0%), and self-employed (not incorporated) (160 | 10.8%) make up the most common classes of employment.
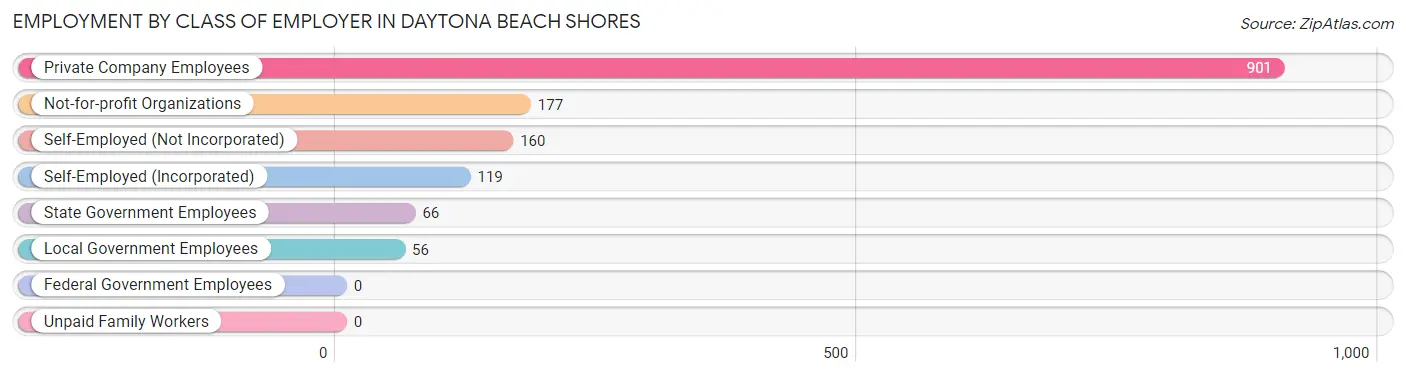
| Employer Class | # Employees | % Employees |
| Private Company Employees | 901 | 60.9% |
| Self-Employed (Incorporated) | 119 | 8.1% |
| Self-Employed (Not Incorporated) | 160 | 10.8% |
| Not-for-profit Organizations | 177 | 12.0% |
| Local Government Employees | 56 | 3.8% |
| State Government Employees | 66 | 4.5% |
| Federal Government Employees | 0 | 0.0% |
| Unpaid Family Workers | 0 | 0.0% |
| Total | 1,479 | 100.0% |
Employment Status by Age in Daytona Beach Shores
According to the labor force statistics for Daytona Beach Shores, out of the total population over 16 years of age (4,935), 32.0% or 1,579 individuals are in the labor force, with 4.9% or 77 of them unemployed. The age group with the highest labor force participation rate is 30 to 34 years, with 100.0% or 130 individuals in the labor force. Within the labor force, the 16 to 19 years age range has the highest percentage of unemployed individuals, with 41.2% or 7 of them being unemployed.
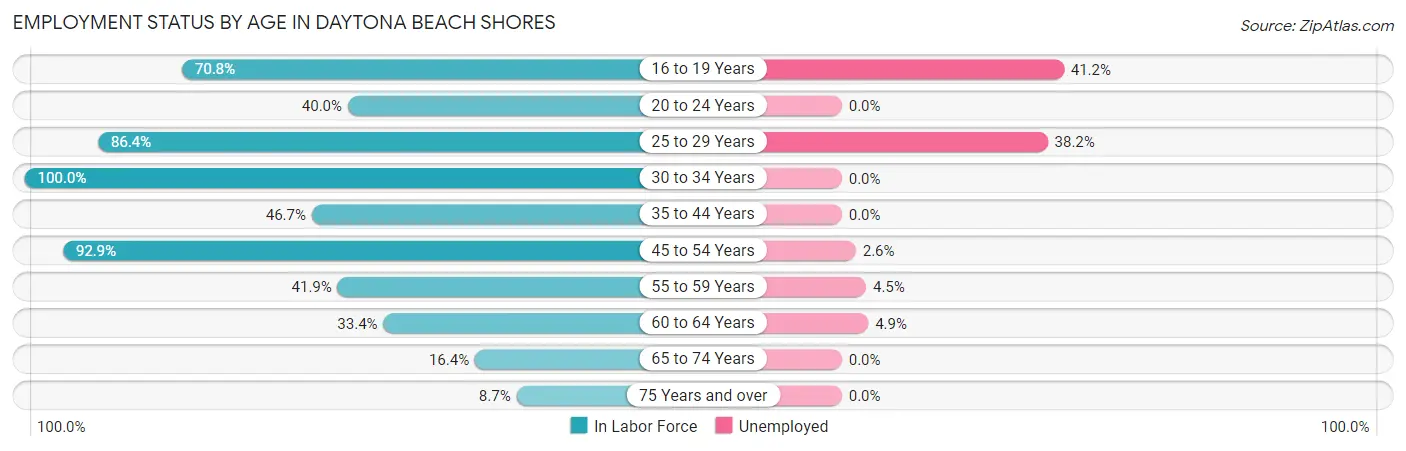
| Age Bracket | In Labor Force | Unemployed |
| 16 to 19 Years | 17 (70.8%) | 7 (41.2%) |
| 20 to 24 Years | 28 (40.0%) | 0 (0.0%) |
| 25 to 29 Years | 102 (86.4%) | 39 (38.2%) |
| 30 to 34 Years | 130 (100.0%) | 0 (0.0%) |
| 35 to 44 Years | 122 (46.7%) | 0 (0.0%) |
| 45 to 54 Years | 390 (92.9%) | 10 (2.6%) |
| 55 to 59 Years | 198 (41.9%) | 9 (4.5%) |
| 60 to 64 Years | 245 (33.4%) | 12 (4.9%) |
| 65 to 74 Years | 239 (16.4%) | 0 (0.0%) |
| 75 Years and over | 109 (8.7%) | 0 (0.0%) |
| Total | 1,579 (32.0%) | 77 (4.9%) |
Employment Status by Educational Attainment in Daytona Beach Shores
According to labor force statistics for Daytona Beach Shores, 55.6% of individuals (1,187) out of the total population between 25 and 64 years of age (2,134) are in the labor force, with 5.9% or 70 of them being unemployed. The group with the highest labor force participation rate are those with the educational attainment of college / associate degree, with 62.2% or 387 individuals in the labor force. Within the labor force, individuals with bachelor's degree or higher education have the highest percentage of unemployment, with 12.6% or 70 of them being unemployed.
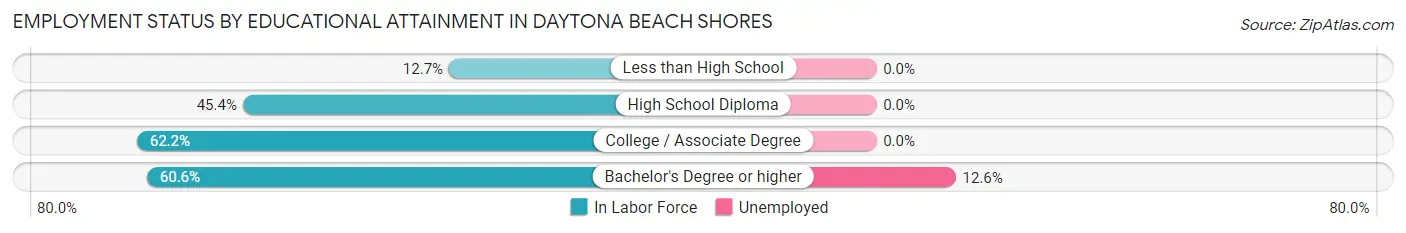
| Educational Attainment | In Labor Force | Unemployed |
| Less than High School | 10 (12.7%) | 0 (0.0%) |
| High School Diploma | 234 (45.4%) | 0 (0.0%) |
| College / Associate Degree | 387 (62.2%) | 0 (0.0%) |
| Bachelor's Degree or higher | 556 (60.6%) | 116 (12.6%) |
| Total | 1,187 (55.6%) | 126 (5.9%) |
Employment Occupations by Sex in Daytona Beach Shores
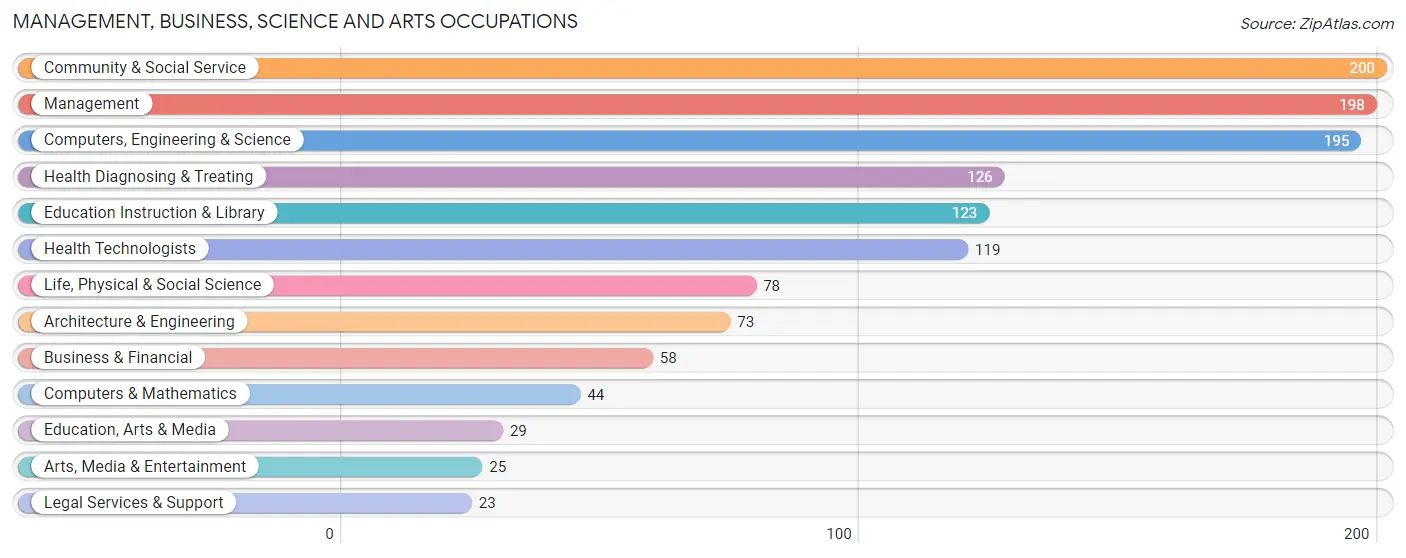
Management, Business, Science and Arts Occupations
The most common Management, Business, Science and Arts occupations in Daytona Beach Shores are Community & Social Service (200 | 13.3%), Management (198 | 13.2%), Computers, Engineering & Science (195 | 13.0%), Health Diagnosing & Treating (126 | 8.4%), and Education Instruction & Library (123 | 8.2%).
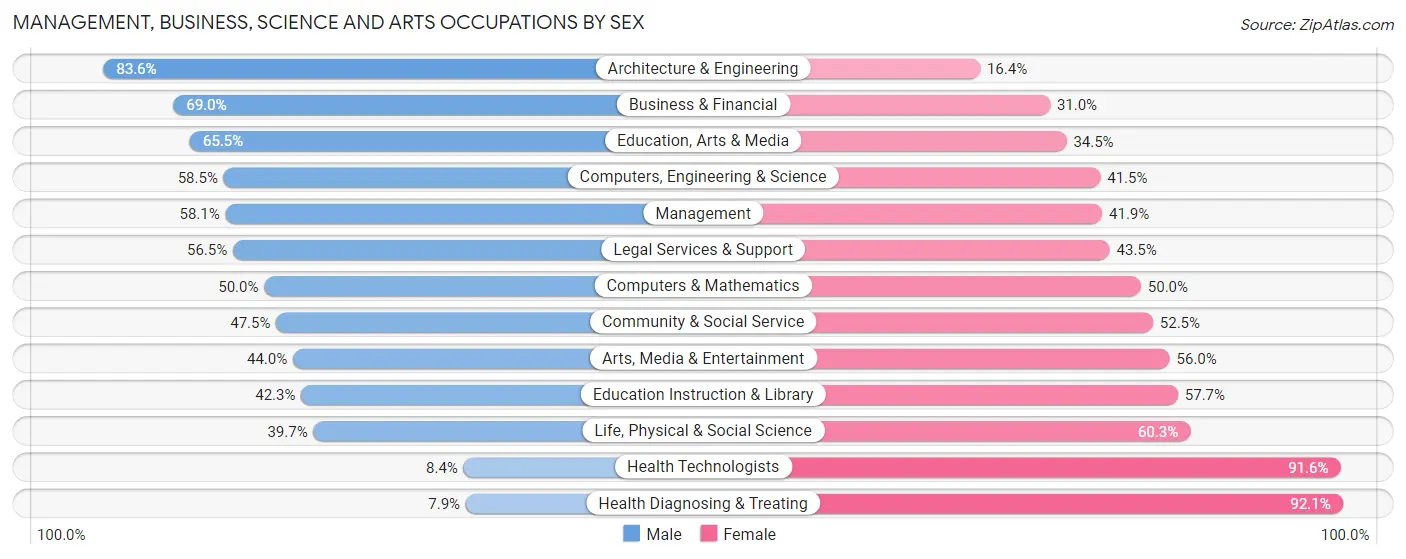
Management, Business, Science and Arts Occupations by Sex
Within the Management, Business, Science and Arts occupations in Daytona Beach Shores, the most male-oriented occupations are Architecture & Engineering (83.6%), Business & Financial (69.0%), and Education, Arts & Media (65.5%), while the most female-oriented occupations are Health Diagnosing & Treating (92.1%), Health Technologists (91.6%), and Life, Physical & Social Science (60.3%).
| Occupation | Male | Female |
| Management | 115 (58.1%) | 83 (41.9%) |
| Business & Financial | 40 (69.0%) | 18 (31.0%) |
| Computers, Engineering & Science | 114 (58.5%) | 81 (41.5%) |
| Computers & Mathematics | 22 (50.0%) | 22 (50.0%) |
| Architecture & Engineering | 61 (83.6%) | 12 (16.4%) |
| Life, Physical & Social Science | 31 (39.7%) | 47 (60.3%) |
| Community & Social Service | 95 (47.5%) | 105 (52.5%) |
| Education, Arts & Media | 19 (65.5%) | 10 (34.5%) |
| Legal Services & Support | 13 (56.5%) | 10 (43.5%) |
| Education Instruction & Library | 52 (42.3%) | 71 (57.7%) |
| Arts, Media & Entertainment | 11 (44.0%) | 14 (56.0%) |
| Health Diagnosing & Treating | 10 (7.9%) | 116 (92.1%) |
| Health Technologists | 10 (8.4%) | 109 (91.6%) |
| Total (Category) | 374 (48.1%) | 403 (51.9%) |
| Total (Overall) | 639 (42.5%) | 864 (57.5%) |
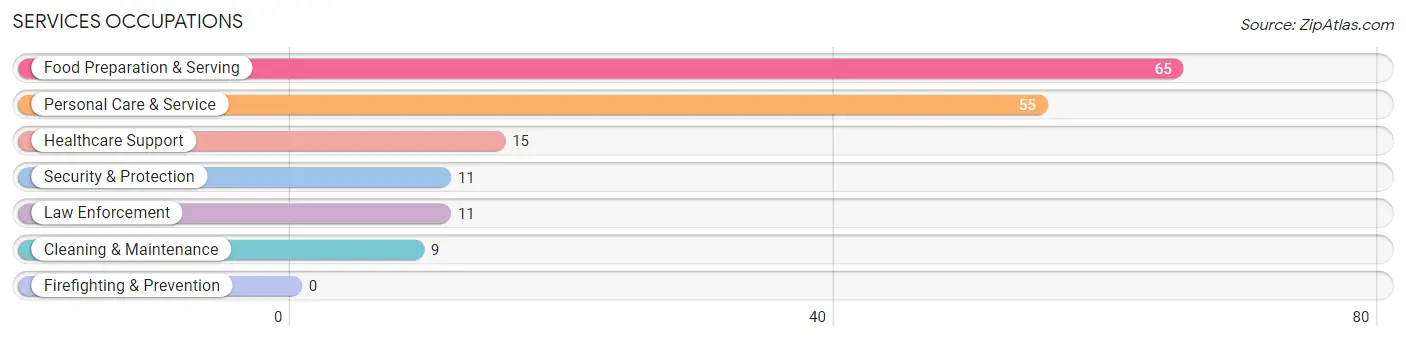
Services Occupations
The most common Services occupations in Daytona Beach Shores are Food Preparation & Serving (65 | 4.3%), Personal Care & Service (55 | 3.7%), Healthcare Support (15 | 1.0%), Security & Protection (11 | 0.7%), and Law Enforcement (11 | 0.7%).
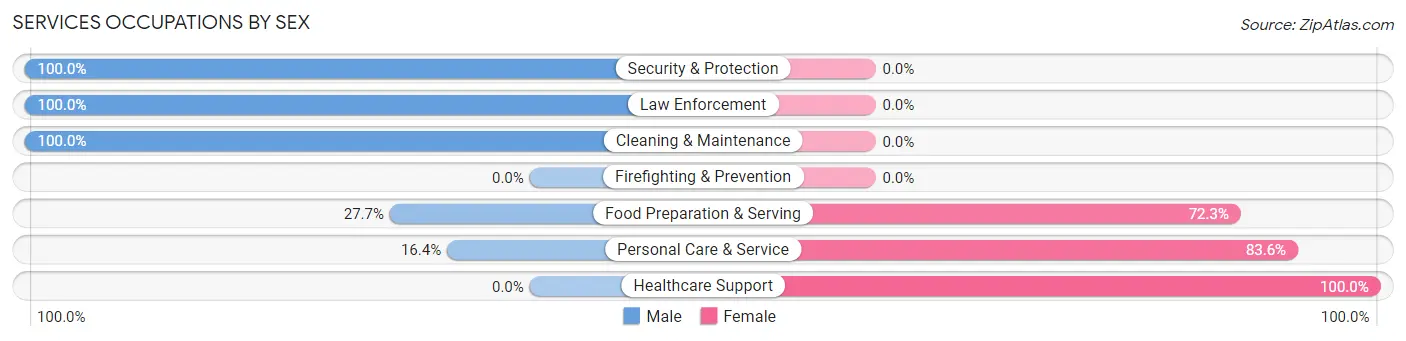
Services Occupations by Sex
Within the Services occupations in Daytona Beach Shores, the most male-oriented occupations are Security & Protection (100.0%), Law Enforcement (100.0%), and Cleaning & Maintenance (100.0%), while the most female-oriented occupations are Healthcare Support (100.0%), Personal Care & Service (83.6%), and Food Preparation & Serving (72.3%).
| Occupation | Male | Female |
| Healthcare Support | 0 (0.0%) | 15 (100.0%) |
| Security & Protection | 11 (100.0%) | 0 (0.0%) |
| Firefighting & Prevention | 0 (0.0%) | 0 (0.0%) |
| Law Enforcement | 11 (100.0%) | 0 (0.0%) |
| Food Preparation & Serving | 18 (27.7%) | 47 (72.3%) |
| Cleaning & Maintenance | 9 (100.0%) | 0 (0.0%) |
| Personal Care & Service | 9 (16.4%) | 46 (83.6%) |
| Total (Category) | 47 (30.3%) | 108 (69.7%) |
| Total (Overall) | 639 (42.5%) | 864 (57.5%) |
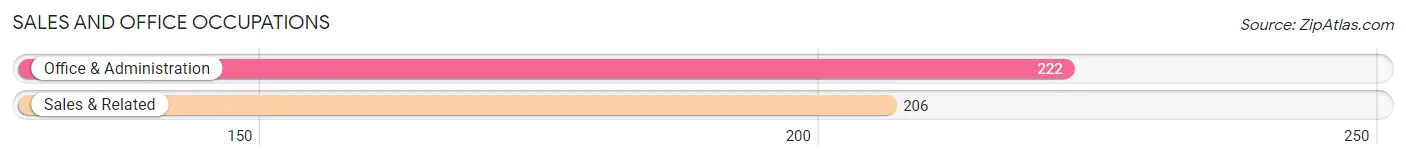
Sales and Office Occupations
The most common Sales and Office occupations in Daytona Beach Shores are Office & Administration (222 | 14.8%), and Sales & Related (206 | 13.7%).
Sales and Office Occupations by Sex
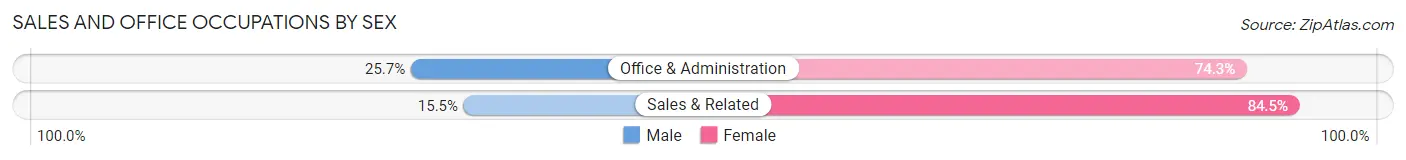
| Occupation | Male | Female |
| Sales & Related | 32 (15.5%) | 174 (84.5%) |
| Office & Administration | 57 (25.7%) | 165 (74.3%) |
| Total (Category) | 89 (20.8%) | 339 (79.2%) |
| Total (Overall) | 639 (42.5%) | 864 (57.5%) |
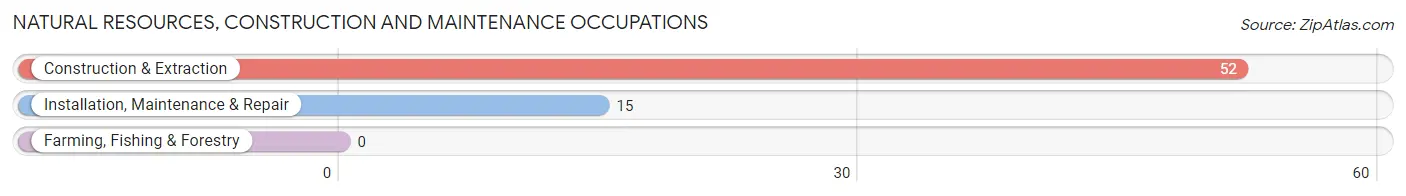
Natural Resources, Construction and Maintenance Occupations
The most common Natural Resources, Construction and Maintenance occupations in Daytona Beach Shores are Construction & Extraction (52 | 3.5%), and Installation, Maintenance & Repair (15 | 1.0%).
Natural Resources, Construction and Maintenance Occupations by Sex
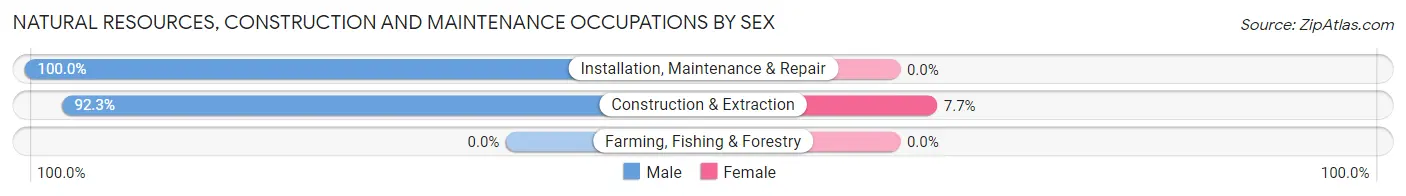
| Occupation | Male | Female |
| Farming, Fishing & Forestry | 0 (0.0%) | 0 (0.0%) |
| Construction & Extraction | 48 (92.3%) | 4 (7.7%) |
| Installation, Maintenance & Repair | 15 (100.0%) | 0 (0.0%) |
| Total (Category) | 63 (94.0%) | 4 (6.0%) |
| Total (Overall) | 639 (42.5%) | 864 (57.5%) |
Production, Transportation and Moving Occupations
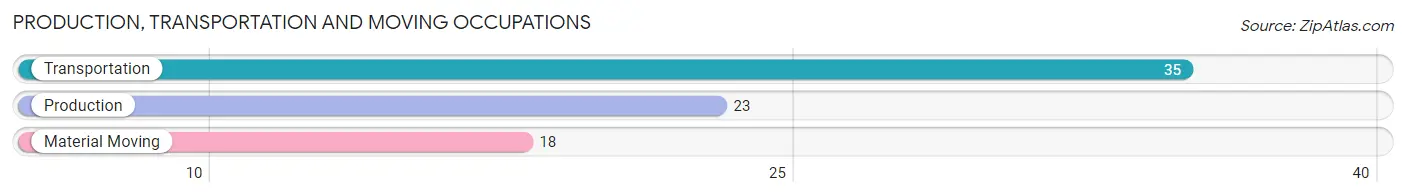
The most common Production, Transportation and Moving occupations in Daytona Beach Shores are Transportation (35 | 2.3%), Production (23 | 1.5%), and Material Moving (18 | 1.2%).
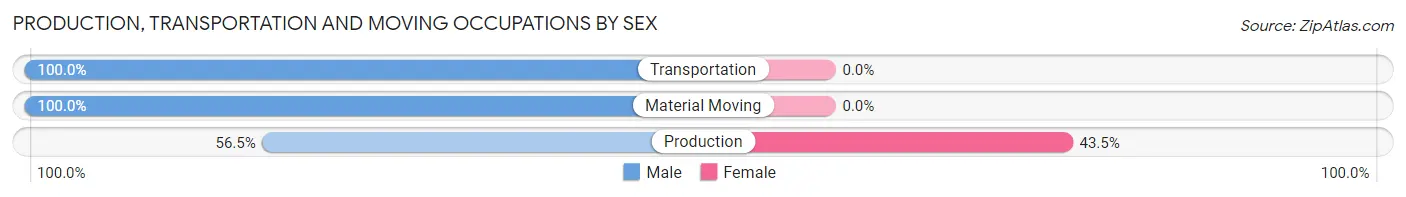
Production, Transportation and Moving Occupations by Sex
| Occupation | Male | Female |
| Production | 13 (56.5%) | 10 (43.5%) |
| Transportation | 35 (100.0%) | 0 (0.0%) |
| Material Moving | 18 (100.0%) | 0 (0.0%) |
| Total (Category) | 66 (86.8%) | 10 (13.2%) |
| Total (Overall) | 639 (42.5%) | 864 (57.5%) |
Employment Industries by Sex in Daytona Beach Shores
Employment Industries in Daytona Beach Shores
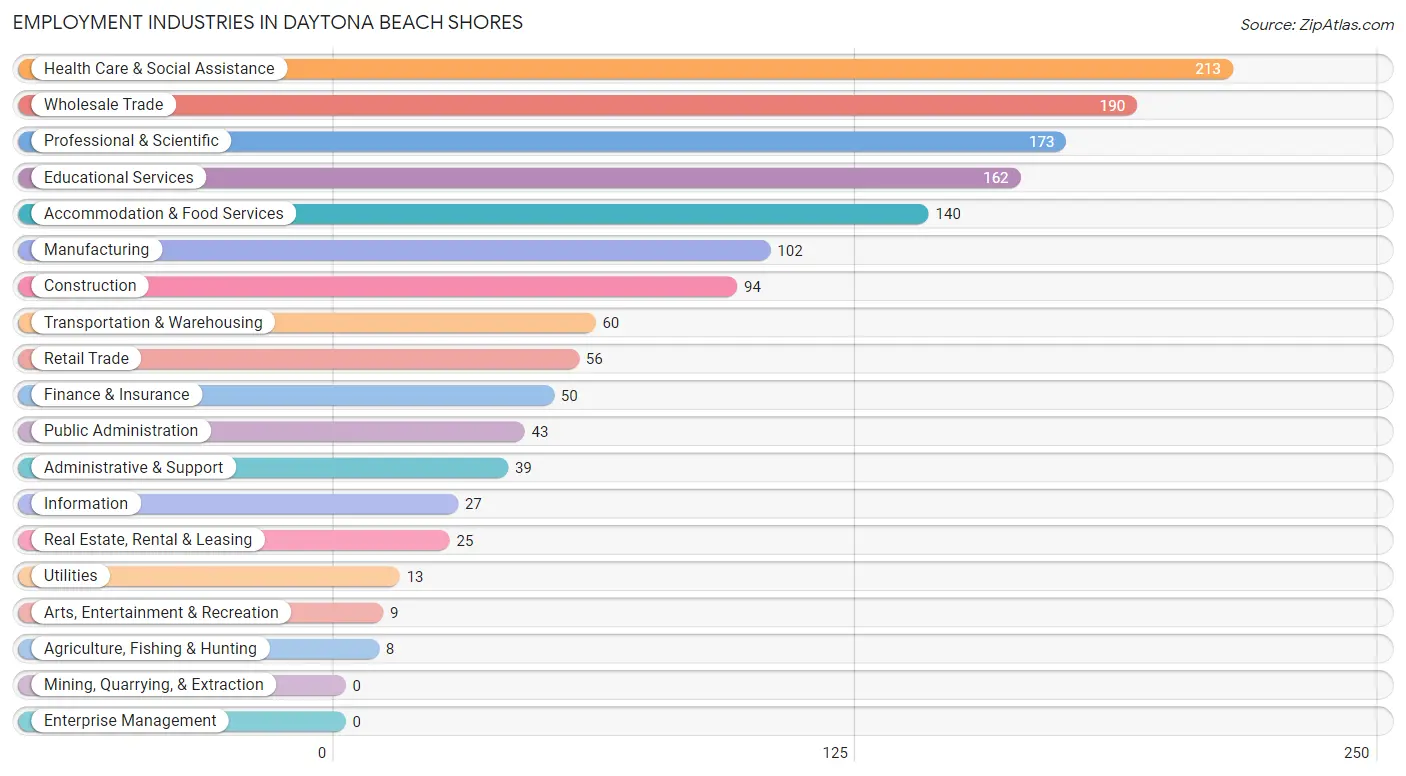
The major employment industries in Daytona Beach Shores include Health Care & Social Assistance (213 | 14.2%), Wholesale Trade (190 | 12.6%), Professional & Scientific (173 | 11.5%), Educational Services (162 | 10.8%), and Accommodation & Food Services (140 | 9.3%).
Employment Industries by Sex in Daytona Beach Shores
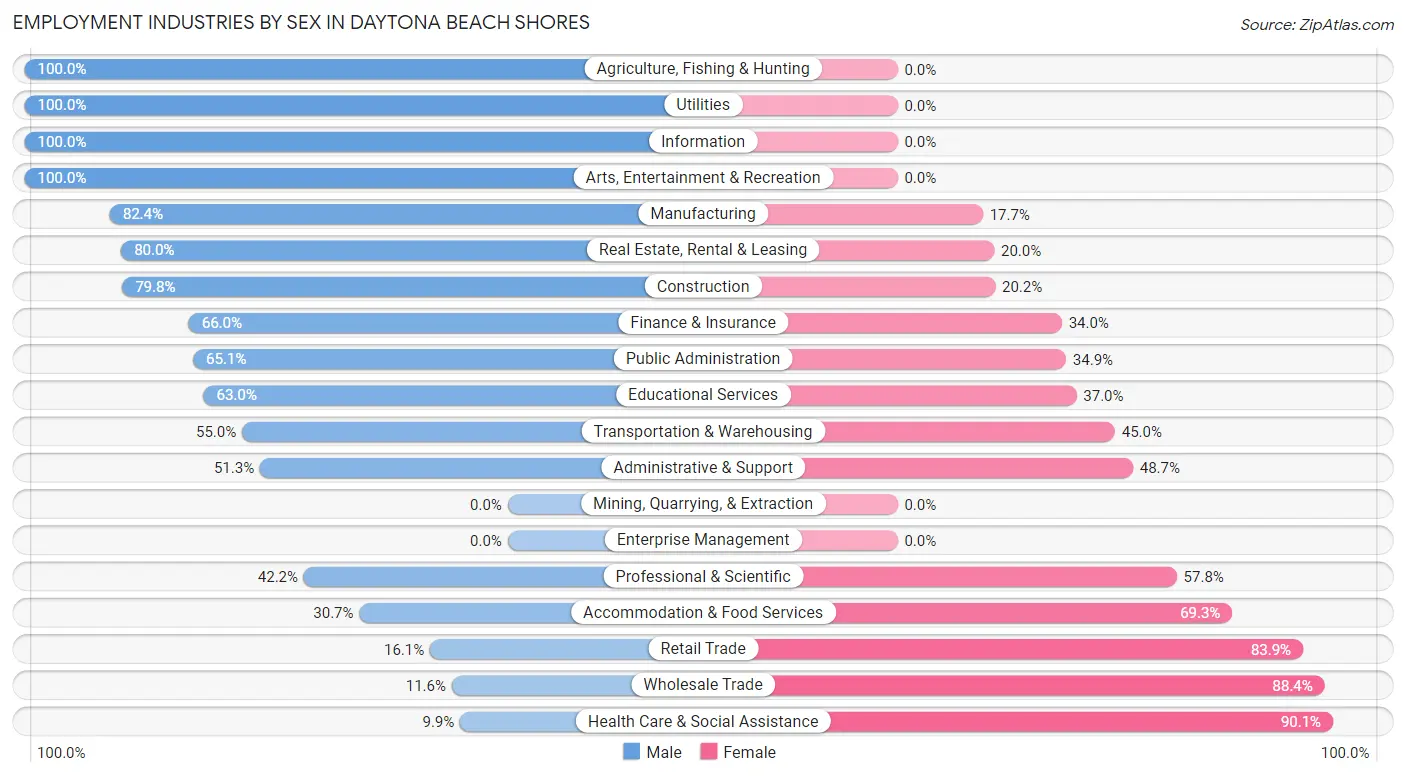
The Daytona Beach Shores industries that see more men than women are Agriculture, Fishing & Hunting (100.0%), Utilities (100.0%), and Information (100.0%), whereas the industries that tend to have a higher number of women are Health Care & Social Assistance (90.1%), Wholesale Trade (88.4%), and Retail Trade (83.9%).
| Industry | Male | Female |
| Agriculture, Fishing & Hunting | 8 (100.0%) | 0 (0.0%) |
| Mining, Quarrying, & Extraction | 0 (0.0%) | 0 (0.0%) |
| Construction | 75 (79.8%) | 19 (20.2%) |
| Manufacturing | 84 (82.4%) | 18 (17.6%) |
| Wholesale Trade | 22 (11.6%) | 168 (88.4%) |
| Retail Trade | 9 (16.1%) | 47 (83.9%) |
| Transportation & Warehousing | 33 (55.0%) | 27 (45.0%) |
| Utilities | 13 (100.0%) | 0 (0.0%) |
| Information | 27 (100.0%) | 0 (0.0%) |
| Finance & Insurance | 33 (66.0%) | 17 (34.0%) |
| Real Estate, Rental & Leasing | 20 (80.0%) | 5 (20.0%) |
| Professional & Scientific | 73 (42.2%) | 100 (57.8%) |
| Enterprise Management | 0 (0.0%) | 0 (0.0%) |
| Administrative & Support | 20 (51.3%) | 19 (48.7%) |
| Educational Services | 102 (63.0%) | 60 (37.0%) |
| Health Care & Social Assistance | 21 (9.9%) | 192 (90.1%) |
| Arts, Entertainment & Recreation | 9 (100.0%) | 0 (0.0%) |
| Accommodation & Food Services | 43 (30.7%) | 97 (69.3%) |
| Public Administration | 28 (65.1%) | 15 (34.9%) |
| Total | 639 (42.5%) | 864 (57.5%) |
Education in Daytona Beach Shores
School Enrollment in Daytona Beach Shores
The most common levels of schooling among the 186 students in Daytona Beach Shores are middle school (55 | 29.6%), high school (48 | 25.8%), and college / undergraduate (41 | 22.0%).
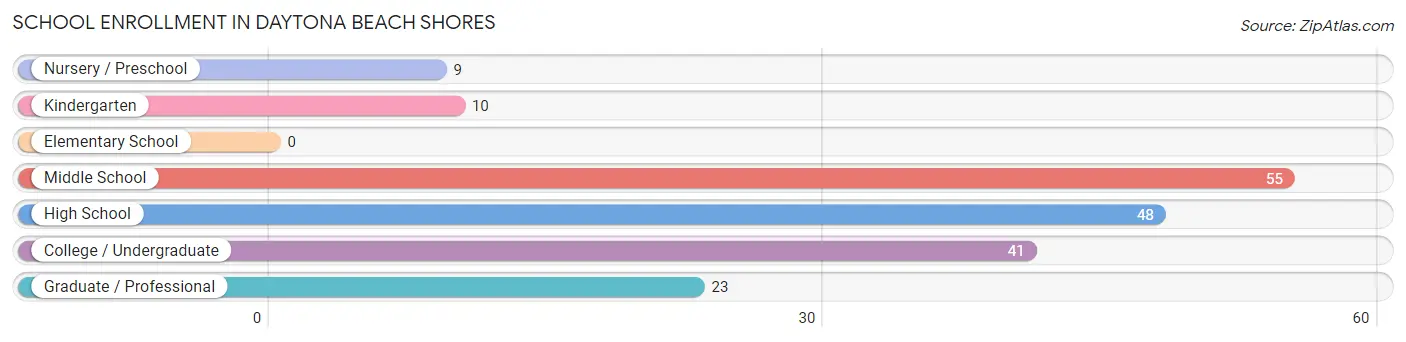
| School Level | # Students | % Students |
| Nursery / Preschool | 9 | 4.8% |
| Kindergarten | 10 | 5.4% |
| Elementary School | 0 | 0.0% |
| Middle School | 55 | 29.6% |
| High School | 48 | 25.8% |
| College / Undergraduate | 41 | 22.0% |
| Graduate / Professional | 23 | 12.4% |
| Total | 186 | 100.0% |
School Enrollment by Age by Funding Source in Daytona Beach Shores
Out of a total of 186 students who are enrolled in schools in Daytona Beach Shores, 88 (47.3%) attend a private institution, while the remaining 98 (52.7%) are enrolled in public schools. The age group of 5 to 9 year old has the highest likelihood of being enrolled in private schools, with 10 (100.0% in the age bracket) enrolled. Conversely, the age group of 3 to 4 year olds has the lowest likelihood of being enrolled in a private school, with 9 (100.0% in the age bracket) attending a public institution.
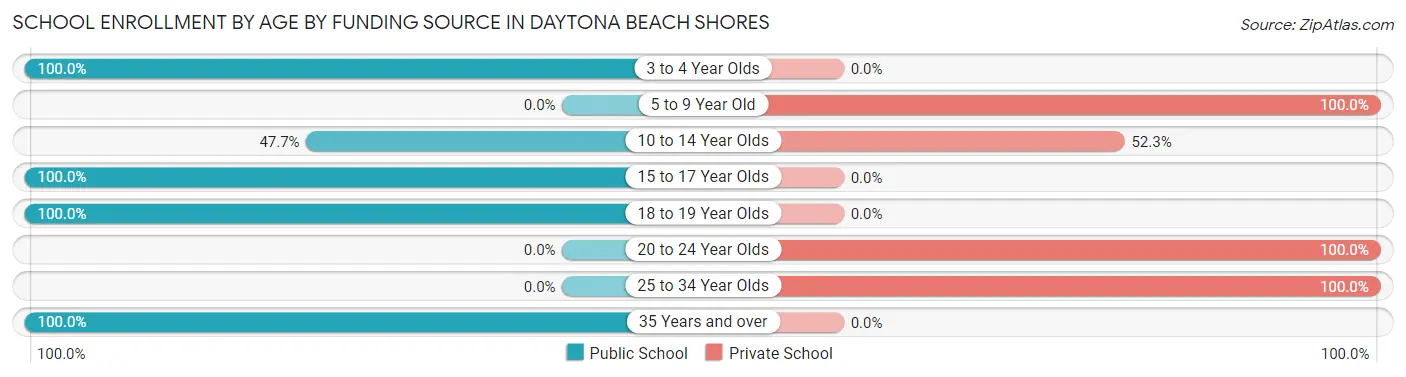
| Age Bracket | Public School | Private School |
| 3 to 4 Year Olds | 9 (100.0%) | 0 (0.0%) |
| 5 to 9 Year Old | 0 (0.0%) | 10 (100.0%) |
| 10 to 14 Year Olds | 31 (47.7%) | 34 (52.3%) |
| 15 to 17 Year Olds | 23 (100.0%) | 0 (0.0%) |
| 18 to 19 Year Olds | 17 (100.0%) | 0 (0.0%) |
| 20 to 24 Year Olds | 0 (0.0%) | 28 (100.0%) |
| 25 to 34 Year Olds | 0 (0.0%) | 16 (100.0%) |
| 35 Years and over | 18 (100.0%) | 0 (0.0%) |
| Total | 98 (52.7%) | 88 (47.3%) |
Educational Attainment by Field of Study in Daytona Beach Shores
Business (432 | 20.2%), education (234 | 10.9%), science & technology (233 | 10.9%), engineering (172 | 8.0%), and communications (161 | 7.5%) are the most common fields of study among 2,144 individuals in Daytona Beach Shores who have obtained a bachelor's degree or higher.
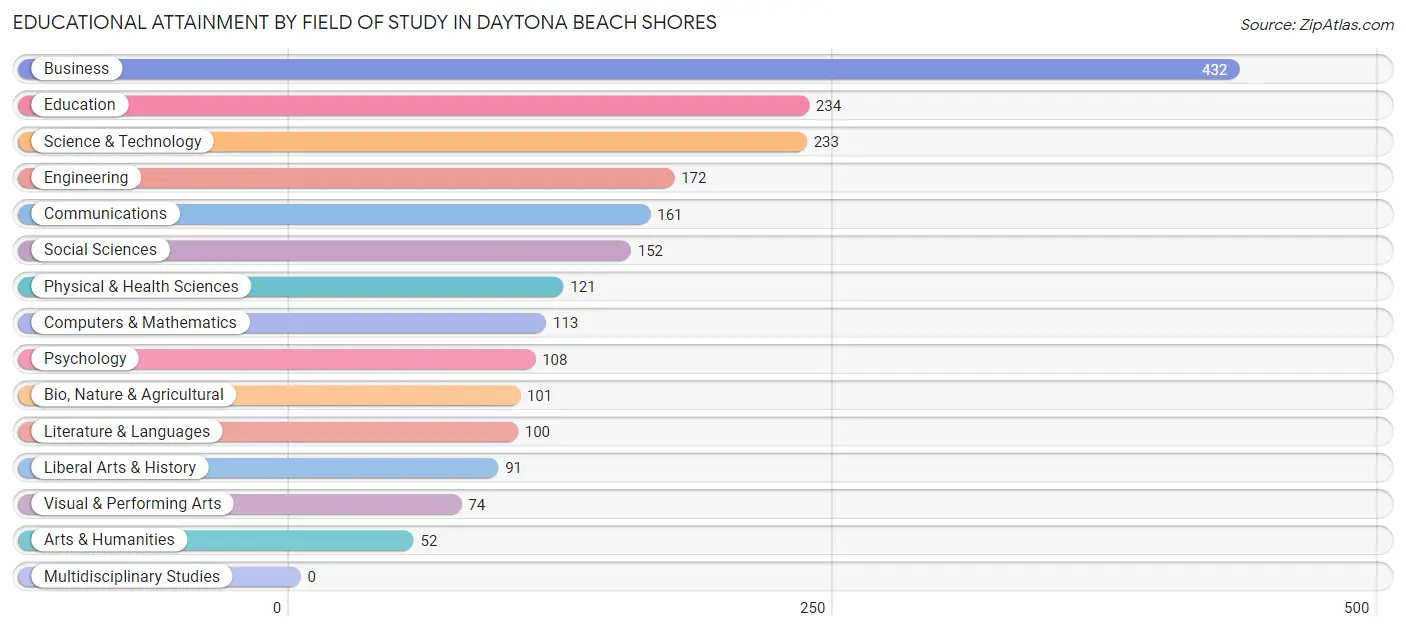
| Field of Study | # Graduates | % Graduates |
| Computers & Mathematics | 113 | 5.3% |
| Bio, Nature & Agricultural | 101 | 4.7% |
| Physical & Health Sciences | 121 | 5.6% |
| Psychology | 108 | 5.0% |
| Social Sciences | 152 | 7.1% |
| Engineering | 172 | 8.0% |
| Multidisciplinary Studies | 0 | 0.0% |
| Science & Technology | 233 | 10.9% |
| Business | 432 | 20.2% |
| Education | 234 | 10.9% |
| Literature & Languages | 100 | 4.7% |
| Liberal Arts & History | 91 | 4.2% |
| Visual & Performing Arts | 74 | 3.5% |
| Communications | 161 | 7.5% |
| Arts & Humanities | 52 | 2.4% |
| Total | 2,144 | 100.0% |
Transportation & Commute in Daytona Beach Shores
Vehicle Availability by Sex in Daytona Beach Shores
The most prevalent vehicle ownership categories in Daytona Beach Shores are males with 1 vehicle (284, accounting for 45.2%) and females with 1 vehicle (516, making up 33.4%).
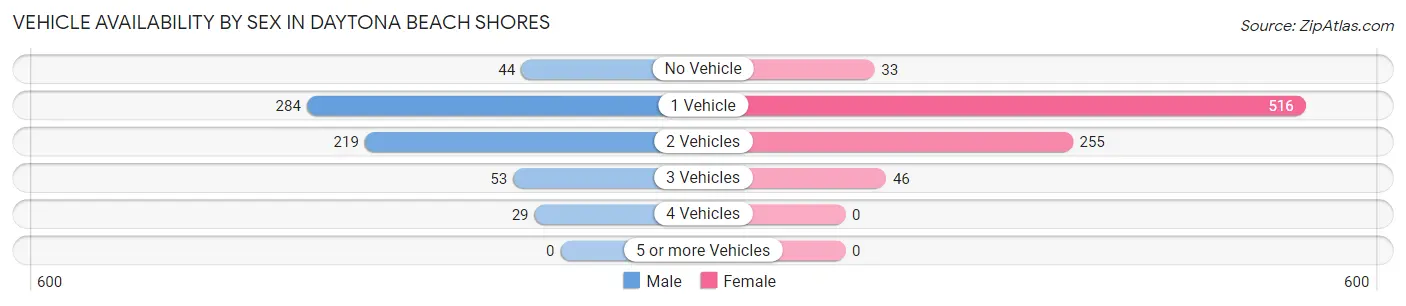
| Vehicles Available | Male | Female |
| No Vehicle | 44 (7.0%) | 33 (3.9%) |
| 1 Vehicle | 284 (45.2%) | 516 (60.7%) |
| 2 Vehicles | 219 (34.8%) | 255 (30.0%) |
| 3 Vehicles | 53 (8.4%) | 46 (5.4%) |
| 4 Vehicles | 29 (4.6%) | 0 (0.0%) |
| 5 or more Vehicles | 0 (0.0%) | 0 (0.0%) |
| Total | 629 (100.0%) | 850 (100.0%) |
Commute Time in Daytona Beach Shores
The most frequently occuring commute durations in Daytona Beach Shores are 5 to 9 minutes (318 commuters, 26.2%), 20 to 24 minutes (197 commuters, 16.2%), and 15 to 19 minutes (159 commuters, 13.1%).
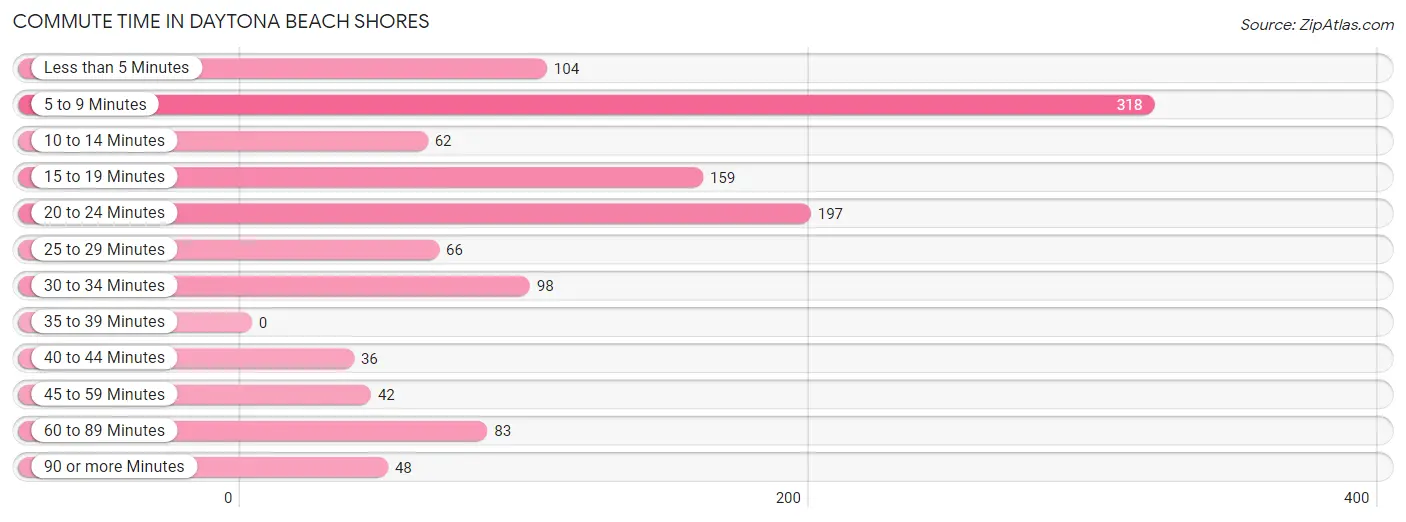
| Commute Time | # Commuters | % Commuters |
| Less than 5 Minutes | 104 | 8.6% |
| 5 to 9 Minutes | 318 | 26.2% |
| 10 to 14 Minutes | 62 | 5.1% |
| 15 to 19 Minutes | 159 | 13.1% |
| 20 to 24 Minutes | 197 | 16.2% |
| 25 to 29 Minutes | 66 | 5.4% |
| 30 to 34 Minutes | 98 | 8.1% |
| 35 to 39 Minutes | 0 | 0.0% |
| 40 to 44 Minutes | 36 | 3.0% |
| 45 to 59 Minutes | 42 | 3.5% |
| 60 to 89 Minutes | 83 | 6.8% |
| 90 or more Minutes | 48 | 4.0% |
Commute Time by Sex in Daytona Beach Shores
The most common commute times in Daytona Beach Shores are 15 to 19 minutes (105 commuters, 20.1%) for males and 5 to 9 minutes (245 commuters, 35.5%) for females.
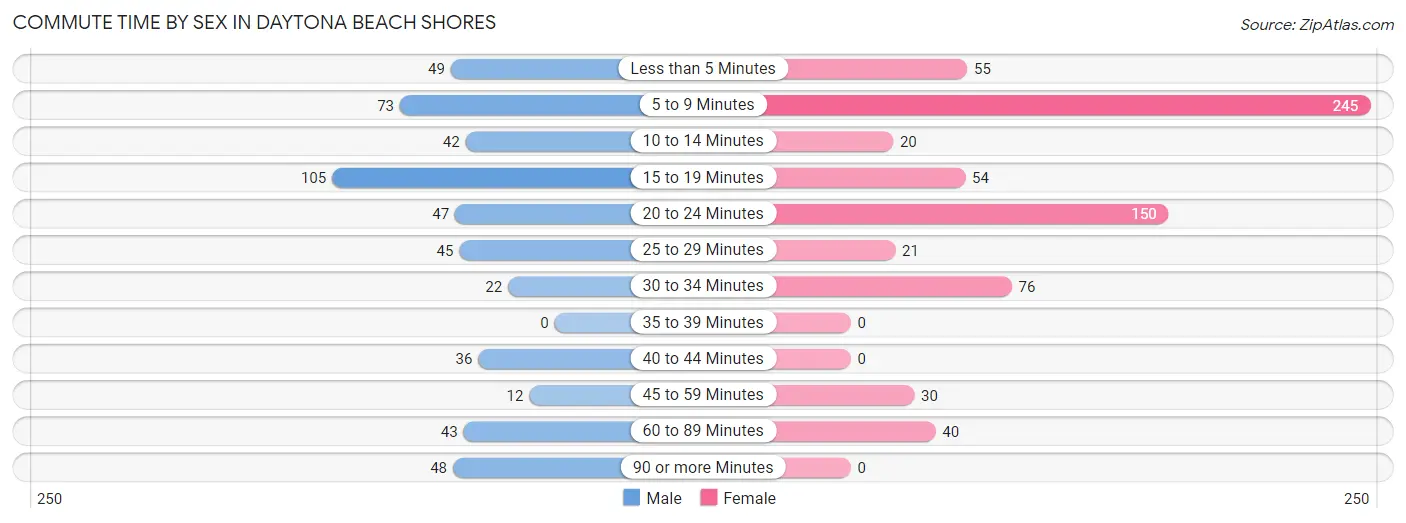
| Commute Time | Male | Female |
| Less than 5 Minutes | 49 (9.4%) | 55 (8.0%) |
| 5 to 9 Minutes | 73 (14.0%) | 245 (35.5%) |
| 10 to 14 Minutes | 42 (8.1%) | 20 (2.9%) |
| 15 to 19 Minutes | 105 (20.1%) | 54 (7.8%) |
| 20 to 24 Minutes | 47 (9.0%) | 150 (21.7%) |
| 25 to 29 Minutes | 45 (8.6%) | 21 (3.0%) |
| 30 to 34 Minutes | 22 (4.2%) | 76 (11.0%) |
| 35 to 39 Minutes | 0 (0.0%) | 0 (0.0%) |
| 40 to 44 Minutes | 36 (6.9%) | 0 (0.0%) |
| 45 to 59 Minutes | 12 (2.3%) | 30 (4.3%) |
| 60 to 89 Minutes | 43 (8.2%) | 40 (5.8%) |
| 90 or more Minutes | 48 (9.2%) | 0 (0.0%) |
Time of Departure to Work by Sex in Daytona Beach Shores
The most frequent times of departure to work in Daytona Beach Shores are 7:00 AM to 7:29 AM (125, 23.9%) for males and 10:00 AM to 10:59 AM (220, 31.8%) for females.
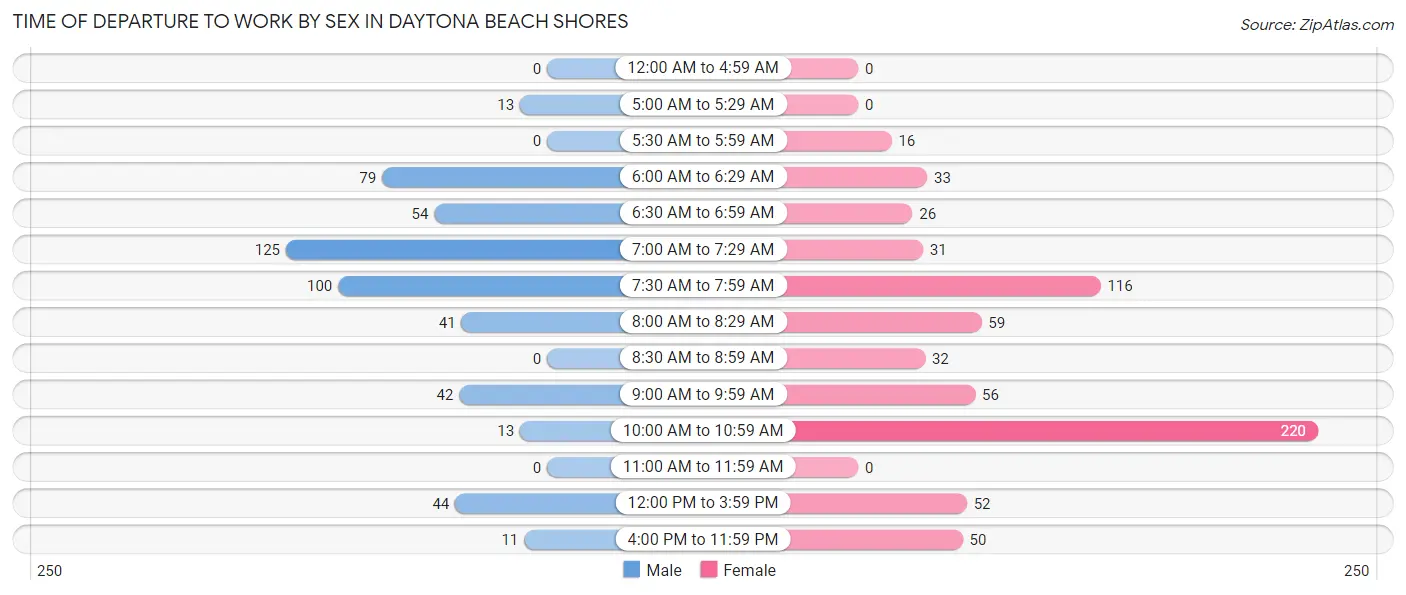
| Time of Departure | Male | Female |
| 12:00 AM to 4:59 AM | 0 (0.0%) | 0 (0.0%) |
| 5:00 AM to 5:29 AM | 13 (2.5%) | 0 (0.0%) |
| 5:30 AM to 5:59 AM | 0 (0.0%) | 16 (2.3%) |
| 6:00 AM to 6:29 AM | 79 (15.1%) | 33 (4.8%) |
| 6:30 AM to 6:59 AM | 54 (10.3%) | 26 (3.8%) |
| 7:00 AM to 7:29 AM | 125 (23.9%) | 31 (4.5%) |
| 7:30 AM to 7:59 AM | 100 (19.2%) | 116 (16.8%) |
| 8:00 AM to 8:29 AM | 41 (7.9%) | 59 (8.5%) |
| 8:30 AM to 8:59 AM | 0 (0.0%) | 32 (4.6%) |
| 9:00 AM to 9:59 AM | 42 (8.1%) | 56 (8.1%) |
| 10:00 AM to 10:59 AM | 13 (2.5%) | 220 (31.8%) |
| 11:00 AM to 11:59 AM | 0 (0.0%) | 0 (0.0%) |
| 12:00 PM to 3:59 PM | 44 (8.4%) | 52 (7.5%) |
| 4:00 PM to 11:59 PM | 11 (2.1%) | 50 (7.2%) |
| Total | 522 (100.0%) | 691 (100.0%) |
Housing Occupancy in Daytona Beach Shores
Occupancy by Ownership in Daytona Beach Shores
Of the total 3,223 dwellings in Daytona Beach Shores, owner-occupied units account for 2,257 (70.0%), while renter-occupied units make up 966 (30.0%).
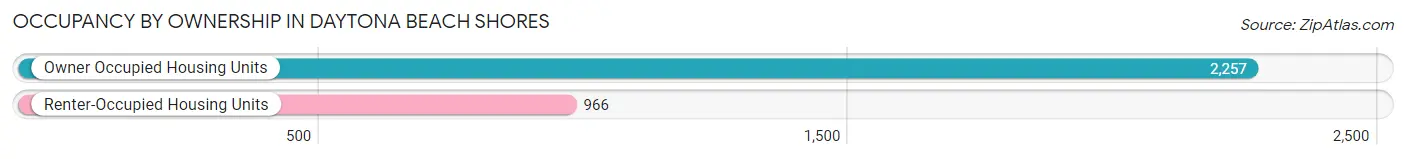
| Occupancy | # Housing Units | % Housing Units |
| Owner Occupied Housing Units | 2,257 | 70.0% |
| Renter-Occupied Housing Units | 966 | 30.0% |
| Total Occupied Housing Units | 3,223 | 100.0% |
Occupancy by Household Size in Daytona Beach Shores
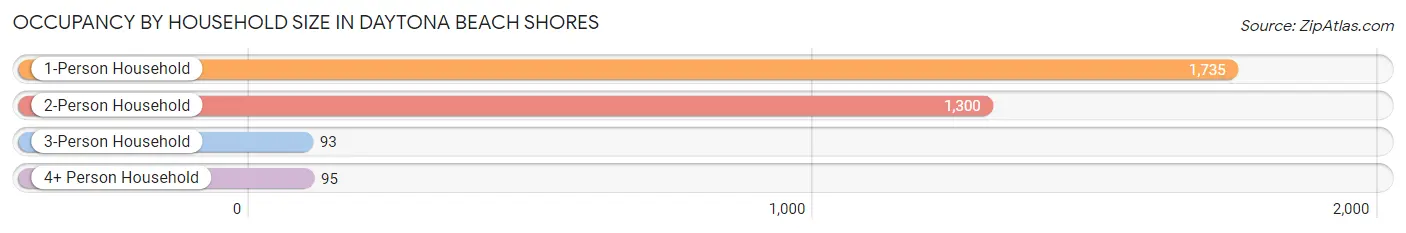
| Household Size | # Housing Units | % Housing Units |
| 1-Person Household | 1,735 | 53.8% |
| 2-Person Household | 1,300 | 40.3% |
| 3-Person Household | 93 | 2.9% |
| 4+ Person Household | 95 | 2.9% |
| Total Housing Units | 3,223 | 100.0% |
Occupancy by Ownership by Household Size in Daytona Beach Shores
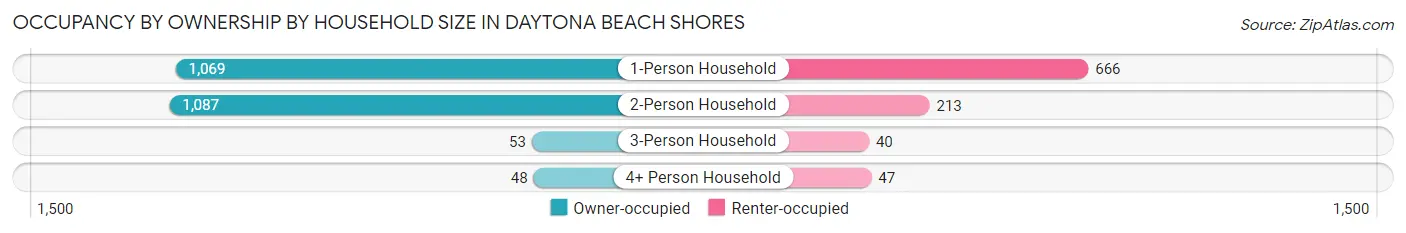
| Household Size | Owner-occupied | Renter-occupied |
| 1-Person Household | 1,069 (61.6%) | 666 (38.4%) |
| 2-Person Household | 1,087 (83.6%) | 213 (16.4%) |
| 3-Person Household | 53 (57.0%) | 40 (43.0%) |
| 4+ Person Household | 48 (50.5%) | 47 (49.5%) |
| Total Housing Units | 2,257 (70.0%) | 966 (30.0%) |
Occupancy by Educational Attainment in Daytona Beach Shores
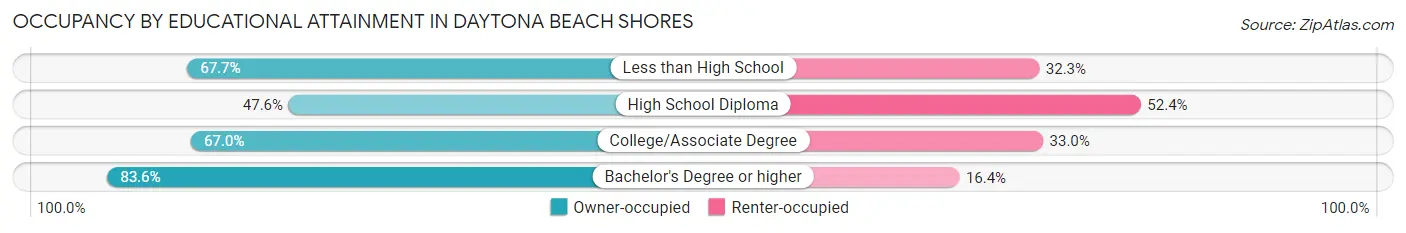
| Household Size | Owner-occupied | Renter-occupied |
| Less than High School | 63 (67.7%) | 30 (32.3%) |
| High School Diploma | 338 (47.6%) | 372 (52.4%) |
| College/Associate Degree | 674 (67.0%) | 332 (33.0%) |
| Bachelor's Degree or higher | 1,182 (83.6%) | 232 (16.4%) |
Occupancy by Age of Householder in Daytona Beach Shores
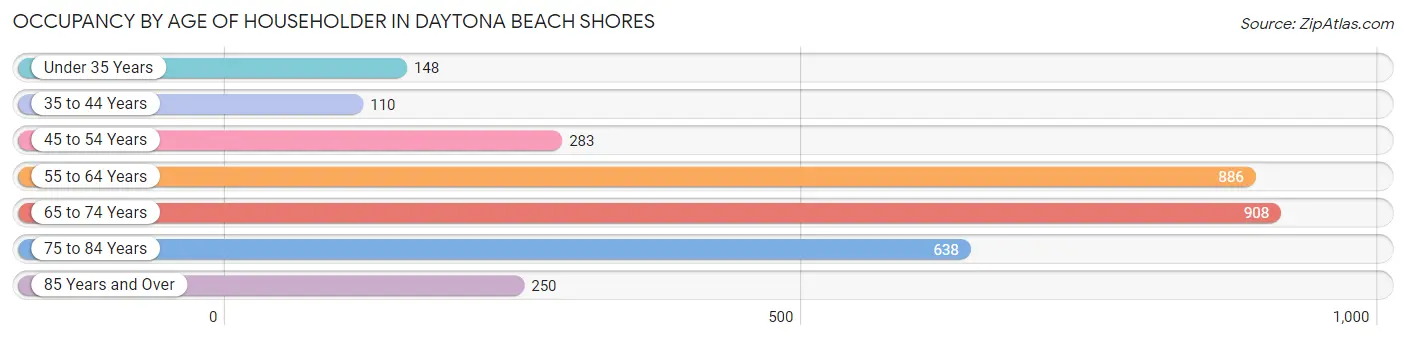
| Age Bracket | # Households | % Households |
| Under 35 Years | 148 | 4.6% |
| 35 to 44 Years | 110 | 3.4% |
| 45 to 54 Years | 283 | 8.8% |
| 55 to 64 Years | 886 | 27.5% |
| 65 to 74 Years | 908 | 28.2% |
| 75 to 84 Years | 638 | 19.8% |
| 85 Years and Over | 250 | 7.8% |
| Total | 3,223 | 100.0% |
Housing Finances in Daytona Beach Shores
Median Income by Occupancy in Daytona Beach Shores
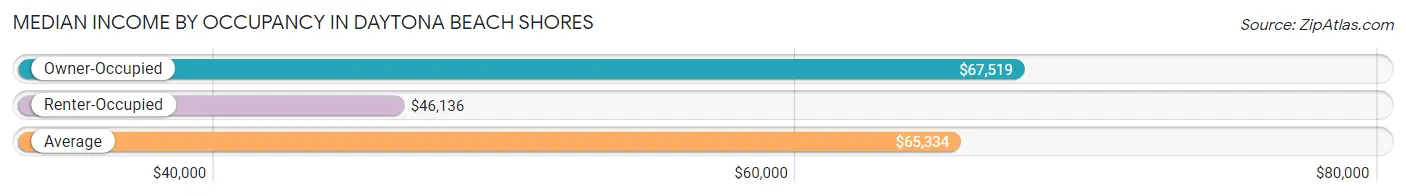
| Occupancy Type | # Households | Median Income |
| Owner-Occupied | 2,257 (70.0%) | $67,519 |
| Renter-Occupied | 966 (30.0%) | $46,136 |
| Average | 3,223 (100.0%) | $65,334 |
Occupancy by Householder Income Bracket in Daytona Beach Shores
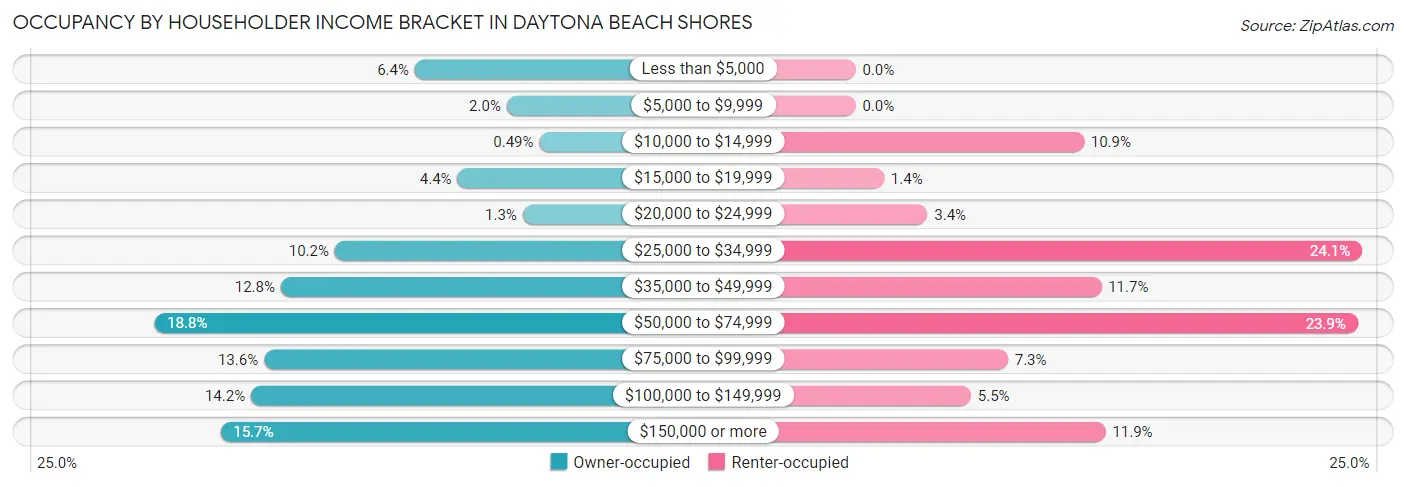
| Income Bracket | Owner-occupied | Renter-occupied |
| Less than $5,000 | 145 (6.4%) | 0 (0.0%) |
| $5,000 to $9,999 | 46 (2.0%) | 0 (0.0%) |
| $10,000 to $14,999 | 11 (0.5%) | 105 (10.9%) |
| $15,000 to $19,999 | 99 (4.4%) | 13 (1.3%) |
| $20,000 to $24,999 | 29 (1.3%) | 33 (3.4%) |
| $25,000 to $34,999 | 231 (10.2%) | 233 (24.1%) |
| $35,000 to $49,999 | 289 (12.8%) | 113 (11.7%) |
| $50,000 to $74,999 | 425 (18.8%) | 231 (23.9%) |
| $75,000 to $99,999 | 307 (13.6%) | 70 (7.2%) |
| $100,000 to $149,999 | 321 (14.2%) | 53 (5.5%) |
| $150,000 or more | 354 (15.7%) | 115 (11.9%) |
| Total | 2,257 (100.0%) | 966 (100.0%) |
Monthly Housing Cost Tiers in Daytona Beach Shores
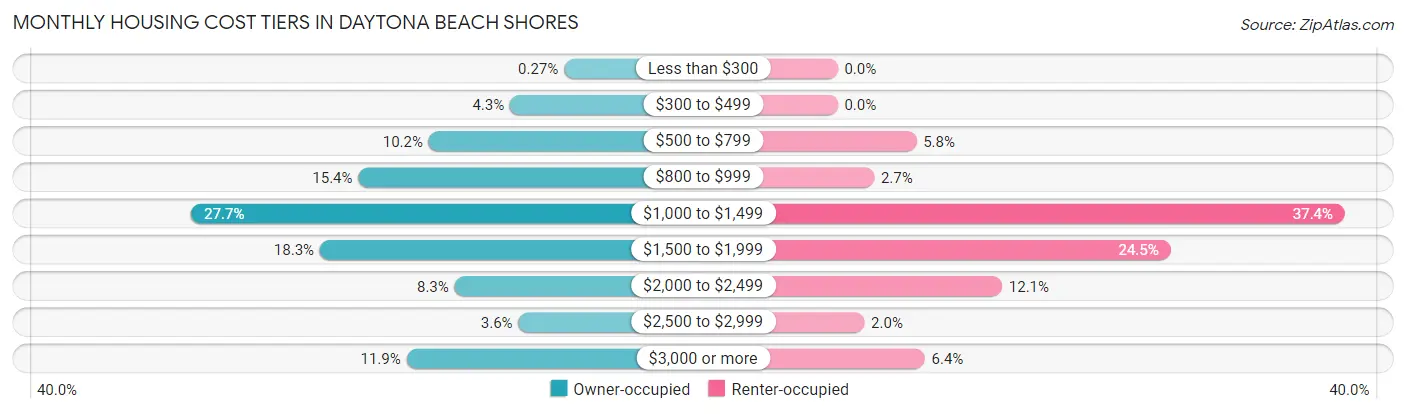
| Monthly Cost | Owner-occupied | Renter-occupied |
| Less than $300 | 6 (0.3%) | 0 (0.0%) |
| $300 to $499 | 96 (4.3%) | 0 (0.0%) |
| $500 to $799 | 231 (10.2%) | 56 (5.8%) |
| $800 to $999 | 348 (15.4%) | 26 (2.7%) |
| $1,000 to $1,499 | 626 (27.7%) | 361 (37.4%) |
| $1,500 to $1,999 | 412 (18.2%) | 237 (24.5%) |
| $2,000 to $2,499 | 188 (8.3%) | 117 (12.1%) |
| $2,500 to $2,999 | 82 (3.6%) | 19 (2.0%) |
| $3,000 or more | 268 (11.9%) | 62 (6.4%) |
| Total | 2,257 (100.0%) | 966 (100.0%) |
Physical Housing Characteristics in Daytona Beach Shores
Housing Structures in Daytona Beach Shores
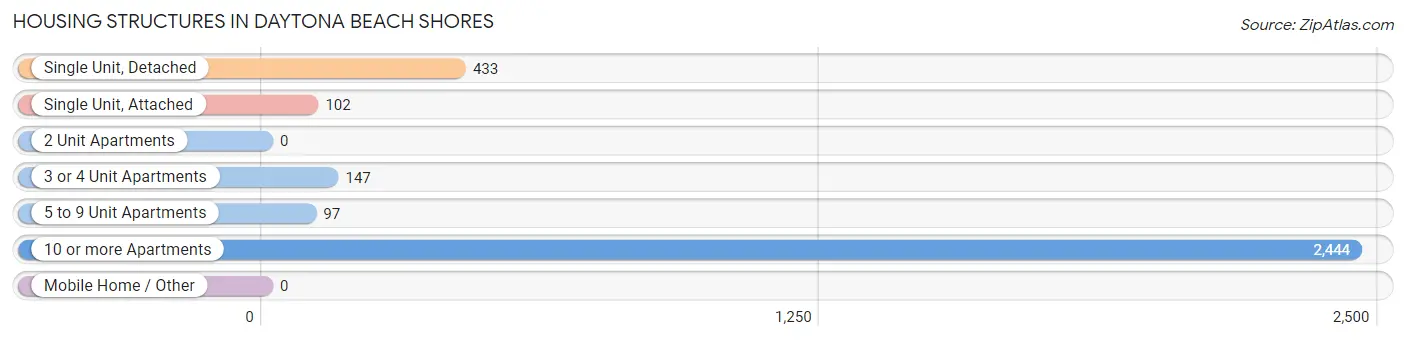
| Structure Type | # Housing Units | % Housing Units |
| Single Unit, Detached | 433 | 13.4% |
| Single Unit, Attached | 102 | 3.2% |
| 2 Unit Apartments | 0 | 0.0% |
| 3 or 4 Unit Apartments | 147 | 4.6% |
| 5 to 9 Unit Apartments | 97 | 3.0% |
| 10 or more Apartments | 2,444 | 75.8% |
| Mobile Home / Other | 0 | 0.0% |
| Total | 3,223 | 100.0% |
Housing Structures by Occupancy in Daytona Beach Shores
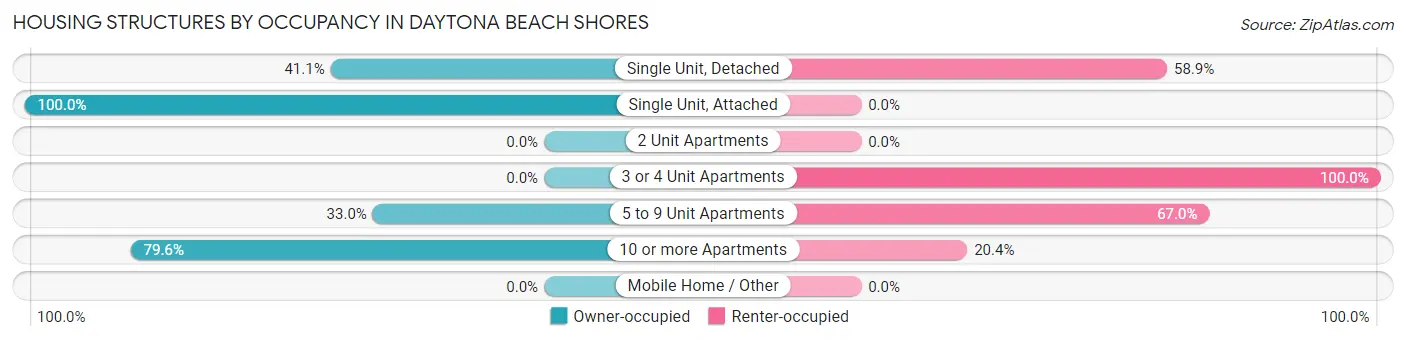
| Structure Type | Owner-occupied | Renter-occupied |
| Single Unit, Detached | 178 (41.1%) | 255 (58.9%) |
| Single Unit, Attached | 102 (100.0%) | 0 (0.0%) |
| 2 Unit Apartments | 0 (0.0%) | 0 (0.0%) |
| 3 or 4 Unit Apartments | 0 (0.0%) | 147 (100.0%) |
| 5 to 9 Unit Apartments | 32 (33.0%) | 65 (67.0%) |
| 10 or more Apartments | 1,945 (79.6%) | 499 (20.4%) |
| Mobile Home / Other | 0 (0.0%) | 0 (0.0%) |
| Total | 2,257 (70.0%) | 966 (30.0%) |
Housing Structures by Number of Rooms in Daytona Beach Shores
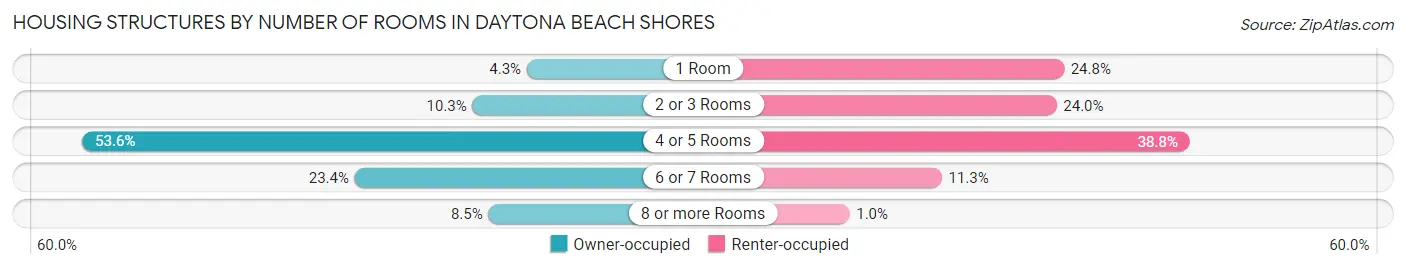
| Number of Rooms | Owner-occupied | Renter-occupied |
| 1 Room | 96 (4.3%) | 240 (24.8%) |
| 2 or 3 Rooms | 232 (10.3%) | 232 (24.0%) |
| 4 or 5 Rooms | 1,210 (53.6%) | 375 (38.8%) |
| 6 or 7 Rooms | 527 (23.4%) | 109 (11.3%) |
| 8 or more Rooms | 192 (8.5%) | 10 (1.0%) |
| Total | 2,257 (100.0%) | 966 (100.0%) |
Housing Structure by Heating Type in Daytona Beach Shores
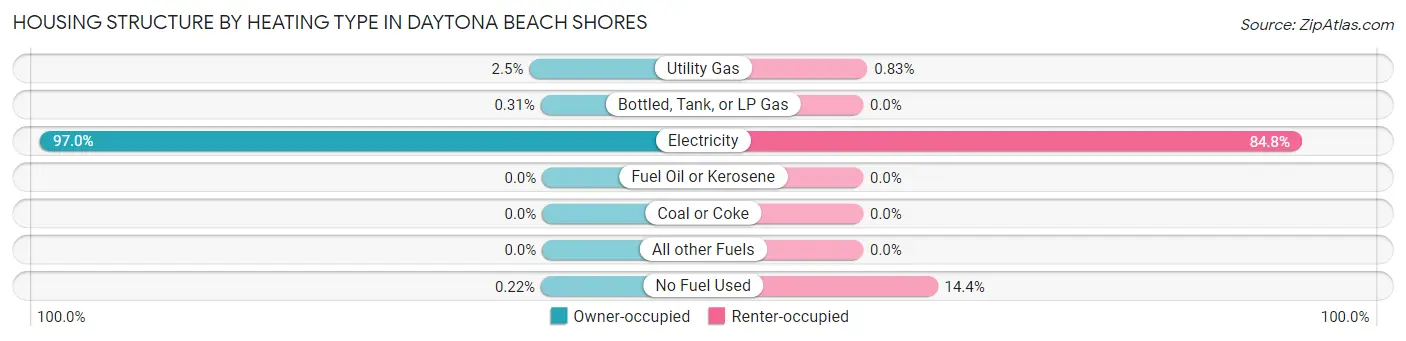
| Heating Type | Owner-occupied | Renter-occupied |
| Utility Gas | 56 (2.5%) | 8 (0.8%) |
| Bottled, Tank, or LP Gas | 7 (0.3%) | 0 (0.0%) |
| Electricity | 2,189 (97.0%) | 819 (84.8%) |
| Fuel Oil or Kerosene | 0 (0.0%) | 0 (0.0%) |
| Coal or Coke | 0 (0.0%) | 0 (0.0%) |
| All other Fuels | 0 (0.0%) | 0 (0.0%) |
| No Fuel Used | 5 (0.2%) | 139 (14.4%) |
| Total | 2,257 (100.0%) | 966 (100.0%) |
Household Vehicle Usage in Daytona Beach Shores
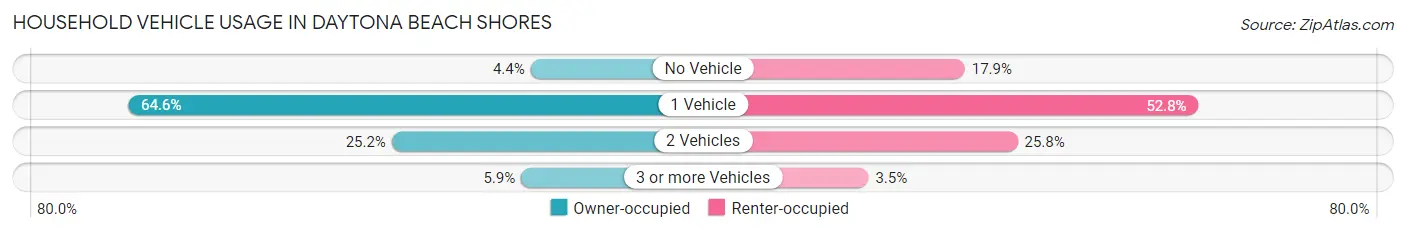
| Vehicles per Household | Owner-occupied | Renter-occupied |
| No Vehicle | 100 (4.4%) | 173 (17.9%) |
| 1 Vehicle | 1,457 (64.5%) | 510 (52.8%) |
| 2 Vehicles | 568 (25.2%) | 249 (25.8%) |
| 3 or more Vehicles | 132 (5.9%) | 34 (3.5%) |
| Total | 2,257 (100.0%) | 966 (100.0%) |
Real Estate & Mortgages in Daytona Beach Shores
Real Estate and Mortgage Overview in Daytona Beach Shores
| Characteristic | Without Mortgage | With Mortgage |
| Housing Units | 1,481 | 776 |
| Median Property Value | $354,300 | $402,600 |
| Median Household Income | $59,336 | $193 |
| Monthly Housing Costs | $1,069 | $268 |
| Real Estate Taxes | $3,822 | $18 |
Property Value by Mortgage Status in Daytona Beach Shores
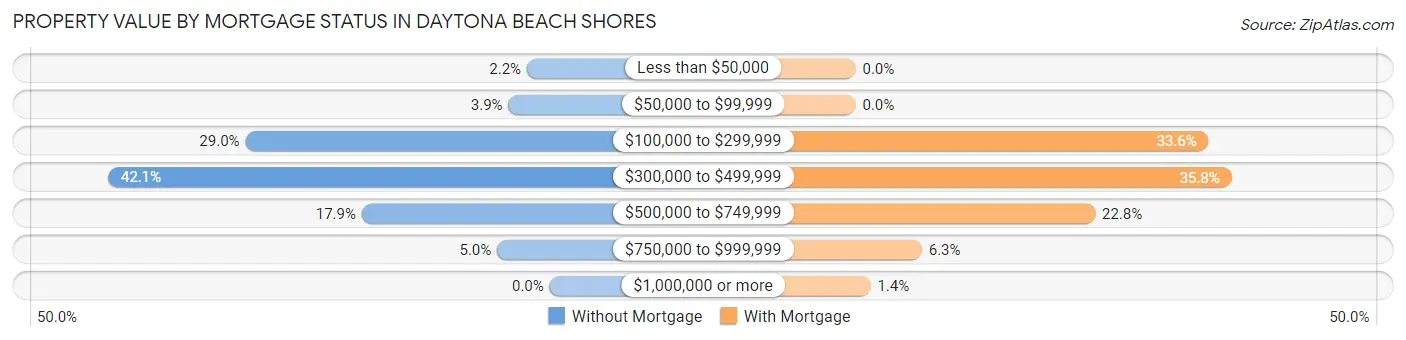
| Property Value | Without Mortgage | With Mortgage |
| Less than $50,000 | 32 (2.2%) | 0 (0.0%) |
| $50,000 to $99,999 | 58 (3.9%) | 0 (0.0%) |
| $100,000 to $299,999 | 429 (29.0%) | 261 (33.6%) |
| $300,000 to $499,999 | 623 (42.1%) | 278 (35.8%) |
| $500,000 to $749,999 | 265 (17.9%) | 177 (22.8%) |
| $750,000 to $999,999 | 74 (5.0%) | 49 (6.3%) |
| $1,000,000 or more | 0 (0.0%) | 11 (1.4%) |
| Total | 1,481 (100.0%) | 776 (100.0%) |
Household Income by Mortgage Status in Daytona Beach Shores
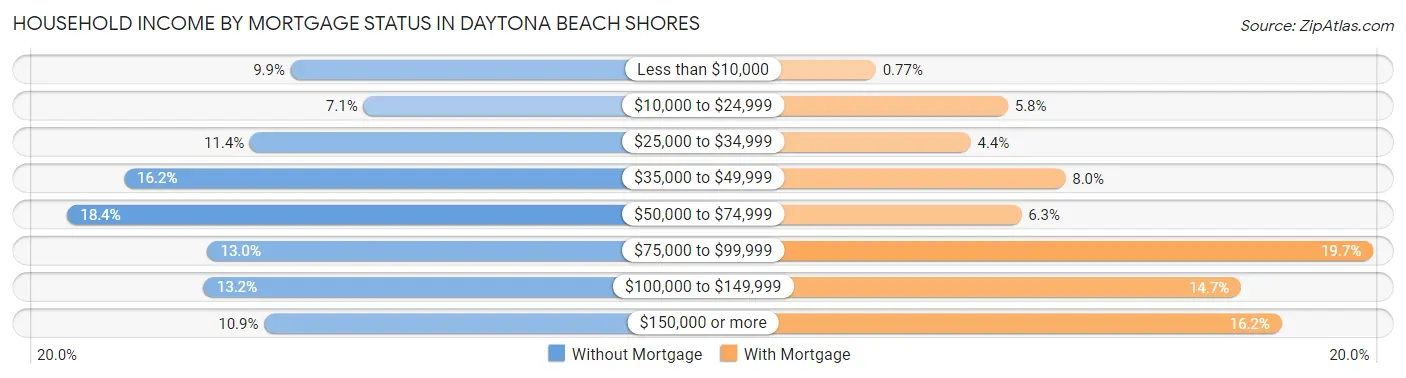
| Household Income | Without Mortgage | With Mortgage |
| Less than $10,000 | 146 (9.9%) | 6 (0.8%) |
| $10,000 to $24,999 | 105 (7.1%) | 45 (5.8%) |
| $25,000 to $34,999 | 169 (11.4%) | 34 (4.4%) |
| $35,000 to $49,999 | 240 (16.2%) | 62 (8.0%) |
| $50,000 to $74,999 | 272 (18.4%) | 49 (6.3%) |
| $75,000 to $99,999 | 193 (13.0%) | 153 (19.7%) |
| $100,000 to $149,999 | 195 (13.2%) | 114 (14.7%) |
| $150,000 or more | 161 (10.9%) | 126 (16.2%) |
| Total | 1,481 (100.0%) | 776 (100.0%) |
Property Value to Household Income Ratio in Daytona Beach Shores
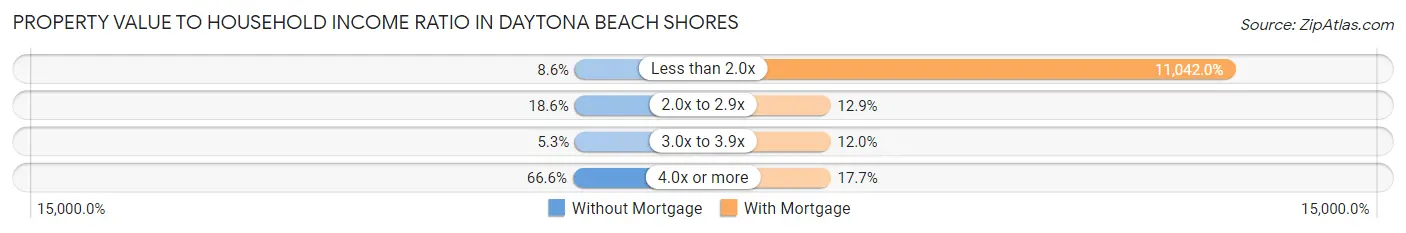
| Value-to-Income Ratio | Without Mortgage | With Mortgage |
| Less than 2.0x | 127 (8.6%) | 85,686 (11,042.0%) |
| 2.0x to 2.9x | 276 (18.6%) | 100 (12.9%) |
| 3.0x to 3.9x | 79 (5.3%) | 93 (12.0%) |
| 4.0x or more | 986 (66.6%) | 137 (17.6%) |
| Total | 1,481 (100.0%) | 776 (100.0%) |
Real Estate Taxes by Mortgage Status in Daytona Beach Shores
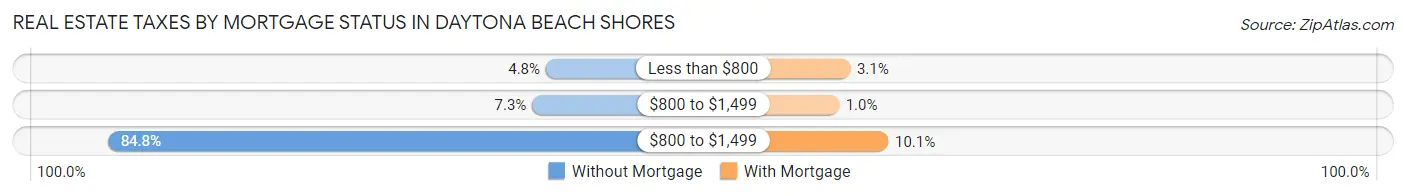
| Property Taxes | Without Mortgage | With Mortgage |
| Less than $800 | 71 (4.8%) | 24 (3.1%) |
| $800 to $1,499 | 108 (7.3%) | 8 (1.0%) |
| $800 to $1,499 | 1,256 (84.8%) | 78 (10.1%) |
| Total | 1,481 (100.0%) | 776 (100.0%) |
Health & Disability in Daytona Beach Shores
Health Insurance Coverage by Age in Daytona Beach Shores
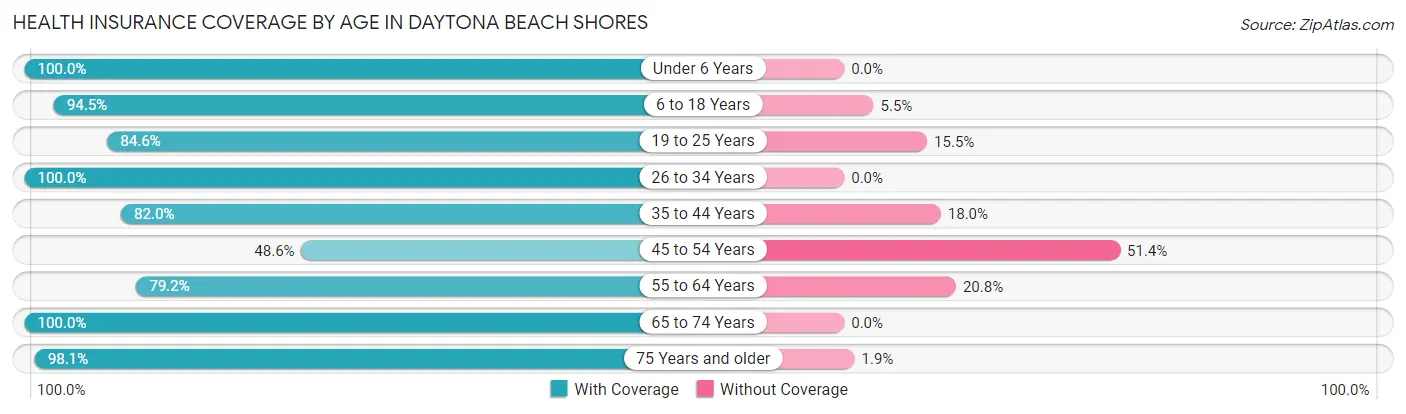
| Age Bracket | With Coverage | Without Coverage |
| Under 6 Years | 31 (100.0%) | 0 (0.0%) |
| 6 to 18 Years | 121 (94.5%) | 7 (5.5%) |
| 19 to 25 Years | 104 (84.6%) | 19 (15.4%) |
| 26 to 34 Years | 212 (100.0%) | 0 (0.0%) |
| 35 to 44 Years | 214 (82.0%) | 47 (18.0%) |
| 45 to 54 Years | 204 (48.6%) | 216 (51.4%) |
| 55 to 64 Years | 954 (79.2%) | 251 (20.8%) |
| 65 to 74 Years | 1,443 (100.0%) | 0 (0.0%) |
| 75 Years and older | 1,228 (98.1%) | 24 (1.9%) |
| Total | 4,511 (88.9%) | 564 (11.1%) |
Health Insurance Coverage by Citizenship Status in Daytona Beach Shores
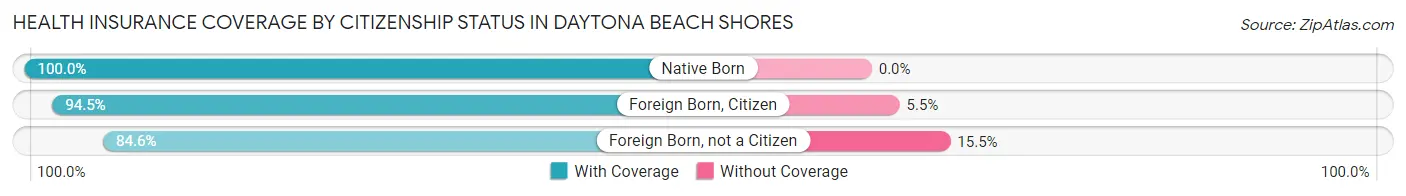
| Citizenship Status | With Coverage | Without Coverage |
| Native Born | 31 (100.0%) | 0 (0.0%) |
| Foreign Born, Citizen | 121 (94.5%) | 7 (5.5%) |
| Foreign Born, not a Citizen | 104 (84.6%) | 19 (15.4%) |
Health Insurance Coverage by Household Income in Daytona Beach Shores
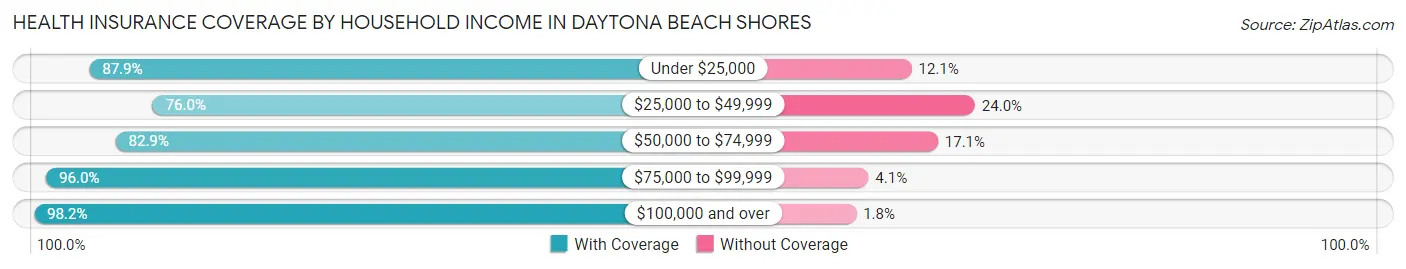
| Household Income | With Coverage | Without Coverage |
| Under $25,000 | 478 (87.9%) | 66 (12.1%) |
| $25,000 to $49,999 | 871 (76.0%) | 275 (24.0%) |
| $50,000 to $74,999 | 802 (82.9%) | 165 (17.1%) |
| $75,000 to $99,999 | 640 (96.0%) | 27 (4.1%) |
| $100,000 and over | 1,720 (98.2%) | 31 (1.8%) |
Public vs Private Health Insurance Coverage by Age in Daytona Beach Shores
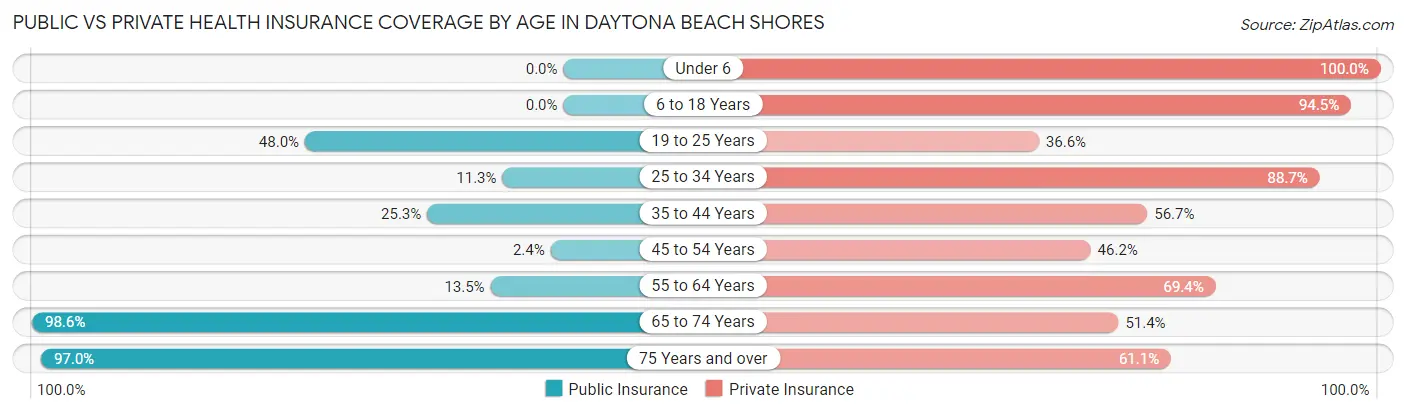
| Age Bracket | Public Insurance | Private Insurance |
| Under 6 | 0 (0.0%) | 31 (100.0%) |
| 6 to 18 Years | 0 (0.0%) | 121 (94.5%) |
| 19 to 25 Years | 59 (48.0%) | 45 (36.6%) |
| 25 to 34 Years | 24 (11.3%) | 188 (88.7%) |
| 35 to 44 Years | 66 (25.3%) | 148 (56.7%) |
| 45 to 54 Years | 10 (2.4%) | 194 (46.2%) |
| 55 to 64 Years | 163 (13.5%) | 836 (69.4%) |
| 65 to 74 Years | 1,423 (98.6%) | 741 (51.3%) |
| 75 Years and over | 1,214 (97.0%) | 765 (61.1%) |
| Total | 2,959 (58.3%) | 3,069 (60.5%) |
Disability Status by Sex by Age in Daytona Beach Shores
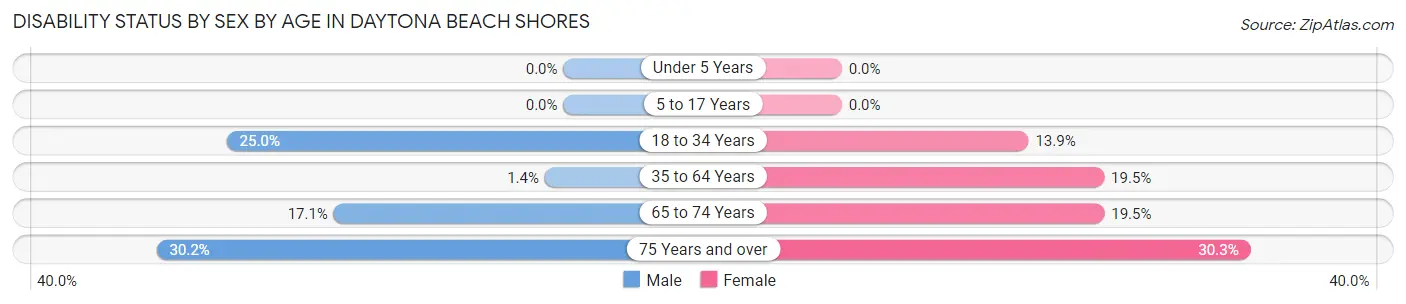
| Age Bracket | Male | Female |
| Under 5 Years | 0 (0.0%) | 0 (0.0%) |
| 5 to 17 Years | 0 (0.0%) | 0 (0.0%) |
| 18 to 34 Years | 44 (25.0%) | 23 (13.9%) |
| 35 to 64 Years | 10 (1.4%) | 226 (19.5%) |
| 65 to 74 Years | 120 (17.1%) | 144 (19.5%) |
| 75 Years and over | 190 (30.2%) | 189 (30.3%) |
Disability Class by Sex by Age in Daytona Beach Shores
Disability Class: Hearing Difficulty
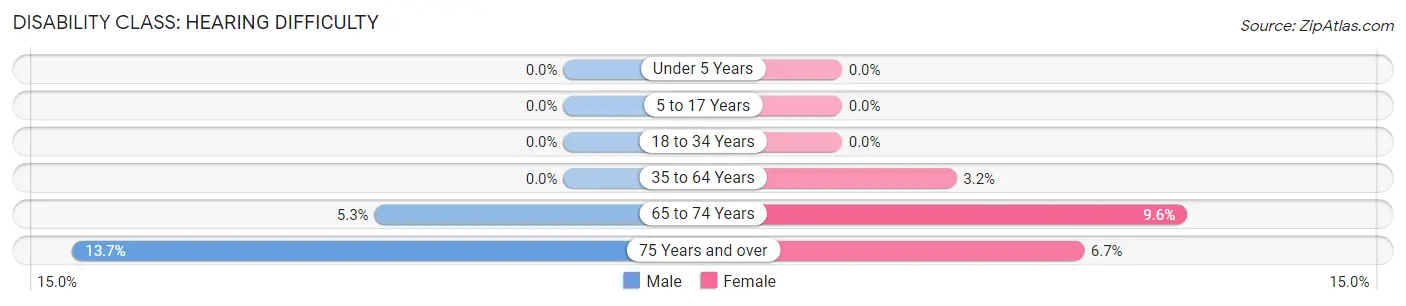
| Age Bracket | Male | Female |
| Under 5 Years | 0 (0.0%) | 0 (0.0%) |
| 5 to 17 Years | 0 (0.0%) | 0 (0.0%) |
| 18 to 34 Years | 0 (0.0%) | 0 (0.0%) |
| 35 to 64 Years | 0 (0.0%) | 37 (3.2%) |
| 65 to 74 Years | 37 (5.3%) | 71 (9.6%) |
| 75 Years and over | 86 (13.7%) | 42 (6.7%) |
Disability Class: Vision Difficulty
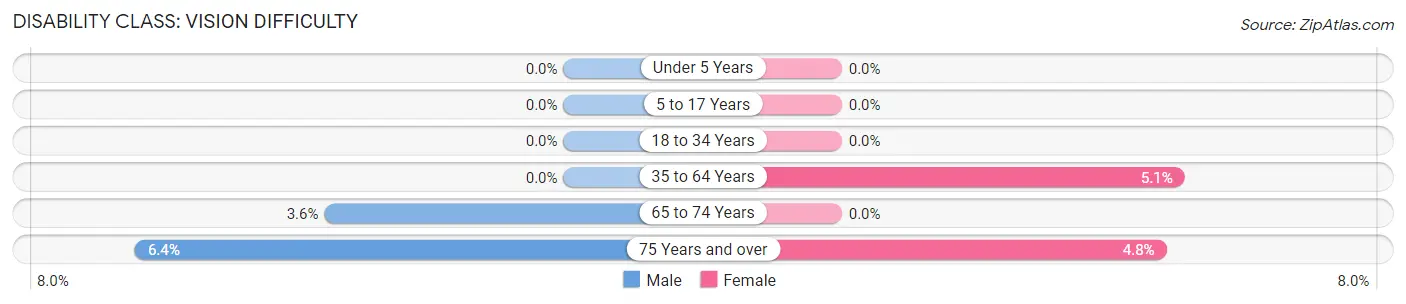
| Age Bracket | Male | Female |
| Under 5 Years | 0 (0.0%) | 0 (0.0%) |
| 5 to 17 Years | 0 (0.0%) | 0 (0.0%) |
| 18 to 34 Years | 0 (0.0%) | 0 (0.0%) |
| 35 to 64 Years | 0 (0.0%) | 59 (5.1%) |
| 65 to 74 Years | 25 (3.5%) | 0 (0.0%) |
| 75 Years and over | 40 (6.4%) | 30 (4.8%) |
Disability Class: Cognitive Difficulty
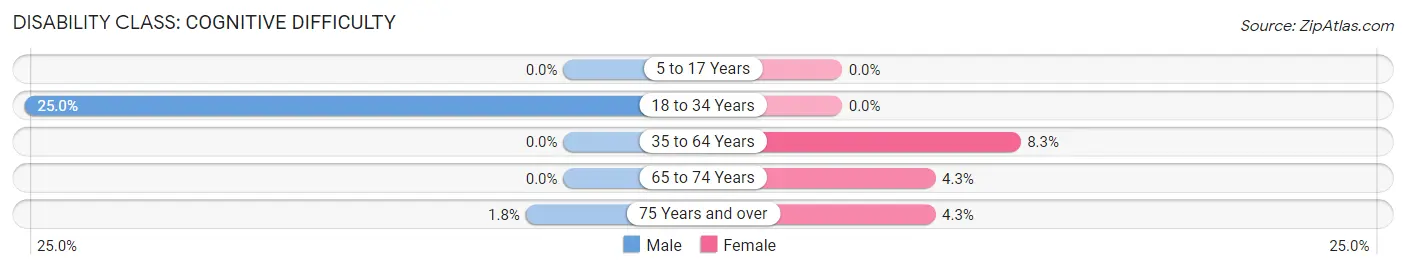
| Age Bracket | Male | Female |
| 5 to 17 Years | 0 (0.0%) | 0 (0.0%) |
| 18 to 34 Years | 44 (25.0%) | 0 (0.0%) |
| 35 to 64 Years | 0 (0.0%) | 96 (8.3%) |
| 65 to 74 Years | 0 (0.0%) | 32 (4.3%) |
| 75 Years and over | 11 (1.8%) | 27 (4.3%) |
Disability Class: Ambulatory Difficulty
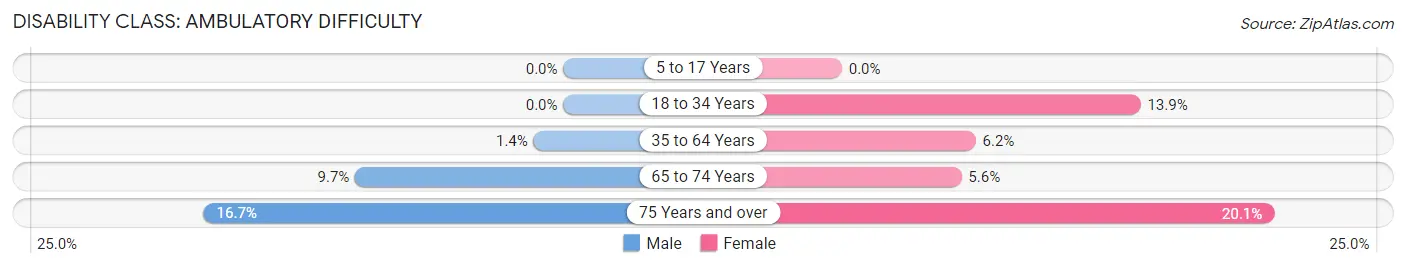
| Age Bracket | Male | Female |
| 5 to 17 Years | 0 (0.0%) | 0 (0.0%) |
| 18 to 34 Years | 0 (0.0%) | 23 (13.9%) |
| 35 to 64 Years | 10 (1.4%) | 72 (6.2%) |
| 65 to 74 Years | 68 (9.7%) | 41 (5.6%) |
| 75 Years and over | 105 (16.7%) | 125 (20.1%) |
Disability Class: Self-Care Difficulty
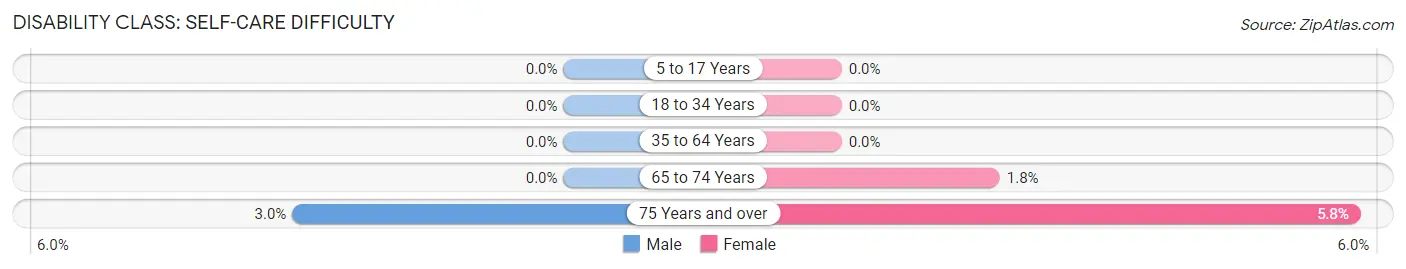
| Age Bracket | Male | Female |
| 5 to 17 Years | 0 (0.0%) | 0 (0.0%) |
| 18 to 34 Years | 0 (0.0%) | 0 (0.0%) |
| 35 to 64 Years | 0 (0.0%) | 0 (0.0%) |
| 65 to 74 Years | 0 (0.0%) | 13 (1.8%) |
| 75 Years and over | 19 (3.0%) | 36 (5.8%) |
Technology Access in Daytona Beach Shores
Computing Device Access in Daytona Beach Shores
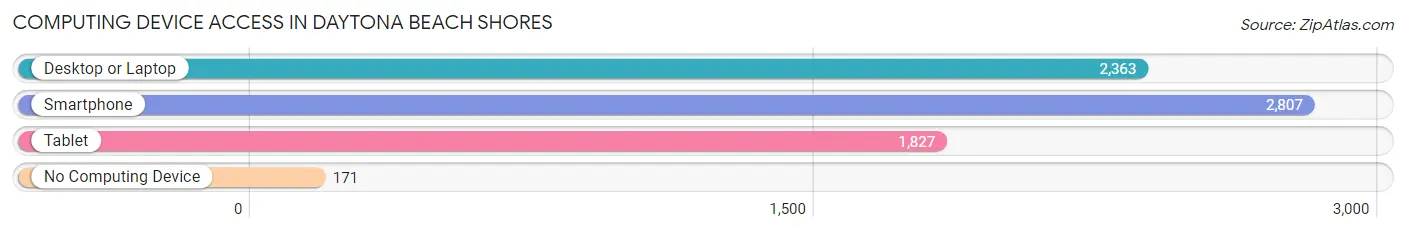
| Device Type | # Households | % Households |
| Desktop or Laptop | 2,363 | 73.3% |
| Smartphone | 2,807 | 87.1% |
| Tablet | 1,827 | 56.7% |
| No Computing Device | 171 | 5.3% |
| Total | 3,223 | 100.0% |
Internet Access in Daytona Beach Shores
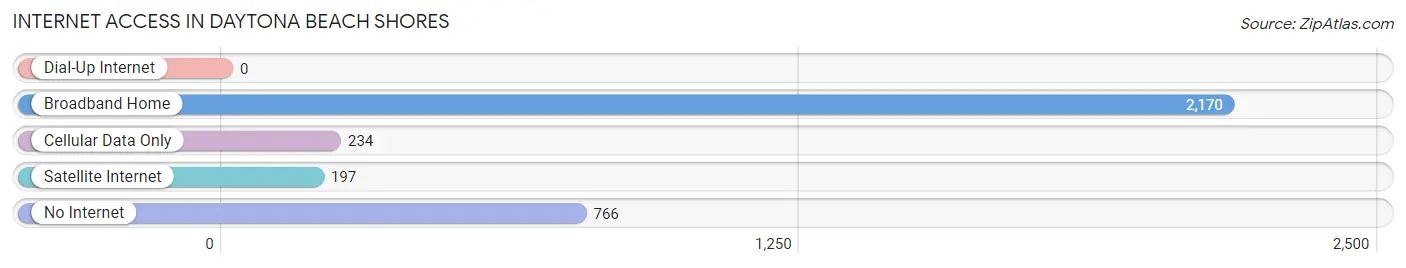
| Internet Type | # Households | % Households |
| Dial-Up Internet | 0 | 0.0% |
| Broadband Home | 2,170 | 67.3% |
| Cellular Data Only | 234 | 7.3% |
| Satellite Internet | 197 | 6.1% |
| No Internet | 766 | 23.8% |
| Total | 3,223 | 100.0% |
Daytona Beach Shores Summary
Daytona Beach Shores is a city located in Volusia County, Florida, United States. It is situated on the Atlantic Ocean, just south of Daytona Beach. The city was incorporated in 1960 and has a population of approximately 4,000 people.
Geography
Daytona Beach Shores is located on the east coast of Florida, just south of Daytona Beach. It is bordered by the Atlantic Ocean to the east, the Halifax River to the north, and the Intracoastal Waterway to the west. The city covers an area of approximately 1.2 square miles and has a total land area of 0.9 square miles. The city is located at an elevation of 10 feet above sea level.
Climate
Daytona Beach Shores has a humid subtropical climate, with hot, humid summers and mild winters. The average temperature in the summer months is around 90°F, while in the winter months it is around 60°F. The city receives an average of 51 inches of precipitation per year, with most of it falling in the summer months.
Demographics
As of the 2010 census, Daytona Beach Shores had a population of 4,039 people. The racial makeup of the city was 94.3% White, 2.2% African American, 0.3% Native American, 1.2% Asian, 0.1% Pacific Islander, 0.7% from other races, and 1.3% from two or more races. Hispanic or Latino of any race were 3.2% of the population.
Economy
Daytona Beach Shores is a popular tourist destination, with many hotels, restaurants, and attractions. The city is also home to several businesses, including a marina, a golf course, and a shopping center. The city's economy is largely driven by tourism, with many visitors coming to the area to enjoy the beaches and other attractions.
History
Daytona Beach Shores was first settled in the late 19th century by a group of settlers from the nearby town of Daytona Beach. The area was originally known as "Hollywood by the Sea" and was a popular destination for vacationers. In 1960, the area was incorporated as the City of Daytona Beach Shores. Since then, the city has grown and developed into a popular tourist destination.
Conclusion
Daytona Beach Shores is a city located in Volusia County, Florida, United States. It is situated on the Atlantic Ocean, just south of Daytona Beach. The city was incorporated in 1960 and has a population of approximately 4,000 people. Daytona Beach Shores has a humid subtropical climate, with hot, humid summers and mild winters. The city's economy is largely driven by tourism, with many visitors coming to the area to enjoy the beaches and other attractions. Daytona Beach Shores is a popular tourist destination, with many hotels, restaurants, and attractions. The city is also home to several businesses, including a marina, a golf course, and a shopping center.
Common Questions
What is Per Capita Income in Daytona Beach Shores?
Per Capita income in Daytona Beach Shores is $52,894.
What is the Median Family Income in Daytona Beach Shores?
Median Family Income in Daytona Beach Shores is $95,000.
What is the Median Household income in Daytona Beach Shores?
Median Household Income in Daytona Beach Shores is $65,334.
What is Income or Wage Gap in Daytona Beach Shores?
Income or Wage Gap in Daytona Beach Shores is 25.7%.
Women in Daytona Beach Shores earn 74.3 cents for every dollar earned by a man.
What is Family Income Deficit in Daytona Beach Shores?
Family Income Deficit in Daytona Beach Shores is $4,805.
Families that are below poverty line in Daytona Beach Shores earn $4,805 less on average than the poverty threshold level.
What is Inequality or Gini Index in Daytona Beach Shores?
Inequality or Gini Index in Daytona Beach Shores is 0.46.
What is the Total Population of Daytona Beach Shores?
Total Population of Daytona Beach Shores is 5,087.
What is the Total Male Population of Daytona Beach Shores?
Total Male Population of Daytona Beach Shores is 2,277.
What is the Total Female Population of Daytona Beach Shores?
Total Female Population of Daytona Beach Shores is 2,810.
What is the Ratio of Males per 100 Females in Daytona Beach Shores?
There are 81.03 Males per 100 Females in Daytona Beach Shores.
What is the Ratio of Females per 100 Males in Daytona Beach Shores?
There are 123.41 Females per 100 Males in Daytona Beach Shores.
What is the Median Population Age in Daytona Beach Shores?
Median Population Age in Daytona Beach Shores is 65.8 Years.
What is the Average Family Size in Daytona Beach Shores
Average Family Size in Daytona Beach Shores is 2.2 People.
What is the Average Household Size in Daytona Beach Shores
Average Household Size in Daytona Beach Shores is 1.6 People.
How Large is the Labor Force in Daytona Beach Shores?
There are 1,579 People in the Labor Forcein in Daytona Beach Shores.
What is the Percentage of People in the Labor Force in Daytona Beach Shores?
32.0% of People are in the Labor Force in Daytona Beach Shores.
What is the Unemployment Rate in Daytona Beach Shores?
Unemployment Rate in Daytona Beach Shores is 4.9%.