Zip Codes with the Highest Percentage of Population Employed in Architecture & Engineering in Davenport, FL
RELATED REPORTS & OPTIONS
Architecture & Engineering
Davenport
Compare Zip Codes
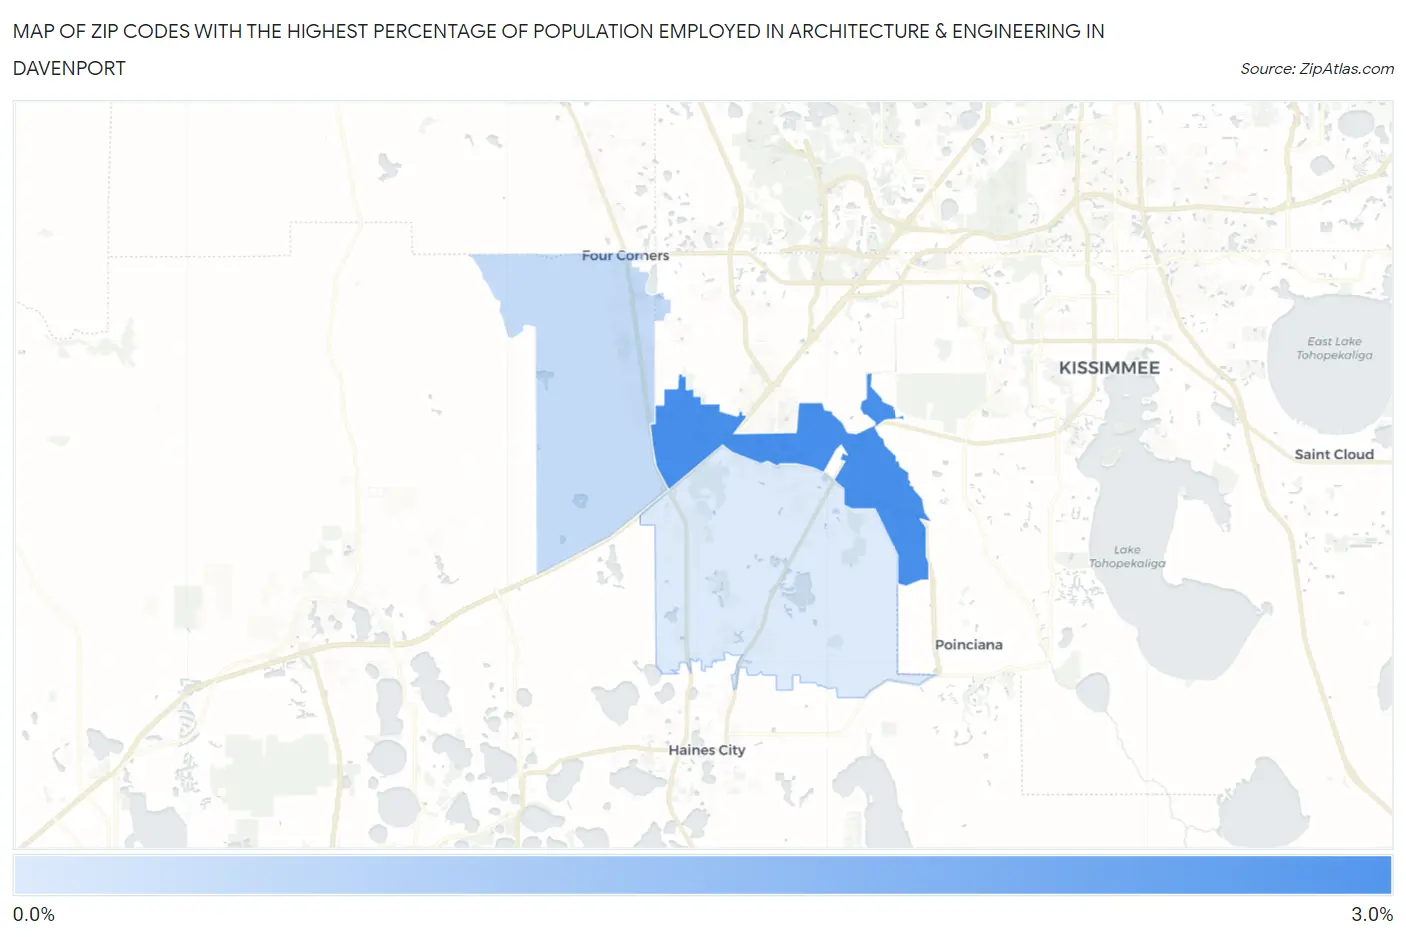
Map of Zip Codes with the Highest Percentage of Population Employed in Architecture & Engineering in Davenport
0.71%
2.6%
Zip Codes with the Highest Percentage of Population Employed in Architecture & Engineering in Davenport, FL
| Zip Code | % Employed | vs State | vs National | |
| 1. | 33896 | 2.6% | 1.6%(+1.03)#139 | 2.1%(+0.477)#6,465 |
| 2. | 33897 | 1.0% | 1.6%(-0.558)#563 | 2.1%(-1.11)#16,309 |
| 3. | 33837 | 0.71% | 1.6%(-0.892)#687 | 2.1%(-1.44)#18,842 |
1
Common Questions
What are the Top Zip Codes with the Highest Percentage of Population Employed in Architecture & Engineering in Davenport, FL?
Top Zip Codes with the Highest Percentage of Population Employed in Architecture & Engineering in Davenport, FL are:
What zip code has the Highest Percentage of Population Employed in Architecture & Engineering in Davenport, FL?
33896 has the Highest Percentage of Population Employed in Architecture & Engineering in Davenport, FL with 2.6%.
What is the Percentage of Population Employed in Architecture & Engineering in Davenport, FL?
Percentage of Population Employed in Architecture & Engineering in Davenport is 1.1%.
What is the Percentage of Population Employed in Architecture & Engineering in Florida?
Percentage of Population Employed in Architecture & Engineering in Florida is 1.6%.
What is the Percentage of Population Employed in Architecture & Engineering in the United States?
Percentage of Population Employed in Architecture & Engineering in the United States is 2.1%.