Bay Pines, FL Map & Demographics
Bay Pines Map
Bay Pines Overview
$44,885
PER CAPITA INCOME
$94,063
AVG FAMILY INCOME
$71,635
AVG HOUSEHOLD INCOME
15.0%
WAGE / INCOME GAP [ % ]
85.0¢/ $1
WAGE / INCOME GAP [ $ ]
0.37
INEQUALITY / GINI INDEX
2,717
TOTAL POPULATION
1,385
MALE POPULATION
1,332
FEMALE POPULATION
103.98
MALES / 100 FEMALES
96.17
FEMALES / 100 MALES
59.5
MEDIAN AGE
2.7
AVG FAMILY SIZE
2.1
AVG HOUSEHOLD SIZE
1,191
LABOR FORCE [ PEOPLE ]
49.7%
PERCENT IN LABOR FORCE
0.8%
UNEMPLOYMENT RATE
Bay Pines Zip Codes
Bay Pines Area Codes
Income in Bay Pines
Income Overview in Bay Pines
Per Capita Income in Bay Pines is $44,885, while median incomes of families and households are $94,063 and $71,635 respectively.
| Characteristic | Number | Measure |
| Per Capita Income | 2,717 | $44,885 |
| Median Family Income | 694 | $94,063 |
| Mean Family Income | 694 | $101,755 |
| Median Household Income | 1,274 | $71,635 |
| Mean Household Income | 1,274 | $92,170 |
| Income Deficit | 694 | $0 |
| Wage / Income Gap (%) | 2,717 | 15.02% |
| Wage / Income Gap ($) | 2,717 | 84.98¢ per $1 |
| Gini / Inequality Index | 2,717 | 0.37 |
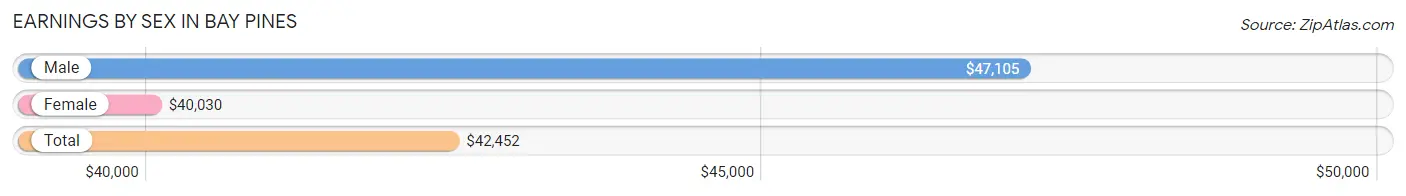
Earnings by Sex in Bay Pines
Average Earnings in Bay Pines are $42,452, $47,105 for men and $40,030 for women, a difference of 15.0%.
| Sex | Number | Average Earnings |
| Male | 624 (50.1%) | $47,105 |
| Female | 621 (49.9%) | $40,030 |
| Total | 1,245 (100.0%) | $42,452 |
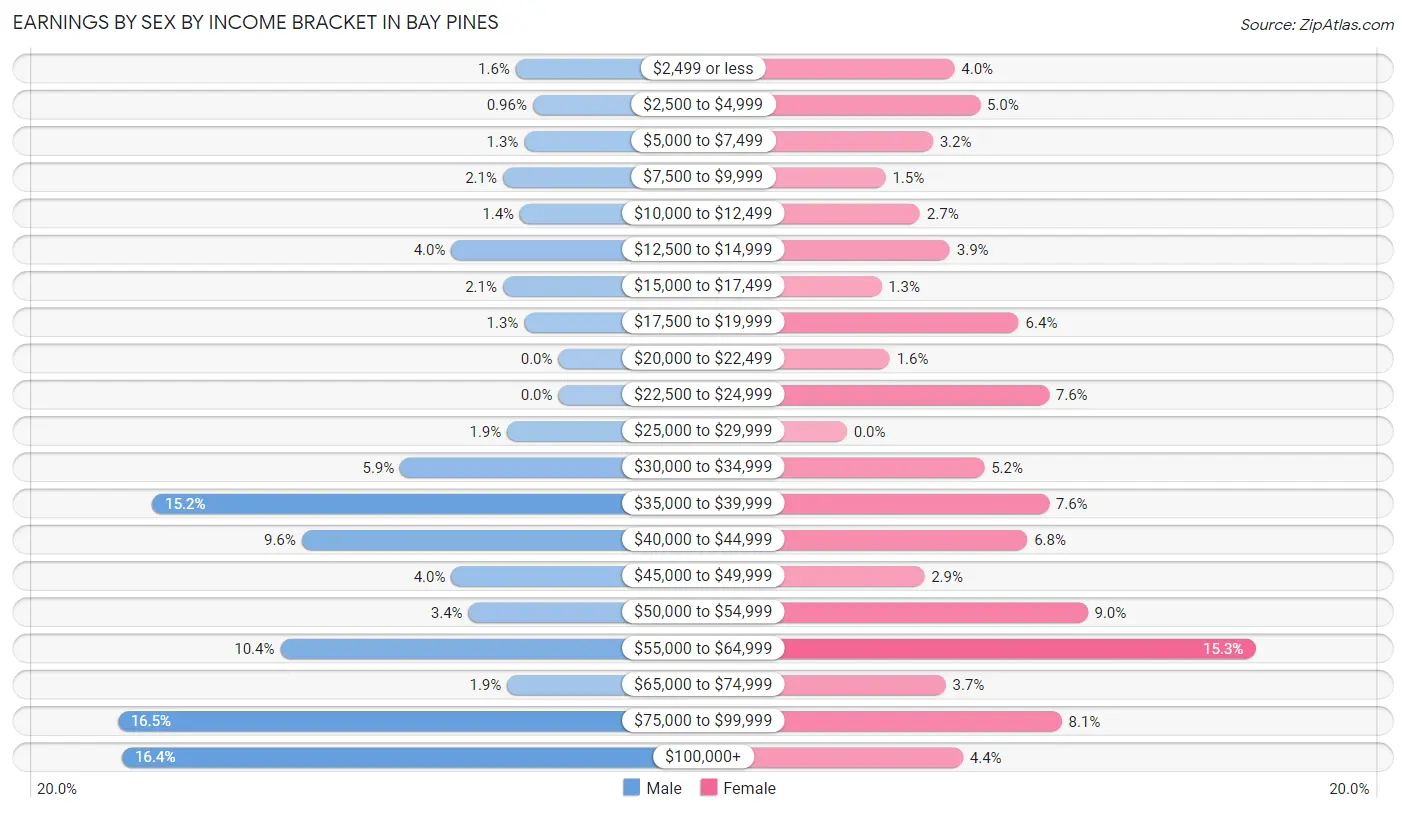
Earnings by Sex by Income Bracket in Bay Pines
The most common earnings brackets in Bay Pines are $75,000 to $99,999 for men (103 | 16.5%) and $55,000 to $64,999 for women (95 | 15.3%).
| Income | Male | Female |
| $2,499 or less | 10 (1.6%) | 25 (4.0%) |
| $2,500 to $4,999 | 6 (1.0%) | 31 (5.0%) |
| $5,000 to $7,499 | 8 (1.3%) | 20 (3.2%) |
| $7,500 to $9,999 | 13 (2.1%) | 9 (1.5%) |
| $10,000 to $12,499 | 9 (1.4%) | 17 (2.7%) |
| $12,500 to $14,999 | 25 (4.0%) | 24 (3.9%) |
| $15,000 to $17,499 | 13 (2.1%) | 8 (1.3%) |
| $17,500 to $19,999 | 8 (1.3%) | 40 (6.4%) |
| $20,000 to $22,499 | 0 (0.0%) | 10 (1.6%) |
| $22,500 to $24,999 | 0 (0.0%) | 47 (7.6%) |
| $25,000 to $29,999 | 12 (1.9%) | 0 (0.0%) |
| $30,000 to $34,999 | 37 (5.9%) | 32 (5.1%) |
| $35,000 to $39,999 | 95 (15.2%) | 47 (7.6%) |
| $40,000 to $44,999 | 60 (9.6%) | 42 (6.8%) |
| $45,000 to $49,999 | 25 (4.0%) | 18 (2.9%) |
| $50,000 to $54,999 | 21 (3.4%) | 56 (9.0%) |
| $55,000 to $64,999 | 65 (10.4%) | 95 (15.3%) |
| $65,000 to $74,999 | 12 (1.9%) | 23 (3.7%) |
| $75,000 to $99,999 | 103 (16.5%) | 50 (8.1%) |
| $100,000+ | 102 (16.4%) | 27 (4.3%) |
| Total | 624 (100.0%) | 621 (100.0%) |
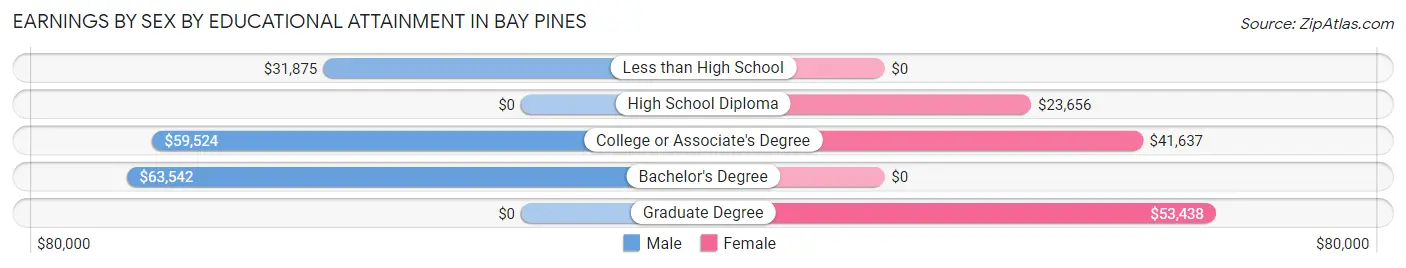
Earnings by Sex by Educational Attainment in Bay Pines
Average earnings in Bay Pines are $53,631 for men and $41,131 for women, a difference of 23.3%. Men with an educational attainment of bachelor's degree enjoy the highest average annual earnings of $63,542, while those with less than high school education earn the least with $31,875. Women with an educational attainment of graduate degree earn the most with the average annual earnings of $53,438, while those with high school diploma education have the smallest earnings of $23,656.
| Educational Attainment | Male Income | Female Income |
| Less than High School | $31,875 | $0 |
| High School Diploma | - | - |
| College or Associate's Degree | $59,524 | $41,637 |
| Bachelor's Degree | $63,542 | $0 |
| Graduate Degree | - | - |
| Total | $53,631 | $41,131 |
Family Income in Bay Pines
Family Income Brackets in Bay Pines
According to the Bay Pines family income data, there are 188 families falling into the $100,000 to $149,999 income range, which is the most common income bracket and makes up 27.1% of all families.
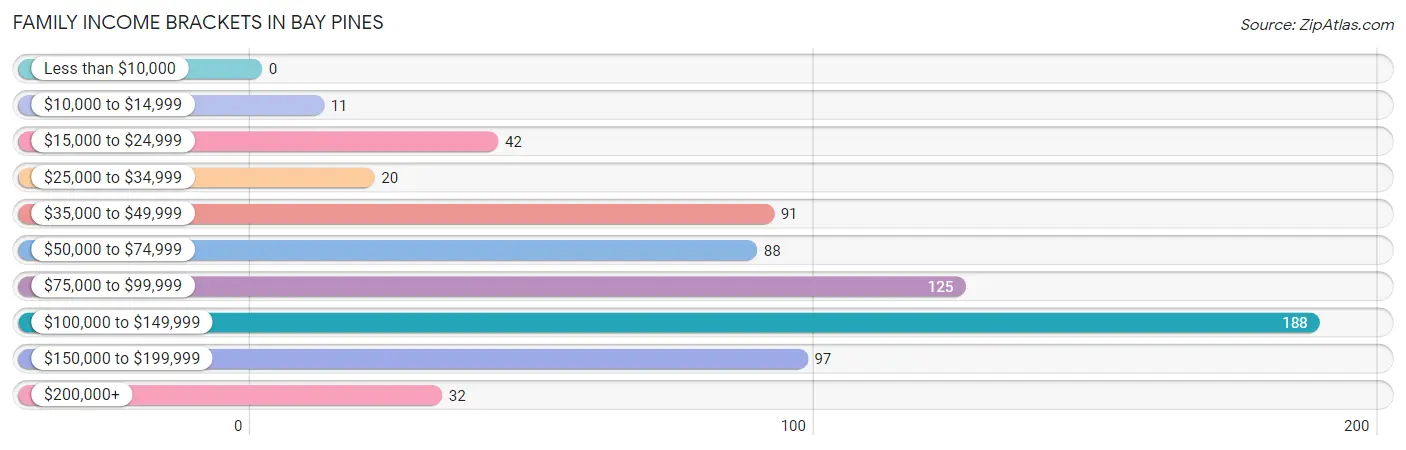
| Income Bracket | # Families | % Families |
| Less than $10,000 | 0 | 0.0% |
| $10,000 to $14,999 | 11 | 1.6% |
| $15,000 to $24,999 | 42 | 6.1% |
| $25,000 to $34,999 | 20 | 2.9% |
| $35,000 to $49,999 | 91 | 13.1% |
| $50,000 to $74,999 | 88 | 12.7% |
| $75,000 to $99,999 | 125 | 18.0% |
| $100,000 to $149,999 | 188 | 27.1% |
| $150,000 to $199,999 | 97 | 14.0% |
| $200,000+ | 32 | 4.6% |
Family Income by Famaliy Size in Bay Pines
4-person families (52 | 7.5%) account for the highest median family income in Bay Pines with $145,000 per family, while 2-person families (459 | 66.1%) have the highest median income of $42,768 per family member.
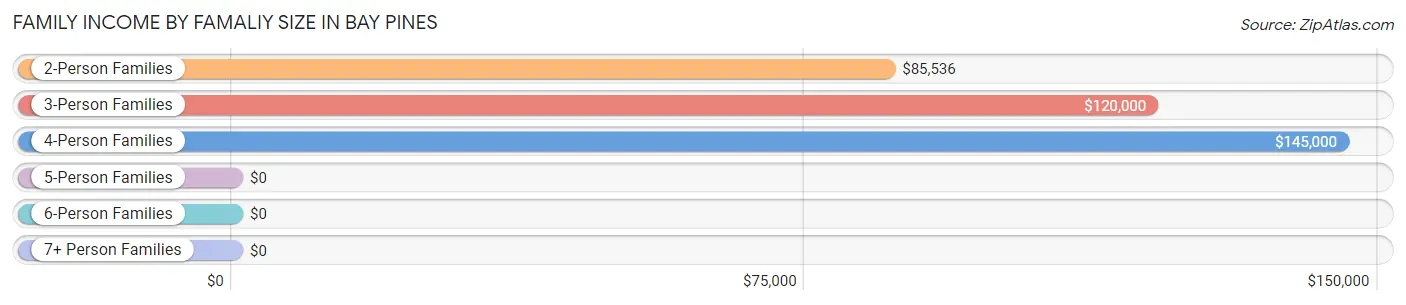
| Income Bracket | # Families | Median Income |
| 2-Person Families | 459 (66.1%) | $85,536 |
| 3-Person Families | 140 (20.2%) | $120,000 |
| 4-Person Families | 52 (7.5%) | $145,000 |
| 5-Person Families | 20 (2.9%) | $0 |
| 6-Person Families | 0 (0.0%) | $0 |
| 7+ Person Families | 23 (3.3%) | $0 |
| Total | 694 (100.0%) | $94,063 |
Family Income by Number of Earners in Bay Pines
The median family income in Bay Pines is $94,063, with families comprising 3+ earners (41) having the highest median family income of $162,772, while families with no earners (173) have the lowest median family income of $55,104, accounting for 5.9% and 24.9% of families, respectively.
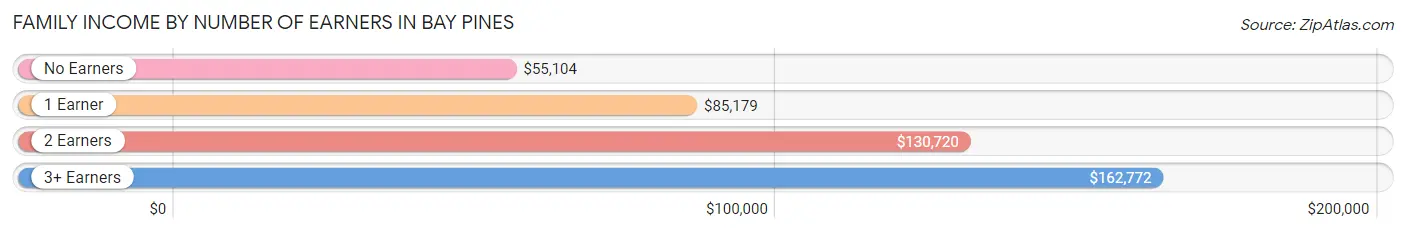
| Number of Earners | # Families | Median Income |
| No Earners | 173 (24.9%) | $55,104 |
| 1 Earner | 191 (27.5%) | $85,179 |
| 2 Earners | 289 (41.6%) | $130,720 |
| 3+ Earners | 41 (5.9%) | $162,772 |
| Total | 694 (100.0%) | $94,063 |
Household Income in Bay Pines
Household Income Brackets in Bay Pines
With 299 households falling in the category, the $50,000 to $74,999 income range is the most frequent in Bay Pines, accounting for 23.5% of all households. In contrast, only 17 households (1.3%) fall into the $10,000 to $14,999 income bracket, making it the least populous group.
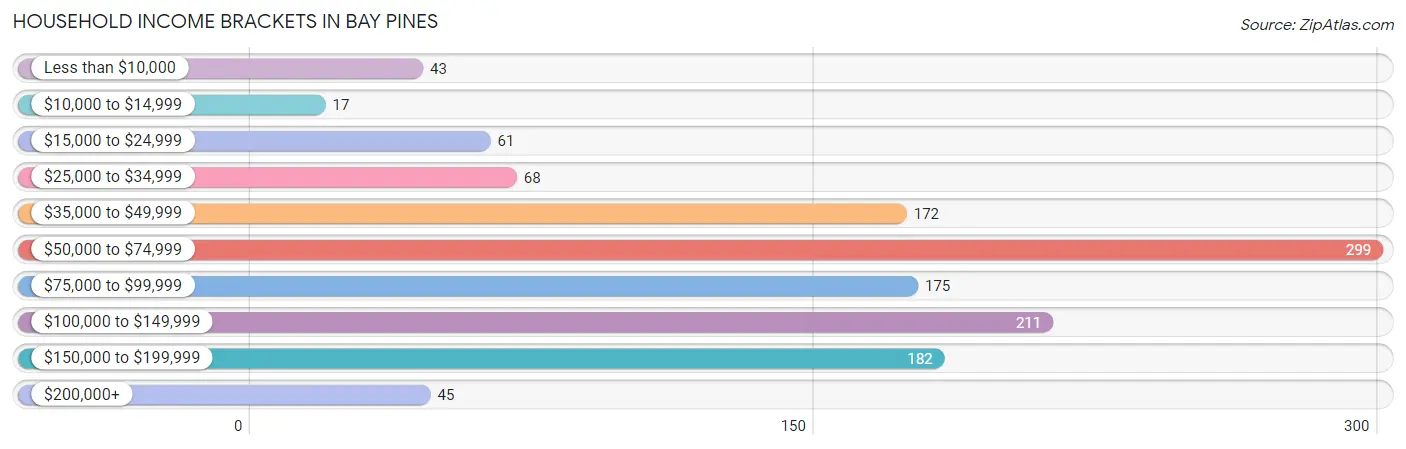
| Income Bracket | # Households | % Households |
| Less than $10,000 | 43 | 3.4% |
| $10,000 to $14,999 | 17 | 1.3% |
| $15,000 to $24,999 | 61 | 4.8% |
| $25,000 to $34,999 | 68 | 5.3% |
| $35,000 to $49,999 | 172 | 13.5% |
| $50,000 to $74,999 | 299 | 23.5% |
| $75,000 to $99,999 | 175 | 13.7% |
| $100,000 to $149,999 | 211 | 16.6% |
| $150,000 to $199,999 | 182 | 14.3% |
| $200,000+ | 45 | 3.5% |
Household Income by Householder Age in Bay Pines
The median household income in Bay Pines is $71,635, with the highest median household income of $108,409 found in the 25 to 44 years age bracket for the primary householder. A total of 142 households (11.2%) fall into this category.
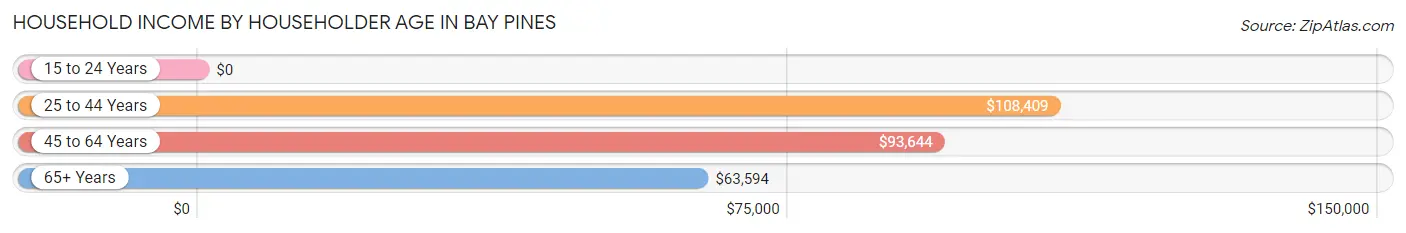
| Income Bracket | # Households | Median Income |
| 15 to 24 Years | 0 (0.0%) | $0 |
| 25 to 44 Years | 142 (11.2%) | $108,409 |
| 45 to 64 Years | 497 (39.0%) | $93,644 |
| 65+ Years | 635 (49.8%) | $63,594 |
| Total | 1,274 (100.0%) | $71,635 |
Poverty in Bay Pines
Income Below Poverty by Sex and Age in Bay Pines
With 4.2% poverty level for males and 13.6% for females among the residents of Bay Pines, 6 to 11 year old males and under 5 year old females are the most vulnerable to poverty, with 14 males (11.6%) and 18 females (100.0%) in their respective age groups living below the poverty level.
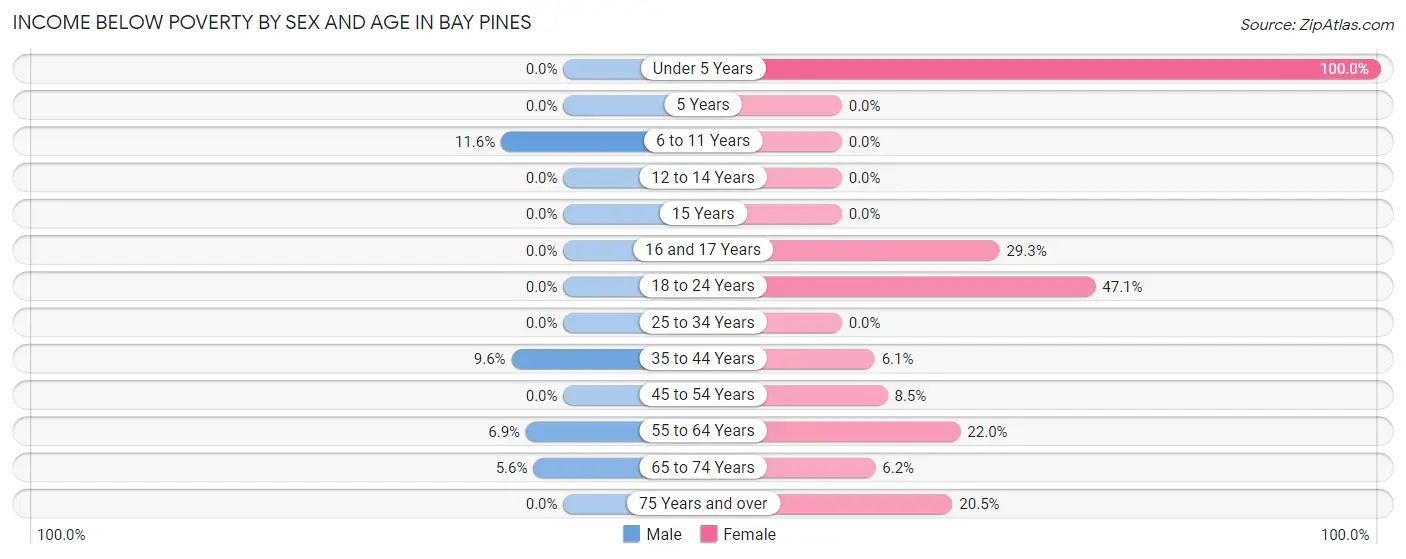
| Age Bracket | Male | Female |
| Under 5 Years | 0 (0.0%) | 18 (100.0%) |
| 5 Years | 0 (0.0%) | 0 (0.0%) |
| 6 to 11 Years | 14 (11.6%) | 0 (0.0%) |
| 12 to 14 Years | 0 (0.0%) | 0 (0.0%) |
| 15 Years | 0 (0.0%) | 0 (0.0%) |
| 16 and 17 Years | 0 (0.0%) | 12 (29.3%) |
| 18 to 24 Years | 0 (0.0%) | 8 (47.1%) |
| 25 to 34 Years | 0 (0.0%) | 0 (0.0%) |
| 35 to 44 Years | 13 (9.6%) | 8 (6.1%) |
| 45 to 54 Years | 0 (0.0%) | 18 (8.5%) |
| 55 to 64 Years | 17 (6.9%) | 61 (22.0%) |
| 65 to 74 Years | 11 (5.6%) | 17 (6.2%) |
| 75 Years and over | 0 (0.0%) | 39 (20.5%) |
| Total | 55 (4.2%) | 181 (13.6%) |
Income Above Poverty by Sex and Age in Bay Pines
According to the poverty statistics in Bay Pines, males aged under 5 years and females aged 6 to 11 years are the age groups that are most secure financially, with 100.0% of males and 100.0% of females in these age groups living above the poverty line.
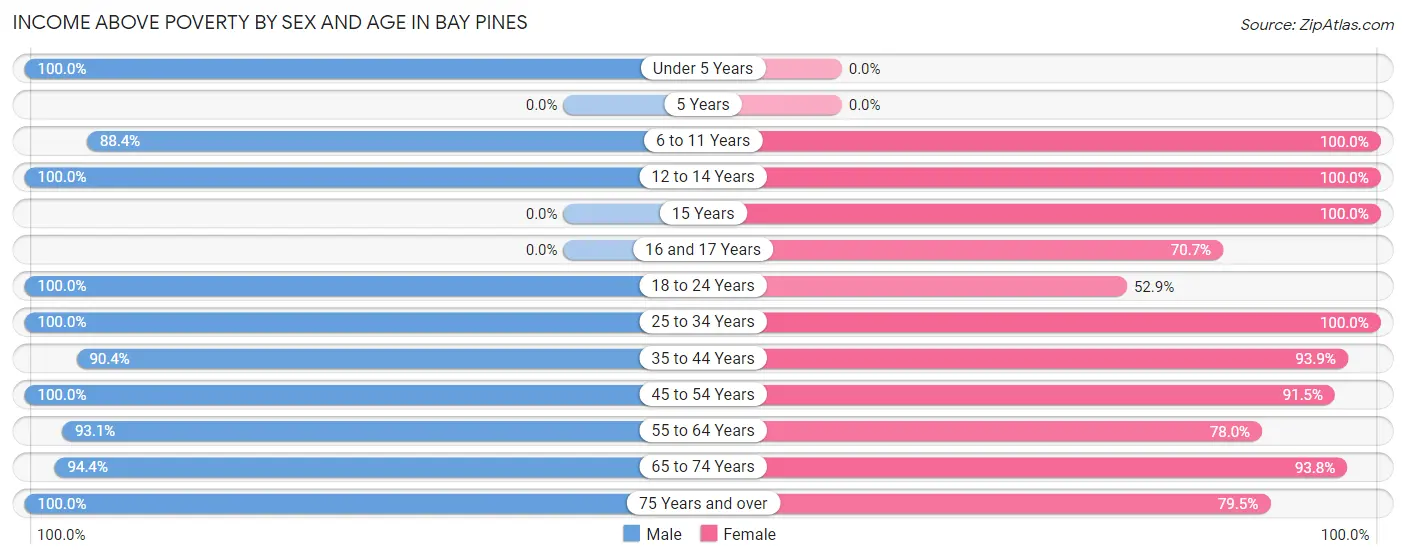
| Age Bracket | Male | Female |
| Under 5 Years | 40 (100.0%) | 0 (0.0%) |
| 5 Years | 0 (0.0%) | 0 (0.0%) |
| 6 to 11 Years | 107 (88.4%) | 44 (100.0%) |
| 12 to 14 Years | 22 (100.0%) | 45 (100.0%) |
| 15 Years | 0 (0.0%) | 13 (100.0%) |
| 16 and 17 Years | 0 (0.0%) | 29 (70.7%) |
| 18 to 24 Years | 53 (100.0%) | 9 (52.9%) |
| 25 to 34 Years | 71 (100.0%) | 66 (100.0%) |
| 35 to 44 Years | 122 (90.4%) | 123 (93.9%) |
| 45 to 54 Years | 167 (100.0%) | 194 (91.5%) |
| 55 to 64 Years | 228 (93.1%) | 216 (78.0%) |
| 65 to 74 Years | 186 (94.4%) | 256 (93.8%) |
| 75 Years and over | 250 (100.0%) | 151 (79.5%) |
| Total | 1,246 (95.8%) | 1,146 (86.4%) |
Income Below Poverty Among Married-Couple Families in Bay Pines
The poverty statistics for married-couple families in Bay Pines show that 4.6% or 27 of the total 587 families live below the poverty line. Families with 3 or 4 children have the highest poverty rate of 18.6%, comprising of 8 families. On the other hand, families with 1 or 2 children have the lowest poverty rate of 0.0%, which includes 0 families.
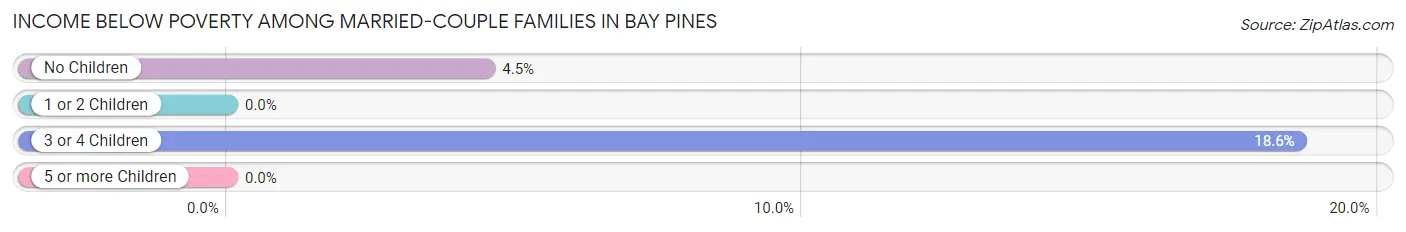
| Children | Above Poverty | Below Poverty |
| No Children | 405 (95.5%) | 19 (4.5%) |
| 1 or 2 Children | 120 (100.0%) | 0 (0.0%) |
| 3 or 4 Children | 35 (81.4%) | 8 (18.6%) |
| 5 or more Children | 0 (0.0%) | 0 (0.0%) |
| Total | 560 (95.4%) | 27 (4.6%) |
Income Below Poverty Among Single-Parent Households in Bay Pines
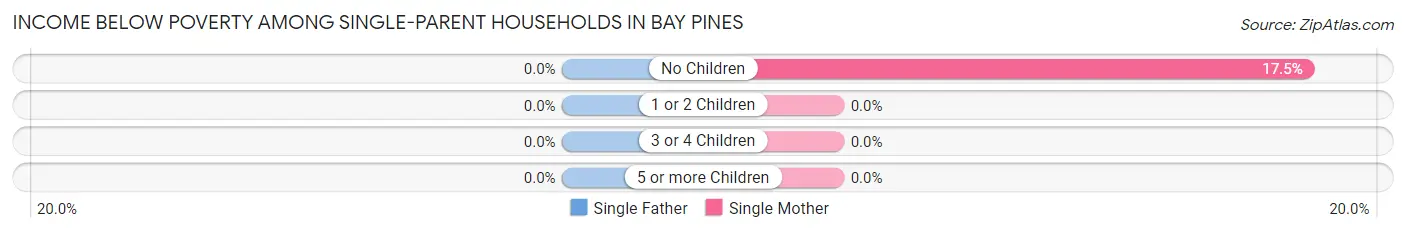
| Children | Single Father | Single Mother |
| No Children | 0 (0.0%) | 10 (17.5%) |
| 1 or 2 Children | 0 (0.0%) | 0 (0.0%) |
| 3 or 4 Children | 0 (0.0%) | 0 (0.0%) |
| 5 or more Children | 0 (0.0%) | 0 (0.0%) |
| Total | 0 (0.0%) | 10 (17.5%) |
Income Below Poverty Among Married-Couple vs Single-Parent Households in Bay Pines
The poverty data for Bay Pines shows that 27 of the married-couple family households (4.6%) and 10 of the single-parent households (9.3%) are living below the poverty level. Within the married-couple family households, those with 3 or 4 children have the highest poverty rate, with 8 households (18.6%) falling below the poverty line. Among the single-parent households, those with no children have the highest poverty rate, with 10 household (12.0%) living below poverty.
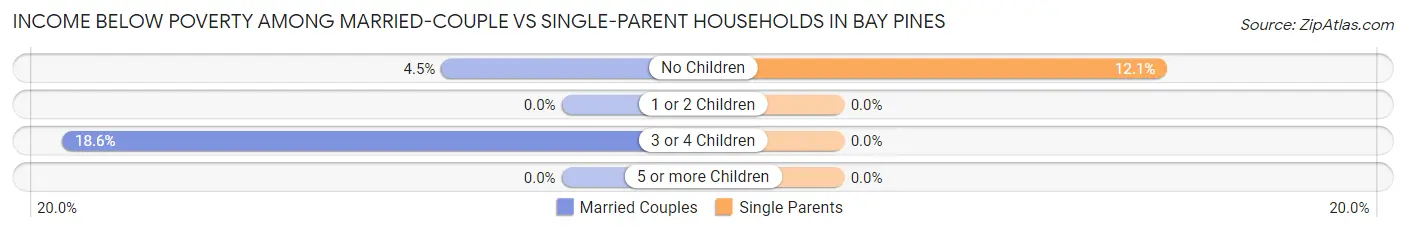
| Children | Married-Couple Families | Single-Parent Households |
| No Children | 19 (4.5%) | 10 (12.0%) |
| 1 or 2 Children | 0 (0.0%) | 0 (0.0%) |
| 3 or 4 Children | 8 (18.6%) | 0 (0.0%) |
| 5 or more Children | 0 (0.0%) | 0 (0.0%) |
| Total | 27 (4.6%) | 10 (9.3%) |
Race in Bay Pines
The most populous races in Bay Pines are White / Caucasian (2,341 | 86.2%), Two or more Races (218 | 8.0%), and Black / African American (135 | 5.0%).
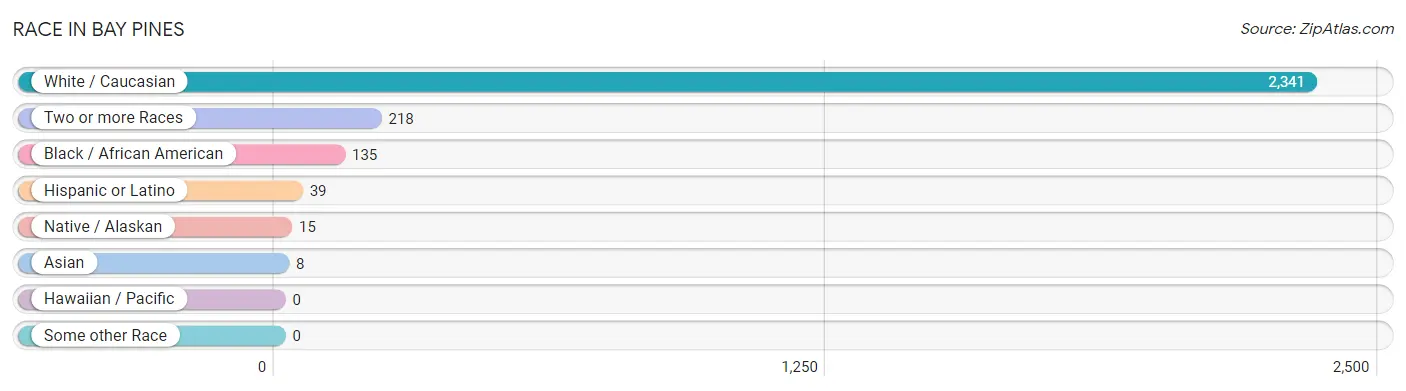
| Race | # Population | % Population |
| Asian | 8 | 0.3% |
| Black / African American | 135 | 5.0% |
| Hawaiian / Pacific | 0 | 0.0% |
| Hispanic or Latino | 39 | 1.4% |
| Native / Alaskan | 15 | 0.5% |
| White / Caucasian | 2,341 | 86.2% |
| Two or more Races | 218 | 8.0% |
| Some other Race | 0 | 0.0% |
| Total | 2,717 | 100.0% |
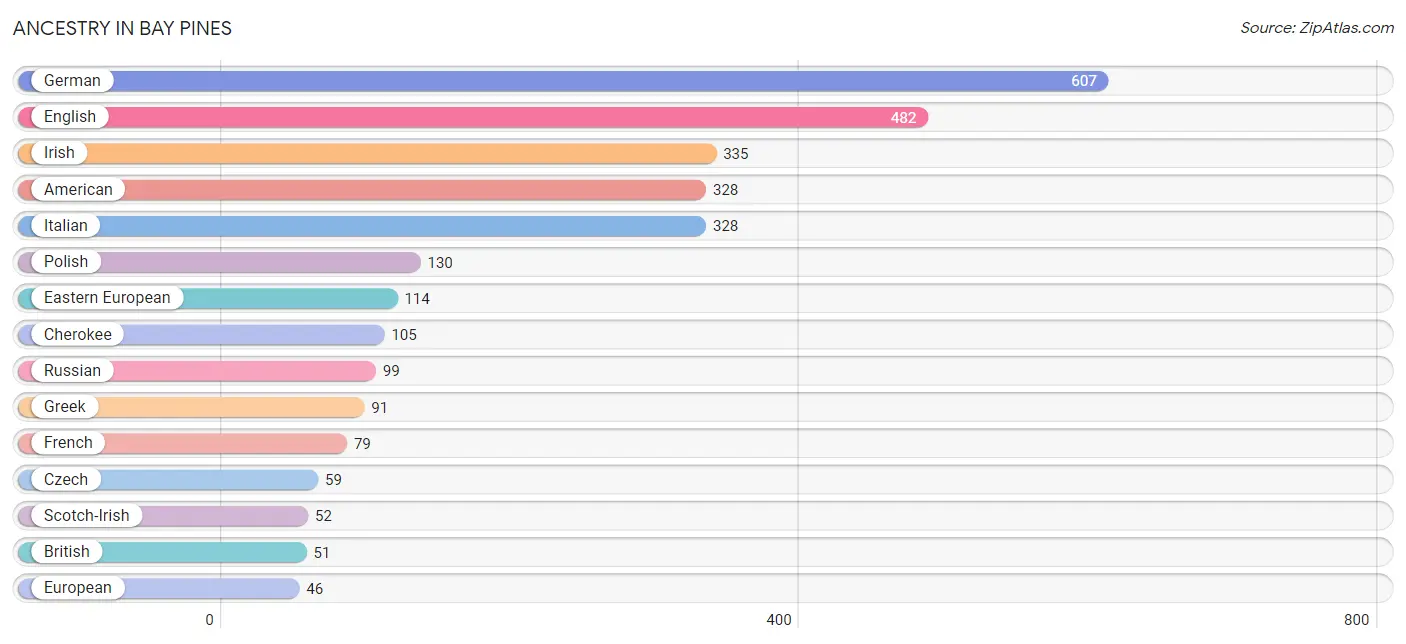
Ancestry in Bay Pines
The most populous ancestries reported in Bay Pines are German (607 | 22.3%), English (482 | 17.7%), Irish (335 | 12.3%), American (328 | 12.1%), and Italian (328 | 12.1%), together accounting for 76.6% of all Bay Pines residents.
| Ancestry | # Population | % Population |
| American | 328 | 12.1% |
| Blackfeet | 24 | 0.9% |
| Brazilian | 10 | 0.4% |
| British | 51 | 1.9% |
| Canadian | 23 | 0.9% |
| Cape Verdean | 25 | 0.9% |
| Cherokee | 105 | 3.9% |
| Creek | 11 | 0.4% |
| Cuban | 8 | 0.3% |
| Czech | 59 | 2.2% |
| Czechoslovakian | 9 | 0.3% |
| Dutch | 39 | 1.4% |
| Eastern European | 114 | 4.2% |
| English | 482 | 17.7% |
| European | 46 | 1.7% |
| French | 79 | 2.9% |
| French Canadian | 8 | 0.3% |
| German | 607 | 22.3% |
| Greek | 91 | 3.4% |
| Hungarian | 36 | 1.3% |
| Indian (Asian) | 37 | 1.4% |
| Irish | 335 | 12.3% |
| Iroquois | 15 | 0.5% |
| Italian | 328 | 12.1% |
| Jamaican | 29 | 1.1% |
| Norwegian | 46 | 1.7% |
| Pennsylvania German | 6 | 0.2% |
| Peruvian | 31 | 1.1% |
| Polish | 130 | 4.8% |
| Portuguese | 7 | 0.3% |
| Russian | 99 | 3.6% |
| Scandinavian | 16 | 0.6% |
| Scotch-Irish | 52 | 1.9% |
| Scottish | 37 | 1.4% |
| South American | 31 | 1.1% |
| Subsaharan African | 25 | 0.9% |
| Swedish | 15 | 0.5% |
| Welsh | 7 | 0.3% | View All 38 Rows |
Immigrants in Bay Pines
The most numerous immigrant groups reported in Bay Pines came from Europe (105 | 3.9%), Eastern Europe (64 | 2.4%), Russia (48 | 1.8%), England (41 | 1.5%), and Northern Europe (41 | 1.5%), together accounting for 11.0% of all Bay Pines residents.
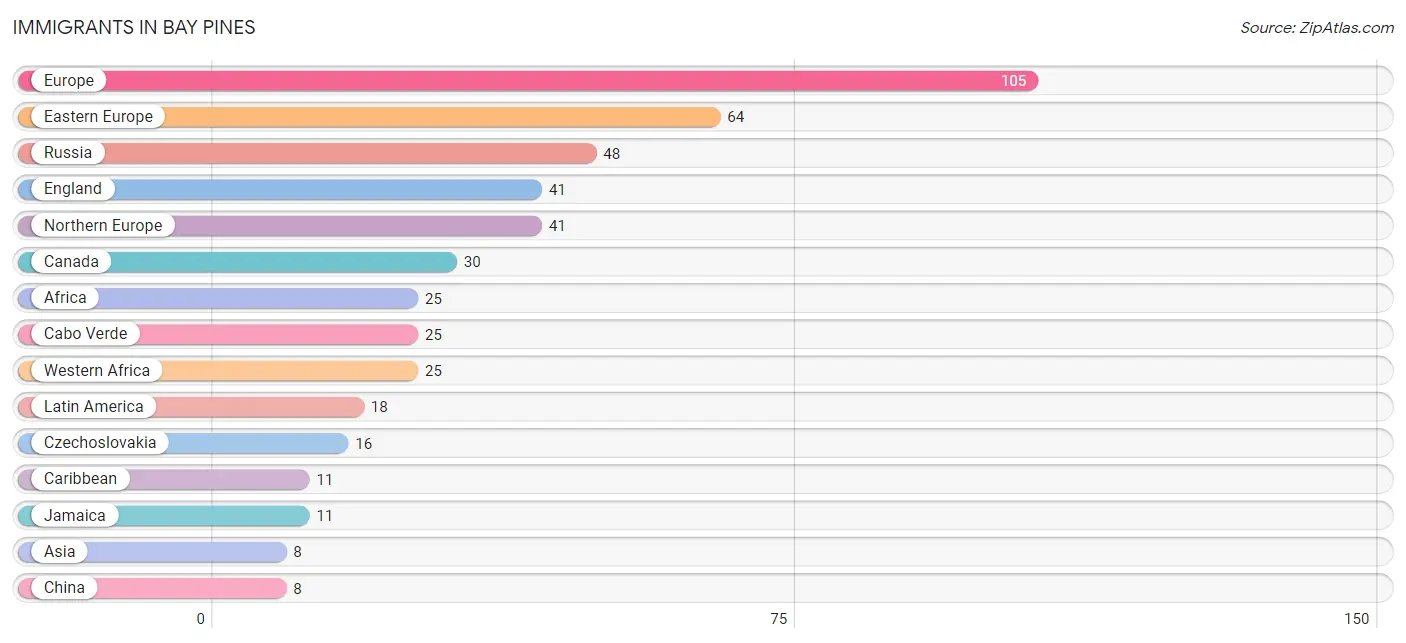
| Immigration Origin | # Population | % Population |
| Africa | 25 | 0.9% |
| Asia | 8 | 0.3% |
| Brazil | 7 | 0.3% |
| Cabo Verde | 25 | 0.9% |
| Canada | 30 | 1.1% |
| Caribbean | 11 | 0.4% |
| China | 8 | 0.3% |
| Czechoslovakia | 16 | 0.6% |
| Eastern Asia | 8 | 0.3% |
| Eastern Europe | 64 | 2.4% |
| England | 41 | 1.5% |
| Europe | 105 | 3.9% |
| Jamaica | 11 | 0.4% |
| Latin America | 18 | 0.7% |
| Northern Europe | 41 | 1.5% |
| Russia | 48 | 1.8% |
| South America | 7 | 0.3% |
| Western Africa | 25 | 0.9% | View All 18 Rows |
Sex and Age in Bay Pines
Sex and Age in Bay Pines
The most populous age groups in Bay Pines are 60 to 64 Years (182 | 13.1%) for men and 60 to 64 Years (187 | 14.0%) for women.
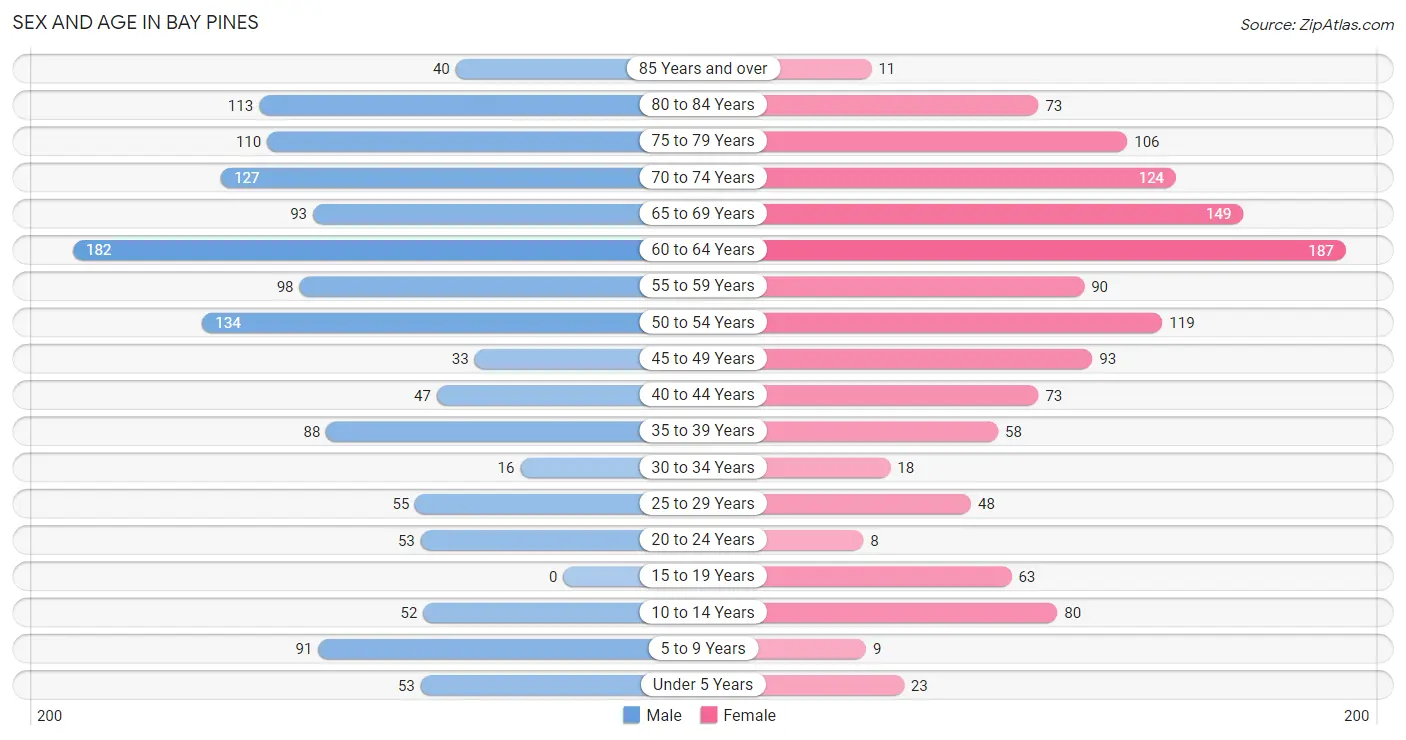
| Age Bracket | Male | Female |
| Under 5 Years | 53 (3.8%) | 23 (1.7%) |
| 5 to 9 Years | 91 (6.6%) | 9 (0.7%) |
| 10 to 14 Years | 52 (3.7%) | 80 (6.0%) |
| 15 to 19 Years | 0 (0.0%) | 63 (4.7%) |
| 20 to 24 Years | 53 (3.8%) | 8 (0.6%) |
| 25 to 29 Years | 55 (4.0%) | 48 (3.6%) |
| 30 to 34 Years | 16 (1.2%) | 18 (1.3%) |
| 35 to 39 Years | 88 (6.4%) | 58 (4.3%) |
| 40 to 44 Years | 47 (3.4%) | 73 (5.5%) |
| 45 to 49 Years | 33 (2.4%) | 93 (7.0%) |
| 50 to 54 Years | 134 (9.7%) | 119 (8.9%) |
| 55 to 59 Years | 98 (7.1%) | 90 (6.8%) |
| 60 to 64 Years | 182 (13.1%) | 187 (14.0%) |
| 65 to 69 Years | 93 (6.7%) | 149 (11.2%) |
| 70 to 74 Years | 127 (9.2%) | 124 (9.3%) |
| 75 to 79 Years | 110 (7.9%) | 106 (8.0%) |
| 80 to 84 Years | 113 (8.2%) | 73 (5.5%) |
| 85 Years and over | 40 (2.9%) | 11 (0.8%) |
| Total | 1,385 (100.0%) | 1,332 (100.0%) |
Families and Households in Bay Pines
Median Family Size in Bay Pines
The median family size in Bay Pines is 2.73 persons per family, with single female/mother families (57 | 8.2%) accounting for the largest median family size of 2.79 persons per family. On the other hand, single male/father families (50 | 7.2%) represent the smallest median family size with 2.72 persons per family.
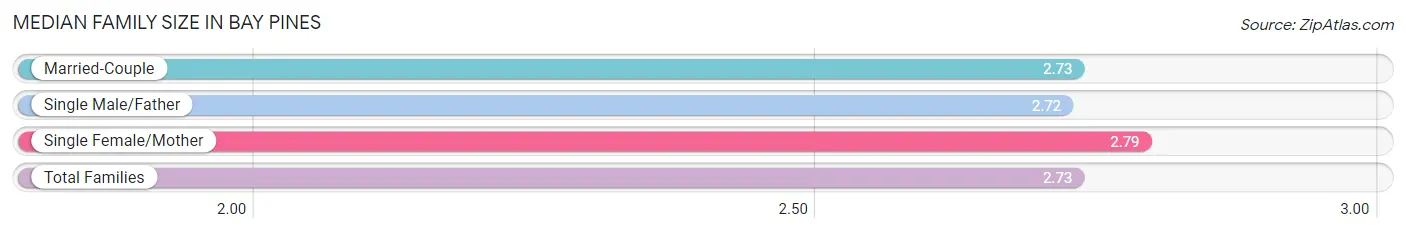
| Family Type | # Families | Family Size |
| Married-Couple | 587 (84.6%) | 2.73 |
| Single Male/Father | 50 (7.2%) | 2.72 |
| Single Female/Mother | 57 (8.2%) | 2.79 |
| Total Families | 694 (100.0%) | 2.73 |
Median Household Size in Bay Pines
The median household size in Bay Pines is 2.08 persons per household, with single female/mother households (57 | 4.5%) accounting for the largest median household size of 2.79 persons per household. non-family households (580 | 45.5%) represent the smallest median household size with 1.27 persons per household.
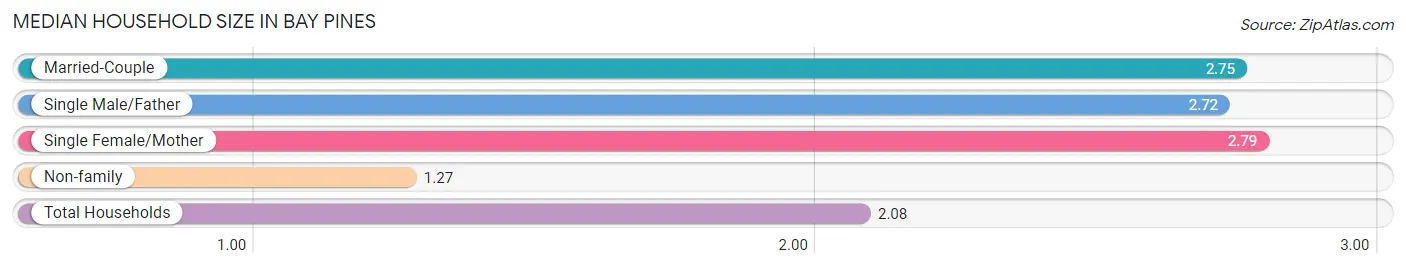
| Household Type | # Households | Household Size |
| Married-Couple | 587 (46.1%) | 2.75 |
| Single Male/Father | 50 (3.9%) | 2.72 |
| Single Female/Mother | 57 (4.5%) | 2.79 |
| Non-family | 580 (45.5%) | 1.27 |
| Total Households | 1,274 (100.0%) | 2.08 |
Household Size by Marriage Status in Bay Pines
Out of a total of 1,274 households in Bay Pines, 694 (54.5%) are family households, while 580 (45.5%) are nonfamily households. The most numerous type of family households are 2-person households, comprising 459, and the most common type of nonfamily households are 1-person households, comprising 498.
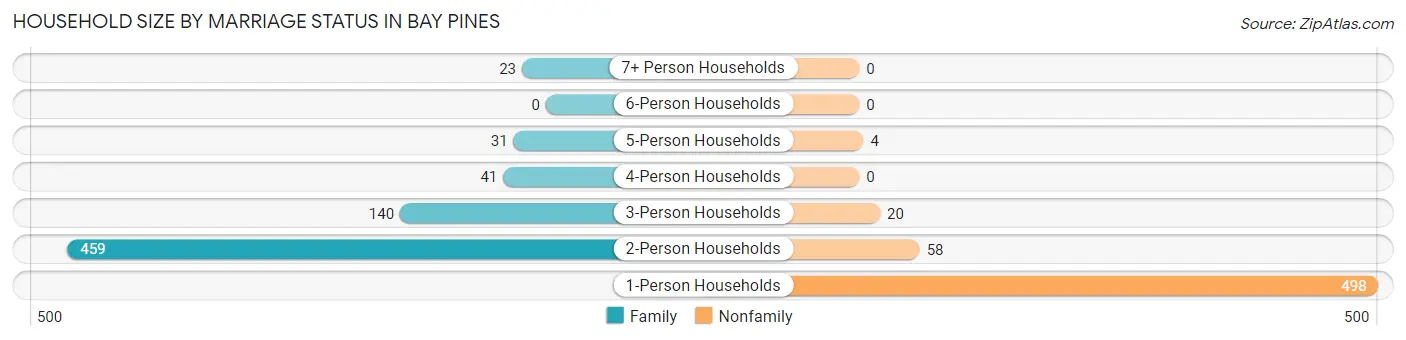
| Household Size | Family Households | Nonfamily Households |
| 1-Person Households | - | 498 (39.1%) |
| 2-Person Households | 459 (36.0%) | 58 (4.5%) |
| 3-Person Households | 140 (11.0%) | 20 (1.6%) |
| 4-Person Households | 41 (3.2%) | 0 (0.0%) |
| 5-Person Households | 31 (2.4%) | 4 (0.3%) |
| 6-Person Households | 0 (0.0%) | 0 (0.0%) |
| 7+ Person Households | 23 (1.8%) | 0 (0.0%) |
| Total | 694 (54.5%) | 580 (45.5%) |
Female Fertility in Bay Pines
Fertility by Age in Bay Pines
Average fertility rate in Bay Pines is 62.0 births per 1,000 women. Women in the age bracket of 20 to 34 years have the highest fertility rate with 108.0 births per 1,000 women. Women in the age bracket of 35 to 50 years acount for 65.2% of all women with births.
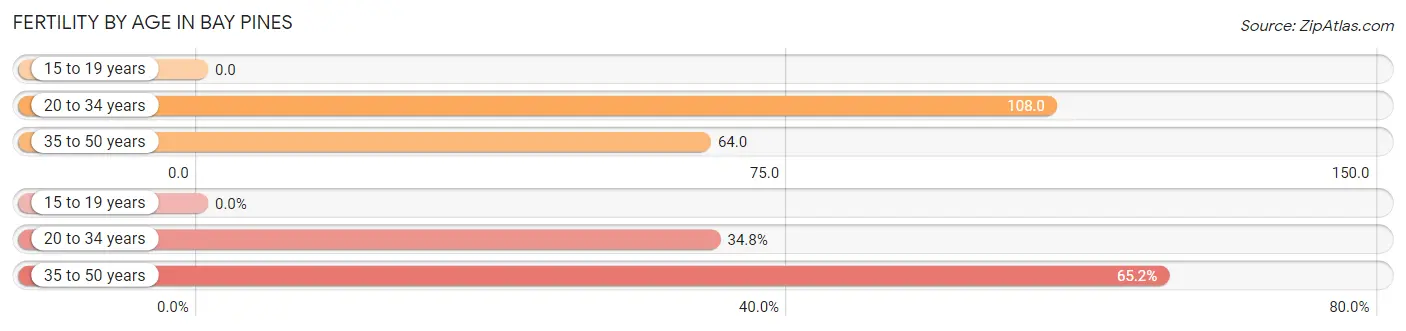
| Age Bracket | Women with Births | Births / 1,000 Women |
| 15 to 19 years | 0 (0.0%) | 0.0 |
| 20 to 34 years | 8 (34.8%) | 108.0 |
| 35 to 50 years | 15 (65.2%) | 64.0 |
| Total | 23 (100.0%) | 62.0 |
Fertility by Age by Marriage Status in Bay Pines
65.2% of women with births (23) in Bay Pines are married. The highest percentage of unmarried women with births falls into 20 to 34 years age bracket with 100.0% of them unmarried at the time of birth, while the lowest percentage of unmarried women with births belong to 35 to 50 years age bracket with 0.0% of them unmarried.
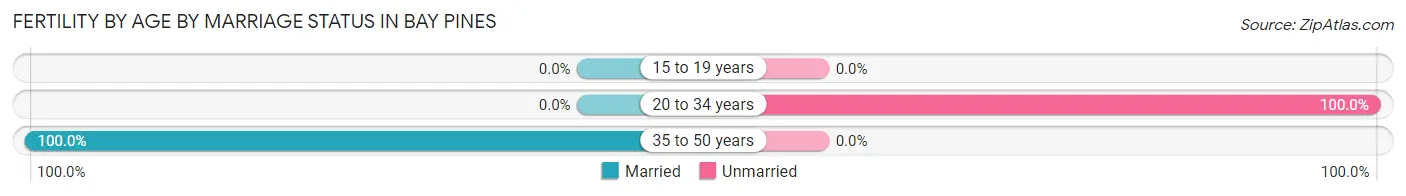
| Age Bracket | Married | Unmarried |
| 15 to 19 years | 0 (0.0%) | 0 (0.0%) |
| 20 to 34 years | 0 (0.0%) | 8 (100.0%) |
| 35 to 50 years | 15 (100.0%) | 0 (0.0%) |
| Total | 15 (65.2%) | 8 (34.8%) |
Fertility by Education in Bay Pines
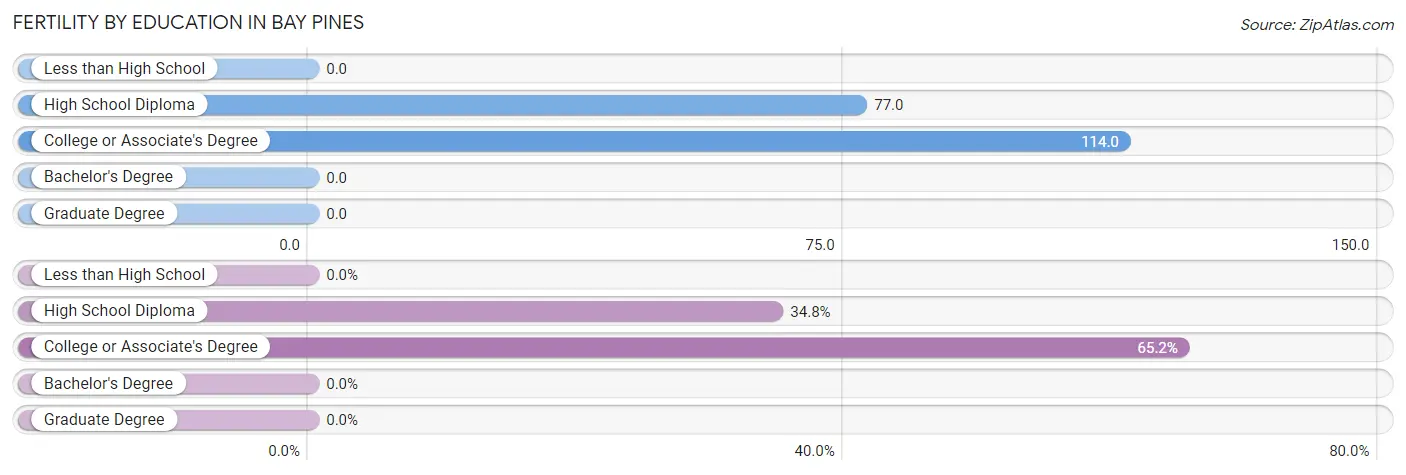
| Educational Attainment | Women with Births | Births / 1,000 Women |
| Less than High School | 0 (0.0%) | 0.0 |
| High School Diploma | 8 (34.8%) | 77.0 |
| College or Associate's Degree | 15 (65.2%) | 114.0 |
| Bachelor's Degree | 0 (0.0%) | 0.0 |
| Graduate Degree | 0 (0.0%) | 0.0 |
| Total | 23 (100.0%) | 62.0 |
Fertility by Education by Marriage Status in Bay Pines
34.8% of women with births in Bay Pines are unmarried. Women with the educational attainment of college or associate's degree are most likely to be married with 100.0% of them married at childbirth, while women with the educational attainment of high school diploma are least likely to be married with 100.0% of them unmarried at childbirth.
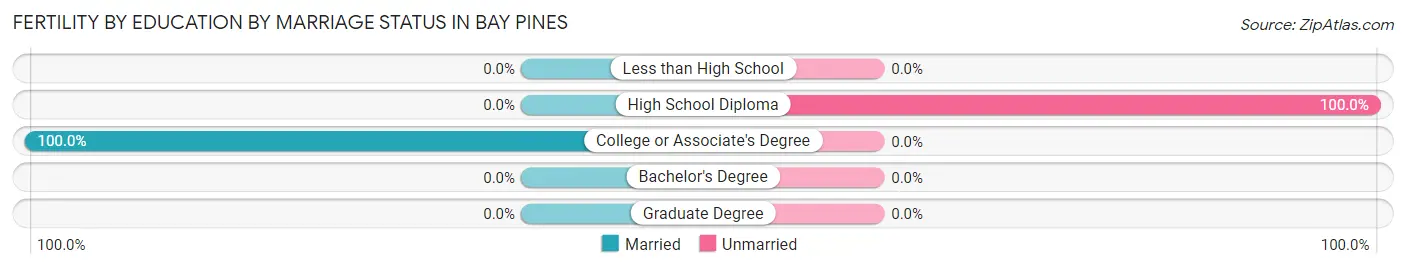
| Educational Attainment | Married | Unmarried |
| Less than High School | 0 (0.0%) | 0 (0.0%) |
| High School Diploma | 0 (0.0%) | 8 (100.0%) |
| College or Associate's Degree | 15 (100.0%) | 0 (0.0%) |
| Bachelor's Degree | 0 (0.0%) | 0 (0.0%) |
| Graduate Degree | 0 (0.0%) | 0 (0.0%) |
| Total | 15 (65.2%) | 8 (34.8%) |
Employment Characteristics in Bay Pines
Employment by Class of Employer in Bay Pines
Among the 1,174 employed individuals in Bay Pines, private company employees (774 | 65.9%), local government employees (140 | 11.9%), and not-for-profit organizations (67 | 5.7%) make up the most common classes of employment.
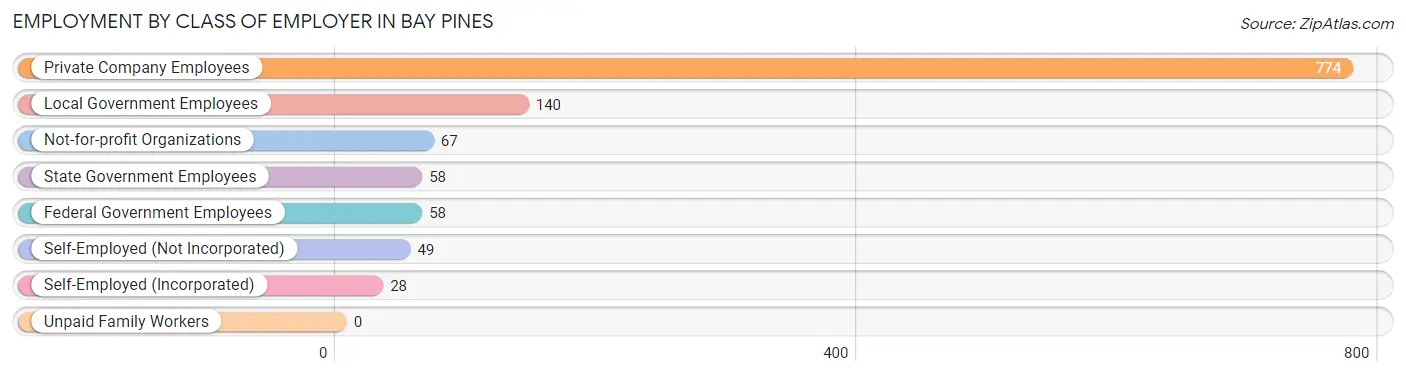
| Employer Class | # Employees | % Employees |
| Private Company Employees | 774 | 65.9% |
| Self-Employed (Incorporated) | 28 | 2.4% |
| Self-Employed (Not Incorporated) | 49 | 4.2% |
| Not-for-profit Organizations | 67 | 5.7% |
| Local Government Employees | 140 | 11.9% |
| State Government Employees | 58 | 4.9% |
| Federal Government Employees | 58 | 4.9% |
| Unpaid Family Workers | 0 | 0.0% |
| Total | 1,174 | 100.0% |
Employment Status by Age in Bay Pines
According to the labor force statistics for Bay Pines, out of the total population over 16 years of age (2,396), 49.7% or 1,191 individuals are in the labor force, with 0.8% or 10 of them unemployed. The age group with the highest labor force participation rate is 25 to 29 years, with 100.0% or 103 individuals in the labor force. Within the labor force, the 20 to 24 years age range has the highest percentage of unemployed individuals, with 24.3% or 9 of them being unemployed.
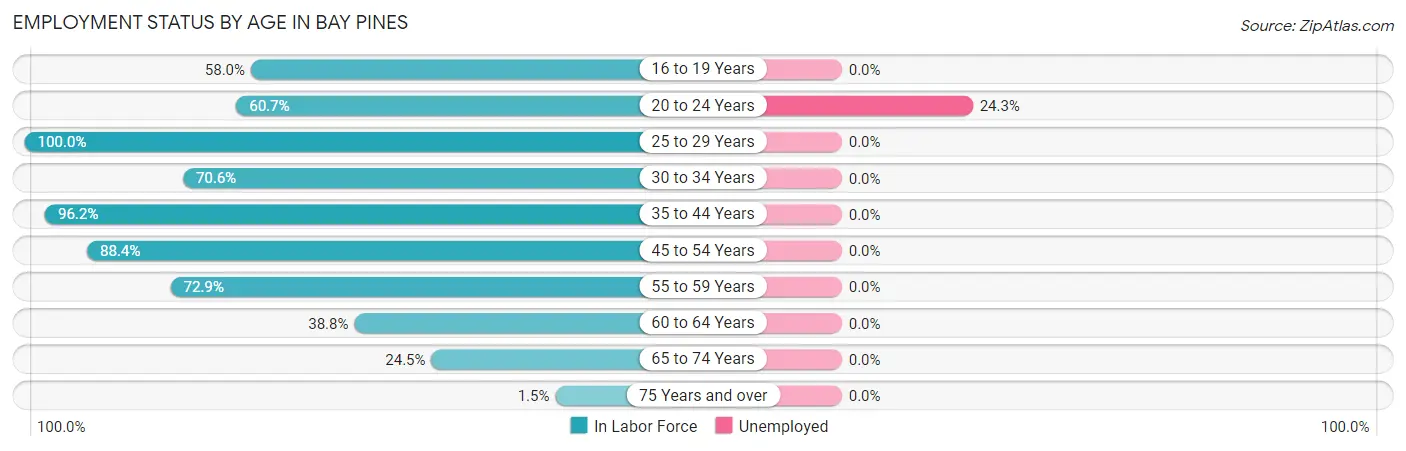
| Age Bracket | In Labor Force | Unemployed |
| 16 to 19 Years | 29 (58.0%) | 0 (0.0%) |
| 20 to 24 Years | 37 (60.7%) | 9 (24.3%) |
| 25 to 29 Years | 103 (100.0%) | 0 (0.0%) |
| 30 to 34 Years | 24 (70.6%) | 0 (0.0%) |
| 35 to 44 Years | 256 (96.2%) | 0 (0.0%) |
| 45 to 54 Years | 335 (88.4%) | 0 (0.0%) |
| 55 to 59 Years | 137 (72.9%) | 0 (0.0%) |
| 60 to 64 Years | 143 (38.8%) | 0 (0.0%) |
| 65 to 74 Years | 121 (24.5%) | 0 (0.0%) |
| 75 Years and over | 7 (1.5%) | 0 (0.0%) |
| Total | 1,191 (49.7%) | 10 (0.8%) |
Employment Status by Educational Attainment in Bay Pines
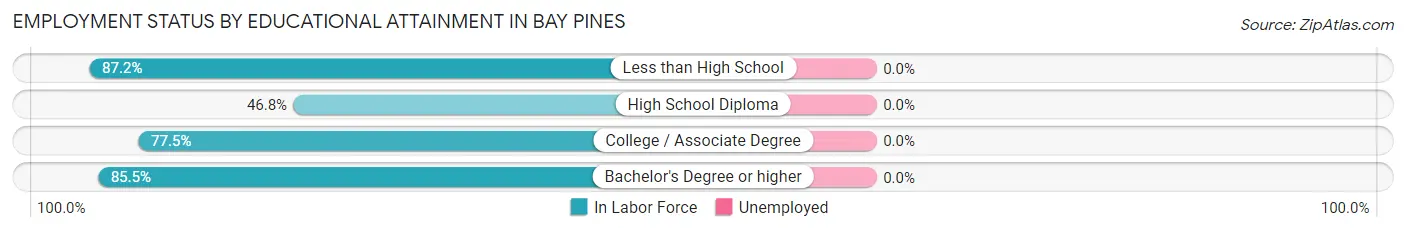
| Educational Attainment | In Labor Force | Unemployed |
| Less than High School | 68 (87.2%) | 0 (0.0%) |
| High School Diploma | 125 (46.8%) | 0 (0.0%) |
| College / Associate Degree | 435 (77.5%) | 0 (0.0%) |
| Bachelor's Degree or higher | 370 (85.5%) | 0 (0.0%) |
| Total | 998 (74.5%) | 0 (0.0%) |
Employment Occupations by Sex in Bay Pines
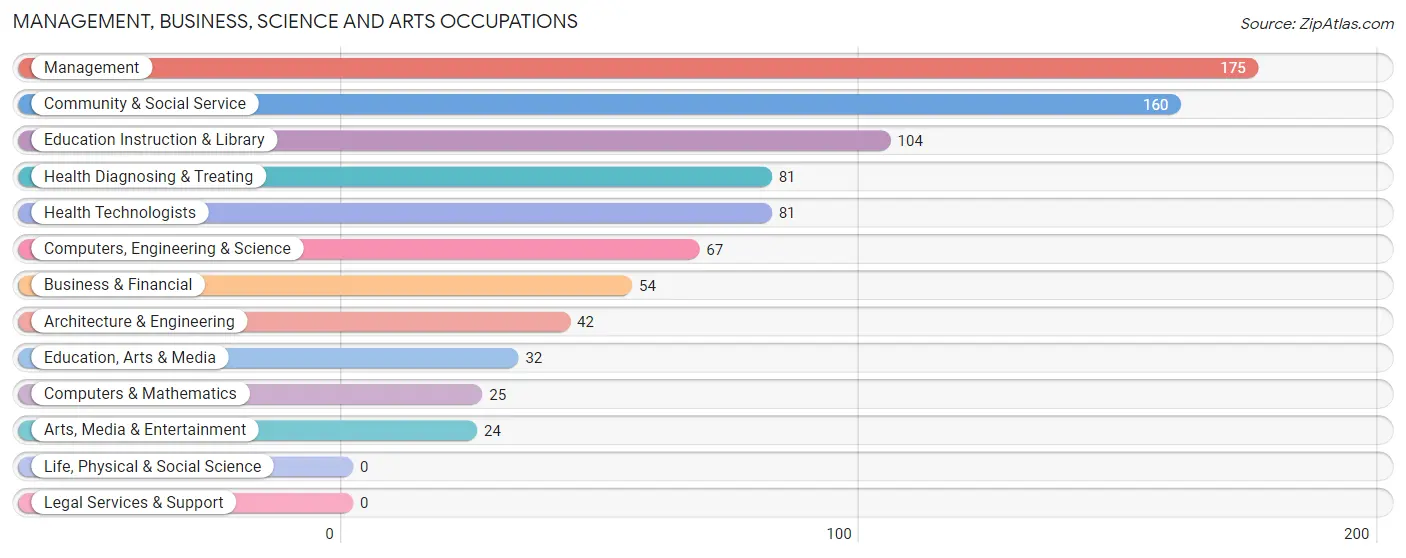
Management, Business, Science and Arts Occupations
The most common Management, Business, Science and Arts occupations in Bay Pines are Management (175 | 14.8%), Community & Social Service (160 | 13.5%), Education Instruction & Library (104 | 8.8%), Health Diagnosing & Treating (81 | 6.9%), and Health Technologists (81 | 6.9%).
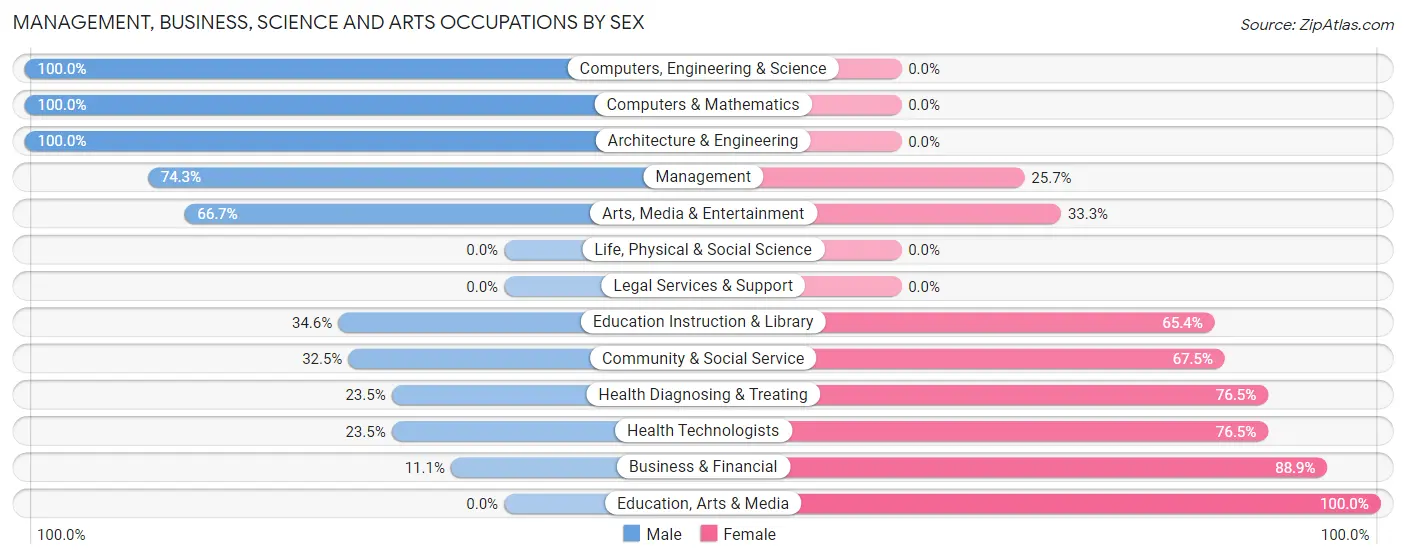
Management, Business, Science and Arts Occupations by Sex
Within the Management, Business, Science and Arts occupations in Bay Pines, the most male-oriented occupations are Computers, Engineering & Science (100.0%), Computers & Mathematics (100.0%), and Architecture & Engineering (100.0%), while the most female-oriented occupations are Education, Arts & Media (100.0%), Business & Financial (88.9%), and Health Diagnosing & Treating (76.5%).
| Occupation | Male | Female |
| Management | 130 (74.3%) | 45 (25.7%) |
| Business & Financial | 6 (11.1%) | 48 (88.9%) |
| Computers, Engineering & Science | 67 (100.0%) | 0 (0.0%) |
| Computers & Mathematics | 25 (100.0%) | 0 (0.0%) |
| Architecture & Engineering | 42 (100.0%) | 0 (0.0%) |
| Life, Physical & Social Science | 0 (0.0%) | 0 (0.0%) |
| Community & Social Service | 52 (32.5%) | 108 (67.5%) |
| Education, Arts & Media | 0 (0.0%) | 32 (100.0%) |
| Legal Services & Support | 0 (0.0%) | 0 (0.0%) |
| Education Instruction & Library | 36 (34.6%) | 68 (65.4%) |
| Arts, Media & Entertainment | 16 (66.7%) | 8 (33.3%) |
| Health Diagnosing & Treating | 19 (23.5%) | 62 (76.5%) |
| Health Technologists | 19 (23.5%) | 62 (76.5%) |
| Total (Category) | 274 (51.0%) | 263 (49.0%) |
| Total (Overall) | 605 (51.1%) | 578 (48.9%) |
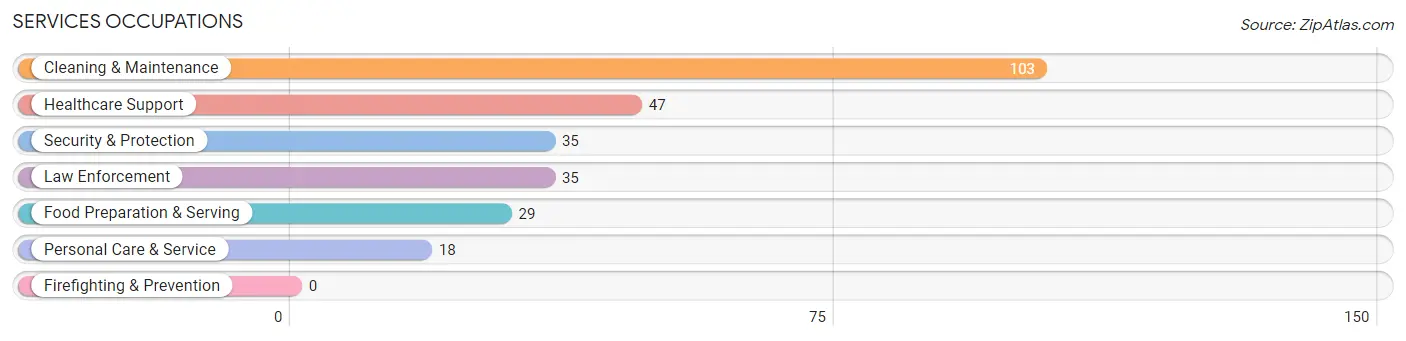
Services Occupations
The most common Services occupations in Bay Pines are Cleaning & Maintenance (103 | 8.7%), Healthcare Support (47 | 4.0%), Security & Protection (35 | 3.0%), Law Enforcement (35 | 3.0%), and Food Preparation & Serving (29 | 2.5%).
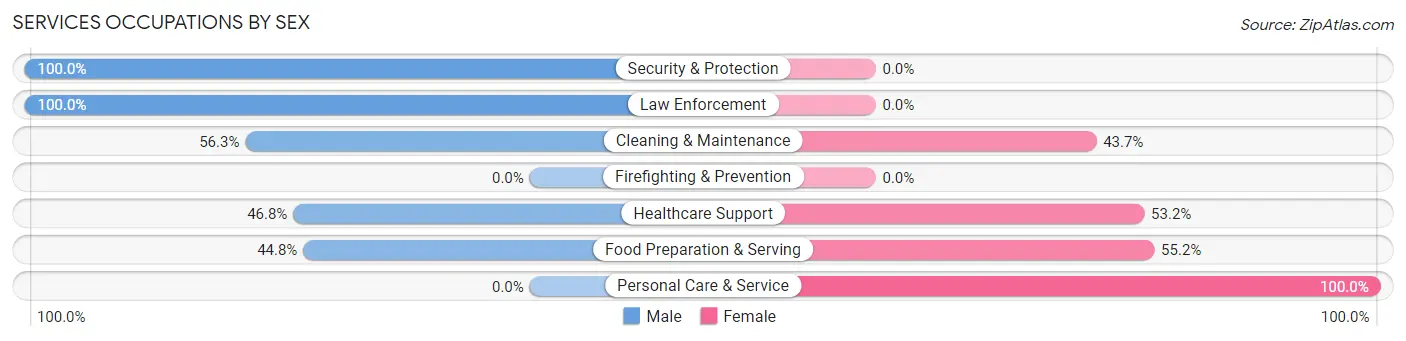
Services Occupations by Sex
Within the Services occupations in Bay Pines, the most male-oriented occupations are Security & Protection (100.0%), Law Enforcement (100.0%), and Cleaning & Maintenance (56.3%), while the most female-oriented occupations are Personal Care & Service (100.0%), Food Preparation & Serving (55.2%), and Healthcare Support (53.2%).
| Occupation | Male | Female |
| Healthcare Support | 22 (46.8%) | 25 (53.2%) |
| Security & Protection | 35 (100.0%) | 0 (0.0%) |
| Firefighting & Prevention | 0 (0.0%) | 0 (0.0%) |
| Law Enforcement | 35 (100.0%) | 0 (0.0%) |
| Food Preparation & Serving | 13 (44.8%) | 16 (55.2%) |
| Cleaning & Maintenance | 58 (56.3%) | 45 (43.7%) |
| Personal Care & Service | 0 (0.0%) | 18 (100.0%) |
| Total (Category) | 128 (55.2%) | 104 (44.8%) |
| Total (Overall) | 605 (51.1%) | 578 (48.9%) |
Sales and Office Occupations
The most common Sales and Office occupations in Bay Pines are Sales & Related (168 | 14.2%), and Office & Administration (147 | 12.4%).
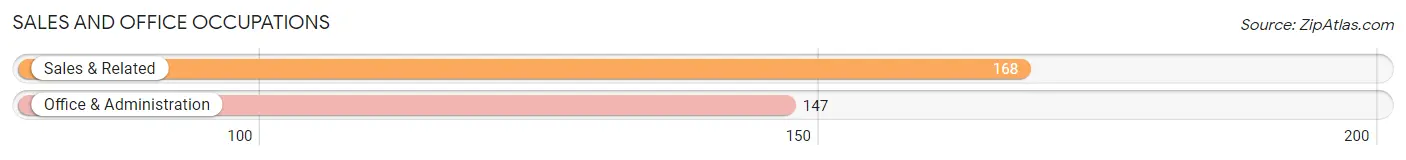
Sales and Office Occupations by Sex
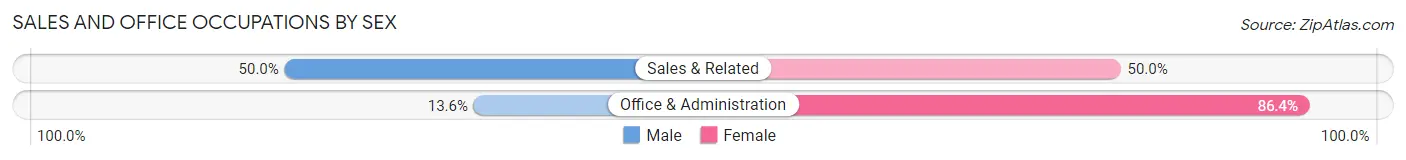
| Occupation | Male | Female |
| Sales & Related | 84 (50.0%) | 84 (50.0%) |
| Office & Administration | 20 (13.6%) | 127 (86.4%) |
| Total (Category) | 104 (33.0%) | 211 (67.0%) |
| Total (Overall) | 605 (51.1%) | 578 (48.9%) |
Natural Resources, Construction and Maintenance Occupations
The most common Natural Resources, Construction and Maintenance occupations in Bay Pines are , and Construction & Extraction (29 | 2.5%).
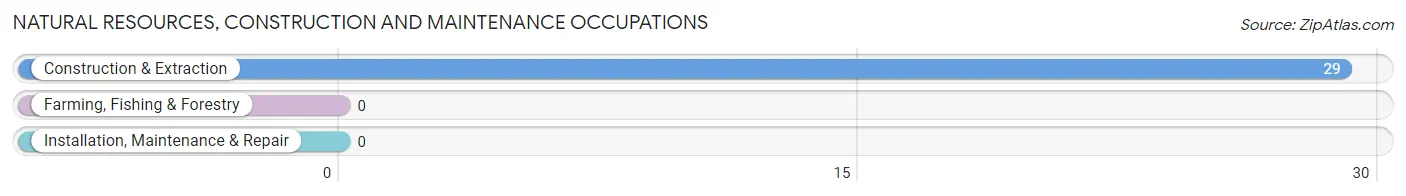
Natural Resources, Construction and Maintenance Occupations by Sex
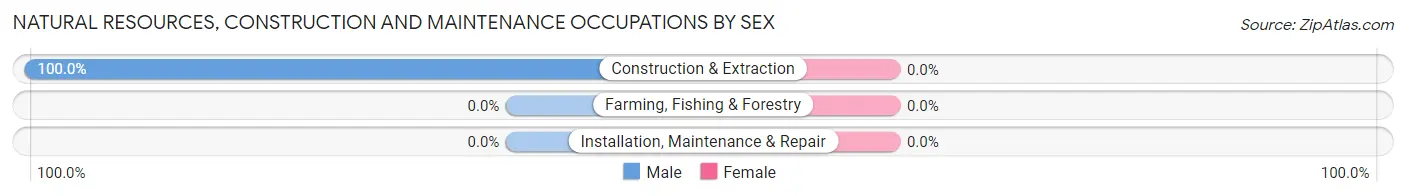
| Occupation | Male | Female |
| Farming, Fishing & Forestry | 0 (0.0%) | 0 (0.0%) |
| Construction & Extraction | 29 (100.0%) | 0 (0.0%) |
| Installation, Maintenance & Repair | 0 (0.0%) | 0 (0.0%) |
| Total (Category) | 29 (100.0%) | 0 (0.0%) |
| Total (Overall) | 605 (51.1%) | 578 (48.9%) |
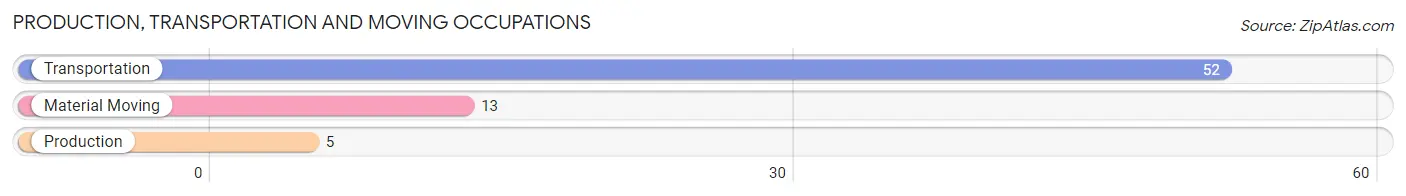
Production, Transportation and Moving Occupations
The most common Production, Transportation and Moving occupations in Bay Pines are Transportation (52 | 4.4%), Material Moving (13 | 1.1%), and Production (5 | 0.4%).
Production, Transportation and Moving Occupations by Sex
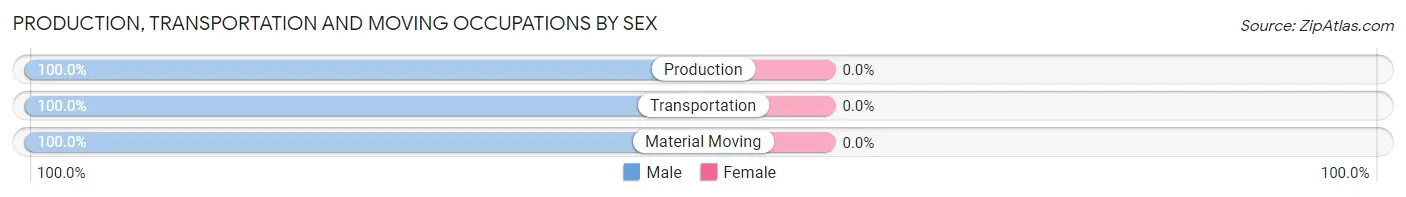
| Occupation | Male | Female |
| Production | 5 (100.0%) | 0 (0.0%) |
| Transportation | 52 (100.0%) | 0 (0.0%) |
| Material Moving | 13 (100.0%) | 0 (0.0%) |
| Total (Category) | 70 (100.0%) | 0 (0.0%) |
| Total (Overall) | 605 (51.1%) | 578 (48.9%) |
Employment Industries by Sex in Bay Pines
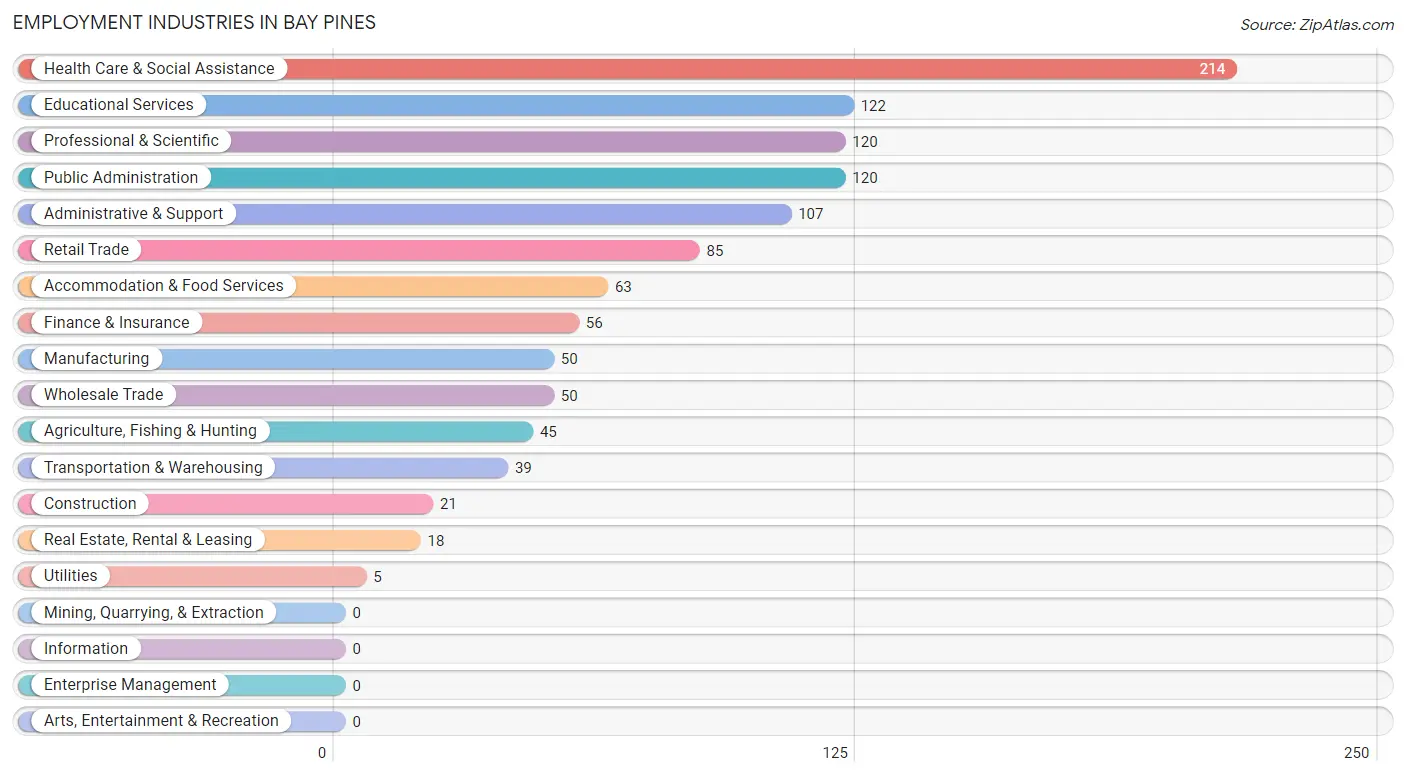
Employment Industries in Bay Pines
The major employment industries in Bay Pines include Health Care & Social Assistance (214 | 18.1%), Educational Services (122 | 10.3%), Professional & Scientific (120 | 10.1%), Public Administration (120 | 10.1%), and Administrative & Support (107 | 9.0%).
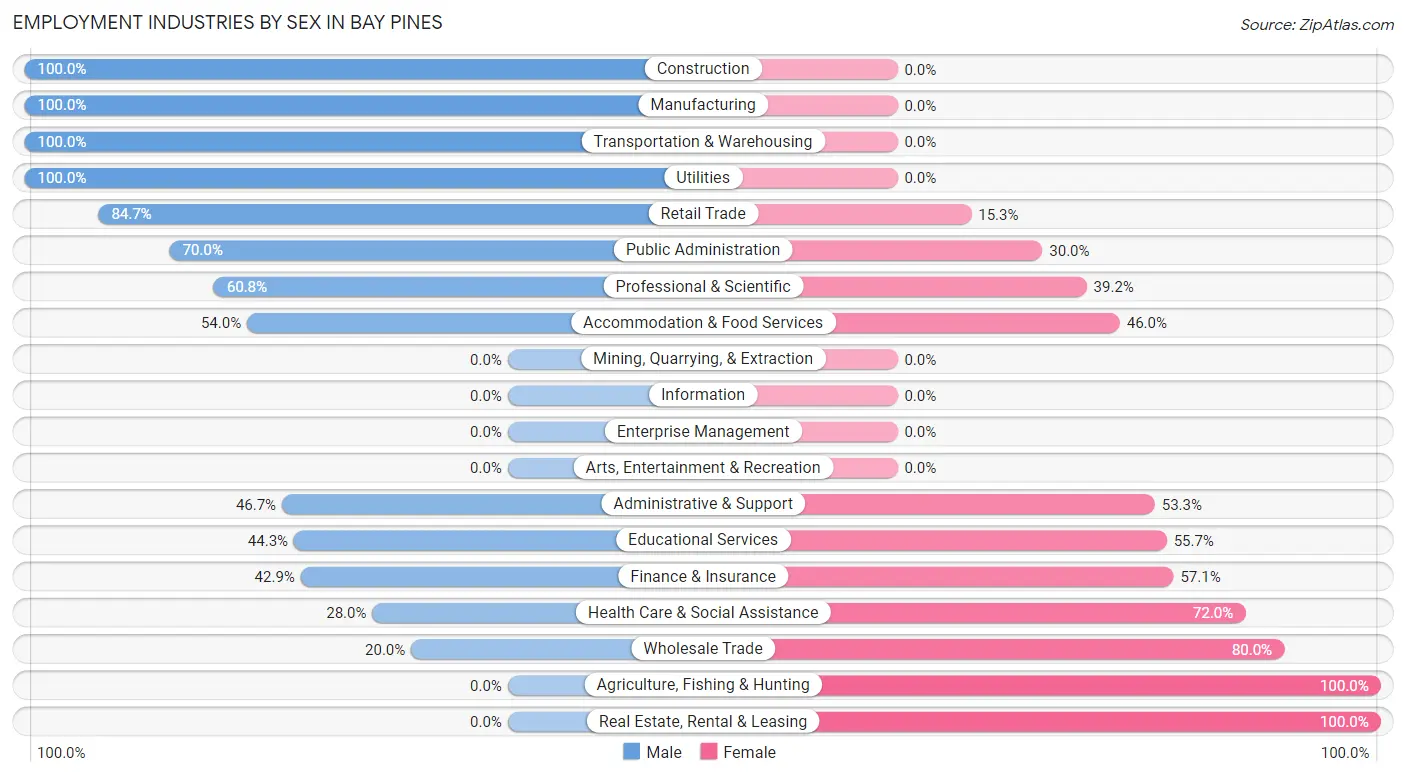
Employment Industries by Sex in Bay Pines
The Bay Pines industries that see more men than women are Construction (100.0%), Manufacturing (100.0%), and Transportation & Warehousing (100.0%), whereas the industries that tend to have a higher number of women are Agriculture, Fishing & Hunting (100.0%), Real Estate, Rental & Leasing (100.0%), and Wholesale Trade (80.0%).
| Industry | Male | Female |
| Agriculture, Fishing & Hunting | 0 (0.0%) | 45 (100.0%) |
| Mining, Quarrying, & Extraction | 0 (0.0%) | 0 (0.0%) |
| Construction | 21 (100.0%) | 0 (0.0%) |
| Manufacturing | 50 (100.0%) | 0 (0.0%) |
| Wholesale Trade | 10 (20.0%) | 40 (80.0%) |
| Retail Trade | 72 (84.7%) | 13 (15.3%) |
| Transportation & Warehousing | 39 (100.0%) | 0 (0.0%) |
| Utilities | 5 (100.0%) | 0 (0.0%) |
| Information | 0 (0.0%) | 0 (0.0%) |
| Finance & Insurance | 24 (42.9%) | 32 (57.1%) |
| Real Estate, Rental & Leasing | 0 (0.0%) | 18 (100.0%) |
| Professional & Scientific | 73 (60.8%) | 47 (39.2%) |
| Enterprise Management | 0 (0.0%) | 0 (0.0%) |
| Administrative & Support | 50 (46.7%) | 57 (53.3%) |
| Educational Services | 54 (44.3%) | 68 (55.7%) |
| Health Care & Social Assistance | 60 (28.0%) | 154 (72.0%) |
| Arts, Entertainment & Recreation | 0 (0.0%) | 0 (0.0%) |
| Accommodation & Food Services | 34 (54.0%) | 29 (46.0%) |
| Public Administration | 84 (70.0%) | 36 (30.0%) |
| Total | 605 (51.1%) | 578 (48.9%) |
Education in Bay Pines
School Enrollment in Bay Pines
The most common levels of schooling among the 450 students in Bay Pines are middle school (132 | 29.3%), college / undergraduate (94 | 20.9%), and elementary school (73 | 16.2%).
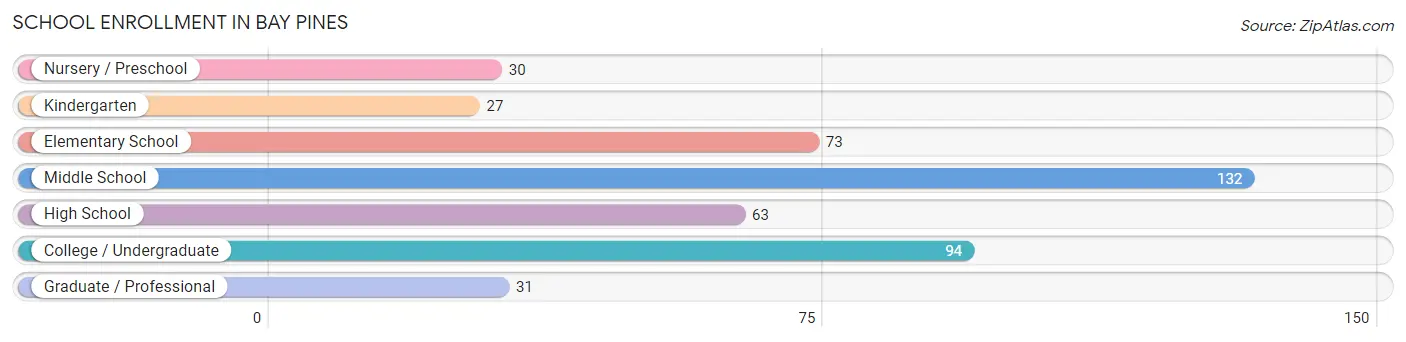
| School Level | # Students | % Students |
| Nursery / Preschool | 30 | 6.7% |
| Kindergarten | 27 | 6.0% |
| Elementary School | 73 | 16.2% |
| Middle School | 132 | 29.3% |
| High School | 63 | 14.0% |
| College / Undergraduate | 94 | 20.9% |
| Graduate / Professional | 31 | 6.9% |
| Total | 450 | 100.0% |
School Enrollment by Age by Funding Source in Bay Pines
Out of a total of 450 students who are enrolled in schools in Bay Pines, 64 (14.2%) attend a private institution, while the remaining 386 (85.8%) are enrolled in public schools. The age group of 3 to 4 year olds has the highest likelihood of being enrolled in private schools, with 30 (100.0% in the age bracket) enrolled. Conversely, the age group of 5 to 9 year old has the lowest likelihood of being enrolled in a private school, with 100 (100.0% in the age bracket) attending a public institution.
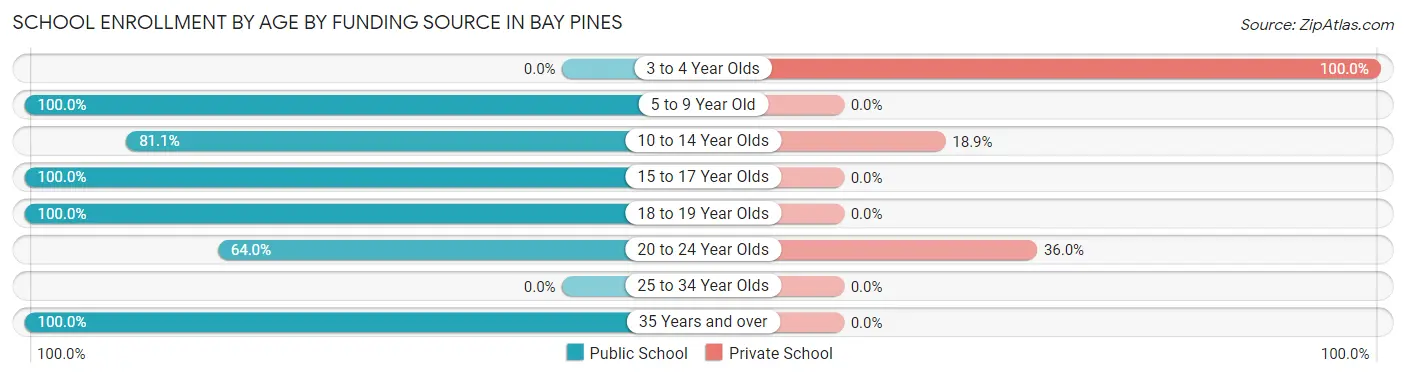
| Age Bracket | Public School | Private School |
| 3 to 4 Year Olds | 0 (0.0%) | 30 (100.0%) |
| 5 to 9 Year Old | 100 (100.0%) | 0 (0.0%) |
| 10 to 14 Year Olds | 107 (81.1%) | 25 (18.9%) |
| 15 to 17 Year Olds | 54 (100.0%) | 0 (0.0%) |
| 18 to 19 Year Olds | 9 (100.0%) | 0 (0.0%) |
| 20 to 24 Year Olds | 16 (64.0%) | 9 (36.0%) |
| 25 to 34 Year Olds | 0 (0.0%) | 0 (0.0%) |
| 35 Years and over | 100 (100.0%) | 0 (0.0%) |
| Total | 386 (85.8%) | 64 (14.2%) |
Educational Attainment by Field of Study in Bay Pines
Education (143 | 19.4%), science & technology (127 | 17.2%), business (106 | 14.3%), social sciences (69 | 9.3%), and arts & humanities (62 | 8.4%) are the most common fields of study among 739 individuals in Bay Pines who have obtained a bachelor's degree or higher.
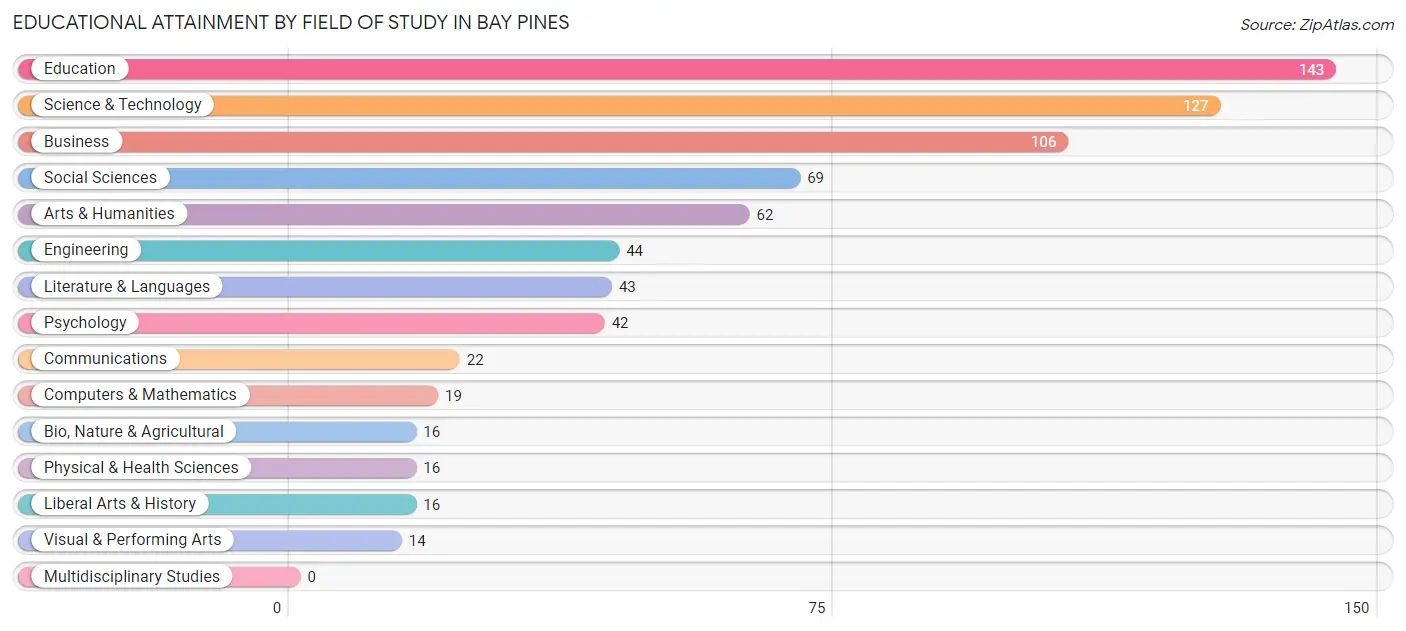
| Field of Study | # Graduates | % Graduates |
| Computers & Mathematics | 19 | 2.6% |
| Bio, Nature & Agricultural | 16 | 2.2% |
| Physical & Health Sciences | 16 | 2.2% |
| Psychology | 42 | 5.7% |
| Social Sciences | 69 | 9.3% |
| Engineering | 44 | 5.9% |
| Multidisciplinary Studies | 0 | 0.0% |
| Science & Technology | 127 | 17.2% |
| Business | 106 | 14.3% |
| Education | 143 | 19.4% |
| Literature & Languages | 43 | 5.8% |
| Liberal Arts & History | 16 | 2.2% |
| Visual & Performing Arts | 14 | 1.9% |
| Communications | 22 | 3.0% |
| Arts & Humanities | 62 | 8.4% |
| Total | 739 | 100.0% |
Transportation & Commute in Bay Pines
Vehicle Availability by Sex in Bay Pines
The most prevalent vehicle ownership categories in Bay Pines are males with 2 vehicles (238, accounting for 39.3%) and females with 2 vehicles (192, making up 41.8%).
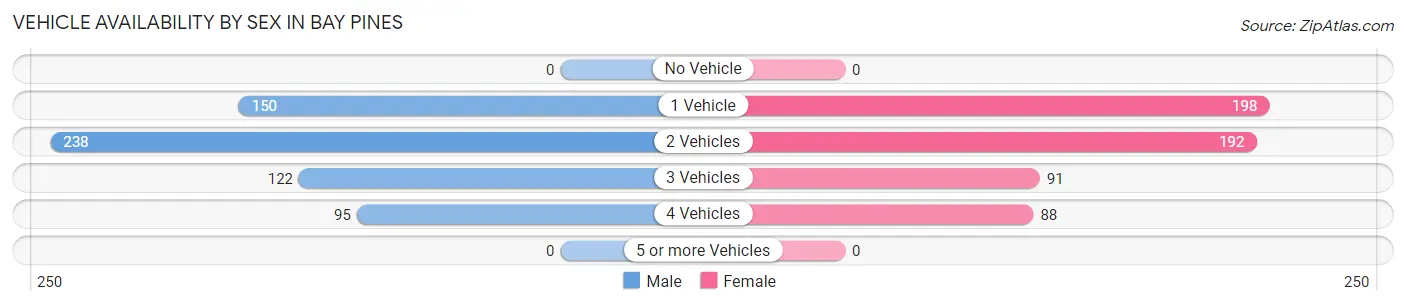
| Vehicles Available | Male | Female |
| No Vehicle | 0 (0.0%) | 0 (0.0%) |
| 1 Vehicle | 150 (24.8%) | 198 (34.8%) |
| 2 Vehicles | 238 (39.3%) | 192 (33.7%) |
| 3 Vehicles | 122 (20.2%) | 91 (16.0%) |
| 4 Vehicles | 95 (15.7%) | 88 (15.5%) |
| 5 or more Vehicles | 0 (0.0%) | 0 (0.0%) |
| Total | 605 (100.0%) | 569 (100.0%) |
Commute Time in Bay Pines
The most frequently occuring commute durations in Bay Pines are 20 to 24 minutes (246 commuters, 24.3%), 25 to 29 minutes (137 commuters, 13.6%), and 30 to 34 minutes (106 commuters, 10.5%).
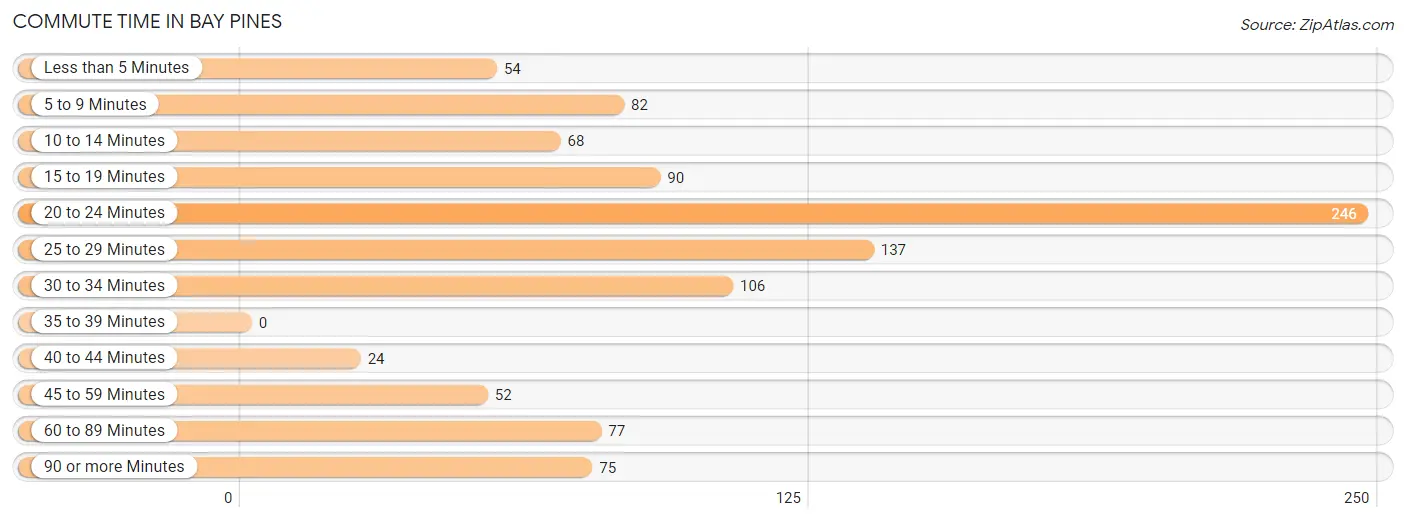
| Commute Time | # Commuters | % Commuters |
| Less than 5 Minutes | 54 | 5.3% |
| 5 to 9 Minutes | 82 | 8.1% |
| 10 to 14 Minutes | 68 | 6.7% |
| 15 to 19 Minutes | 90 | 8.9% |
| 20 to 24 Minutes | 246 | 24.3% |
| 25 to 29 Minutes | 137 | 13.6% |
| 30 to 34 Minutes | 106 | 10.5% |
| 35 to 39 Minutes | 0 | 0.0% |
| 40 to 44 Minutes | 24 | 2.4% |
| 45 to 59 Minutes | 52 | 5.1% |
| 60 to 89 Minutes | 77 | 7.6% |
| 90 or more Minutes | 75 | 7.4% |
Commute Time by Sex in Bay Pines
The most common commute times in Bay Pines are 20 to 24 minutes (143 commuters, 26.5%) for males and 20 to 24 minutes (103 commuters, 21.8%) for females.
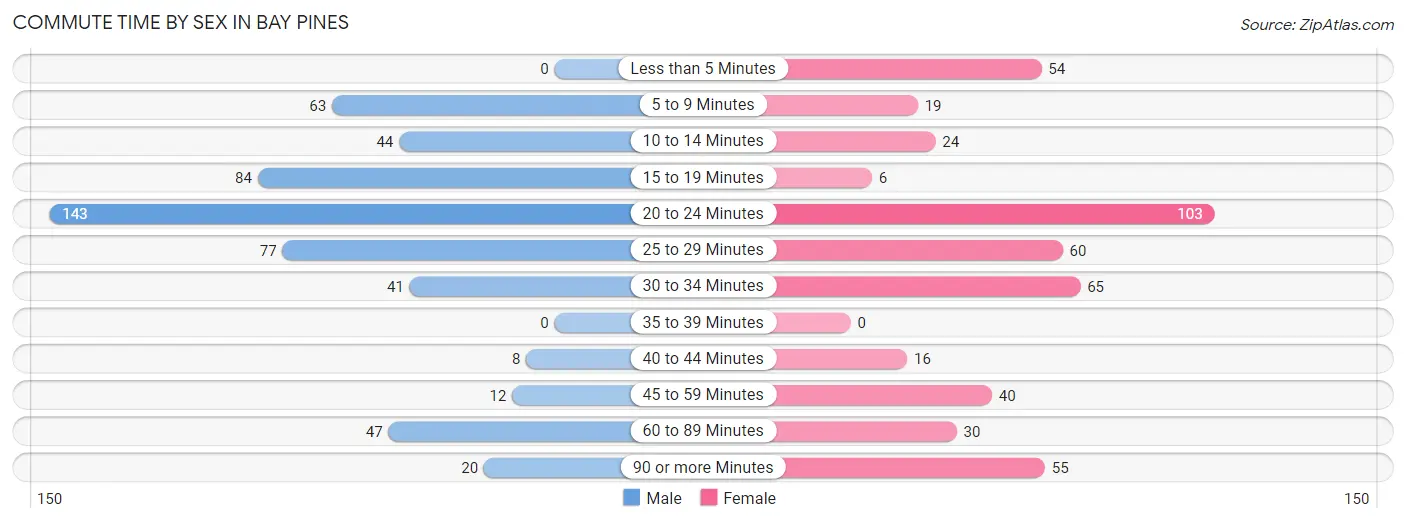
| Commute Time | Male | Female |
| Less than 5 Minutes | 0 (0.0%) | 54 (11.4%) |
| 5 to 9 Minutes | 63 (11.7%) | 19 (4.0%) |
| 10 to 14 Minutes | 44 (8.2%) | 24 (5.1%) |
| 15 to 19 Minutes | 84 (15.6%) | 6 (1.3%) |
| 20 to 24 Minutes | 143 (26.5%) | 103 (21.8%) |
| 25 to 29 Minutes | 77 (14.3%) | 60 (12.7%) |
| 30 to 34 Minutes | 41 (7.6%) | 65 (13.8%) |
| 35 to 39 Minutes | 0 (0.0%) | 0 (0.0%) |
| 40 to 44 Minutes | 8 (1.5%) | 16 (3.4%) |
| 45 to 59 Minutes | 12 (2.2%) | 40 (8.5%) |
| 60 to 89 Minutes | 47 (8.7%) | 30 (6.4%) |
| 90 or more Minutes | 20 (3.7%) | 55 (11.7%) |
Time of Departure to Work by Sex in Bay Pines
The most frequent times of departure to work in Bay Pines are 7:00 AM to 7:29 AM (105, 19.5%) for males and 6:00 AM to 6:29 AM (85, 18.0%) for females.
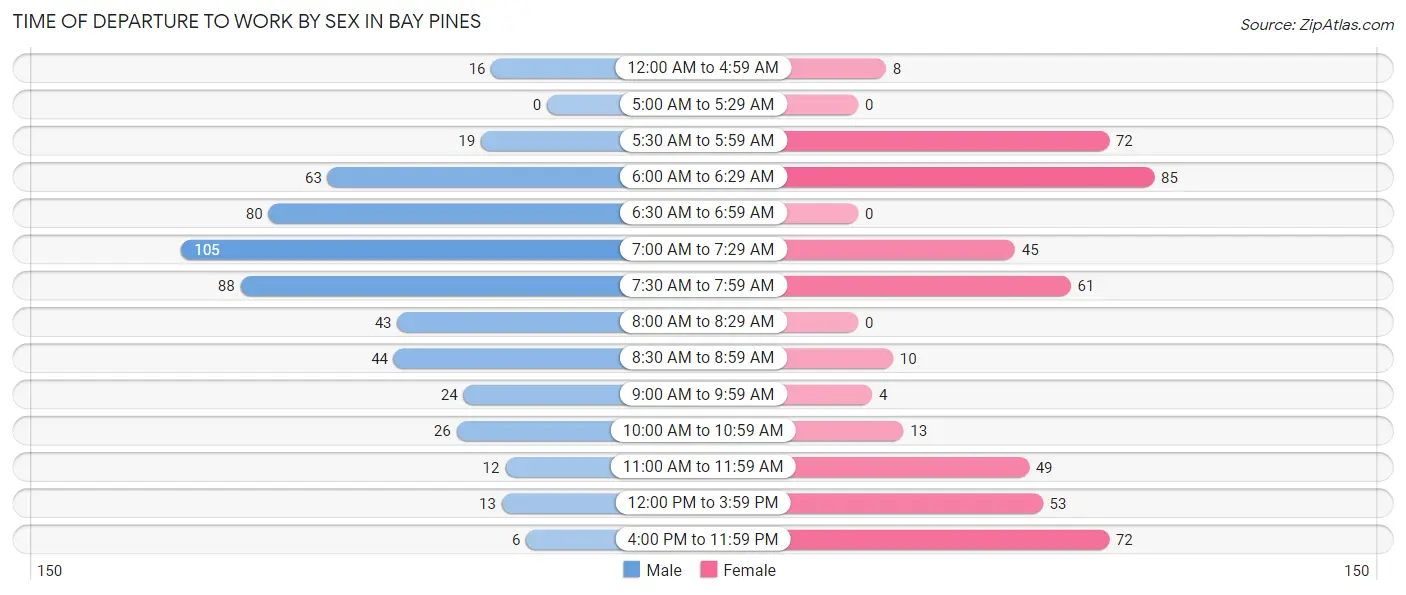
| Time of Departure | Male | Female |
| 12:00 AM to 4:59 AM | 16 (3.0%) | 8 (1.7%) |
| 5:00 AM to 5:29 AM | 0 (0.0%) | 0 (0.0%) |
| 5:30 AM to 5:59 AM | 19 (3.5%) | 72 (15.2%) |
| 6:00 AM to 6:29 AM | 63 (11.7%) | 85 (18.0%) |
| 6:30 AM to 6:59 AM | 80 (14.8%) | 0 (0.0%) |
| 7:00 AM to 7:29 AM | 105 (19.5%) | 45 (9.5%) |
| 7:30 AM to 7:59 AM | 88 (16.3%) | 61 (12.9%) |
| 8:00 AM to 8:29 AM | 43 (8.0%) | 0 (0.0%) |
| 8:30 AM to 8:59 AM | 44 (8.2%) | 10 (2.1%) |
| 9:00 AM to 9:59 AM | 24 (4.4%) | 4 (0.9%) |
| 10:00 AM to 10:59 AM | 26 (4.8%) | 13 (2.8%) |
| 11:00 AM to 11:59 AM | 12 (2.2%) | 49 (10.4%) |
| 12:00 PM to 3:59 PM | 13 (2.4%) | 53 (11.2%) |
| 4:00 PM to 11:59 PM | 6 (1.1%) | 72 (15.2%) |
| Total | 539 (100.0%) | 472 (100.0%) |
Housing Occupancy in Bay Pines
Occupancy by Ownership in Bay Pines
Of the total 1,274 dwellings in Bay Pines, owner-occupied units account for 1,140 (89.5%), while renter-occupied units make up 134 (10.5%).
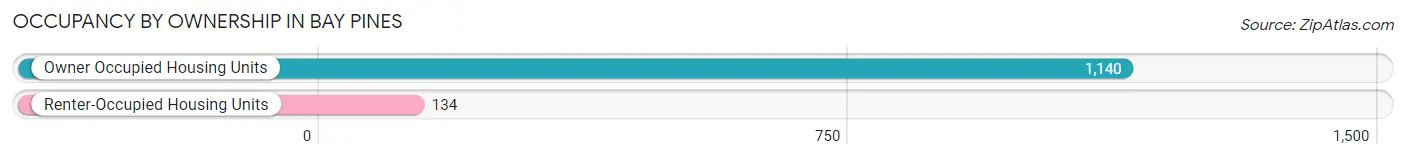
| Occupancy | # Housing Units | % Housing Units |
| Owner Occupied Housing Units | 1,140 | 89.5% |
| Renter-Occupied Housing Units | 134 | 10.5% |
| Total Occupied Housing Units | 1,274 | 100.0% |
Occupancy by Household Size in Bay Pines
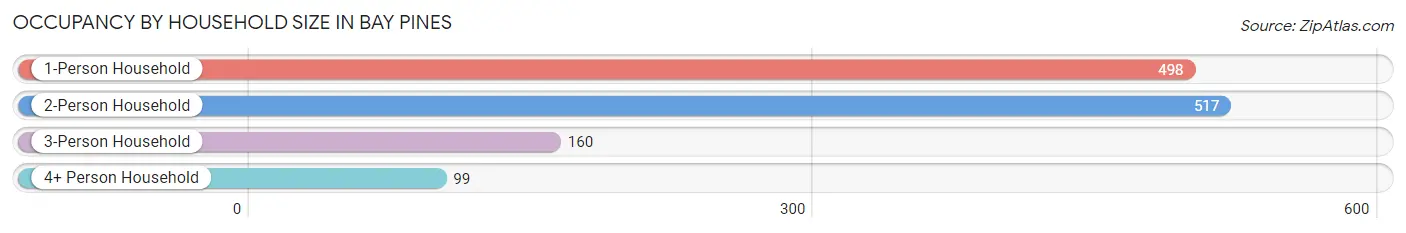
| Household Size | # Housing Units | % Housing Units |
| 1-Person Household | 498 | 39.1% |
| 2-Person Household | 517 | 40.6% |
| 3-Person Household | 160 | 12.6% |
| 4+ Person Household | 99 | 7.8% |
| Total Housing Units | 1,274 | 100.0% |
Occupancy by Ownership by Household Size in Bay Pines
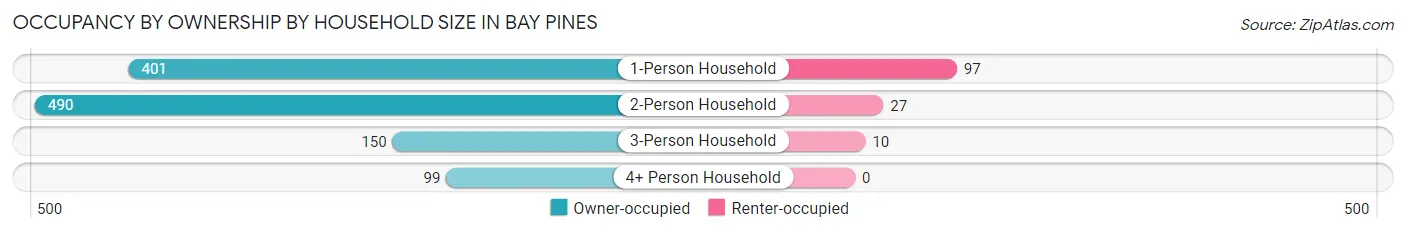
| Household Size | Owner-occupied | Renter-occupied |
| 1-Person Household | 401 (80.5%) | 97 (19.5%) |
| 2-Person Household | 490 (94.8%) | 27 (5.2%) |
| 3-Person Household | 150 (93.8%) | 10 (6.2%) |
| 4+ Person Household | 99 (100.0%) | 0 (0.0%) |
| Total Housing Units | 1,140 (89.5%) | 134 (10.5%) |
Occupancy by Educational Attainment in Bay Pines
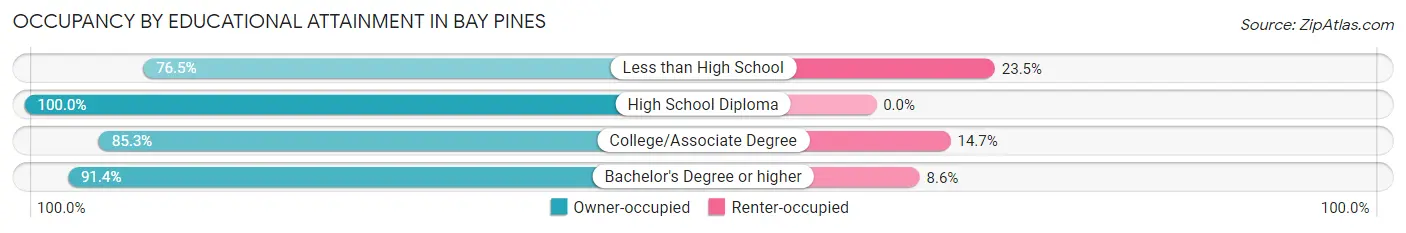
| Household Size | Owner-occupied | Renter-occupied |
| Less than High School | 26 (76.5%) | 8 (23.5%) |
| High School Diploma | 182 (100.0%) | 0 (0.0%) |
| College/Associate Degree | 486 (85.3%) | 84 (14.7%) |
| Bachelor's Degree or higher | 446 (91.4%) | 42 (8.6%) |
Occupancy by Age of Householder in Bay Pines
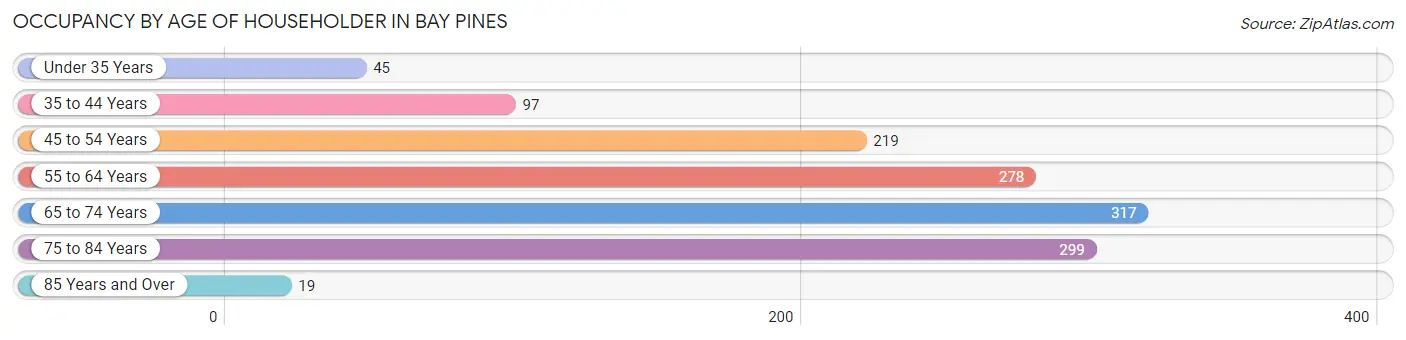
| Age Bracket | # Households | % Households |
| Under 35 Years | 45 | 3.5% |
| 35 to 44 Years | 97 | 7.6% |
| 45 to 54 Years | 219 | 17.2% |
| 55 to 64 Years | 278 | 21.8% |
| 65 to 74 Years | 317 | 24.9% |
| 75 to 84 Years | 299 | 23.5% |
| 85 Years and Over | 19 | 1.5% |
| Total | 1,274 | 100.0% |
Housing Finances in Bay Pines
Median Income by Occupancy in Bay Pines
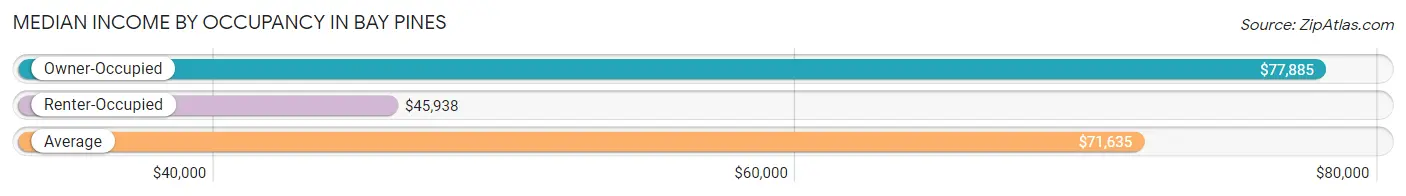
| Occupancy Type | # Households | Median Income |
| Owner-Occupied | 1,140 (89.5%) | $77,885 |
| Renter-Occupied | 134 (10.5%) | $45,938 |
| Average | 1,274 (100.0%) | $71,635 |
Occupancy by Householder Income Bracket in Bay Pines
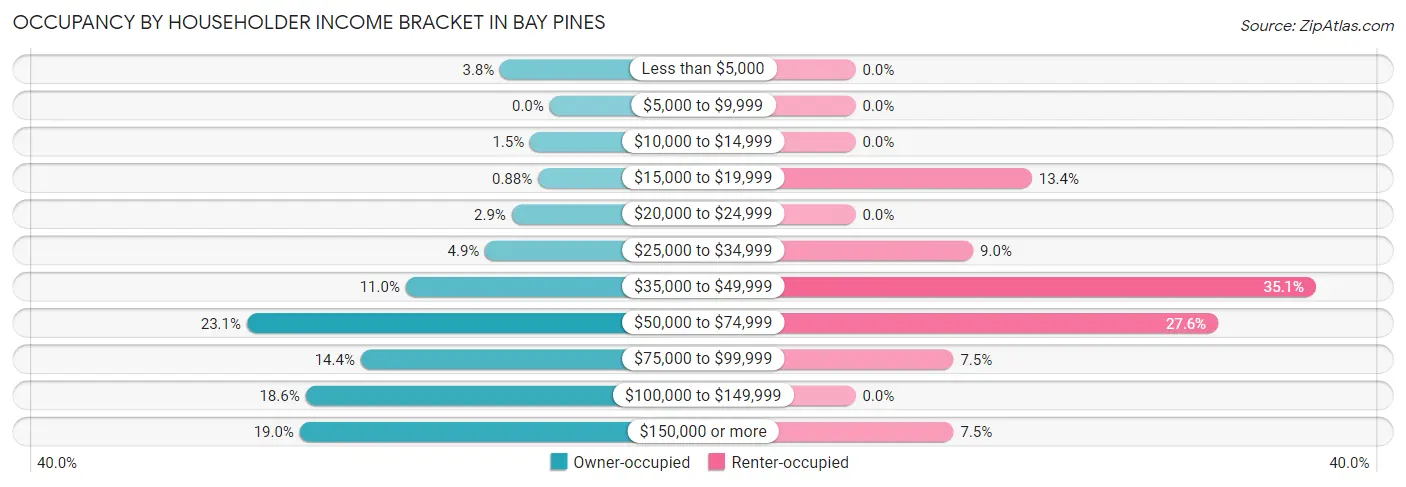
| Income Bracket | Owner-occupied | Renter-occupied |
| Less than $5,000 | 43 (3.8%) | 0 (0.0%) |
| $5,000 to $9,999 | 0 (0.0%) | 0 (0.0%) |
| $10,000 to $14,999 | 17 (1.5%) | 0 (0.0%) |
| $15,000 to $19,999 | 10 (0.9%) | 18 (13.4%) |
| $20,000 to $24,999 | 33 (2.9%) | 0 (0.0%) |
| $25,000 to $34,999 | 56 (4.9%) | 12 (9.0%) |
| $35,000 to $49,999 | 125 (11.0%) | 47 (35.1%) |
| $50,000 to $74,999 | 263 (23.1%) | 37 (27.6%) |
| $75,000 to $99,999 | 164 (14.4%) | 10 (7.5%) |
| $100,000 to $149,999 | 212 (18.6%) | 0 (0.0%) |
| $150,000 or more | 217 (19.0%) | 10 (7.5%) |
| Total | 1,140 (100.0%) | 134 (100.0%) |
Monthly Housing Cost Tiers in Bay Pines
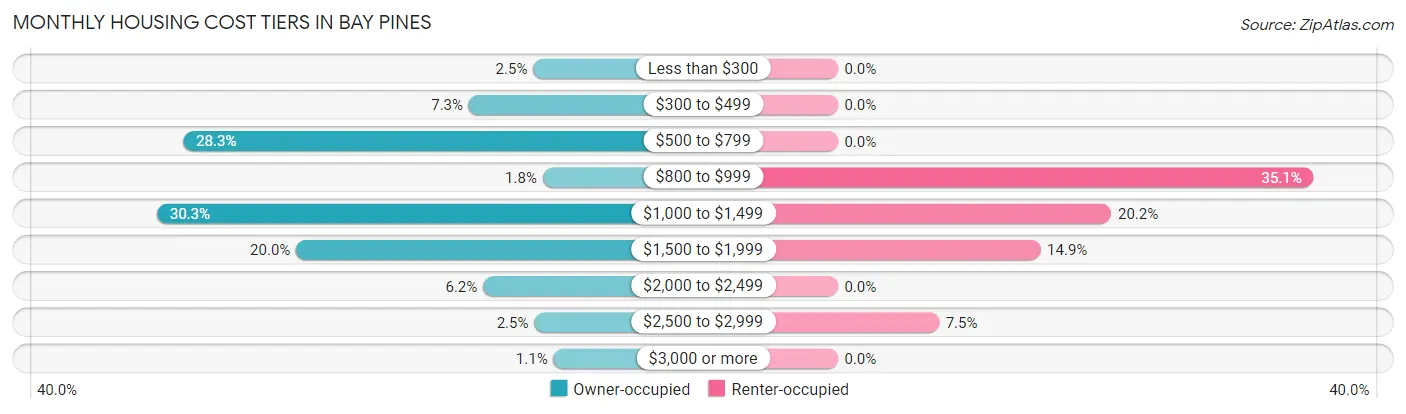
| Monthly Cost | Owner-occupied | Renter-occupied |
| Less than $300 | 29 (2.5%) | 0 (0.0%) |
| $300 to $499 | 83 (7.3%) | 0 (0.0%) |
| $500 to $799 | 323 (28.3%) | 0 (0.0%) |
| $800 to $999 | 21 (1.8%) | 47 (35.1%) |
| $1,000 to $1,499 | 345 (30.3%) | 27 (20.2%) |
| $1,500 to $1,999 | 228 (20.0%) | 20 (14.9%) |
| $2,000 to $2,499 | 71 (6.2%) | 0 (0.0%) |
| $2,500 to $2,999 | 28 (2.5%) | 10 (7.5%) |
| $3,000 or more | 12 (1.1%) | 0 (0.0%) |
| Total | 1,140 (100.0%) | 134 (100.0%) |
Physical Housing Characteristics in Bay Pines
Housing Structures in Bay Pines
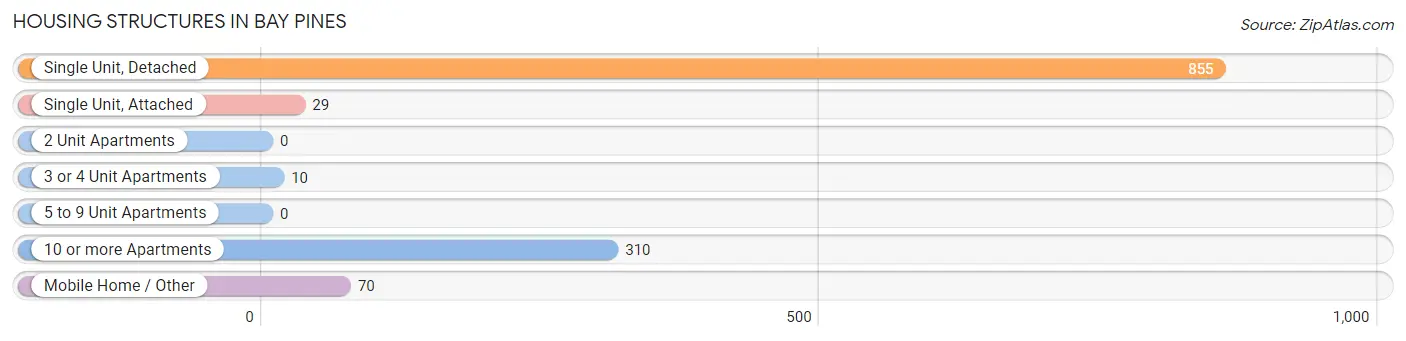
| Structure Type | # Housing Units | % Housing Units |
| Single Unit, Detached | 855 | 67.1% |
| Single Unit, Attached | 29 | 2.3% |
| 2 Unit Apartments | 0 | 0.0% |
| 3 or 4 Unit Apartments | 10 | 0.8% |
| 5 to 9 Unit Apartments | 0 | 0.0% |
| 10 or more Apartments | 310 | 24.3% |
| Mobile Home / Other | 70 | 5.5% |
| Total | 1,274 | 100.0% |
Housing Structures by Occupancy in Bay Pines
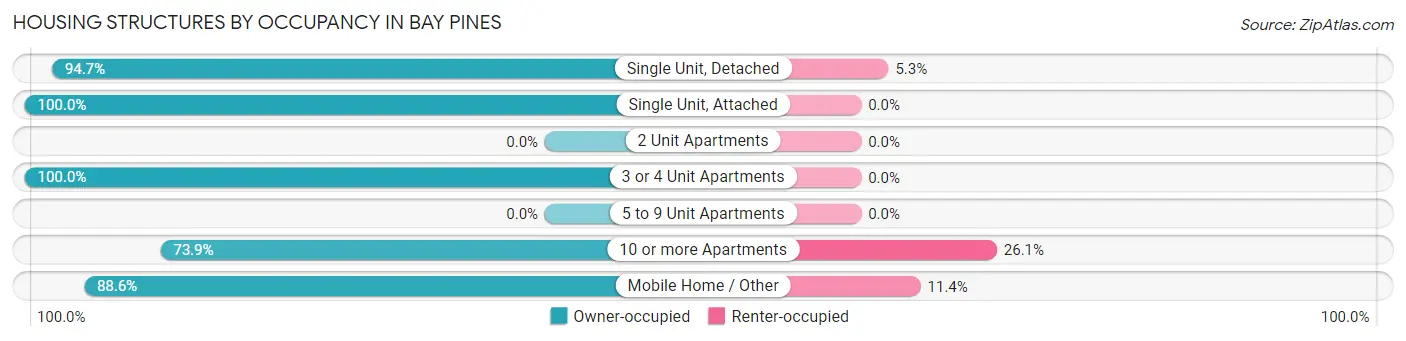
| Structure Type | Owner-occupied | Renter-occupied |
| Single Unit, Detached | 810 (94.7%) | 45 (5.3%) |
| Single Unit, Attached | 29 (100.0%) | 0 (0.0%) |
| 2 Unit Apartments | 0 (0.0%) | 0 (0.0%) |
| 3 or 4 Unit Apartments | 10 (100.0%) | 0 (0.0%) |
| 5 to 9 Unit Apartments | 0 (0.0%) | 0 (0.0%) |
| 10 or more Apartments | 229 (73.9%) | 81 (26.1%) |
| Mobile Home / Other | 62 (88.6%) | 8 (11.4%) |
| Total | 1,140 (89.5%) | 134 (10.5%) |
Housing Structures by Number of Rooms in Bay Pines
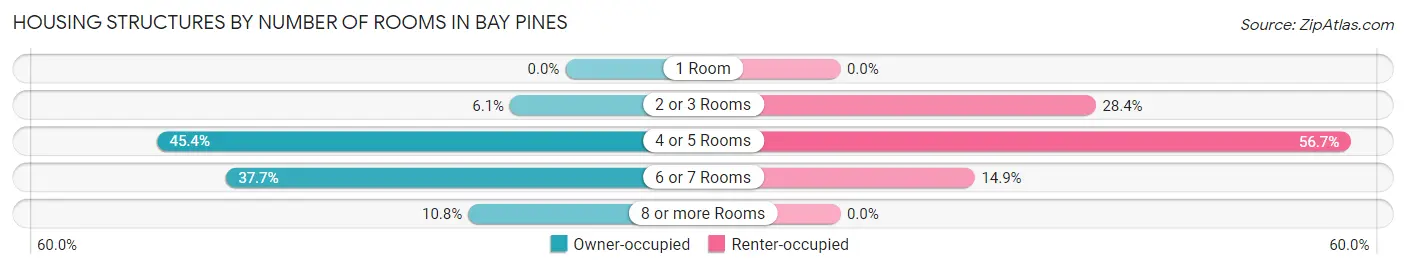
| Number of Rooms | Owner-occupied | Renter-occupied |
| 1 Room | 0 (0.0%) | 0 (0.0%) |
| 2 or 3 Rooms | 70 (6.1%) | 38 (28.4%) |
| 4 or 5 Rooms | 517 (45.4%) | 76 (56.7%) |
| 6 or 7 Rooms | 430 (37.7%) | 20 (14.9%) |
| 8 or more Rooms | 123 (10.8%) | 0 (0.0%) |
| Total | 1,140 (100.0%) | 134 (100.0%) |
Housing Structure by Heating Type in Bay Pines
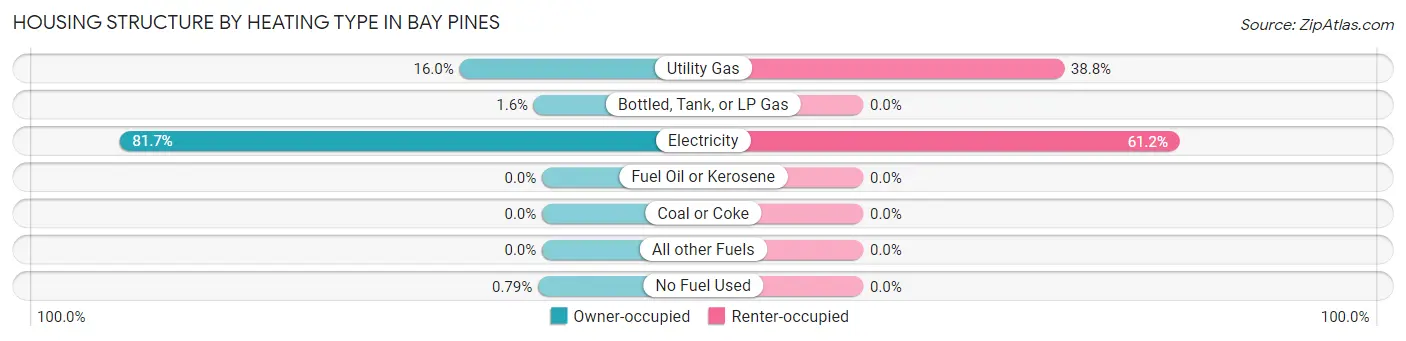
| Heating Type | Owner-occupied | Renter-occupied |
| Utility Gas | 182 (16.0%) | 52 (38.8%) |
| Bottled, Tank, or LP Gas | 18 (1.6%) | 0 (0.0%) |
| Electricity | 931 (81.7%) | 82 (61.2%) |
| Fuel Oil or Kerosene | 0 (0.0%) | 0 (0.0%) |
| Coal or Coke | 0 (0.0%) | 0 (0.0%) |
| All other Fuels | 0 (0.0%) | 0 (0.0%) |
| No Fuel Used | 9 (0.8%) | 0 (0.0%) |
| Total | 1,140 (100.0%) | 134 (100.0%) |
Household Vehicle Usage in Bay Pines
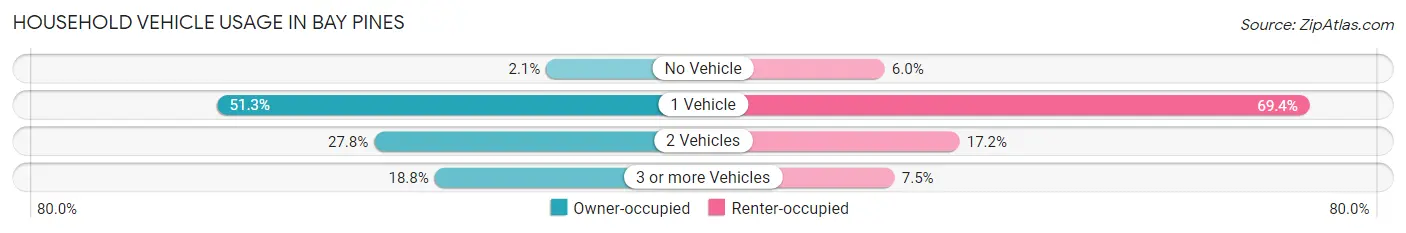
| Vehicles per Household | Owner-occupied | Renter-occupied |
| No Vehicle | 24 (2.1%) | 8 (6.0%) |
| 1 Vehicle | 585 (51.3%) | 93 (69.4%) |
| 2 Vehicles | 317 (27.8%) | 23 (17.2%) |
| 3 or more Vehicles | 214 (18.8%) | 10 (7.5%) |
| Total | 1,140 (100.0%) | 134 (100.0%) |
Real Estate & Mortgages in Bay Pines
Real Estate and Mortgage Overview in Bay Pines
| Characteristic | Without Mortgage | With Mortgage |
| Housing Units | 390 | 750 |
| Median Property Value | $200,000 | $307,400 |
| Median Household Income | $62,727 | $210 |
| Monthly Housing Costs | $673 | $12 |
| Real Estate Taxes | $1,704 | $16 |
Property Value by Mortgage Status in Bay Pines
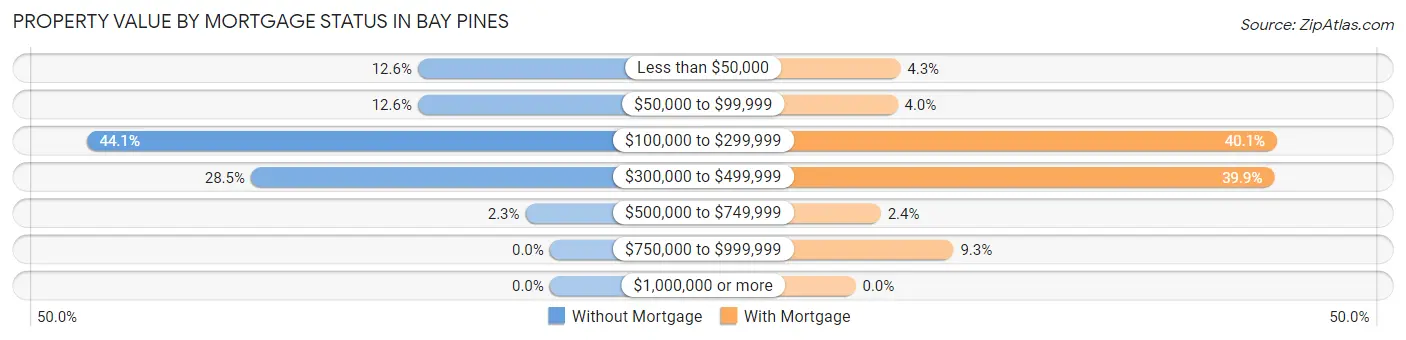
| Property Value | Without Mortgage | With Mortgage |
| Less than $50,000 | 49 (12.6%) | 32 (4.3%) |
| $50,000 to $99,999 | 49 (12.6%) | 30 (4.0%) |
| $100,000 to $299,999 | 172 (44.1%) | 301 (40.1%) |
| $300,000 to $499,999 | 111 (28.5%) | 299 (39.9%) |
| $500,000 to $749,999 | 9 (2.3%) | 18 (2.4%) |
| $750,000 to $999,999 | 0 (0.0%) | 70 (9.3%) |
| $1,000,000 or more | 0 (0.0%) | 0 (0.0%) |
| Total | 390 (100.0%) | 750 (100.0%) |
Household Income by Mortgage Status in Bay Pines
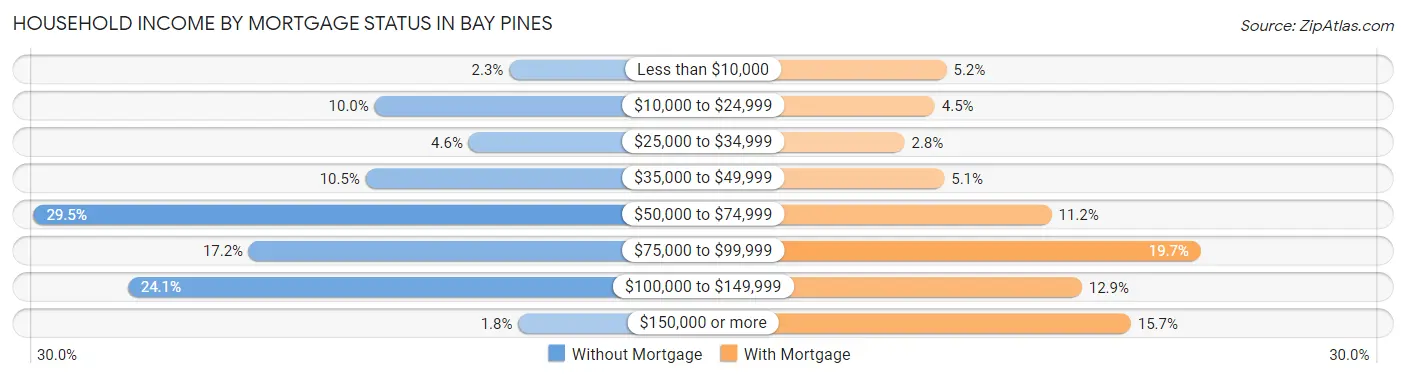
| Household Income | Without Mortgage | With Mortgage |
| Less than $10,000 | 9 (2.3%) | 39 (5.2%) |
| $10,000 to $24,999 | 39 (10.0%) | 34 (4.5%) |
| $25,000 to $34,999 | 18 (4.6%) | 21 (2.8%) |
| $35,000 to $49,999 | 41 (10.5%) | 38 (5.1%) |
| $50,000 to $74,999 | 115 (29.5%) | 84 (11.2%) |
| $75,000 to $99,999 | 67 (17.2%) | 148 (19.7%) |
| $100,000 to $149,999 | 94 (24.1%) | 97 (12.9%) |
| $150,000 or more | 7 (1.8%) | 118 (15.7%) |
| Total | 390 (100.0%) | 750 (100.0%) |
Property Value to Household Income Ratio in Bay Pines
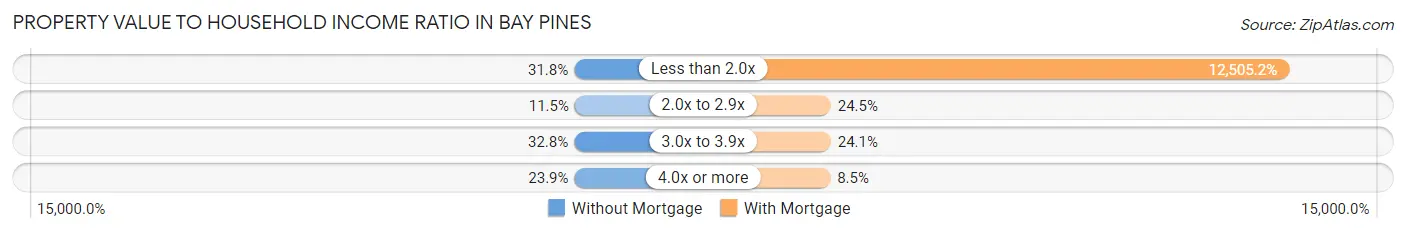
| Value-to-Income Ratio | Without Mortgage | With Mortgage |
| Less than 2.0x | 124 (31.8%) | 93,789 (12,505.2%) |
| 2.0x to 2.9x | 45 (11.5%) | 184 (24.5%) |
| 3.0x to 3.9x | 128 (32.8%) | 181 (24.1%) |
| 4.0x or more | 93 (23.8%) | 64 (8.5%) |
| Total | 390 (100.0%) | 750 (100.0%) |
Real Estate Taxes by Mortgage Status in Bay Pines
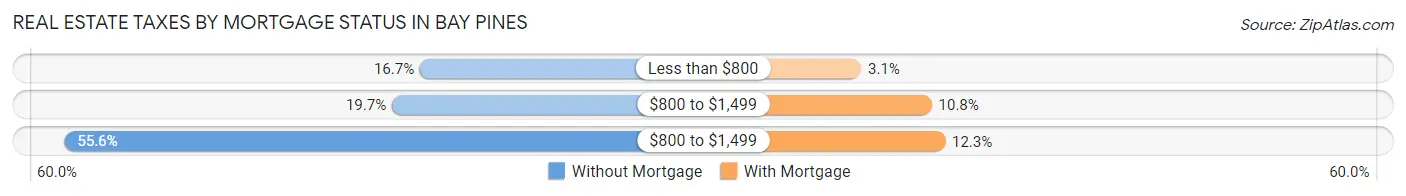
| Property Taxes | Without Mortgage | With Mortgage |
| Less than $800 | 65 (16.7%) | 23 (3.1%) |
| $800 to $1,499 | 77 (19.7%) | 81 (10.8%) |
| $800 to $1,499 | 217 (55.6%) | 92 (12.3%) |
| Total | 390 (100.0%) | 750 (100.0%) |
Health & Disability in Bay Pines
Health Insurance Coverage by Age in Bay Pines
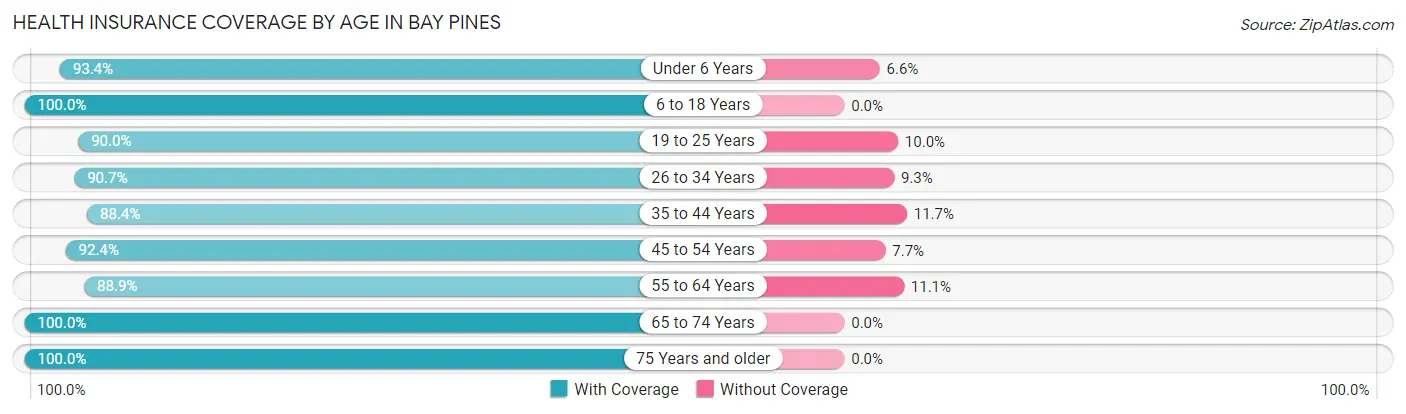
| Age Bracket | With Coverage | Without Coverage |
| Under 6 Years | 71 (93.4%) | 5 (6.6%) |
| 6 to 18 Years | 295 (100.0%) | 0 (0.0%) |
| 19 to 25 Years | 81 (90.0%) | 9 (10.0%) |
| 26 to 34 Years | 98 (90.7%) | 10 (9.3%) |
| 35 to 44 Years | 235 (88.3%) | 31 (11.7%) |
| 45 to 54 Years | 350 (92.3%) | 29 (7.6%) |
| 55 to 64 Years | 464 (88.9%) | 58 (11.1%) |
| 65 to 74 Years | 470 (100.0%) | 0 (0.0%) |
| 75 Years and older | 440 (100.0%) | 0 (0.0%) |
| Total | 2,504 (94.6%) | 142 (5.4%) |
Health Insurance Coverage by Citizenship Status in Bay Pines
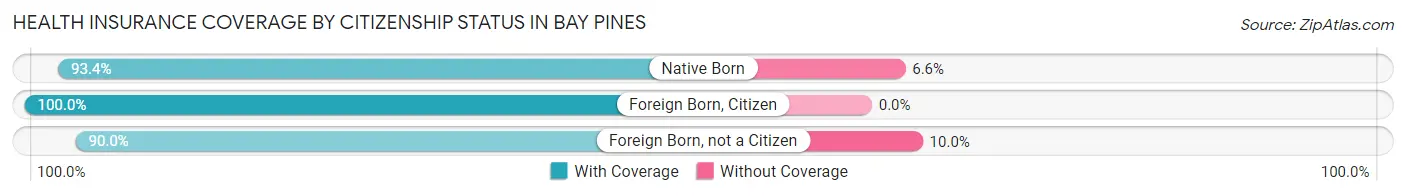
| Citizenship Status | With Coverage | Without Coverage |
| Native Born | 71 (93.4%) | 5 (6.6%) |
| Foreign Born, Citizen | 295 (100.0%) | 0 (0.0%) |
| Foreign Born, not a Citizen | 81 (90.0%) | 9 (10.0%) |
Health Insurance Coverage by Household Income in Bay Pines
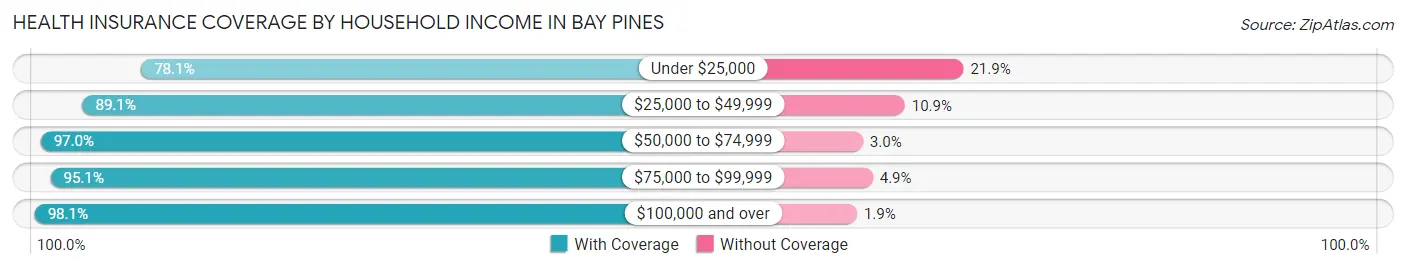
| Household Income | With Coverage | Without Coverage |
| Under $25,000 | 143 (78.1%) | 40 (21.9%) |
| $25,000 to $49,999 | 377 (89.1%) | 46 (10.9%) |
| $50,000 to $74,999 | 482 (97.0%) | 15 (3.0%) |
| $75,000 to $99,999 | 371 (95.1%) | 19 (4.9%) |
| $100,000 and over | 1,131 (98.1%) | 22 (1.9%) |
Public vs Private Health Insurance Coverage by Age in Bay Pines
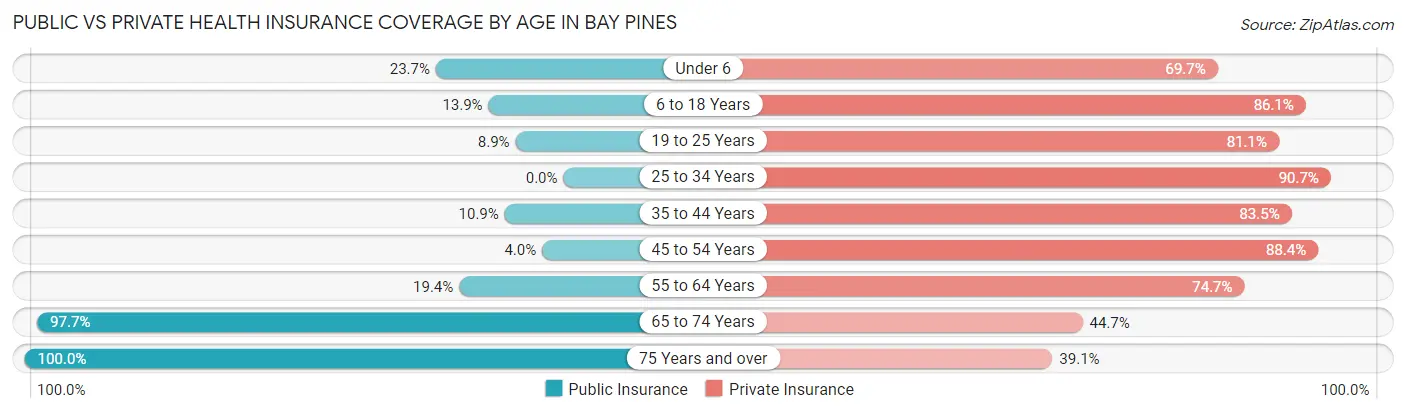
| Age Bracket | Public Insurance | Private Insurance |
| Under 6 | 18 (23.7%) | 53 (69.7%) |
| 6 to 18 Years | 41 (13.9%) | 254 (86.1%) |
| 19 to 25 Years | 8 (8.9%) | 73 (81.1%) |
| 25 to 34 Years | 0 (0.0%) | 98 (90.7%) |
| 35 to 44 Years | 29 (10.9%) | 222 (83.5%) |
| 45 to 54 Years | 15 (4.0%) | 335 (88.4%) |
| 55 to 64 Years | 101 (19.4%) | 390 (74.7%) |
| 65 to 74 Years | 459 (97.7%) | 210 (44.7%) |
| 75 Years and over | 440 (100.0%) | 172 (39.1%) |
| Total | 1,111 (42.0%) | 1,807 (68.3%) |
Disability Status by Sex by Age in Bay Pines
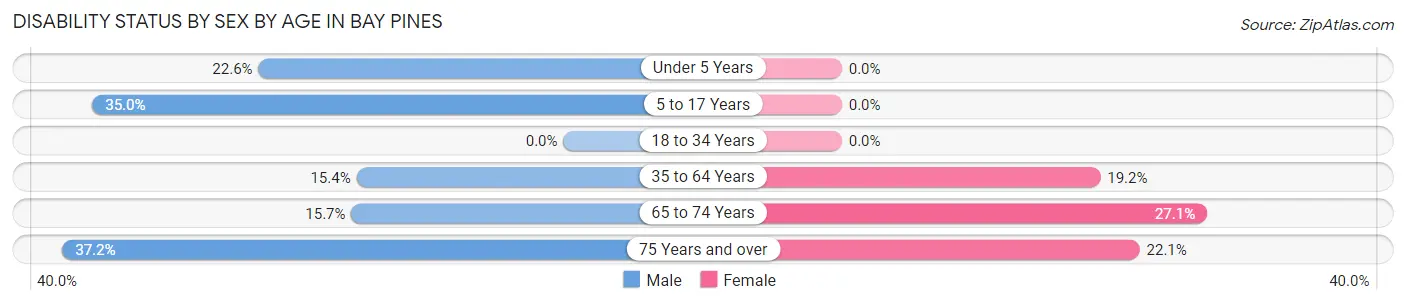
| Age Bracket | Male | Female |
| Under 5 Years | 12 (22.6%) | 0 (0.0%) |
| 5 to 17 Years | 50 (35.0%) | 0 (0.0%) |
| 18 to 34 Years | 0 (0.0%) | 0 (0.0%) |
| 35 to 64 Years | 84 (15.4%) | 119 (19.2%) |
| 65 to 74 Years | 31 (15.7%) | 74 (27.1%) |
| 75 Years and over | 93 (37.2%) | 42 (22.1%) |
Disability Class by Sex by Age in Bay Pines
Disability Class: Hearing Difficulty
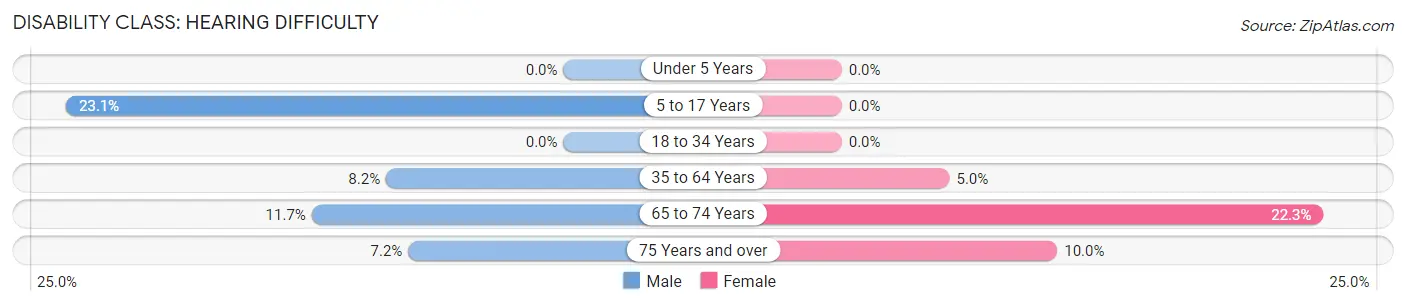
| Age Bracket | Male | Female |
| Under 5 Years | 0 (0.0%) | 0 (0.0%) |
| 5 to 17 Years | 33 (23.1%) | 0 (0.0%) |
| 18 to 34 Years | 0 (0.0%) | 0 (0.0%) |
| 35 to 64 Years | 45 (8.2%) | 31 (5.0%) |
| 65 to 74 Years | 23 (11.7%) | 61 (22.3%) |
| 75 Years and over | 18 (7.2%) | 19 (10.0%) |
Disability Class: Vision Difficulty
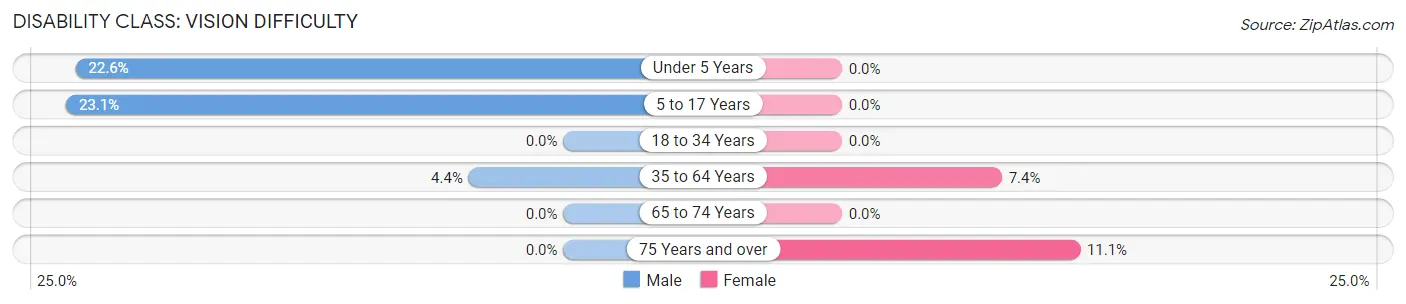
| Age Bracket | Male | Female |
| Under 5 Years | 12 (22.6%) | 0 (0.0%) |
| 5 to 17 Years | 33 (23.1%) | 0 (0.0%) |
| 18 to 34 Years | 0 (0.0%) | 0 (0.0%) |
| 35 to 64 Years | 24 (4.4%) | 46 (7.4%) |
| 65 to 74 Years | 0 (0.0%) | 0 (0.0%) |
| 75 Years and over | 0 (0.0%) | 21 (11.1%) |
Disability Class: Cognitive Difficulty
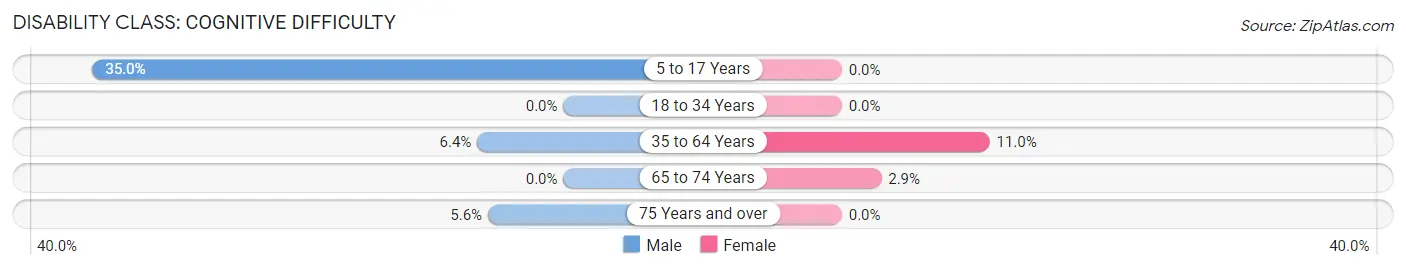
| Age Bracket | Male | Female |
| 5 to 17 Years | 50 (35.0%) | 0 (0.0%) |
| 18 to 34 Years | 0 (0.0%) | 0 (0.0%) |
| 35 to 64 Years | 35 (6.4%) | 68 (11.0%) |
| 65 to 74 Years | 0 (0.0%) | 8 (2.9%) |
| 75 Years and over | 14 (5.6%) | 0 (0.0%) |
Disability Class: Ambulatory Difficulty
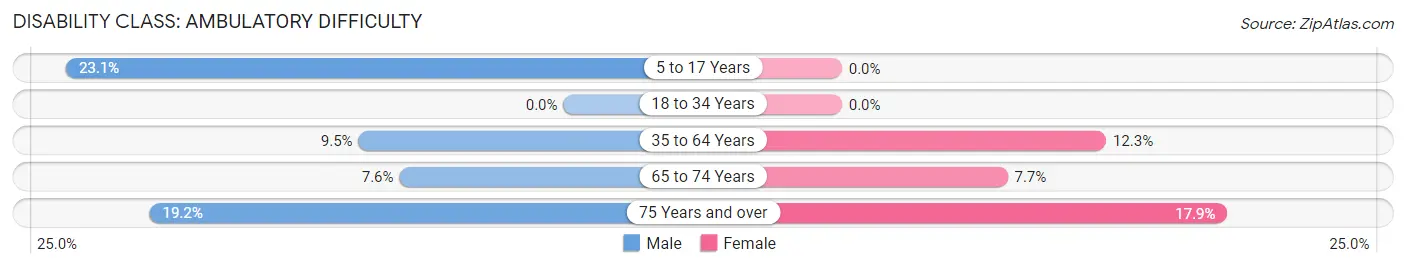
| Age Bracket | Male | Female |
| 5 to 17 Years | 33 (23.1%) | 0 (0.0%) |
| 18 to 34 Years | 0 (0.0%) | 0 (0.0%) |
| 35 to 64 Years | 52 (9.5%) | 76 (12.3%) |
| 65 to 74 Years | 15 (7.6%) | 21 (7.7%) |
| 75 Years and over | 48 (19.2%) | 34 (17.9%) |
Disability Class: Self-Care Difficulty
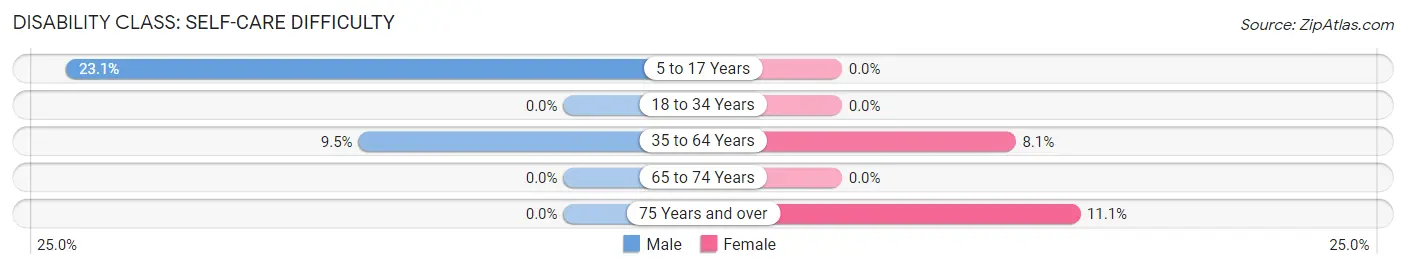
| Age Bracket | Male | Female |
| 5 to 17 Years | 33 (23.1%) | 0 (0.0%) |
| 18 to 34 Years | 0 (0.0%) | 0 (0.0%) |
| 35 to 64 Years | 52 (9.5%) | 50 (8.1%) |
| 65 to 74 Years | 0 (0.0%) | 0 (0.0%) |
| 75 Years and over | 0 (0.0%) | 21 (11.1%) |
Technology Access in Bay Pines
Computing Device Access in Bay Pines
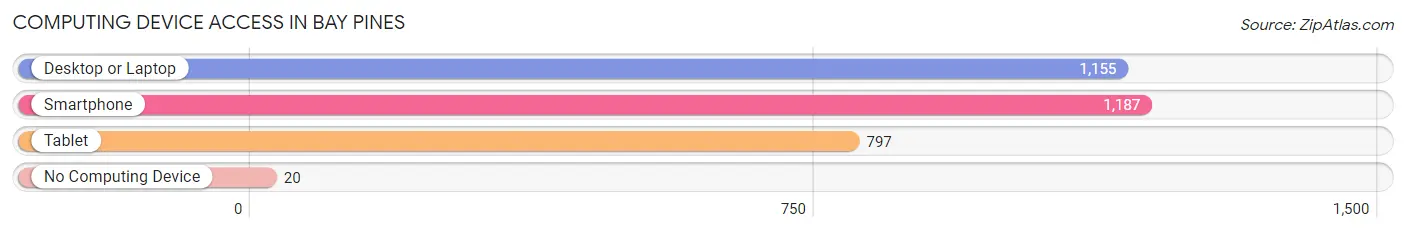
| Device Type | # Households | % Households |
| Desktop or Laptop | 1,155 | 90.7% |
| Smartphone | 1,187 | 93.2% |
| Tablet | 797 | 62.6% |
| No Computing Device | 20 | 1.6% |
| Total | 1,274 | 100.0% |
Internet Access in Bay Pines
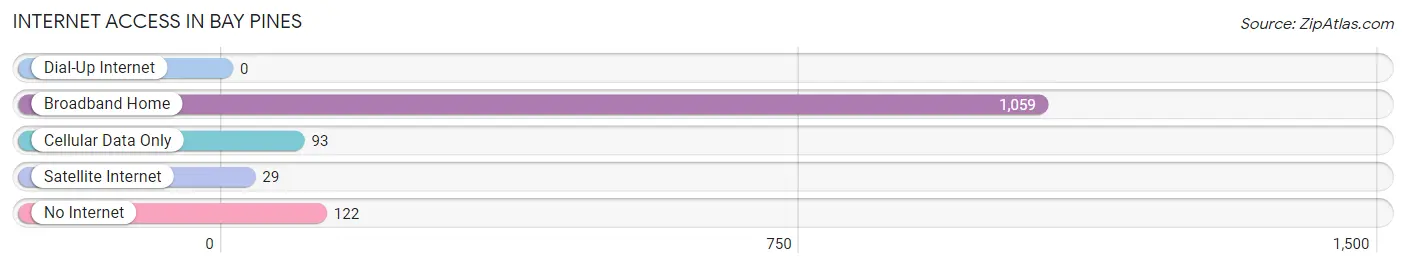
| Internet Type | # Households | % Households |
| Dial-Up Internet | 0 | 0.0% |
| Broadband Home | 1,059 | 83.1% |
| Cellular Data Only | 93 | 7.3% |
| Satellite Internet | 29 | 2.3% |
| No Internet | 122 | 9.6% |
| Total | 1,274 | 100.0% |
Bay Pines Summary
Bay Pines is a census-designated place (CDP) located in Pinellas County, Florida, United States. The population was 8,839 at the 2010 census. It is part of the Tampa-St. Petersburg-Clearwater Metropolitan Statistical Area.
History
The area now known as Bay Pines was originally inhabited by the Tocobaga people, who were part of the larger Timucua tribe. The Tocobaga lived in the area for centuries before the arrival of the Spanish in the 16th century. The Spanish established a mission in the area in 1567, but it was abandoned in 1572. The area was then largely uninhabited until the late 19th century, when settlers began to move into the area.
The area was originally known as Bay Pines because of the abundance of pine trees in the area. The name was officially adopted in 1925 when the Bay Pines post office was established.
Geography
Bay Pines is located at 27°51'25" North, 82°45'17" West (27.856944, -82.754722). According to the United States Census Bureau, the CDP has a total area of 4.2 square miles (10.8 km2), of which 4.1 square miles (10.6 km2) is land and 0.1 square miles (0.2 km2) is water.
Economy
The economy of Bay Pines is largely based on tourism and services. The area is home to several hotels, restaurants, and other businesses catering to tourists. The Bay Pines Marina is a popular destination for boaters and fishermen. The area is also home to several government facilities, including the Bay Pines VA Medical Center and the Bay Pines National Cemetery.
Demographics
As of the census of 2000, there were 8,839 people, 3,845 households, and 2,541 families residing in the CDP. The population density was 2,150.3 people per square mile (830.2/km2). There were 4,093 housing units at an average density of 990.2/sq mi (382.2/km2). The racial makeup of the CDP was 92.2% White, 3.2% African American, 0.3% Native American, 1.3% Asian, 0.1% Pacific Islander, 1.3% from other races, and 1.6% from two or more races. Hispanic or Latino of any race were 4.7% of the population.
There were 3,845 households, out of which 24.2% had children under the age of 18 living with them, 51.2% were married couples living together, 10.2% had a female householder with no husband present, and 35.2% were non-families. 28.2% of all households were made up of individuals, and 11.2% had someone living alone who was 65 years of age or older. The average household size was 2.30 and the average family size was 2.80.
In the CDP, the population was spread out, with 20.2% under the age of 18, 6.2% from 18 to 24, 27.2% from 25 to 44, 25.2% from 45 to 64, and 21.2% who were 65 years of age or older. The median age was 42 years. For every 100 females, there were 92.2 males. For every 100 females age 18 and over, there were 88.7 males.
The median income for a household in the CDP was $41,945, and the median income for a family was $50,945. Males had a median income of $36,945 versus $27,945 for females. The per capita income for the CDP was $22,945. About 5.2% of families and 7.2% of the population were below the poverty line, including 8.2% of those under age 18 and 6.2% of those age 65 or over.
Common Questions
What is Per Capita Income in Bay Pines?
Per Capita income in Bay Pines is $44,885.
What is the Median Family Income in Bay Pines?
Median Family Income in Bay Pines is $94,063.
What is the Median Household income in Bay Pines?
Median Household Income in Bay Pines is $71,635.
What is Income or Wage Gap in Bay Pines?
Income or Wage Gap in Bay Pines is 15.0%.
Women in Bay Pines earn 85.0 cents for every dollar earned by a man.
What is Inequality or Gini Index in Bay Pines?
Inequality or Gini Index in Bay Pines is 0.37.
What is the Total Population of Bay Pines?
Total Population of Bay Pines is 2,717.
What is the Total Male Population of Bay Pines?
Total Male Population of Bay Pines is 1,385.
What is the Total Female Population of Bay Pines?
Total Female Population of Bay Pines is 1,332.
What is the Ratio of Males per 100 Females in Bay Pines?
There are 103.98 Males per 100 Females in Bay Pines.
What is the Ratio of Females per 100 Males in Bay Pines?
There are 96.17 Females per 100 Males in Bay Pines.
What is the Median Population Age in Bay Pines?
Median Population Age in Bay Pines is 59.5 Years.
What is the Average Family Size in Bay Pines
Average Family Size in Bay Pines is 2.7 People.
What is the Average Household Size in Bay Pines
Average Household Size in Bay Pines is 2.1 People.
How Large is the Labor Force in Bay Pines?
There are 1,191 People in the Labor Forcein in Bay Pines.
What is the Percentage of People in the Labor Force in Bay Pines?
49.7% of People are in the Labor Force in Bay Pines.
What is the Unemployment Rate in Bay Pines?
Unemployment Rate in Bay Pines is 0.8%.