Allentown, FL Map & Demographics
Allentown Map
Allentown Overview
$32,700
PER CAPITA INCOME
$63,029
AVG FAMILY INCOME
$37,527
AVG HOUSEHOLD INCOME
0.46
INEQUALITY / GINI INDEX
1,030
TOTAL POPULATION
452
MALE POPULATION
578
FEMALE POPULATION
78.20
MALES / 100 FEMALES
127.88
FEMALES / 100 MALES
41.3
MEDIAN AGE
3.1
AVG FAMILY SIZE
2.3
AVG HOUSEHOLD SIZE
276
LABOR FORCE [ PEOPLE ]
36.3%
PERCENT IN LABOR FORCE
Income in Allentown
Income Overview in Allentown
Per Capita Income in Allentown is $32,700, while median incomes of families and households are $63,029 and $37,527 respectively.
| Characteristic | Number | Measure |
| Per Capita Income | 1,030 | $32,700 |
| Median Family Income | 267 | $63,029 |
| Mean Family Income | 267 | $88,869 |
| Median Household Income | 443 | $37,527 |
| Mean Household Income | 443 | $72,805 |
| Income Deficit | 267 | $0 |
| Wage / Income Gap (%) | 1,030 | 0.00% |
| Wage / Income Gap ($) | 1,030 | 100.00¢ per $1 |
| Gini / Inequality Index | 1,030 | 0.46 |
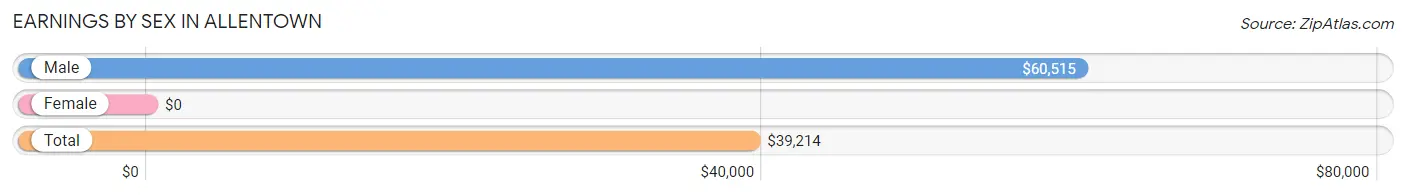
Earnings by Sex in Allentown
| Sex | Number | Average Earnings |
| Male | 167 (48.0%) | $60,515 |
| Female | 181 (52.0%) | $0 |
| Total | 348 (100.0%) | $39,214 |
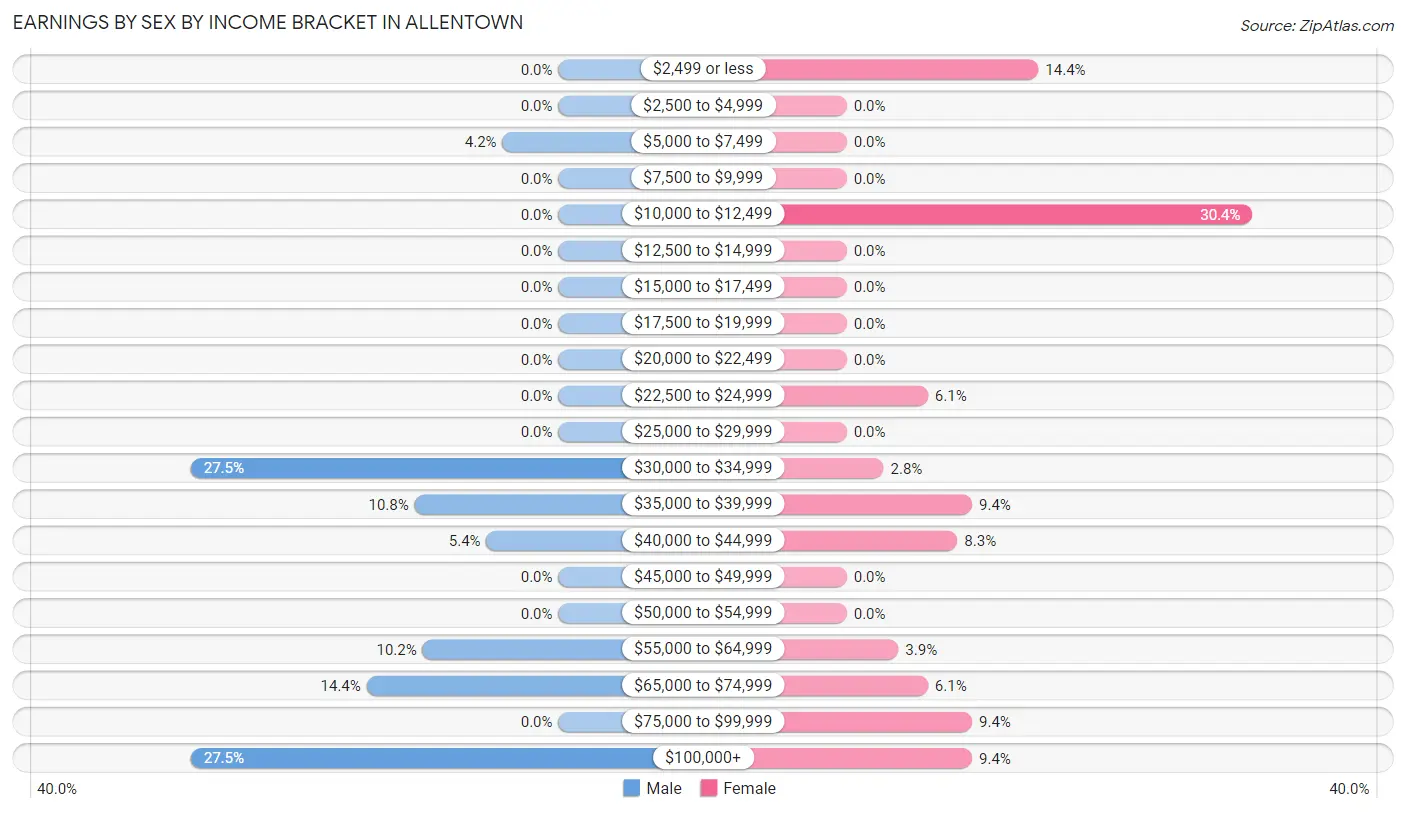
Earnings by Sex by Income Bracket in Allentown
The most common earnings brackets in Allentown are $30,000 to $34,999 for men (46 | 27.5%) and $10,000 to $12,499 for women (55 | 30.4%).
| Income | Male | Female |
| $2,499 or less | 0 (0.0%) | 26 (14.4%) |
| $2,500 to $4,999 | 0 (0.0%) | 0 (0.0%) |
| $5,000 to $7,499 | 7 (4.2%) | 0 (0.0%) |
| $7,500 to $9,999 | 0 (0.0%) | 0 (0.0%) |
| $10,000 to $12,499 | 0 (0.0%) | 55 (30.4%) |
| $12,500 to $14,999 | 0 (0.0%) | 0 (0.0%) |
| $15,000 to $17,499 | 0 (0.0%) | 0 (0.0%) |
| $17,500 to $19,999 | 0 (0.0%) | 0 (0.0%) |
| $20,000 to $22,499 | 0 (0.0%) | 0 (0.0%) |
| $22,500 to $24,999 | 0 (0.0%) | 11 (6.1%) |
| $25,000 to $29,999 | 0 (0.0%) | 0 (0.0%) |
| $30,000 to $34,999 | 46 (27.5%) | 5 (2.8%) |
| $35,000 to $39,999 | 18 (10.8%) | 17 (9.4%) |
| $40,000 to $44,999 | 9 (5.4%) | 15 (8.3%) |
| $45,000 to $49,999 | 0 (0.0%) | 0 (0.0%) |
| $50,000 to $54,999 | 0 (0.0%) | 0 (0.0%) |
| $55,000 to $64,999 | 17 (10.2%) | 7 (3.9%) |
| $65,000 to $74,999 | 24 (14.4%) | 11 (6.1%) |
| $75,000 to $99,999 | 0 (0.0%) | 17 (9.4%) |
| $100,000+ | 46 (27.5%) | 17 (9.4%) |
| Total | 167 (100.0%) | 181 (100.0%) |
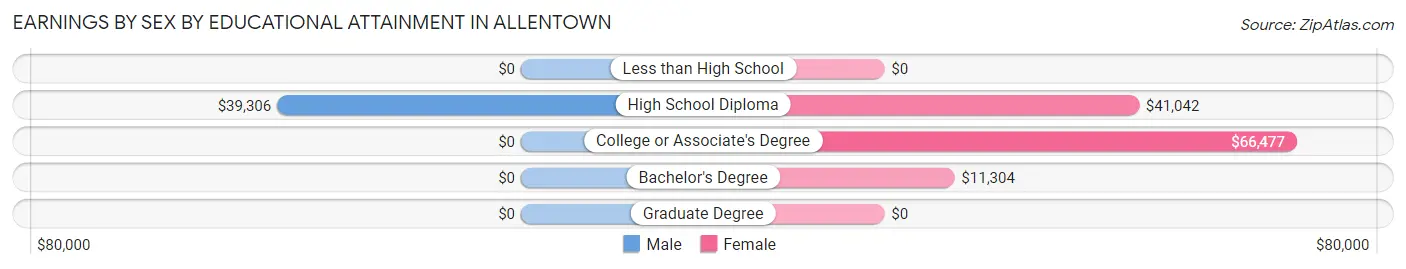
Earnings by Sex by Educational Attainment in Allentown
Average earnings in Allentown are $60,515 for men and $38,603 for women, a difference of 36.2%. Men with an educational attainment of high school diploma enjoy the highest average annual earnings of $39,306, while those with high school diploma education earn the least with $39,306. Women with an educational attainment of college or associate's degree earn the most with the average annual earnings of $66,477, while those with bachelor's degree education have the smallest earnings of $11,304.
| Educational Attainment | Male Income | Female Income |
| Less than High School | - | - |
| High School Diploma | $39,306 | $41,042 |
| College or Associate's Degree | - | - |
| Bachelor's Degree | - | - |
| Graduate Degree | - | - |
| Total | $60,515 | $38,603 |
Family Income in Allentown
Family Income Brackets in Allentown
According to the Allentown family income data, there are 62 families falling into the $50,000 to $74,999 income range, which is the most common income bracket and makes up 23.2% of all families.
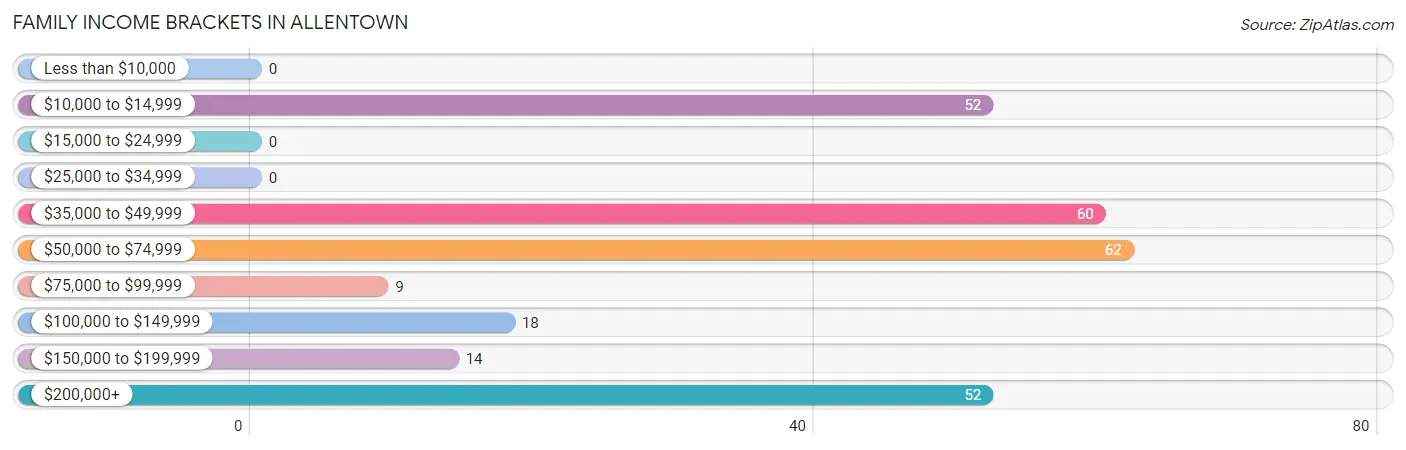
| Income Bracket | # Families | % Families |
| Less than $10,000 | 0 | 0.0% |
| $10,000 to $14,999 | 52 | 19.5% |
| $15,000 to $24,999 | 0 | 0.0% |
| $25,000 to $34,999 | 0 | 0.0% |
| $35,000 to $49,999 | 60 | 22.5% |
| $50,000 to $74,999 | 62 | 23.2% |
| $75,000 to $99,999 | 9 | 3.4% |
| $100,000 to $149,999 | 18 | 6.7% |
| $150,000 to $199,999 | 14 | 5.2% |
| $200,000+ | 52 | 19.5% |
Family Income by Famaliy Size in Allentown
2-person families (118 | 44.2%) account for the highest median family income in Allentown with $62,596 per family, while 2-person families (118 | 44.2%) have the highest median income of $31,298 per family member.
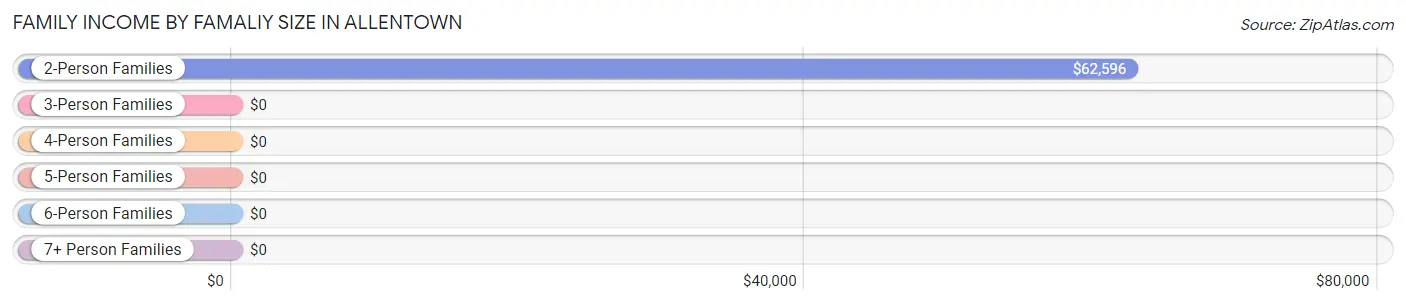
| Income Bracket | # Families | Median Income |
| 2-Person Families | 118 (44.2%) | $62,596 |
| 3-Person Families | 9 (3.4%) | $0 |
| 4-Person Families | 90 (33.7%) | $0 |
| 5-Person Families | 50 (18.7%) | $0 |
| 6-Person Families | 0 (0.0%) | $0 |
| 7+ Person Families | 0 (0.0%) | $0 |
| Total | 267 (100.0%) | $63,029 |
Family Income by Number of Earners in Allentown
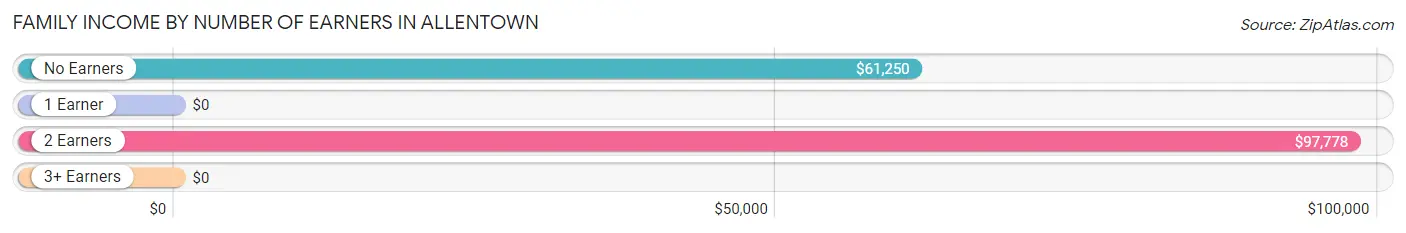
| Number of Earners | # Families | Median Income |
| No Earners | 75 (28.1%) | $61,250 |
| 1 Earner | 133 (49.8%) | $0 |
| 2 Earners | 54 (20.2%) | $97,778 |
| 3+ Earners | 5 (1.9%) | $0 |
| Total | 267 (100.0%) | $63,029 |
Household Income in Allentown
Household Income Brackets in Allentown
With 129 households falling in the category, the $25,000 to $34,999 income range is the most frequent in Allentown, accounting for 29.1% of all households. In contrast, only 7 households (1.6%) fall into the less than $10,000 income bracket, making it the least populous group.
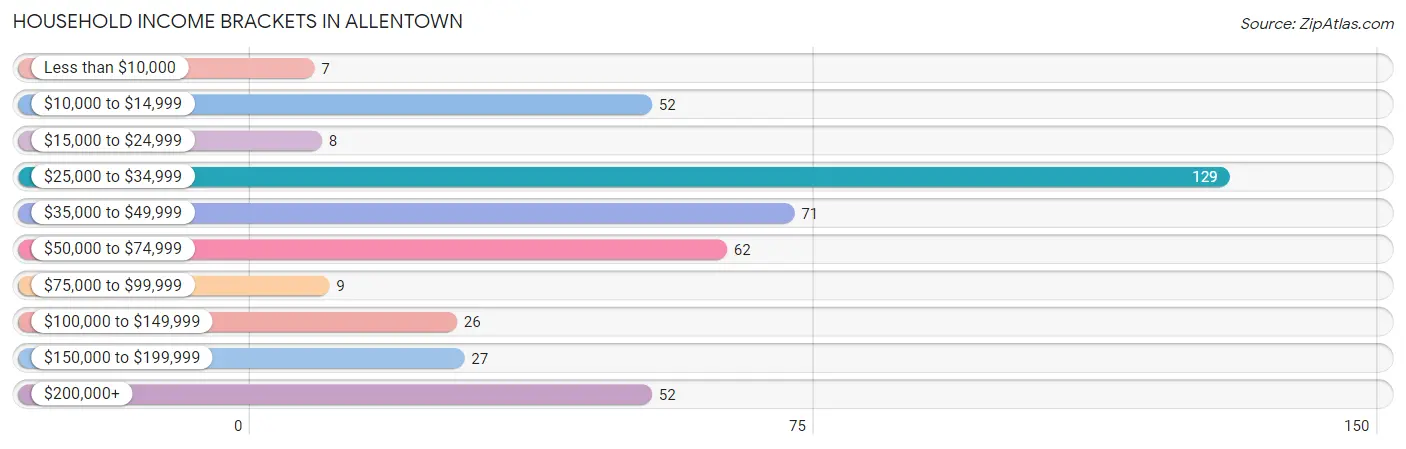
| Income Bracket | # Households | % Households |
| Less than $10,000 | 7 | 1.6% |
| $10,000 to $14,999 | 52 | 11.7% |
| $15,000 to $24,999 | 8 | 1.8% |
| $25,000 to $34,999 | 129 | 29.1% |
| $35,000 to $49,999 | 71 | 16.0% |
| $50,000 to $74,999 | 62 | 14.0% |
| $75,000 to $99,999 | 9 | 2.0% |
| $100,000 to $149,999 | 26 | 5.9% |
| $150,000 to $199,999 | 27 | 6.1% |
| $200,000+ | 52 | 11.7% |
Household Income by Householder Age in Allentown
| Income Bracket | # Households | Median Income |
| 15 to 24 Years | 0 (0.0%) | $0 |
| 25 to 44 Years | 124 (28.0%) | $0 |
| 45 to 64 Years | 212 (47.9%) | $0 |
| 65+ Years | 107 (24.1%) | $0 |
| Total | 443 (100.0%) | $37,527 |
Poverty in Allentown
Income Below Poverty by Sex and Age in Allentown
With 20.8% poverty level for males and 10.5% for females among the residents of Allentown, 5 year old males and 25 to 34 year old females are the most vulnerable to poverty, with 7 males (100.0%) and 46 females (45.5%) in their respective age groups living below the poverty level.
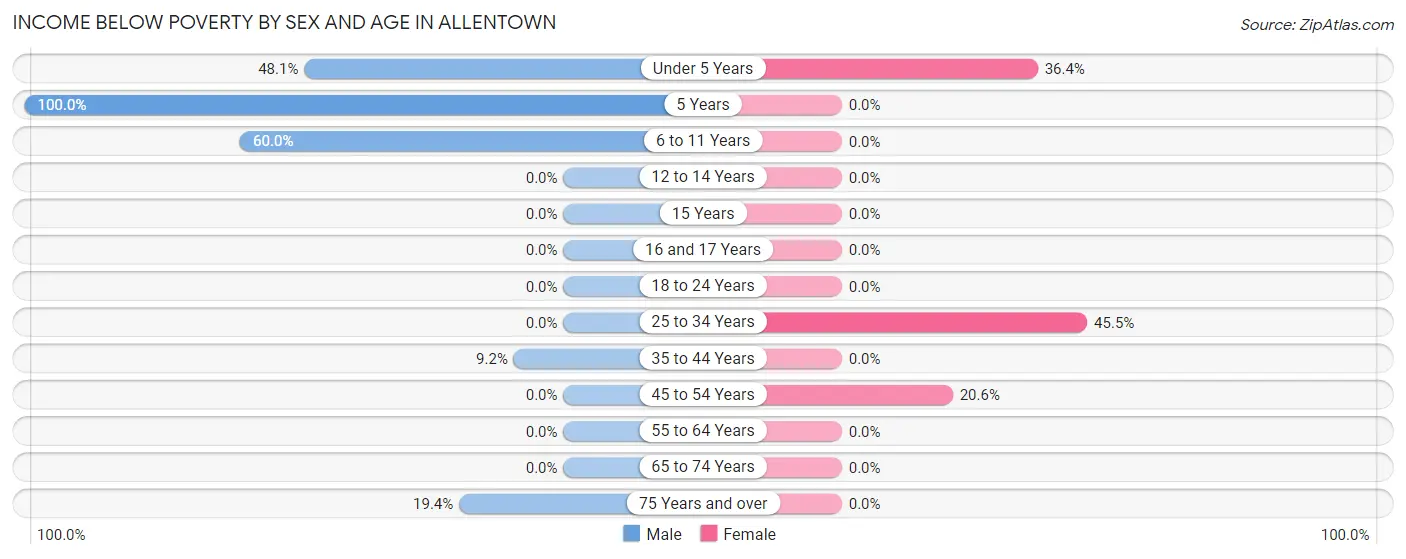
| Age Bracket | Male | Female |
| Under 5 Years | 38 (48.1%) | 8 (36.4%) |
| 5 Years | 7 (100.0%) | 0 (0.0%) |
| 6 to 11 Years | 36 (60.0%) | 0 (0.0%) |
| 12 to 14 Years | 0 (0.0%) | 0 (0.0%) |
| 15 Years | 0 (0.0%) | 0 (0.0%) |
| 16 and 17 Years | 0 (0.0%) | 0 (0.0%) |
| 18 to 24 Years | 0 (0.0%) | 0 (0.0%) |
| 25 to 34 Years | 0 (0.0%) | 46 (45.5%) |
| 35 to 44 Years | 7 (9.2%) | 0 (0.0%) |
| 45 to 54 Years | 0 (0.0%) | 7 (20.6%) |
| 55 to 64 Years | 0 (0.0%) | 0 (0.0%) |
| 65 to 74 Years | 0 (0.0%) | 0 (0.0%) |
| 75 Years and over | 6 (19.4%) | 0 (0.0%) |
| Total | 94 (20.8%) | 61 (10.5%) |
Income Above Poverty by Sex and Age in Allentown
According to the poverty statistics in Allentown, males aged 15 years and females aged 5 years are the age groups that are most secure financially, with 100.0% of males and 100.0% of females in these age groups living above the poverty line.
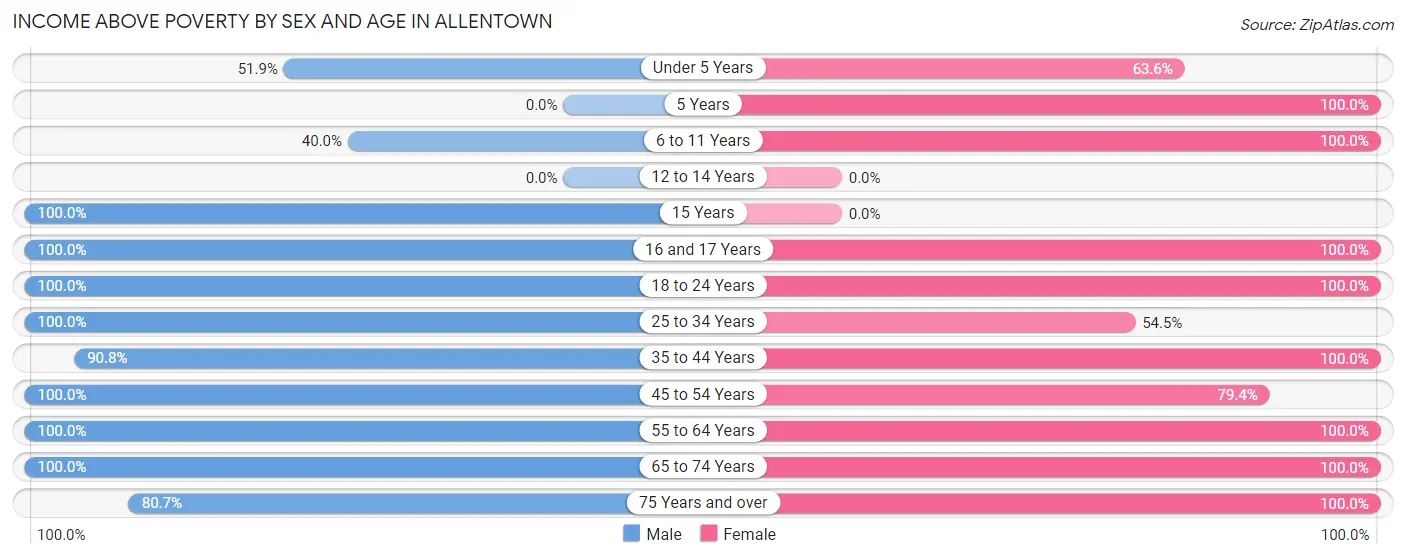
| Age Bracket | Male | Female |
| Under 5 Years | 41 (51.9%) | 14 (63.6%) |
| 5 Years | 0 (0.0%) | 38 (100.0%) |
| 6 to 11 Years | 24 (40.0%) | 50 (100.0%) |
| 12 to 14 Years | 0 (0.0%) | 0 (0.0%) |
| 15 Years | 14 (100.0%) | 0 (0.0%) |
| 16 and 17 Years | 14 (100.0%) | 30 (100.0%) |
| 18 to 24 Years | 14 (100.0%) | 9 (100.0%) |
| 25 to 34 Years | 18 (100.0%) | 55 (54.5%) |
| 35 to 44 Years | 69 (90.8%) | 9 (100.0%) |
| 45 to 54 Years | 50 (100.0%) | 27 (79.4%) |
| 55 to 64 Years | 62 (100.0%) | 182 (100.0%) |
| 65 to 74 Years | 27 (100.0%) | 64 (100.0%) |
| 75 Years and over | 25 (80.6%) | 39 (100.0%) |
| Total | 358 (79.2%) | 517 (89.4%) |
Income Below Poverty Among Married-Couple Families in Allentown
The poverty statistics for married-couple families in Allentown show that 4.3% or 6 of the total 139 families live below the poverty line. Families with 3 or 4 children have the highest poverty rate of 12.0%, comprising of 6 families. On the other hand, families with no children have the lowest poverty rate of 0.0%, which includes 0 families.
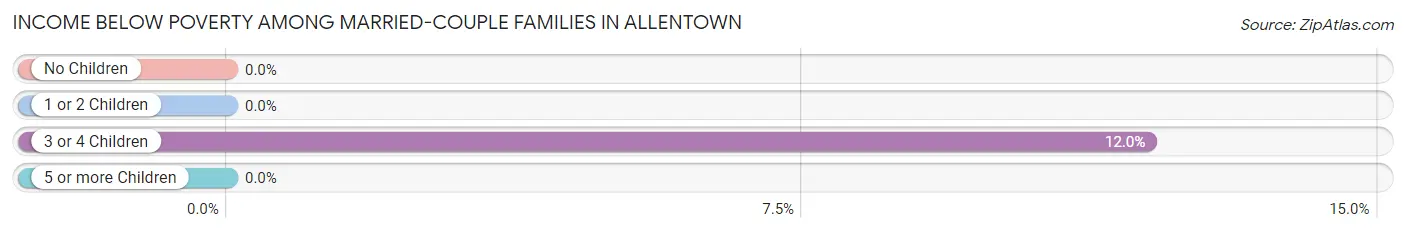
| Children | Above Poverty | Below Poverty |
| No Children | 80 (100.0%) | 0 (0.0%) |
| 1 or 2 Children | 9 (100.0%) | 0 (0.0%) |
| 3 or 4 Children | 44 (88.0%) | 6 (12.0%) |
| 5 or more Children | 0 (0.0%) | 0 (0.0%) |
| Total | 133 (95.7%) | 6 (4.3%) |
Income Below Poverty Among Single-Parent Households in Allentown
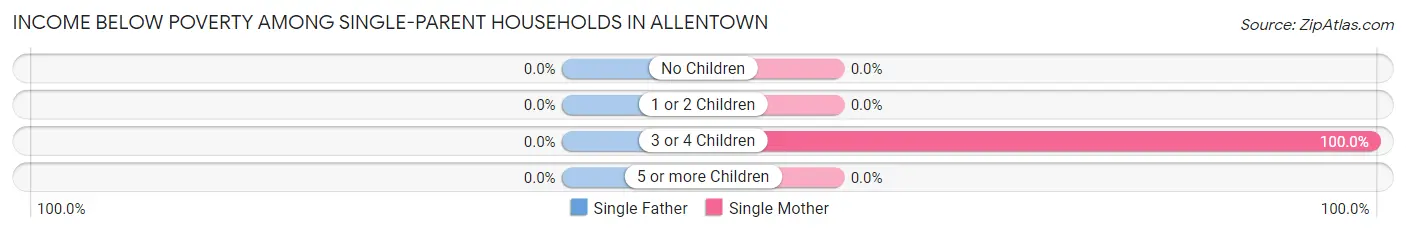
| Children | Single Father | Single Mother |
| No Children | 0 (0.0%) | 0 (0.0%) |
| 1 or 2 Children | 0 (0.0%) | 0 (0.0%) |
| 3 or 4 Children | 0 (0.0%) | 46 (100.0%) |
| 5 or more Children | 0 (0.0%) | 0 (0.0%) |
| Total | 0 (0.0%) | 46 (41.8%) |
Income Below Poverty Among Married-Couple vs Single-Parent Households in Allentown
The poverty data for Allentown shows that 6 of the married-couple family households (4.3%) and 46 of the single-parent households (35.9%) are living below the poverty level. Within the married-couple family households, those with 3 or 4 children have the highest poverty rate, with 6 households (12.0%) falling below the poverty line. Among the single-parent households, those with 3 or 4 children have the highest poverty rate, with 46 household (71.9%) living below poverty.
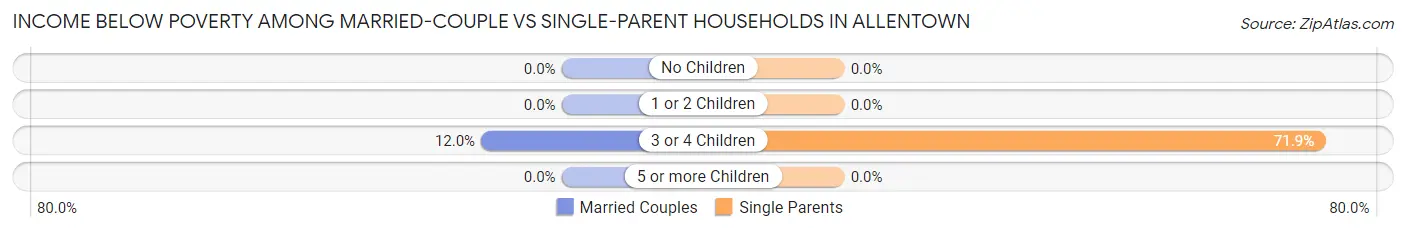
| Children | Married-Couple Families | Single-Parent Households |
| No Children | 0 (0.0%) | 0 (0.0%) |
| 1 or 2 Children | 0 (0.0%) | 0 (0.0%) |
| 3 or 4 Children | 6 (12.0%) | 46 (71.9%) |
| 5 or more Children | 0 (0.0%) | 0 (0.0%) |
| Total | 6 (4.3%) | 46 (35.9%) |
Race in Allentown
The most populous races in Allentown are White / Caucasian (811 | 78.7%), Black / African American (149 | 14.5%), and Two or more Races (66 | 6.4%).
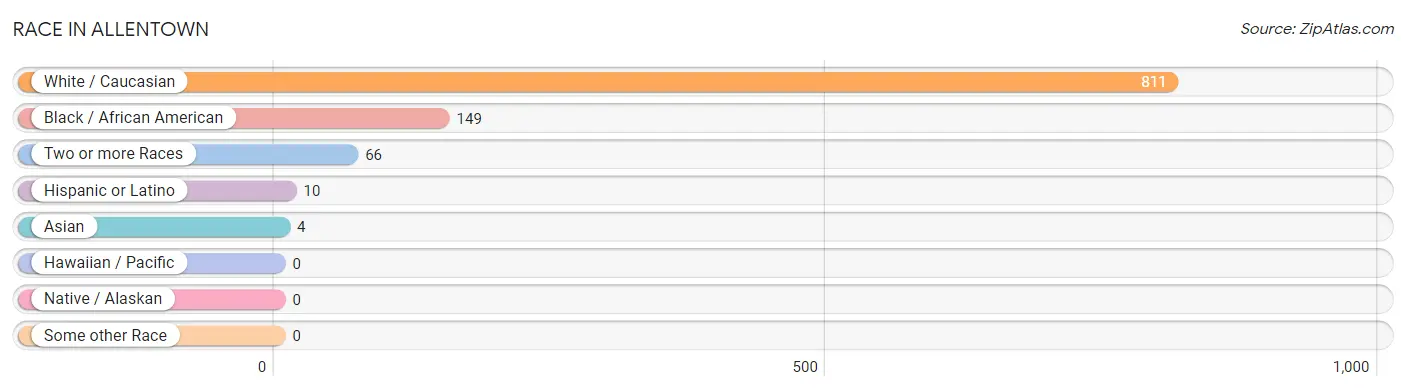
| Race | # Population | % Population |
| Asian | 4 | 0.4% |
| Black / African American | 149 | 14.5% |
| Hawaiian / Pacific | 0 | 0.0% |
| Hispanic or Latino | 10 | 1.0% |
| Native / Alaskan | 0 | 0.0% |
| White / Caucasian | 811 | 78.7% |
| Two or more Races | 66 | 6.4% |
| Some other Race | 0 | 0.0% |
| Total | 1,030 | 100.0% |
Ancestry in Allentown
The most populous ancestries reported in Allentown are Irish (274 | 26.6%), Subsaharan African (151 | 14.7%), Nigerian (113 | 11.0%), German (78 | 7.6%), and Jamaican (78 | 7.6%), together accounting for 67.4% of all Allentown residents.
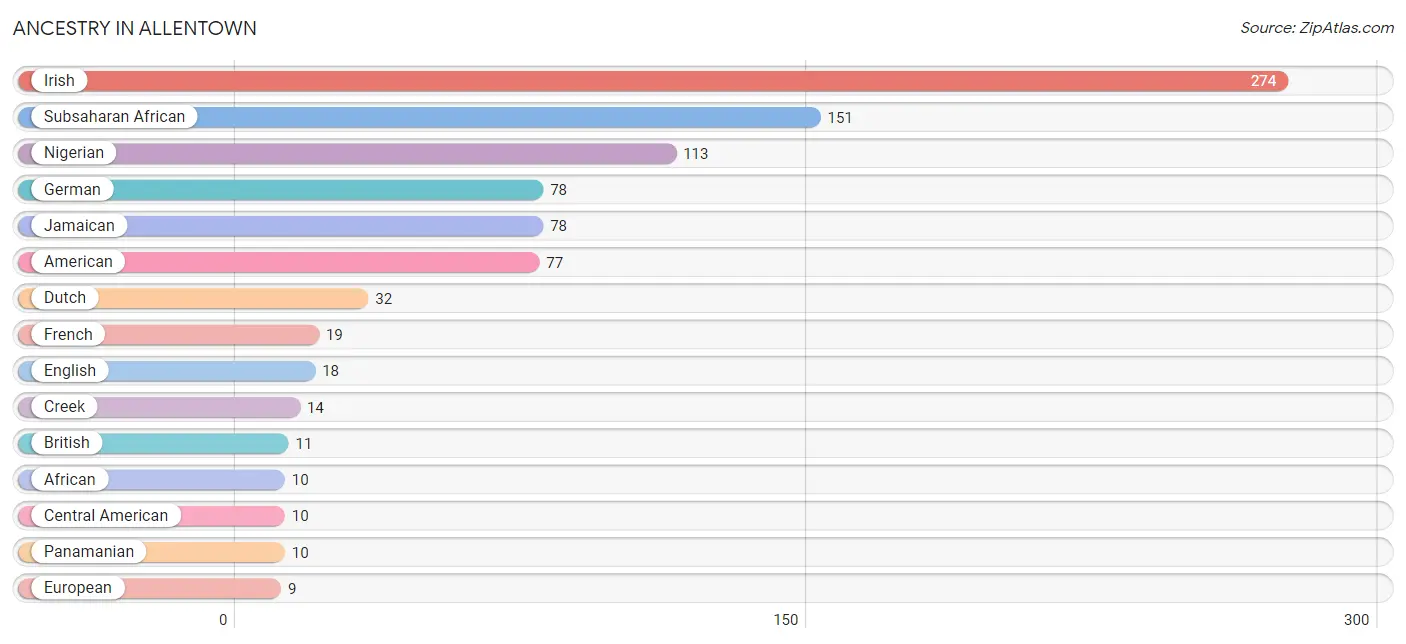
| Ancestry | # Population | % Population |
| African | 10 | 1.0% |
| American | 77 | 7.5% |
| British | 11 | 1.1% |
| Central American | 10 | 1.0% |
| Creek | 14 | 1.4% |
| Dutch | 32 | 3.1% |
| English | 18 | 1.8% |
| European | 9 | 0.9% |
| French | 19 | 1.8% |
| German | 78 | 7.6% |
| Irish | 274 | 26.6% |
| Italian | 9 | 0.9% |
| Jamaican | 78 | 7.6% |
| Malaysian | 4 | 0.4% |
| Nigerian | 113 | 11.0% |
| Panamanian | 10 | 1.0% |
| Subsaharan African | 151 | 14.7% |
| Welsh | 9 | 0.9% | View All 18 Rows |
Immigrants in Allentown
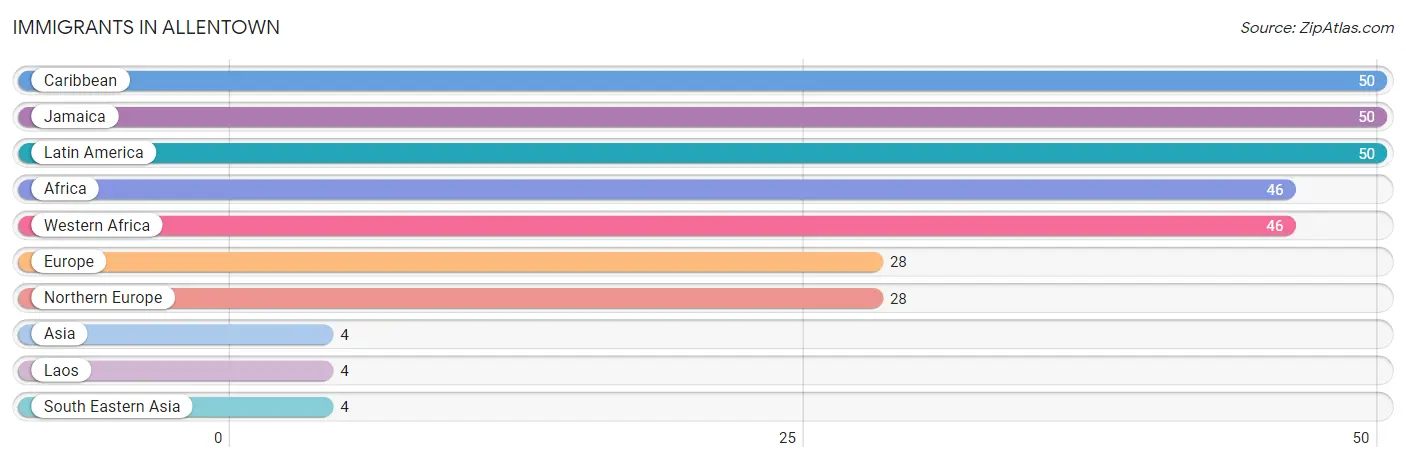
The most numerous immigrant groups reported in Allentown came from Caribbean (50 | 4.9%), Jamaica (50 | 4.9%), Latin America (50 | 4.9%), Africa (46 | 4.5%), and Western Africa (46 | 4.5%), together accounting for 23.5% of all Allentown residents.
| Immigration Origin | # Population | % Population |
| Africa | 46 | 4.5% |
| Asia | 4 | 0.4% |
| Caribbean | 50 | 4.9% |
| Europe | 28 | 2.7% |
| Jamaica | 50 | 4.9% |
| Laos | 4 | 0.4% |
| Latin America | 50 | 4.9% |
| Northern Europe | 28 | 2.7% |
| South Eastern Asia | 4 | 0.4% |
| Western Africa | 46 | 4.5% | View All 10 Rows |
Sex and Age in Allentown
Sex and Age in Allentown
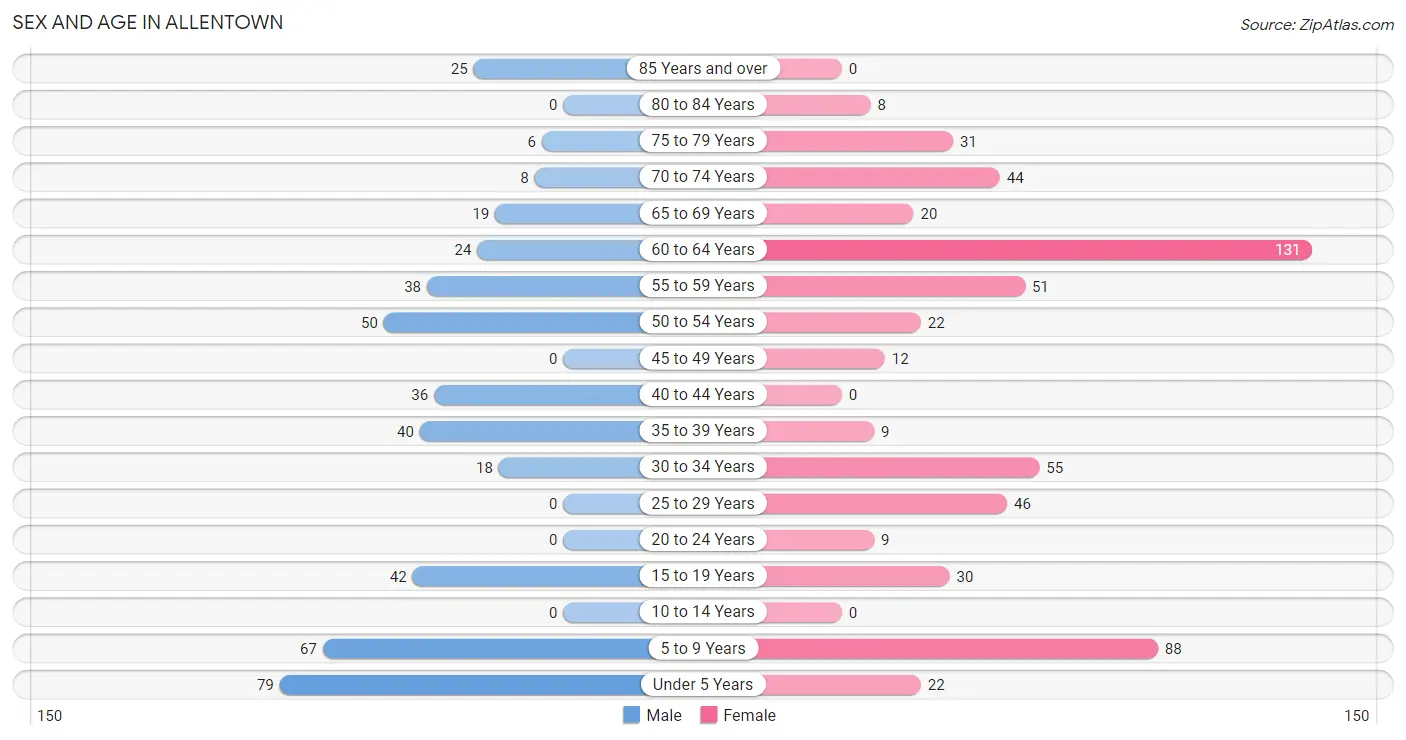
The most populous age groups in Allentown are Under 5 Years (79 | 17.5%) for men and 60 to 64 Years (131 | 22.7%) for women.
| Age Bracket | Male | Female |
| Under 5 Years | 79 (17.5%) | 22 (3.8%) |
| 5 to 9 Years | 67 (14.8%) | 88 (15.2%) |
| 10 to 14 Years | 0 (0.0%) | 0 (0.0%) |
| 15 to 19 Years | 42 (9.3%) | 30 (5.2%) |
| 20 to 24 Years | 0 (0.0%) | 9 (1.6%) |
| 25 to 29 Years | 0 (0.0%) | 46 (8.0%) |
| 30 to 34 Years | 18 (4.0%) | 55 (9.5%) |
| 35 to 39 Years | 40 (8.8%) | 9 (1.6%) |
| 40 to 44 Years | 36 (8.0%) | 0 (0.0%) |
| 45 to 49 Years | 0 (0.0%) | 12 (2.1%) |
| 50 to 54 Years | 50 (11.1%) | 22 (3.8%) |
| 55 to 59 Years | 38 (8.4%) | 51 (8.8%) |
| 60 to 64 Years | 24 (5.3%) | 131 (22.7%) |
| 65 to 69 Years | 19 (4.2%) | 20 (3.5%) |
| 70 to 74 Years | 8 (1.8%) | 44 (7.6%) |
| 75 to 79 Years | 6 (1.3%) | 31 (5.4%) |
| 80 to 84 Years | 0 (0.0%) | 8 (1.4%) |
| 85 Years and over | 25 (5.5%) | 0 (0.0%) |
| Total | 452 (100.0%) | 578 (100.0%) |
Families and Households in Allentown
Median Family Size in Allentown
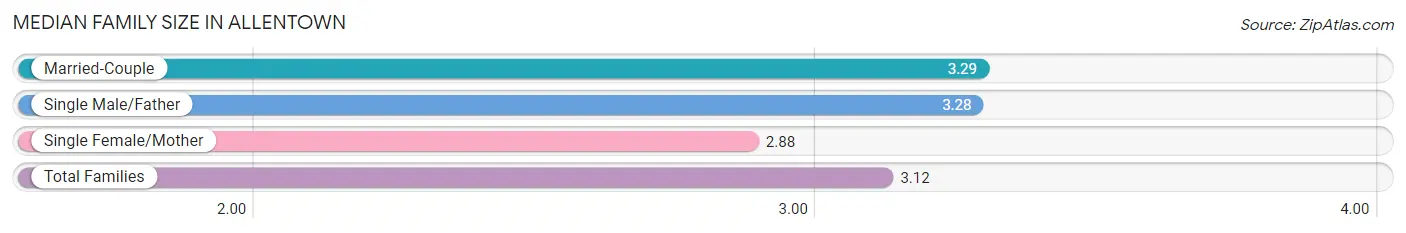
The median family size in Allentown is 3.12 persons per family, with married-couple families (139 | 52.1%) accounting for the largest median family size of 3.29 persons per family. On the other hand, single female/mother families (110 | 41.2%) represent the smallest median family size with 2.88 persons per family.
| Family Type | # Families | Family Size |
| Married-Couple | 139 (52.1%) | 3.29 |
| Single Male/Father | 18 (6.7%) | 3.28 |
| Single Female/Mother | 110 (41.2%) | 2.88 |
| Total Families | 267 (100.0%) | 3.12 |
Median Household Size in Allentown
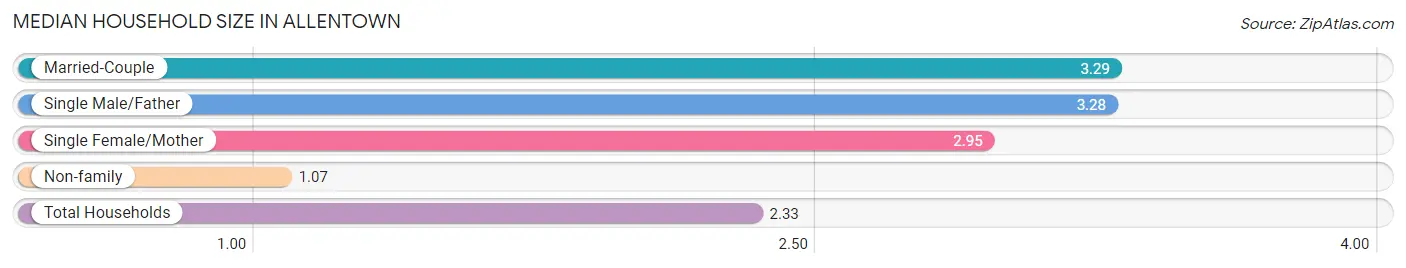
The median household size in Allentown is 2.33 persons per household, with married-couple households (139 | 31.4%) accounting for the largest median household size of 3.29 persons per household. non-family households (176 | 39.7%) represent the smallest median household size with 1.07 persons per household.
| Household Type | # Households | Household Size |
| Married-Couple | 139 (31.4%) | 3.29 |
| Single Male/Father | 18 (4.1%) | 3.28 |
| Single Female/Mother | 110 (24.8%) | 2.95 |
| Non-family | 176 (39.7%) | 1.07 |
| Total Households | 443 (100.0%) | 2.33 |
Household Size by Marriage Status in Allentown
Out of a total of 443 households in Allentown, 267 (60.3%) are family households, while 176 (39.7%) are nonfamily households. The most numerous type of family households are 2-person households, comprising 118, and the most common type of nonfamily households are 1-person households, comprising 172.
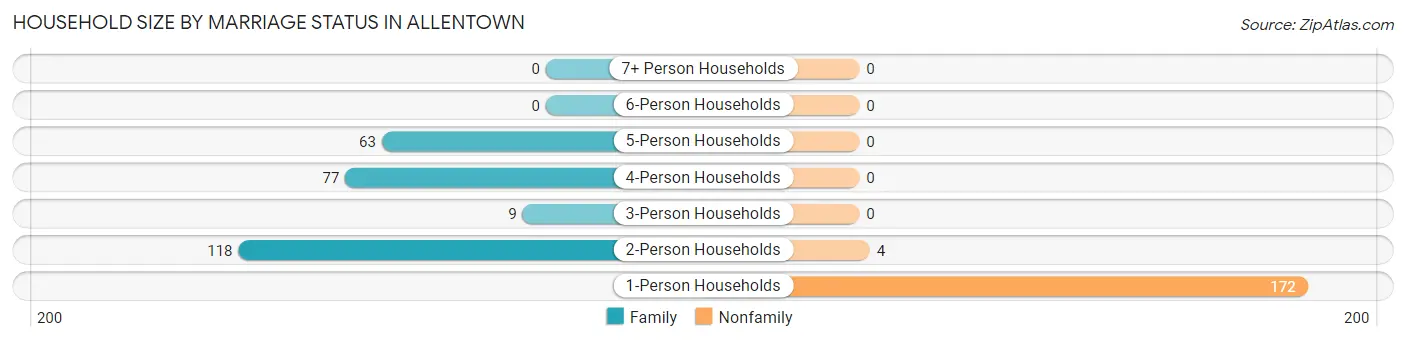
| Household Size | Family Households | Nonfamily Households |
| 1-Person Households | - | 172 (38.8%) |
| 2-Person Households | 118 (26.6%) | 4 (0.9%) |
| 3-Person Households | 9 (2.0%) | 0 (0.0%) |
| 4-Person Households | 77 (17.4%) | 0 (0.0%) |
| 5-Person Households | 63 (14.2%) | 0 (0.0%) |
| 6-Person Households | 0 (0.0%) | 0 (0.0%) |
| 7+ Person Households | 0 (0.0%) | 0 (0.0%) |
| Total | 267 (60.3%) | 176 (39.7%) |
Female Fertility in Allentown
Fertility by Age in Allentown
Average fertility rate in Allentown is 286.0 births per 1,000 women. Women in the age bracket of 20 to 34 years have the highest fertility rate with 418.0 births per 1,000 women. Women in the age bracket of 20 to 34 years acount for 100.0% of all women with births.
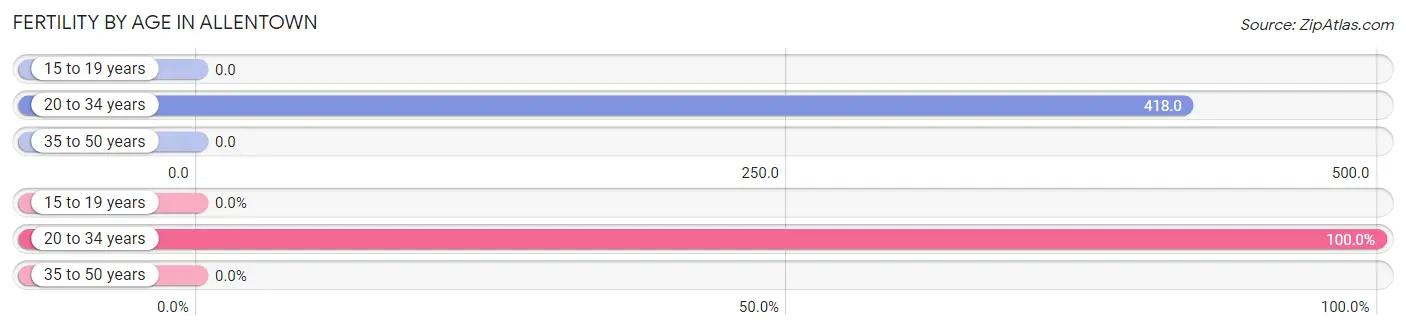
| Age Bracket | Women with Births | Births / 1,000 Women |
| 15 to 19 years | 0 (0.0%) | 0.0 |
| 20 to 34 years | 46 (100.0%) | 418.0 |
| 35 to 50 years | 0 (0.0%) | 0.0 |
| Total | 46 (100.0%) | 286.0 |
Fertility by Age by Marriage Status in Allentown
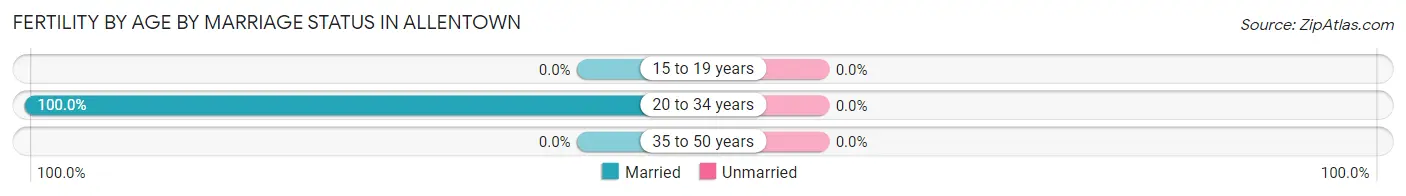
| Age Bracket | Married | Unmarried |
| 15 to 19 years | 0 (0.0%) | 0 (0.0%) |
| 20 to 34 years | 46 (100.0%) | 0 (0.0%) |
| 35 to 50 years | 0 (0.0%) | 0 (0.0%) |
| Total | 46 (100.0%) | 0 (0.0%) |
Fertility by Education in Allentown
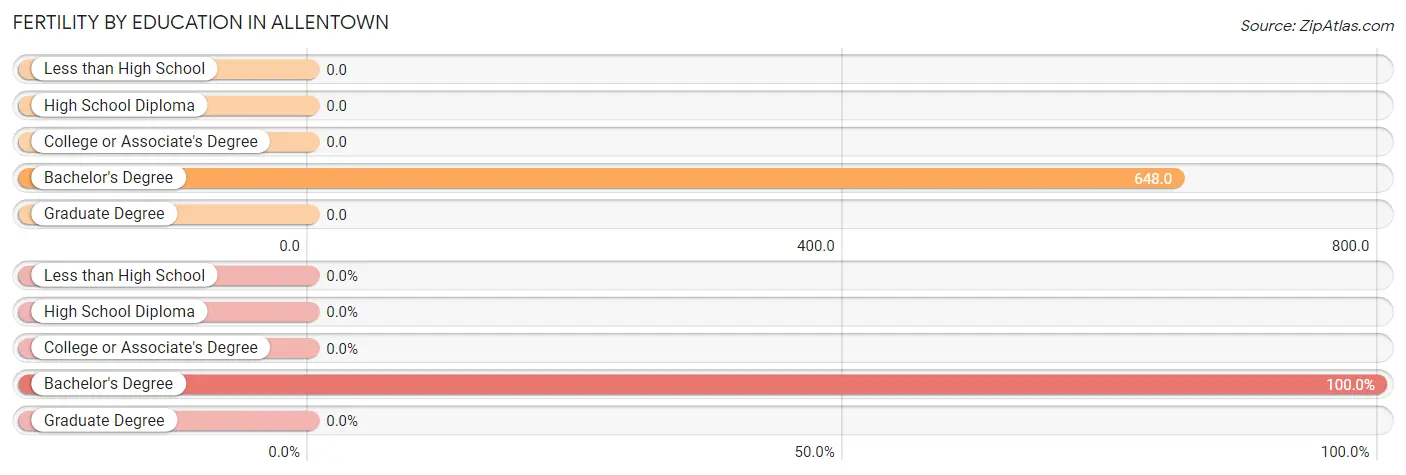
| Educational Attainment | Women with Births | Births / 1,000 Women |
| Less than High School | 0 (0.0%) | 0.0 |
| High School Diploma | 0 (0.0%) | 0.0 |
| College or Associate's Degree | 0 (0.0%) | 0.0 |
| Bachelor's Degree | 46 (100.0%) | 648.0 |
| Graduate Degree | 0 (0.0%) | 0.0 |
| Total | 46 (100.0%) | 286.0 |
Fertility by Education by Marriage Status in Allentown
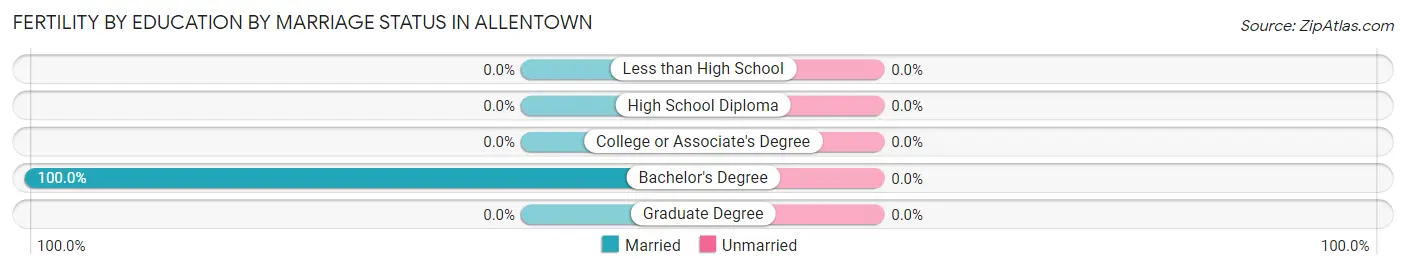
| Educational Attainment | Married | Unmarried |
| Less than High School | 0 (0.0%) | 0 (0.0%) |
| High School Diploma | 0 (0.0%) | 0 (0.0%) |
| College or Associate's Degree | 0 (0.0%) | 0 (0.0%) |
| Bachelor's Degree | 46 (100.0%) | 0 (0.0%) |
| Graduate Degree | 0 (0.0%) | 0 (0.0%) |
| Total | 46 (100.0%) | 0 (0.0%) |
Employment Characteristics in Allentown
Employment by Class of Employer in Allentown
Among the 276 employed individuals in Allentown, private company employees (166 | 60.1%), state government employees (44 | 15.9%), and local government employees (23 | 8.3%) make up the most common classes of employment.
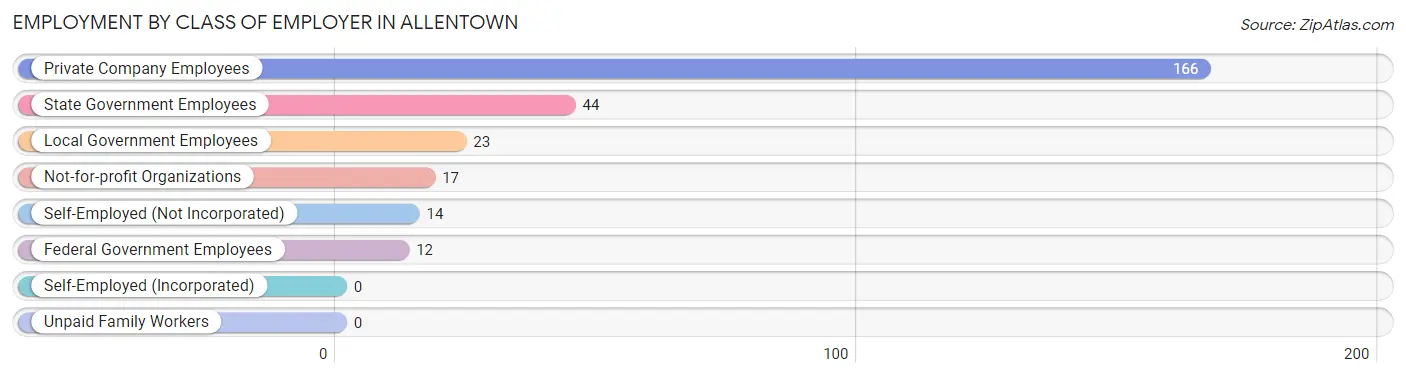
| Employer Class | # Employees | % Employees |
| Private Company Employees | 166 | 60.1% |
| Self-Employed (Incorporated) | 0 | 0.0% |
| Self-Employed (Not Incorporated) | 14 | 5.1% |
| Not-for-profit Organizations | 17 | 6.2% |
| Local Government Employees | 23 | 8.3% |
| State Government Employees | 44 | 15.9% |
| Federal Government Employees | 12 | 4.3% |
| Unpaid Family Workers | 0 | 0.0% |
| Total | 276 | 100.0% |
Employment Status by Age in Allentown
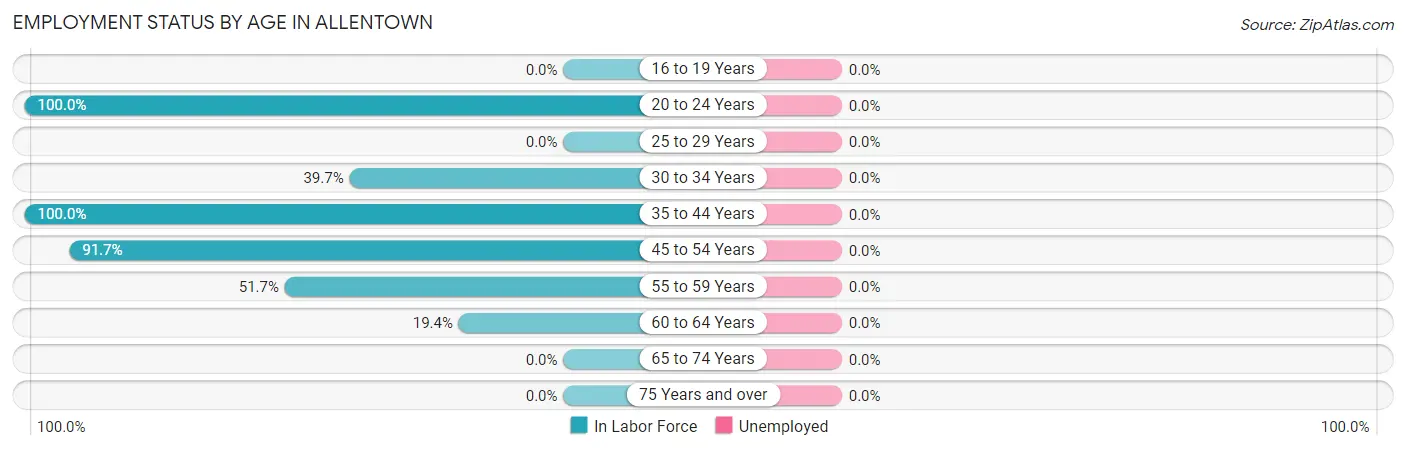
| Age Bracket | In Labor Force | Unemployed |
| 16 to 19 Years | 0 (0.0%) | 0 (0.0%) |
| 20 to 24 Years | 9 (100.0%) | 0 (0.0%) |
| 25 to 29 Years | 0 (0.0%) | 0 (0.0%) |
| 30 to 34 Years | 29 (39.7%) | 0 (0.0%) |
| 35 to 44 Years | 85 (100.0%) | 0 (0.0%) |
| 45 to 54 Years | 77 (91.7%) | 0 (0.0%) |
| 55 to 59 Years | 46 (51.7%) | 0 (0.0%) |
| 60 to 64 Years | 30 (19.4%) | 0 (0.0%) |
| 65 to 74 Years | 0 (0.0%) | 0 (0.0%) |
| 75 Years and over | 0 (0.0%) | 0 (0.0%) |
| Total | 276 (36.3%) | 0 (0.0%) |
Employment Status by Educational Attainment in Allentown
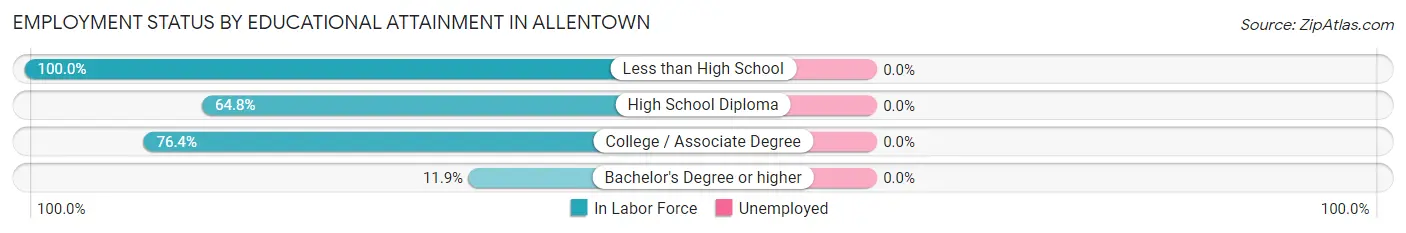
| Educational Attainment | In Labor Force | Unemployed |
| Less than High School | 6 (100.0%) | 0 (0.0%) |
| High School Diploma | 59 (64.8%) | 0 (0.0%) |
| College / Associate Degree | 178 (76.4%) | 0 (0.0%) |
| Bachelor's Degree or higher | 24 (11.9%) | 0 (0.0%) |
| Total | 267 (50.2%) | 0 (0.0%) |
Employment Occupations by Sex in Allentown
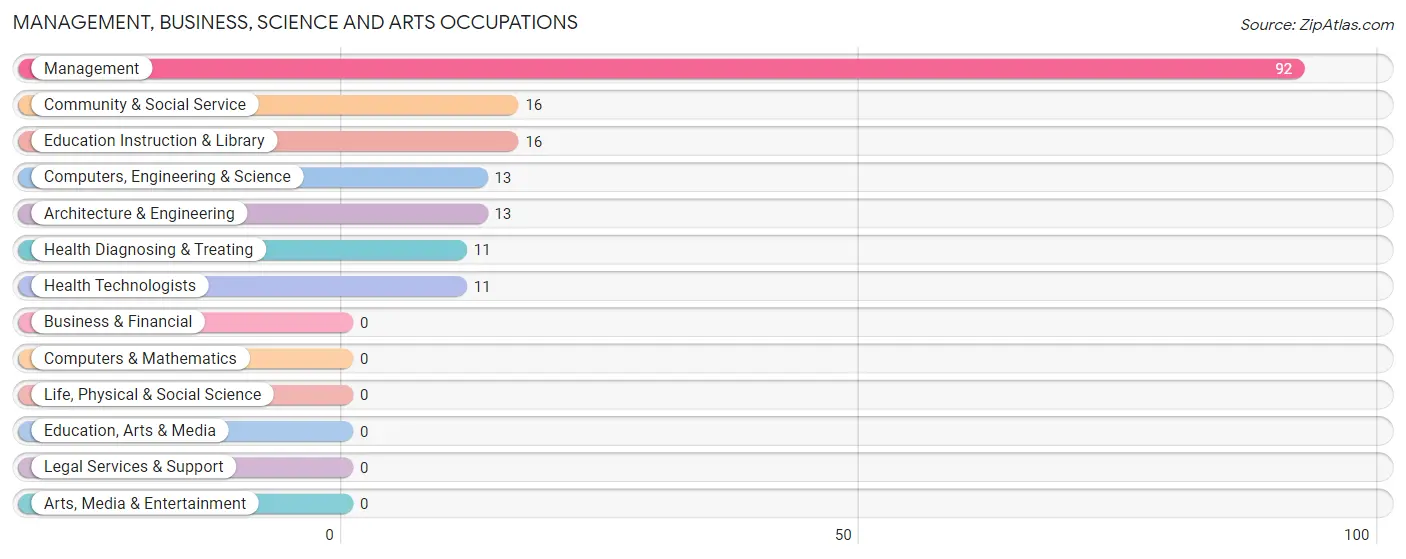
Management, Business, Science and Arts Occupations
The most common Management, Business, Science and Arts occupations in Allentown are Management (92 | 33.3%), Community & Social Service (16 | 5.8%), Education Instruction & Library (16 | 5.8%), Computers, Engineering & Science (13 | 4.7%), and Architecture & Engineering (13 | 4.7%).
Management, Business, Science and Arts Occupations by Sex
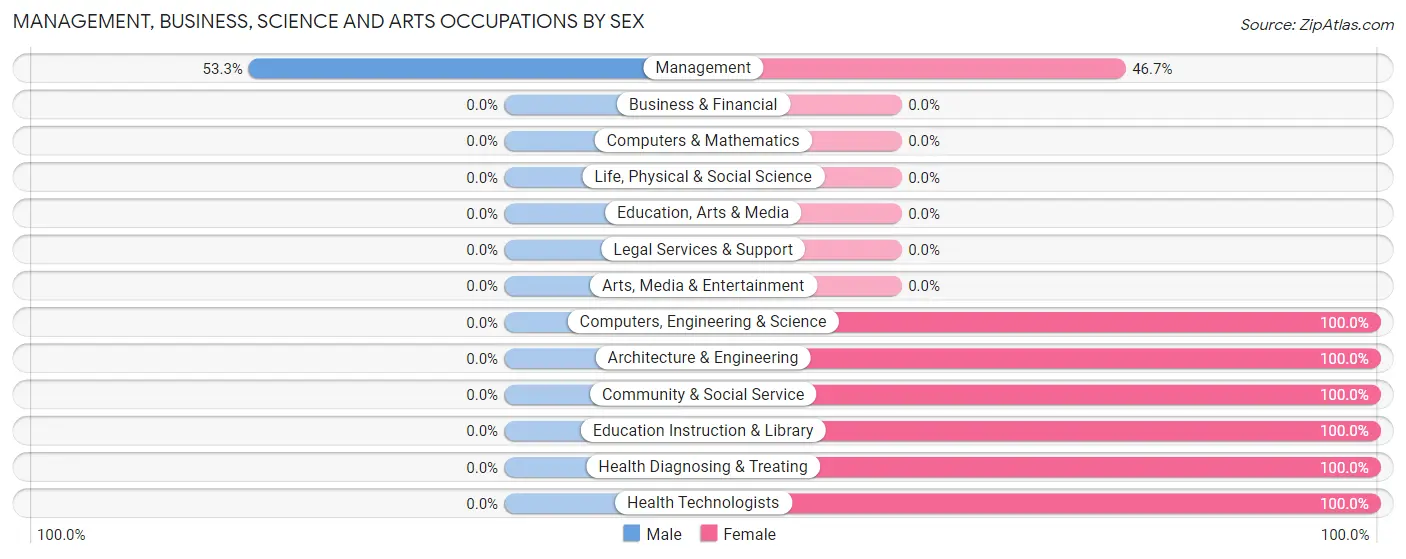
| Occupation | Male | Female |
| Management | 49 (53.3%) | 43 (46.7%) |
| Business & Financial | 0 (0.0%) | 0 (0.0%) |
| Computers, Engineering & Science | 0 (0.0%) | 13 (100.0%) |
| Computers & Mathematics | 0 (0.0%) | 0 (0.0%) |
| Architecture & Engineering | 0 (0.0%) | 13 (100.0%) |
| Life, Physical & Social Science | 0 (0.0%) | 0 (0.0%) |
| Community & Social Service | 0 (0.0%) | 16 (100.0%) |
| Education, Arts & Media | 0 (0.0%) | 0 (0.0%) |
| Legal Services & Support | 0 (0.0%) | 0 (0.0%) |
| Education Instruction & Library | 0 (0.0%) | 16 (100.0%) |
| Arts, Media & Entertainment | 0 (0.0%) | 0 (0.0%) |
| Health Diagnosing & Treating | 0 (0.0%) | 11 (100.0%) |
| Health Technologists | 0 (0.0%) | 11 (100.0%) |
| Total (Category) | 49 (37.1%) | 83 (62.9%) |
| Total (Overall) | 167 (60.5%) | 109 (39.5%) |
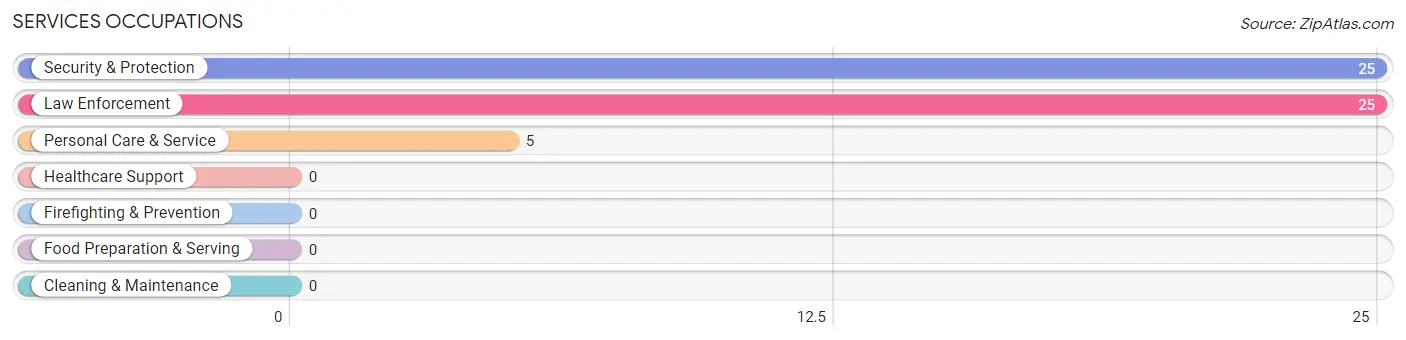
Services Occupations
The most common Services occupations in Allentown are Security & Protection (25 | 9.1%), Law Enforcement (25 | 9.1%), and Personal Care & Service (5 | 1.8%).
Services Occupations by Sex
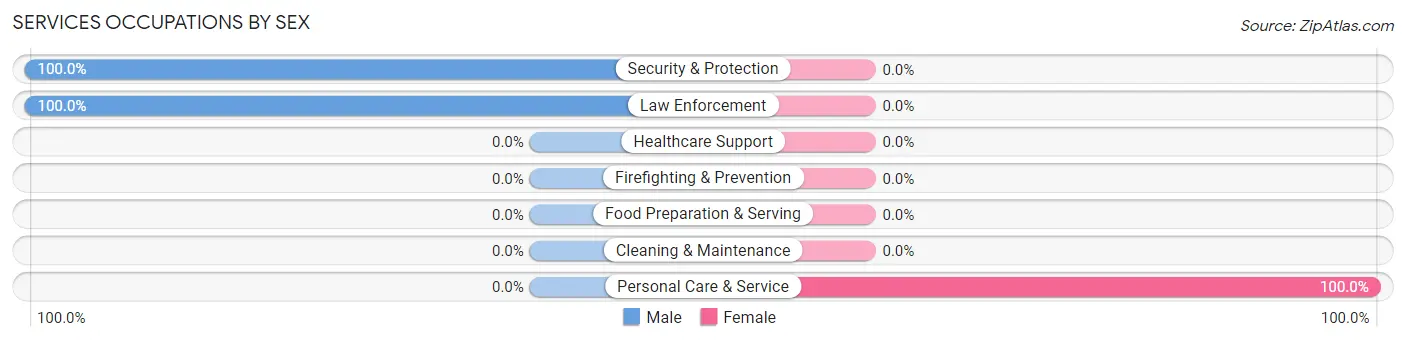
| Occupation | Male | Female |
| Healthcare Support | 0 (0.0%) | 0 (0.0%) |
| Security & Protection | 25 (100.0%) | 0 (0.0%) |
| Firefighting & Prevention | 0 (0.0%) | 0 (0.0%) |
| Law Enforcement | 25 (100.0%) | 0 (0.0%) |
| Food Preparation & Serving | 0 (0.0%) | 0 (0.0%) |
| Cleaning & Maintenance | 0 (0.0%) | 0 (0.0%) |
| Personal Care & Service | 0 (0.0%) | 5 (100.0%) |
| Total (Category) | 25 (83.3%) | 5 (16.7%) |
| Total (Overall) | 167 (60.5%) | 109 (39.5%) |
Sales and Office Occupations
The most common Sales and Office occupations in Allentown are Sales & Related (46 | 16.7%), and Office & Administration (6 | 2.2%).

Sales and Office Occupations by Sex

| Occupation | Male | Female |
| Sales & Related | 46 (100.0%) | 0 (0.0%) |
| Office & Administration | 0 (0.0%) | 6 (100.0%) |
| Total (Category) | 46 (88.5%) | 6 (11.5%) |
| Total (Overall) | 167 (60.5%) | 109 (39.5%) |
Natural Resources, Construction and Maintenance Occupations
The most common Natural Resources, Construction and Maintenance occupations in Allentown are Installation, Maintenance & Repair (21 | 7.6%), and Construction & Extraction (6 | 2.2%).

Natural Resources, Construction and Maintenance Occupations by Sex

| Occupation | Male | Female |
| Farming, Fishing & Forestry | 0 (0.0%) | 0 (0.0%) |
| Construction & Extraction | 6 (100.0%) | 0 (0.0%) |
| Installation, Maintenance & Repair | 21 (100.0%) | 0 (0.0%) |
| Total (Category) | 27 (100.0%) | 0 (0.0%) |
| Total (Overall) | 167 (60.5%) | 109 (39.5%) |
Production, Transportation and Moving Occupations
The most common Production, Transportation and Moving occupations in Allentown are Production (24 | 8.7%), and Material Moving (11 | 4.0%).
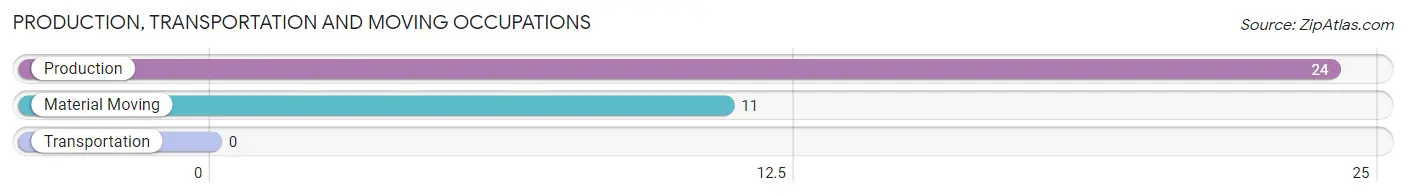
Production, Transportation and Moving Occupations by Sex
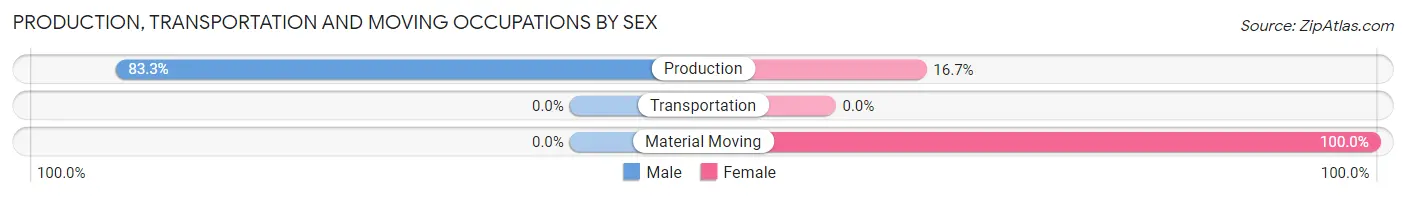
| Occupation | Male | Female |
| Production | 20 (83.3%) | 4 (16.7%) |
| Transportation | 0 (0.0%) | 0 (0.0%) |
| Material Moving | 0 (0.0%) | 11 (100.0%) |
| Total (Category) | 20 (57.1%) | 15 (42.9%) |
| Total (Overall) | 167 (60.5%) | 109 (39.5%) |
Employment Industries by Sex in Allentown
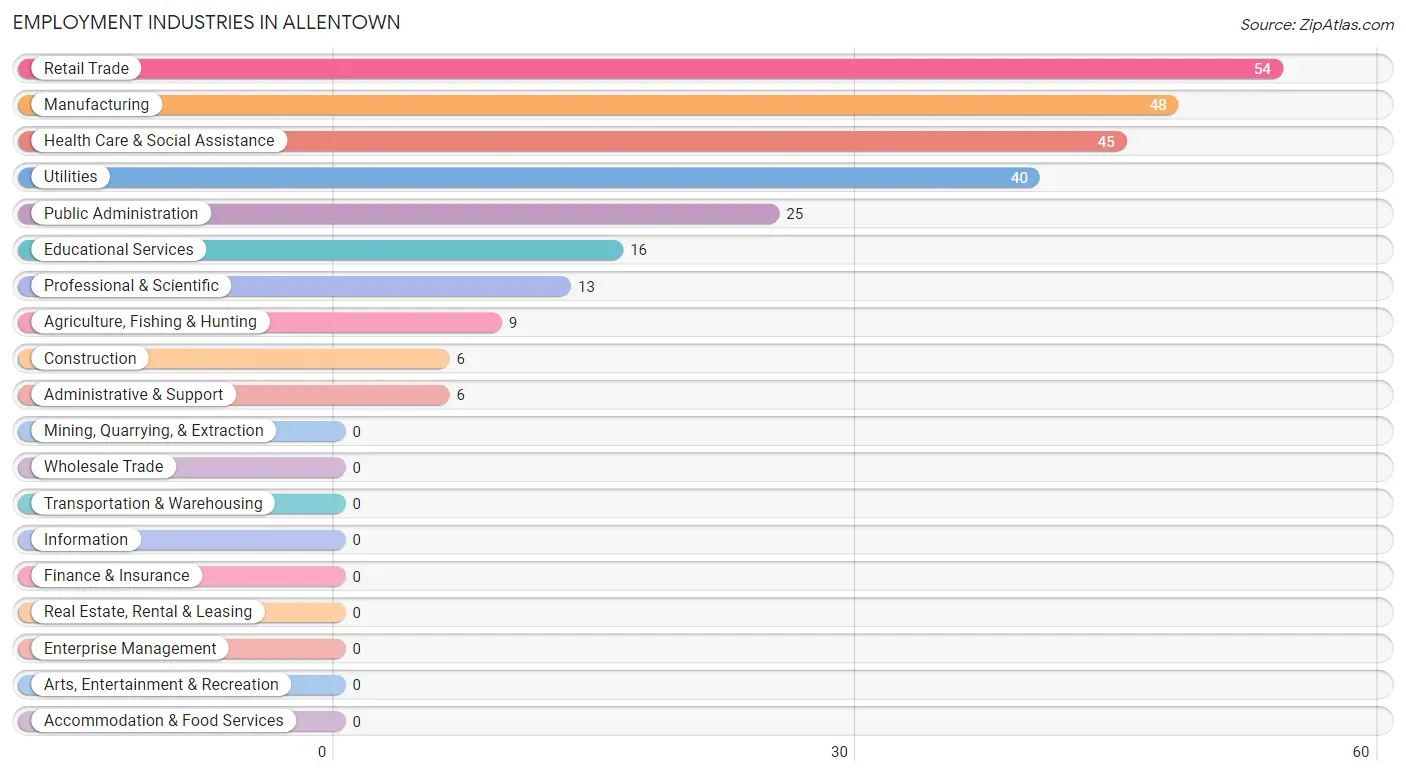
Employment Industries in Allentown
The major employment industries in Allentown include Retail Trade (54 | 19.6%), Manufacturing (48 | 17.4%), Health Care & Social Assistance (45 | 16.3%), Utilities (40 | 14.5%), and Public Administration (25 | 9.1%).
Employment Industries by Sex in Allentown
The Allentown industries that see more men than women are Agriculture, Fishing & Hunting (100.0%), Construction (100.0%), and Retail Trade (100.0%), whereas the industries that tend to have a higher number of women are Professional & Scientific (100.0%), Administrative & Support (100.0%), and Educational Services (100.0%).
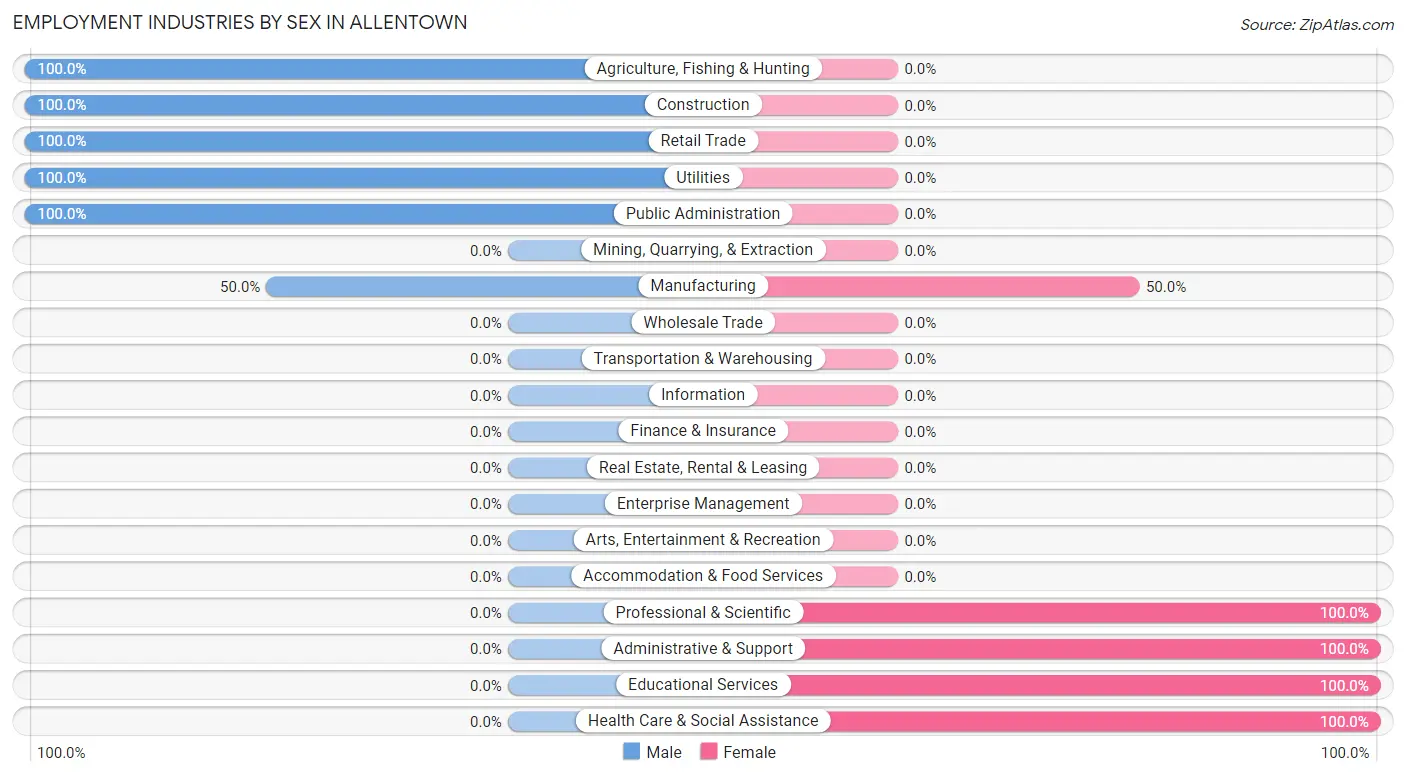
| Industry | Male | Female |
| Agriculture, Fishing & Hunting | 9 (100.0%) | 0 (0.0%) |
| Mining, Quarrying, & Extraction | 0 (0.0%) | 0 (0.0%) |
| Construction | 6 (100.0%) | 0 (0.0%) |
| Manufacturing | 24 (50.0%) | 24 (50.0%) |
| Wholesale Trade | 0 (0.0%) | 0 (0.0%) |
| Retail Trade | 54 (100.0%) | 0 (0.0%) |
| Transportation & Warehousing | 0 (0.0%) | 0 (0.0%) |
| Utilities | 40 (100.0%) | 0 (0.0%) |
| Information | 0 (0.0%) | 0 (0.0%) |
| Finance & Insurance | 0 (0.0%) | 0 (0.0%) |
| Real Estate, Rental & Leasing | 0 (0.0%) | 0 (0.0%) |
| Professional & Scientific | 0 (0.0%) | 13 (100.0%) |
| Enterprise Management | 0 (0.0%) | 0 (0.0%) |
| Administrative & Support | 0 (0.0%) | 6 (100.0%) |
| Educational Services | 0 (0.0%) | 16 (100.0%) |
| Health Care & Social Assistance | 0 (0.0%) | 45 (100.0%) |
| Arts, Entertainment & Recreation | 0 (0.0%) | 0 (0.0%) |
| Accommodation & Food Services | 0 (0.0%) | 0 (0.0%) |
| Public Administration | 25 (100.0%) | 0 (0.0%) |
| Total | 167 (60.5%) | 109 (39.5%) |
Education in Allentown
School Enrollment in Allentown
The most common levels of schooling among the 158 students in Allentown are elementary school (74 | 46.8%), kindergarten (43 | 27.2%), and high school (25 | 15.8%).
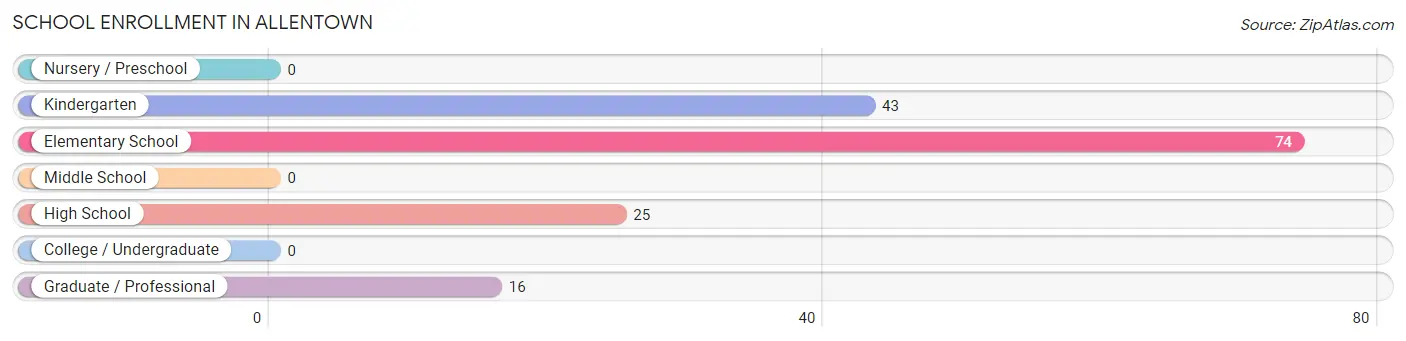
| School Level | # Students | % Students |
| Nursery / Preschool | 0 | 0.0% |
| Kindergarten | 43 | 27.2% |
| Elementary School | 74 | 46.8% |
| Middle School | 0 | 0.0% |
| High School | 25 | 15.8% |
| College / Undergraduate | 0 | 0.0% |
| Graduate / Professional | 16 | 10.1% |
| Total | 158 | 100.0% |
School Enrollment by Age by Funding Source in Allentown
Out of a total of 158 students who are enrolled in schools in Allentown, 7 (4.4%) attend a private institution, while the remaining 151 (95.6%) are enrolled in public schools. The age group of 35 years and over has the highest likelihood of being enrolled in private schools, with 7 (100.0% in the age bracket) enrolled. Conversely, the age group of 5 to 9 year old has the lowest likelihood of being enrolled in a private school, with 117 (100.0% in the age bracket) attending a public institution.
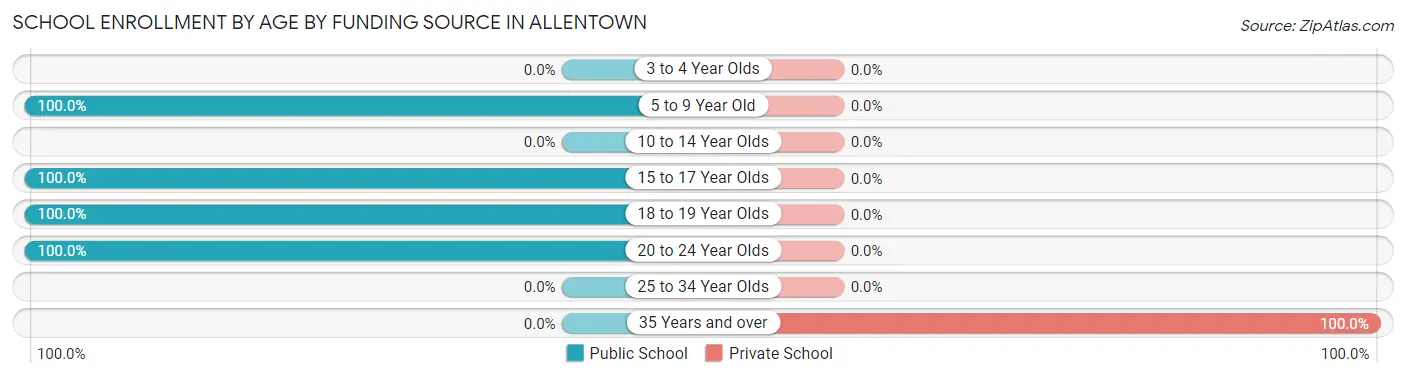
| Age Bracket | Public School | Private School |
| 3 to 4 Year Olds | 0 (0.0%) | 0 (0.0%) |
| 5 to 9 Year Old | 117 (100.0%) | 0 (0.0%) |
| 10 to 14 Year Olds | 0 (0.0%) | 0 (0.0%) |
| 15 to 17 Year Olds | 11 (100.0%) | 0 (0.0%) |
| 18 to 19 Year Olds | 14 (100.0%) | 0 (0.0%) |
| 20 to 24 Year Olds | 9 (100.0%) | 0 (0.0%) |
| 25 to 34 Year Olds | 0 (0.0%) | 0 (0.0%) |
| 35 Years and over | 0 (0.0%) | 7 (100.0%) |
| Total | 151 (95.6%) | 7 (4.4%) |
Educational Attainment by Field of Study in Allentown
Education (158 | 66.1%), science & technology (46 | 19.3%), physical & health sciences (11 | 4.6%), social sciences (9 | 3.8%), and communications (8 | 3.4%) are the most common fields of study among 239 individuals in Allentown who have obtained a bachelor's degree or higher.
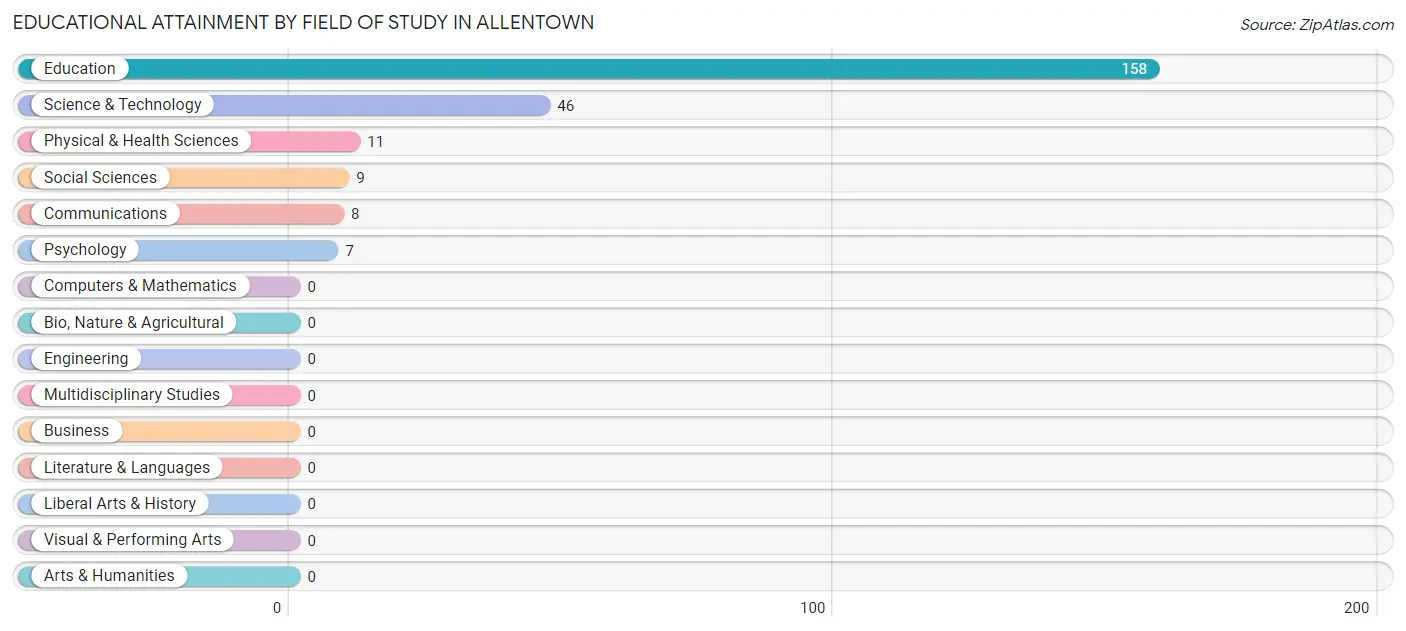
| Field of Study | # Graduates | % Graduates |
| Computers & Mathematics | 0 | 0.0% |
| Bio, Nature & Agricultural | 0 | 0.0% |
| Physical & Health Sciences | 11 | 4.6% |
| Psychology | 7 | 2.9% |
| Social Sciences | 9 | 3.8% |
| Engineering | 0 | 0.0% |
| Multidisciplinary Studies | 0 | 0.0% |
| Science & Technology | 46 | 19.3% |
| Business | 0 | 0.0% |
| Education | 158 | 66.1% |
| Literature & Languages | 0 | 0.0% |
| Liberal Arts & History | 0 | 0.0% |
| Visual & Performing Arts | 0 | 0.0% |
| Communications | 8 | 3.4% |
| Arts & Humanities | 0 | 0.0% |
| Total | 239 | 100.0% |
Transportation & Commute in Allentown
Vehicle Availability by Sex in Allentown
The most prevalent vehicle ownership categories in Allentown are males with 3 vehicles (89, accounting for 53.3%) and females with 3 vehicles (28, making up 81.7%).
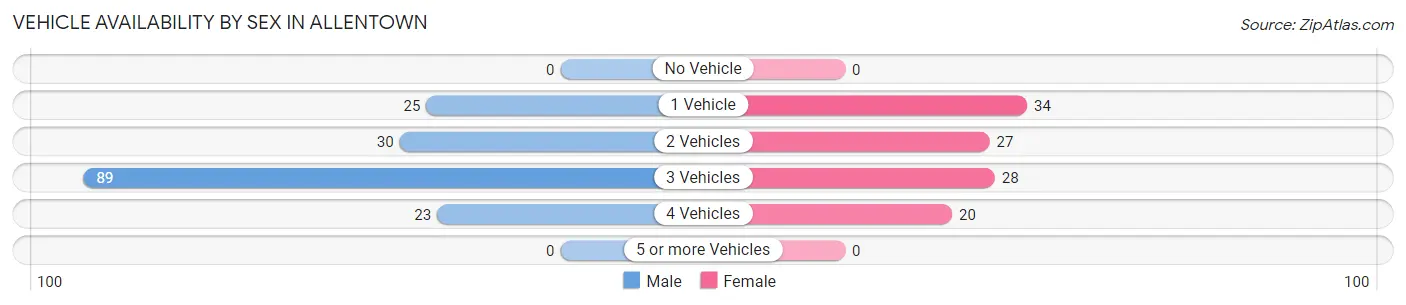
| Vehicles Available | Male | Female |
| No Vehicle | 0 (0.0%) | 0 (0.0%) |
| 1 Vehicle | 25 (15.0%) | 34 (31.2%) |
| 2 Vehicles | 30 (18.0%) | 27 (24.8%) |
| 3 Vehicles | 89 (53.3%) | 28 (25.7%) |
| 4 Vehicles | 23 (13.8%) | 20 (18.3%) |
| 5 or more Vehicles | 0 (0.0%) | 0 (0.0%) |
| Total | 167 (100.0%) | 109 (100.0%) |
Commute Time in Allentown
The most frequently occuring commute durations in Allentown are 30 to 34 minutes (50 commuters, 20.0%), 15 to 19 minutes (44 commuters, 17.6%), and 40 to 44 minutes (40 commuters, 16.0%).
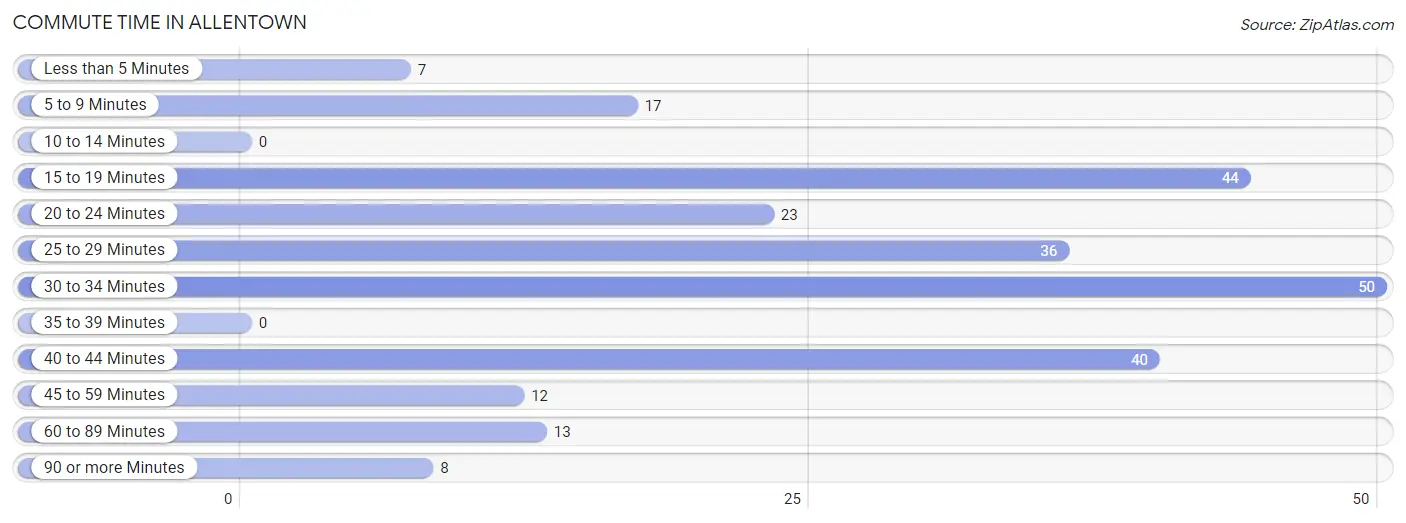
| Commute Time | # Commuters | % Commuters |
| Less than 5 Minutes | 7 | 2.8% |
| 5 to 9 Minutes | 17 | 6.8% |
| 10 to 14 Minutes | 0 | 0.0% |
| 15 to 19 Minutes | 44 | 17.6% |
| 20 to 24 Minutes | 23 | 9.2% |
| 25 to 29 Minutes | 36 | 14.4% |
| 30 to 34 Minutes | 50 | 20.0% |
| 35 to 39 Minutes | 0 | 0.0% |
| 40 to 44 Minutes | 40 | 16.0% |
| 45 to 59 Minutes | 12 | 4.8% |
| 60 to 89 Minutes | 13 | 5.2% |
| 90 or more Minutes | 8 | 3.2% |
Commute Time by Sex in Allentown
The most common commute times in Allentown are 30 to 34 minutes (46 commuters, 27.5%) for males and 5 to 9 minutes (17 commuters, 20.5%) for females.
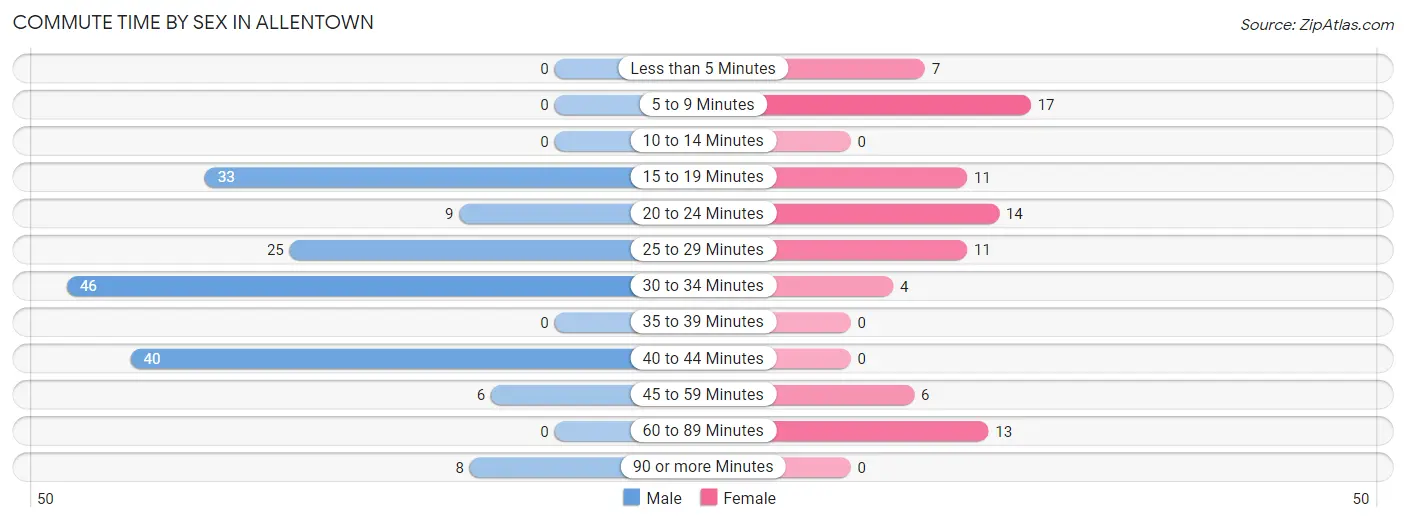
| Commute Time | Male | Female |
| Less than 5 Minutes | 0 (0.0%) | 7 (8.4%) |
| 5 to 9 Minutes | 0 (0.0%) | 17 (20.5%) |
| 10 to 14 Minutes | 0 (0.0%) | 0 (0.0%) |
| 15 to 19 Minutes | 33 (19.8%) | 11 (13.3%) |
| 20 to 24 Minutes | 9 (5.4%) | 14 (16.9%) |
| 25 to 29 Minutes | 25 (15.0%) | 11 (13.3%) |
| 30 to 34 Minutes | 46 (27.5%) | 4 (4.8%) |
| 35 to 39 Minutes | 0 (0.0%) | 0 (0.0%) |
| 40 to 44 Minutes | 40 (23.9%) | 0 (0.0%) |
| 45 to 59 Minutes | 6 (3.6%) | 6 (7.2%) |
| 60 to 89 Minutes | 0 (0.0%) | 13 (15.7%) |
| 90 or more Minutes | 8 (4.8%) | 0 (0.0%) |
Time of Departure to Work by Sex in Allentown
The most frequent times of departure to work in Allentown are 4:00 PM to 11:59 PM (54, 32.3%) for males and 7:30 AM to 7:59 AM (22, 26.5%) for females.
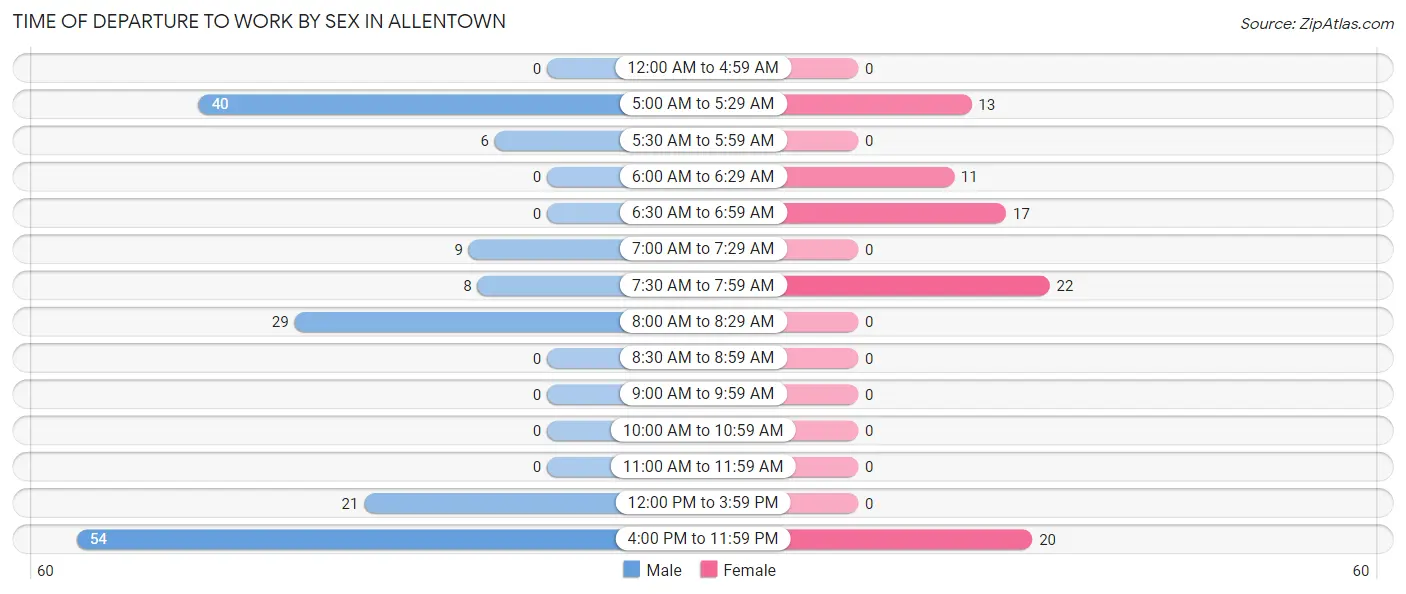
| Time of Departure | Male | Female |
| 12:00 AM to 4:59 AM | 0 (0.0%) | 0 (0.0%) |
| 5:00 AM to 5:29 AM | 40 (23.9%) | 13 (15.7%) |
| 5:30 AM to 5:59 AM | 6 (3.6%) | 0 (0.0%) |
| 6:00 AM to 6:29 AM | 0 (0.0%) | 11 (13.3%) |
| 6:30 AM to 6:59 AM | 0 (0.0%) | 17 (20.5%) |
| 7:00 AM to 7:29 AM | 9 (5.4%) | 0 (0.0%) |
| 7:30 AM to 7:59 AM | 8 (4.8%) | 22 (26.5%) |
| 8:00 AM to 8:29 AM | 29 (17.4%) | 0 (0.0%) |
| 8:30 AM to 8:59 AM | 0 (0.0%) | 0 (0.0%) |
| 9:00 AM to 9:59 AM | 0 (0.0%) | 0 (0.0%) |
| 10:00 AM to 10:59 AM | 0 (0.0%) | 0 (0.0%) |
| 11:00 AM to 11:59 AM | 0 (0.0%) | 0 (0.0%) |
| 12:00 PM to 3:59 PM | 21 (12.6%) | 0 (0.0%) |
| 4:00 PM to 11:59 PM | 54 (32.3%) | 20 (24.1%) |
| Total | 167 (100.0%) | 83 (100.0%) |
Housing Occupancy in Allentown
Occupancy by Ownership in Allentown
Of the total 443 dwellings in Allentown, owner-occupied units account for 364 (82.2%), while renter-occupied units make up 79 (17.8%).
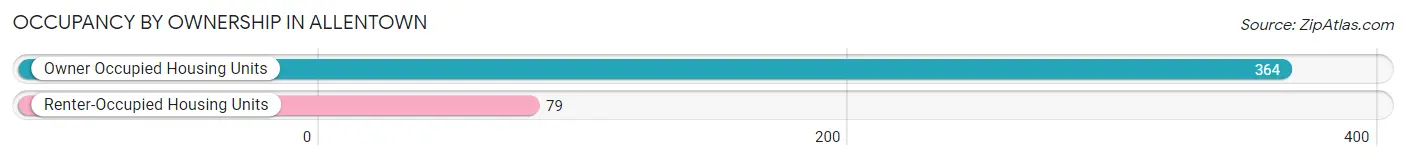
| Occupancy | # Housing Units | % Housing Units |
| Owner Occupied Housing Units | 364 | 82.2% |
| Renter-Occupied Housing Units | 79 | 17.8% |
| Total Occupied Housing Units | 443 | 100.0% |
Occupancy by Household Size in Allentown
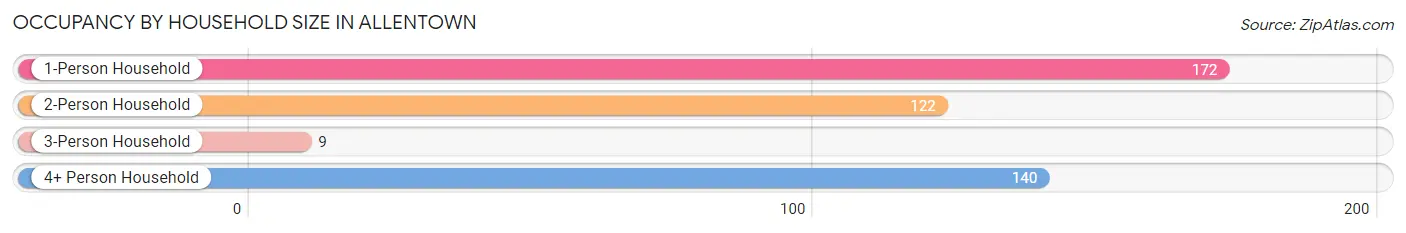
| Household Size | # Housing Units | % Housing Units |
| 1-Person Household | 172 | 38.8% |
| 2-Person Household | 122 | 27.5% |
| 3-Person Household | 9 | 2.0% |
| 4+ Person Household | 140 | 31.6% |
| Total Housing Units | 443 | 100.0% |
Occupancy by Ownership by Household Size in Allentown
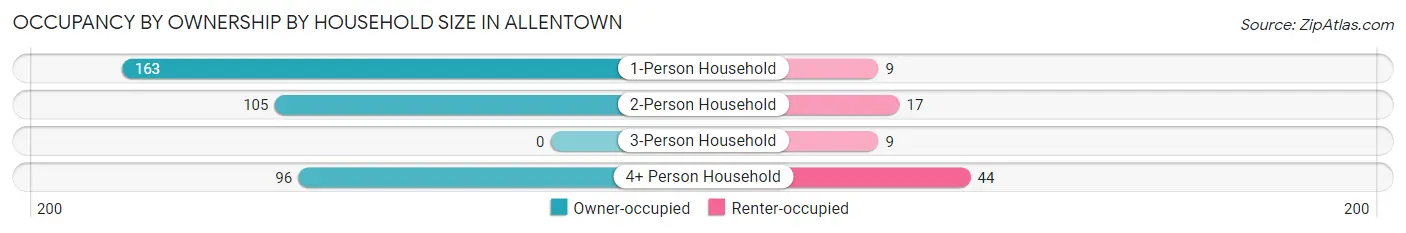
| Household Size | Owner-occupied | Renter-occupied |
| 1-Person Household | 163 (94.8%) | 9 (5.2%) |
| 2-Person Household | 105 (86.1%) | 17 (13.9%) |
| 3-Person Household | 0 (0.0%) | 9 (100.0%) |
| 4+ Person Household | 96 (68.6%) | 44 (31.4%) |
| Total Housing Units | 364 (82.2%) | 79 (17.8%) |
Occupancy by Educational Attainment in Allentown
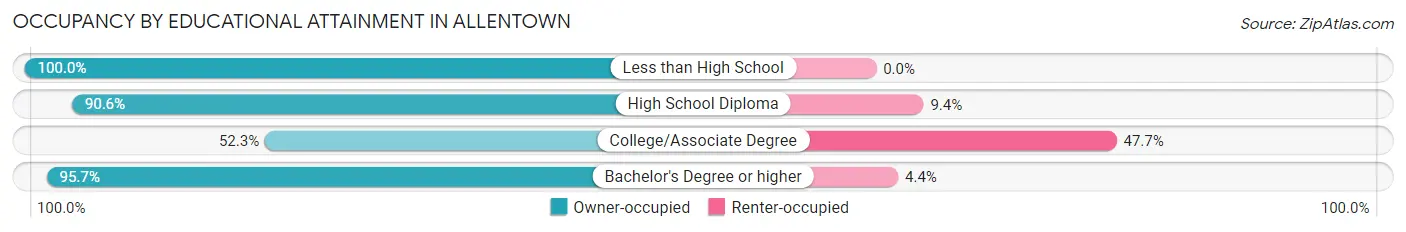
| Household Size | Owner-occupied | Renter-occupied |
| Less than High School | 12 (100.0%) | 0 (0.0%) |
| High School Diploma | 87 (90.6%) | 9 (9.4%) |
| College/Associate Degree | 67 (52.3%) | 61 (47.7%) |
| Bachelor's Degree or higher | 198 (95.7%) | 9 (4.3%) |
Occupancy by Age of Householder in Allentown
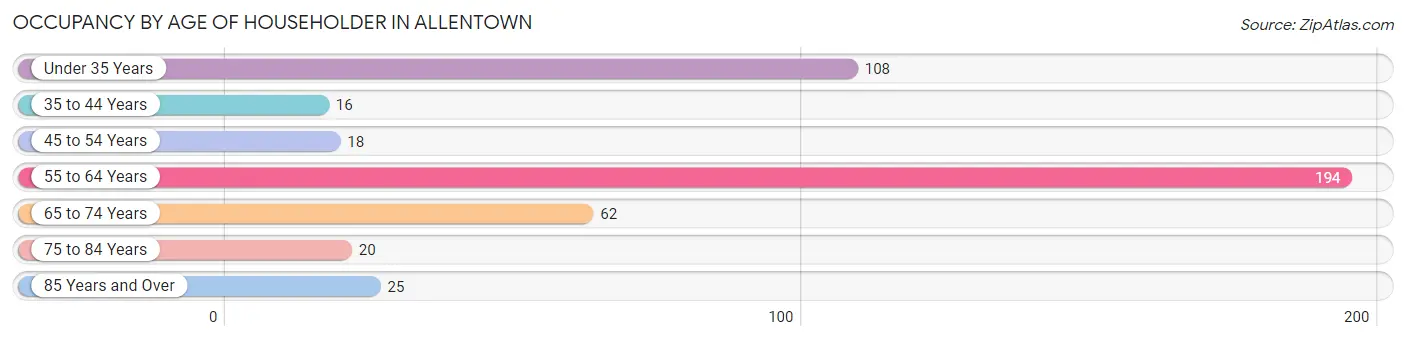
| Age Bracket | # Households | % Households |
| Under 35 Years | 108 | 24.4% |
| 35 to 44 Years | 16 | 3.6% |
| 45 to 54 Years | 18 | 4.1% |
| 55 to 64 Years | 194 | 43.8% |
| 65 to 74 Years | 62 | 14.0% |
| 75 to 84 Years | 20 | 4.5% |
| 85 Years and Over | 25 | 5.6% |
| Total | 443 | 100.0% |
Housing Finances in Allentown
Median Income by Occupancy in Allentown
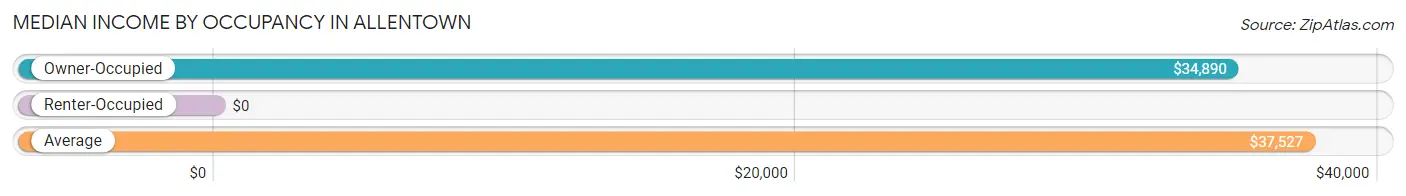
| Occupancy Type | # Households | Median Income |
| Owner-Occupied | 364 (82.2%) | $34,890 |
| Renter-Occupied | 79 (17.8%) | $0 |
| Average | 443 (100.0%) | $37,527 |
Occupancy by Householder Income Bracket in Allentown
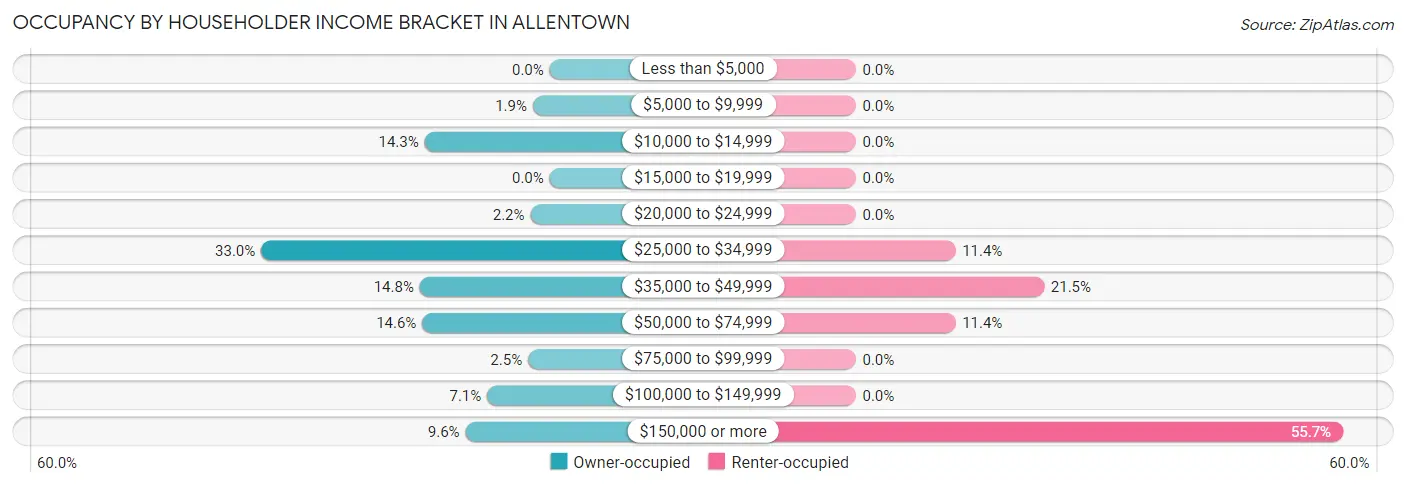
| Income Bracket | Owner-occupied | Renter-occupied |
| Less than $5,000 | 0 (0.0%) | 0 (0.0%) |
| $5,000 to $9,999 | 7 (1.9%) | 0 (0.0%) |
| $10,000 to $14,999 | 52 (14.3%) | 0 (0.0%) |
| $15,000 to $19,999 | 0 (0.0%) | 0 (0.0%) |
| $20,000 to $24,999 | 8 (2.2%) | 0 (0.0%) |
| $25,000 to $34,999 | 120 (33.0%) | 9 (11.4%) |
| $35,000 to $49,999 | 54 (14.8%) | 17 (21.5%) |
| $50,000 to $74,999 | 53 (14.6%) | 9 (11.4%) |
| $75,000 to $99,999 | 9 (2.5%) | 0 (0.0%) |
| $100,000 to $149,999 | 26 (7.1%) | 0 (0.0%) |
| $150,000 or more | 35 (9.6%) | 44 (55.7%) |
| Total | 364 (100.0%) | 79 (100.0%) |
Monthly Housing Cost Tiers in Allentown
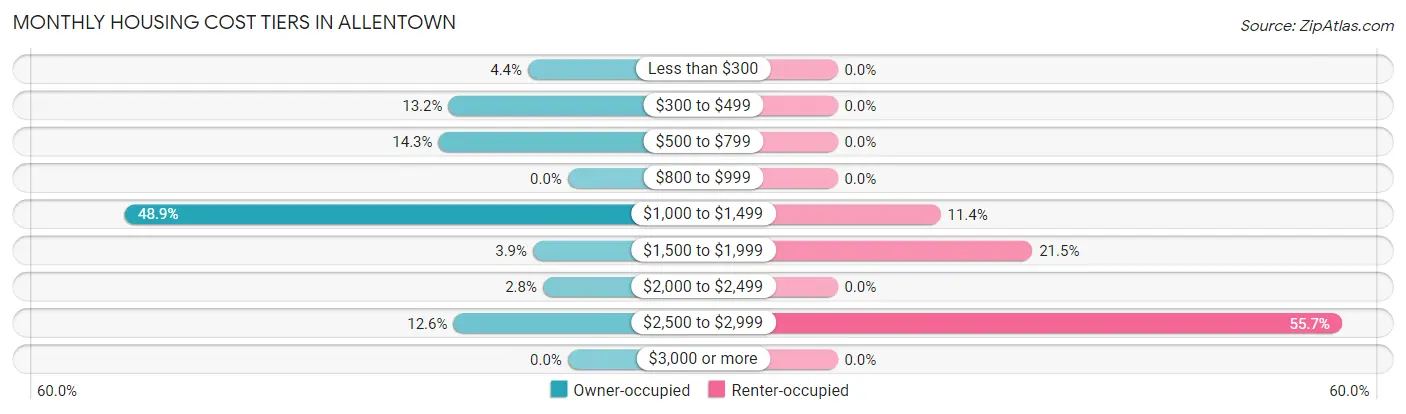
| Monthly Cost | Owner-occupied | Renter-occupied |
| Less than $300 | 16 (4.4%) | 0 (0.0%) |
| $300 to $499 | 48 (13.2%) | 0 (0.0%) |
| $500 to $799 | 52 (14.3%) | 0 (0.0%) |
| $800 to $999 | 0 (0.0%) | 0 (0.0%) |
| $1,000 to $1,499 | 178 (48.9%) | 9 (11.4%) |
| $1,500 to $1,999 | 14 (3.8%) | 17 (21.5%) |
| $2,000 to $2,499 | 10 (2.8%) | 0 (0.0%) |
| $2,500 to $2,999 | 46 (12.6%) | 44 (55.7%) |
| $3,000 or more | 0 (0.0%) | 0 (0.0%) |
| Total | 364 (100.0%) | 79 (100.0%) |
Physical Housing Characteristics in Allentown
Housing Structures in Allentown
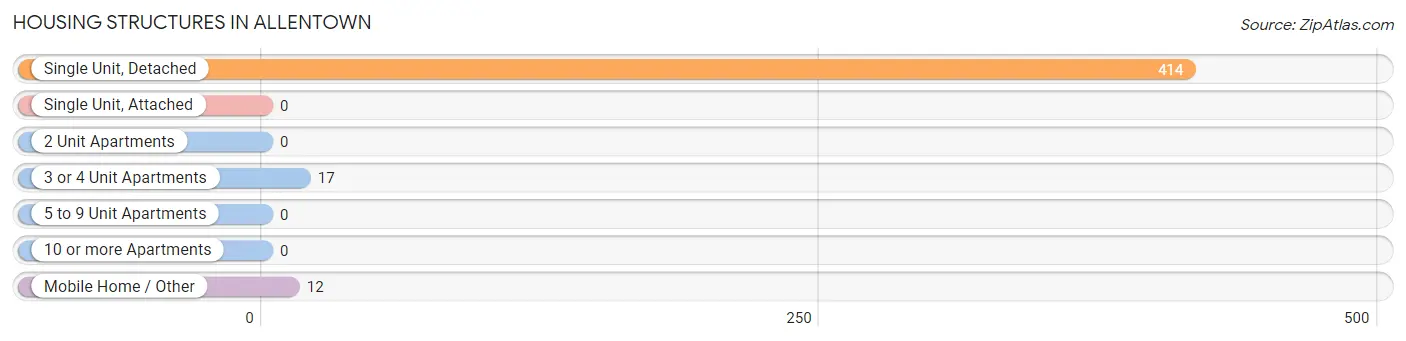
| Structure Type | # Housing Units | % Housing Units |
| Single Unit, Detached | 414 | 93.4% |
| Single Unit, Attached | 0 | 0.0% |
| 2 Unit Apartments | 0 | 0.0% |
| 3 or 4 Unit Apartments | 17 | 3.8% |
| 5 to 9 Unit Apartments | 0 | 0.0% |
| 10 or more Apartments | 0 | 0.0% |
| Mobile Home / Other | 12 | 2.7% |
| Total | 443 | 100.0% |
Housing Structures by Occupancy in Allentown
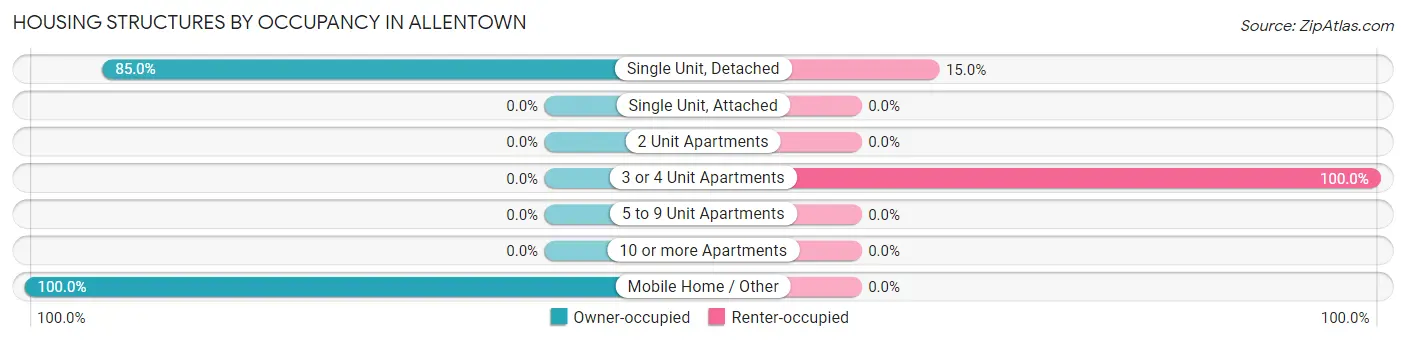
| Structure Type | Owner-occupied | Renter-occupied |
| Single Unit, Detached | 352 (85.0%) | 62 (15.0%) |
| Single Unit, Attached | 0 (0.0%) | 0 (0.0%) |
| 2 Unit Apartments | 0 (0.0%) | 0 (0.0%) |
| 3 or 4 Unit Apartments | 0 (0.0%) | 17 (100.0%) |
| 5 to 9 Unit Apartments | 0 (0.0%) | 0 (0.0%) |
| 10 or more Apartments | 0 (0.0%) | 0 (0.0%) |
| Mobile Home / Other | 12 (100.0%) | 0 (0.0%) |
| Total | 364 (82.2%) | 79 (17.8%) |
Housing Structures by Number of Rooms in Allentown
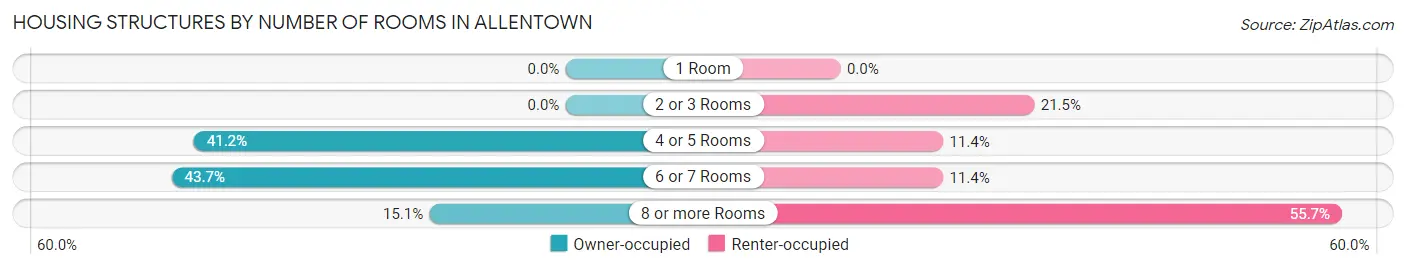
| Number of Rooms | Owner-occupied | Renter-occupied |
| 1 Room | 0 (0.0%) | 0 (0.0%) |
| 2 or 3 Rooms | 0 (0.0%) | 17 (21.5%) |
| 4 or 5 Rooms | 150 (41.2%) | 9 (11.4%) |
| 6 or 7 Rooms | 159 (43.7%) | 9 (11.4%) |
| 8 or more Rooms | 55 (15.1%) | 44 (55.7%) |
| Total | 364 (100.0%) | 79 (100.0%) |
Housing Structure by Heating Type in Allentown
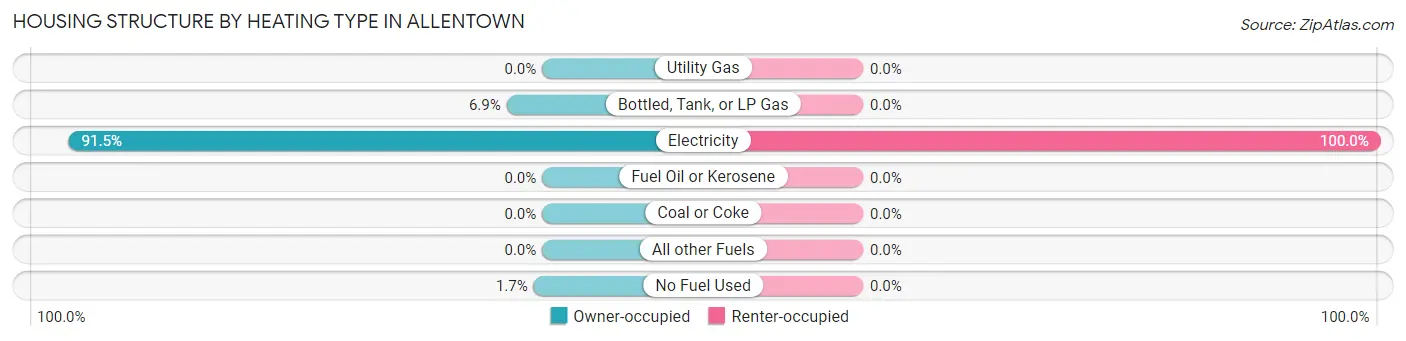
| Heating Type | Owner-occupied | Renter-occupied |
| Utility Gas | 0 (0.0%) | 0 (0.0%) |
| Bottled, Tank, or LP Gas | 25 (6.9%) | 0 (0.0%) |
| Electricity | 333 (91.5%) | 79 (100.0%) |
| Fuel Oil or Kerosene | 0 (0.0%) | 0 (0.0%) |
| Coal or Coke | 0 (0.0%) | 0 (0.0%) |
| All other Fuels | 0 (0.0%) | 0 (0.0%) |
| No Fuel Used | 6 (1.7%) | 0 (0.0%) |
| Total | 364 (100.0%) | 79 (100.0%) |
Household Vehicle Usage in Allentown
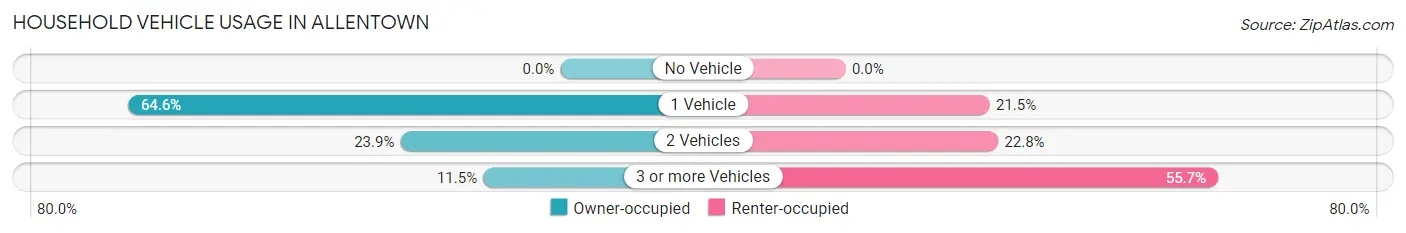
| Vehicles per Household | Owner-occupied | Renter-occupied |
| No Vehicle | 0 (0.0%) | 0 (0.0%) |
| 1 Vehicle | 235 (64.6%) | 17 (21.5%) |
| 2 Vehicles | 87 (23.9%) | 18 (22.8%) |
| 3 or more Vehicles | 42 (11.5%) | 44 (55.7%) |
| Total | 364 (100.0%) | 79 (100.0%) |
Real Estate & Mortgages in Allentown
Real Estate and Mortgage Overview in Allentown
| Characteristic | Without Mortgage | With Mortgage |
| Housing Units | 118 | 246 |
| Median Property Value | $188,500 | $237,200 |
| Median Household Income | $61,071 | $6 |
| Monthly Housing Costs | $586 | $0 |
| Real Estate Taxes | $1,157 | $0 |
Property Value by Mortgage Status in Allentown
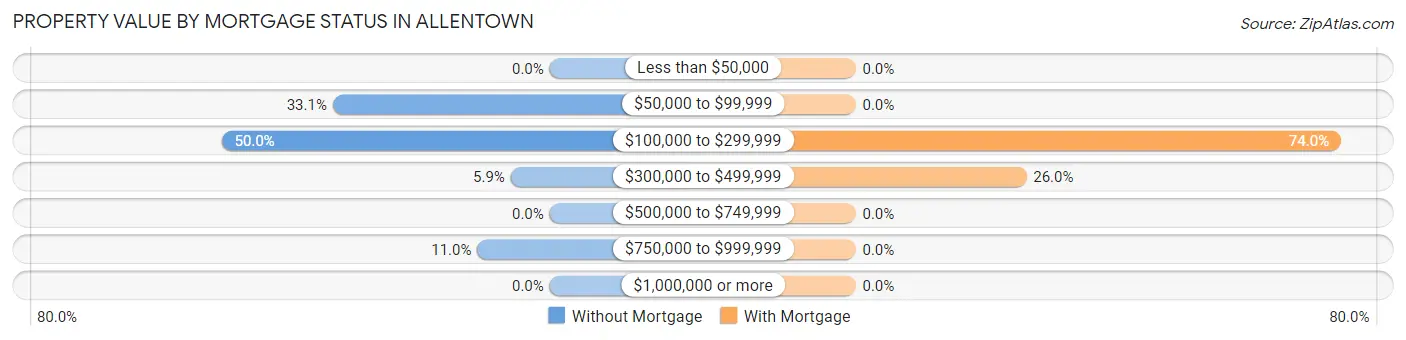
| Property Value | Without Mortgage | With Mortgage |
| Less than $50,000 | 0 (0.0%) | 0 (0.0%) |
| $50,000 to $99,999 | 39 (33.1%) | 0 (0.0%) |
| $100,000 to $299,999 | 59 (50.0%) | 182 (74.0%) |
| $300,000 to $499,999 | 7 (5.9%) | 64 (26.0%) |
| $500,000 to $749,999 | 0 (0.0%) | 0 (0.0%) |
| $750,000 to $999,999 | 13 (11.0%) | 0 (0.0%) |
| $1,000,000 or more | 0 (0.0%) | 0 (0.0%) |
| Total | 118 (100.0%) | 246 (100.0%) |
Household Income by Mortgage Status in Allentown
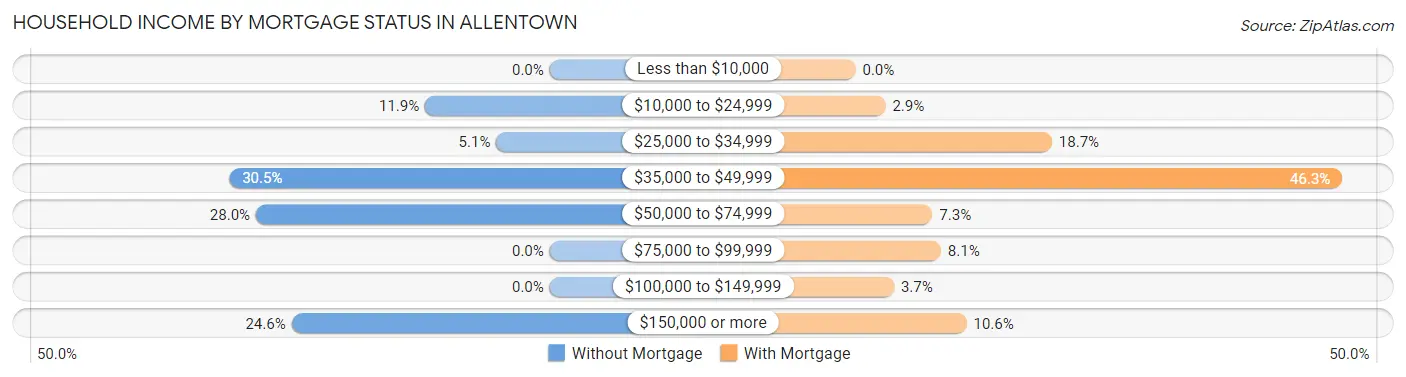
| Household Income | Without Mortgage | With Mortgage |
| Less than $10,000 | 0 (0.0%) | 0 (0.0%) |
| $10,000 to $24,999 | 14 (11.9%) | 7 (2.9%) |
| $25,000 to $34,999 | 6 (5.1%) | 46 (18.7%) |
| $35,000 to $49,999 | 36 (30.5%) | 114 (46.3%) |
| $50,000 to $74,999 | 33 (28.0%) | 18 (7.3%) |
| $75,000 to $99,999 | 0 (0.0%) | 20 (8.1%) |
| $100,000 to $149,999 | 0 (0.0%) | 9 (3.7%) |
| $150,000 or more | 29 (24.6%) | 26 (10.6%) |
| Total | 118 (100.0%) | 246 (100.0%) |
Property Value to Household Income Ratio in Allentown
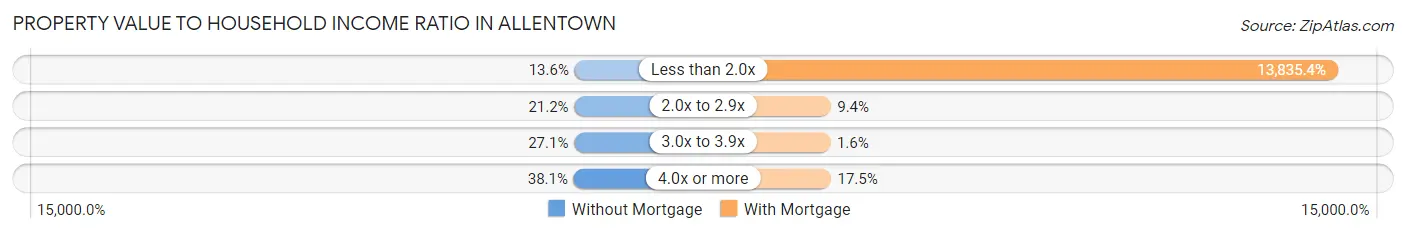
| Value-to-Income Ratio | Without Mortgage | With Mortgage |
| Less than 2.0x | 16 (13.6%) | 34,035 (13,835.4%) |
| 2.0x to 2.9x | 25 (21.2%) | 23 (9.3%) |
| 3.0x to 3.9x | 32 (27.1%) | 4 (1.6%) |
| 4.0x or more | 45 (38.1%) | 43 (17.5%) |
| Total | 118 (100.0%) | 246 (100.0%) |
Real Estate Taxes by Mortgage Status in Allentown
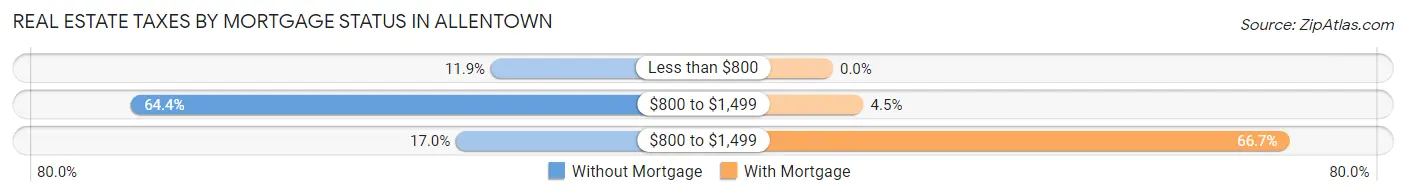
| Property Taxes | Without Mortgage | With Mortgage |
| Less than $800 | 14 (11.9%) | 0 (0.0%) |
| $800 to $1,499 | 76 (64.4%) | 11 (4.5%) |
| $800 to $1,499 | 20 (17.0%) | 164 (66.7%) |
| Total | 118 (100.0%) | 246 (100.0%) |
Health & Disability in Allentown
Health Insurance Coverage by Age in Allentown
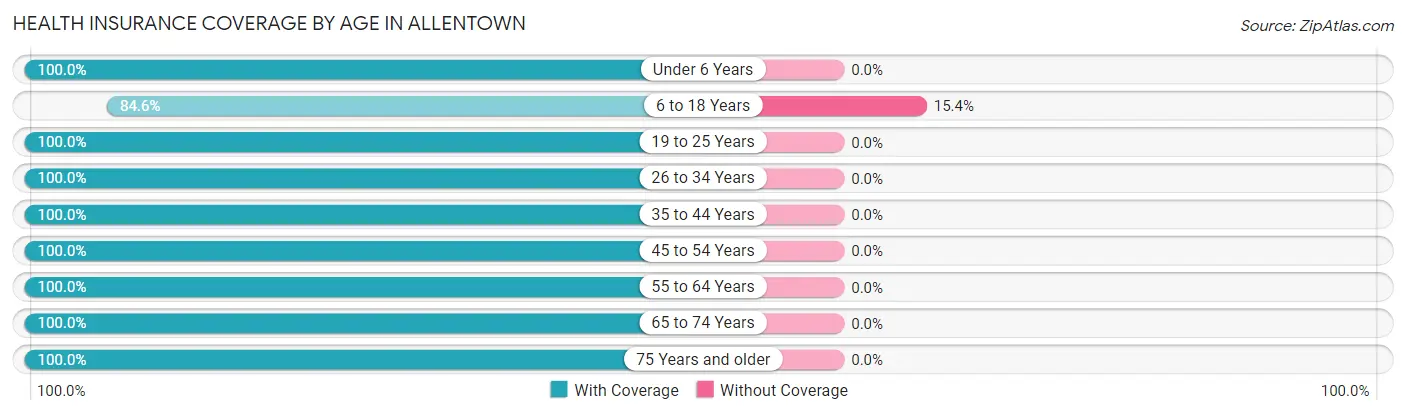
| Age Bracket | With Coverage | Without Coverage |
| Under 6 Years | 146 (100.0%) | 0 (0.0%) |
| 6 to 18 Years | 154 (84.6%) | 28 (15.4%) |
| 19 to 25 Years | 9 (100.0%) | 0 (0.0%) |
| 26 to 34 Years | 119 (100.0%) | 0 (0.0%) |
| 35 to 44 Years | 85 (100.0%) | 0 (0.0%) |
| 45 to 54 Years | 84 (100.0%) | 0 (0.0%) |
| 55 to 64 Years | 244 (100.0%) | 0 (0.0%) |
| 65 to 74 Years | 91 (100.0%) | 0 (0.0%) |
| 75 Years and older | 70 (100.0%) | 0 (0.0%) |
| Total | 1,002 (97.3%) | 28 (2.7%) |
Health Insurance Coverage by Citizenship Status in Allentown
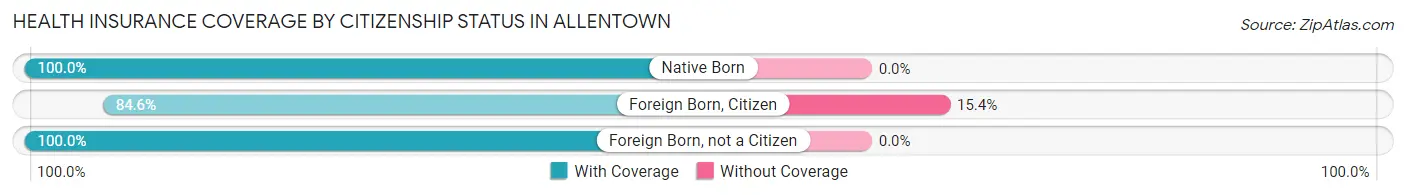
| Citizenship Status | With Coverage | Without Coverage |
| Native Born | 146 (100.0%) | 0 (0.0%) |
| Foreign Born, Citizen | 154 (84.6%) | 28 (15.4%) |
| Foreign Born, not a Citizen | 9 (100.0%) | 0 (0.0%) |
Health Insurance Coverage by Household Income in Allentown
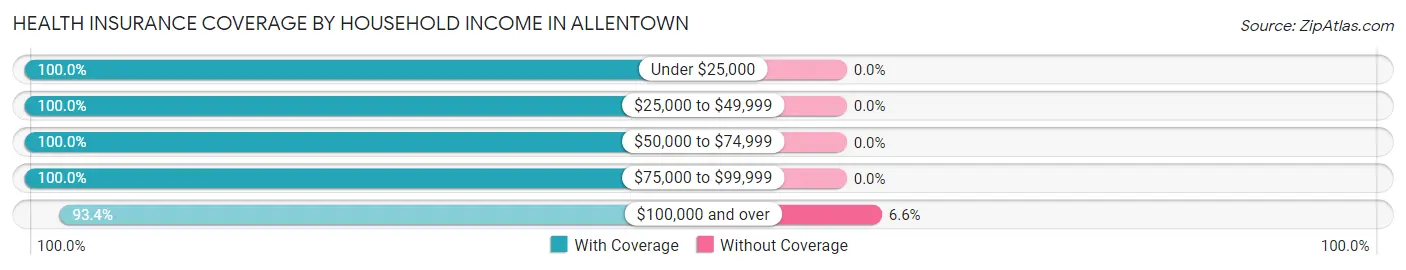
| Household Income | With Coverage | Without Coverage |
| Under $25,000 | 163 (100.0%) | 0 (0.0%) |
| $25,000 to $49,999 | 285 (100.0%) | 0 (0.0%) |
| $50,000 to $74,999 | 140 (100.0%) | 0 (0.0%) |
| $75,000 to $99,999 | 16 (100.0%) | 0 (0.0%) |
| $100,000 and over | 398 (93.4%) | 28 (6.6%) |
Public vs Private Health Insurance Coverage by Age in Allentown
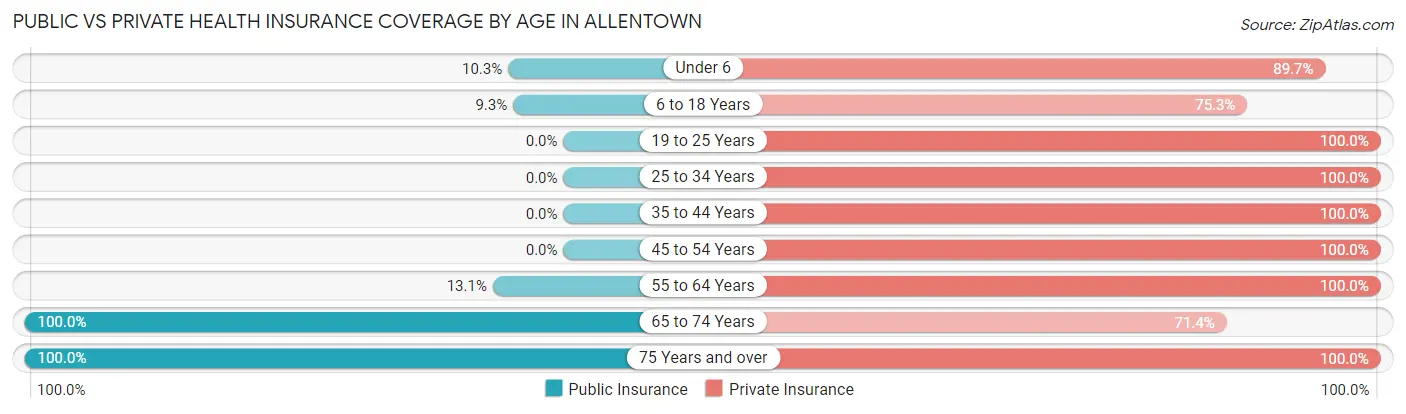
| Age Bracket | Public Insurance | Private Insurance |
| Under 6 | 15 (10.3%) | 131 (89.7%) |
| 6 to 18 Years | 17 (9.3%) | 137 (75.3%) |
| 19 to 25 Years | 0 (0.0%) | 9 (100.0%) |
| 25 to 34 Years | 0 (0.0%) | 119 (100.0%) |
| 35 to 44 Years | 0 (0.0%) | 85 (100.0%) |
| 45 to 54 Years | 0 (0.0%) | 84 (100.0%) |
| 55 to 64 Years | 32 (13.1%) | 244 (100.0%) |
| 65 to 74 Years | 91 (100.0%) | 65 (71.4%) |
| 75 Years and over | 70 (100.0%) | 70 (100.0%) |
| Total | 225 (21.8%) | 944 (91.6%) |
Disability Status by Sex by Age in Allentown
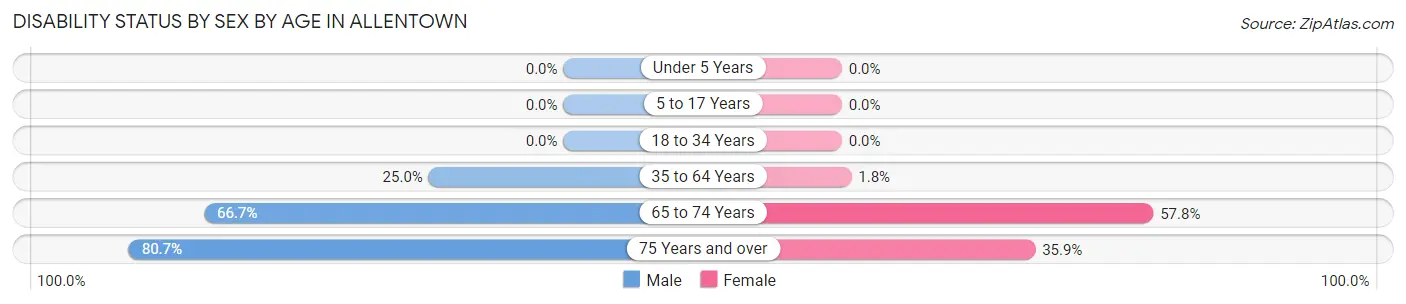
| Age Bracket | Male | Female |
| Under 5 Years | 0 (0.0%) | 0 (0.0%) |
| 5 to 17 Years | 0 (0.0%) | 0 (0.0%) |
| 18 to 34 Years | 0 (0.0%) | 0 (0.0%) |
| 35 to 64 Years | 47 (25.0%) | 4 (1.8%) |
| 65 to 74 Years | 18 (66.7%) | 37 (57.8%) |
| 75 Years and over | 25 (80.6%) | 14 (35.9%) |
Disability Class by Sex by Age in Allentown
Disability Class: Hearing Difficulty
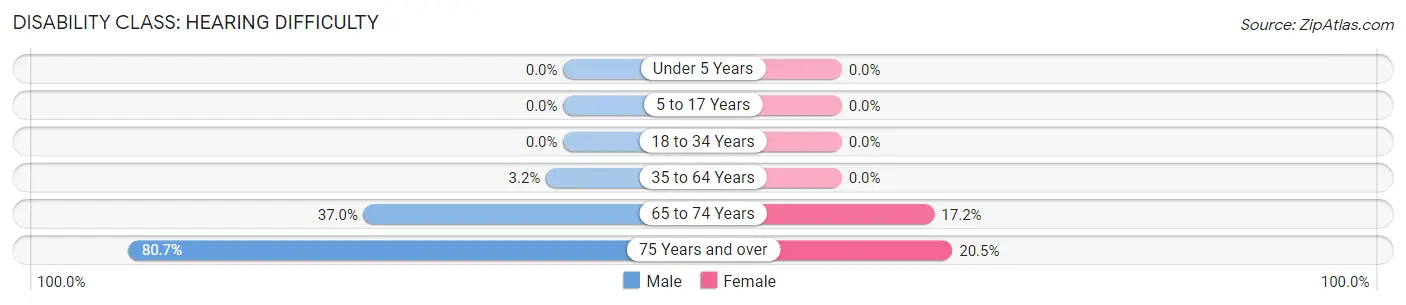
| Age Bracket | Male | Female |
| Under 5 Years | 0 (0.0%) | 0 (0.0%) |
| 5 to 17 Years | 0 (0.0%) | 0 (0.0%) |
| 18 to 34 Years | 0 (0.0%) | 0 (0.0%) |
| 35 to 64 Years | 6 (3.2%) | 0 (0.0%) |
| 65 to 74 Years | 10 (37.0%) | 11 (17.2%) |
| 75 Years and over | 25 (80.6%) | 8 (20.5%) |
Disability Class: Vision Difficulty
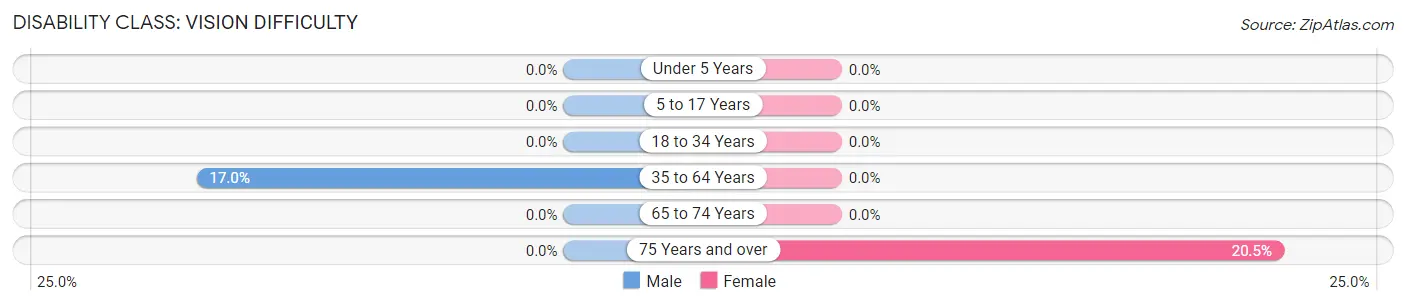
| Age Bracket | Male | Female |
| Under 5 Years | 0 (0.0%) | 0 (0.0%) |
| 5 to 17 Years | 0 (0.0%) | 0 (0.0%) |
| 18 to 34 Years | 0 (0.0%) | 0 (0.0%) |
| 35 to 64 Years | 32 (17.0%) | 0 (0.0%) |
| 65 to 74 Years | 0 (0.0%) | 0 (0.0%) |
| 75 Years and over | 0 (0.0%) | 8 (20.5%) |
Disability Class: Cognitive Difficulty
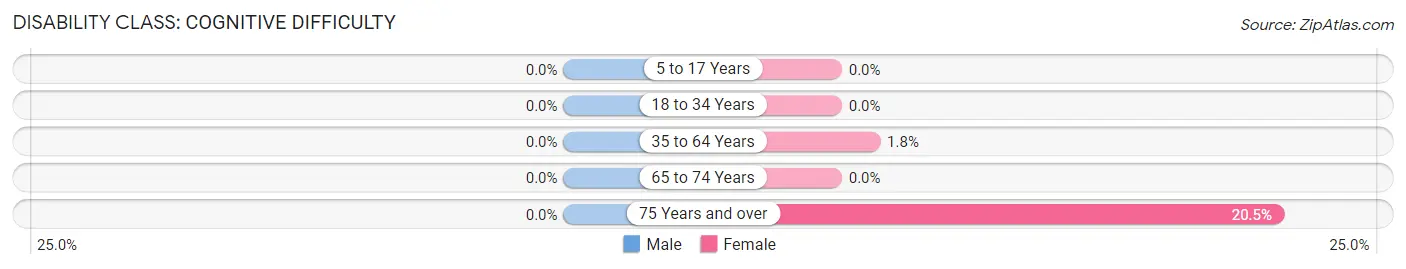
| Age Bracket | Male | Female |
| 5 to 17 Years | 0 (0.0%) | 0 (0.0%) |
| 18 to 34 Years | 0 (0.0%) | 0 (0.0%) |
| 35 to 64 Years | 0 (0.0%) | 4 (1.8%) |
| 65 to 74 Years | 0 (0.0%) | 0 (0.0%) |
| 75 Years and over | 0 (0.0%) | 8 (20.5%) |
Disability Class: Ambulatory Difficulty
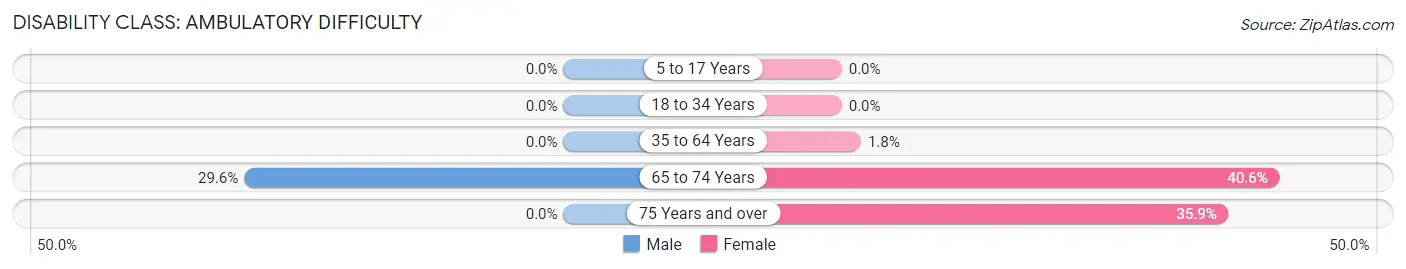
| Age Bracket | Male | Female |
| 5 to 17 Years | 0 (0.0%) | 0 (0.0%) |
| 18 to 34 Years | 0 (0.0%) | 0 (0.0%) |
| 35 to 64 Years | 0 (0.0%) | 4 (1.8%) |
| 65 to 74 Years | 8 (29.6%) | 26 (40.6%) |
| 75 Years and over | 0 (0.0%) | 14 (35.9%) |
Disability Class: Self-Care Difficulty
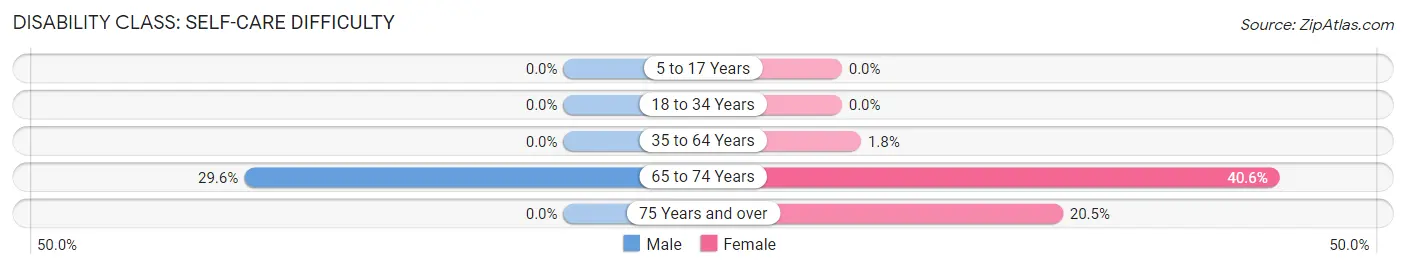
| Age Bracket | Male | Female |
| 5 to 17 Years | 0 (0.0%) | 0 (0.0%) |
| 18 to 34 Years | 0 (0.0%) | 0 (0.0%) |
| 35 to 64 Years | 0 (0.0%) | 4 (1.8%) |
| 65 to 74 Years | 8 (29.6%) | 26 (40.6%) |
| 75 Years and over | 0 (0.0%) | 8 (20.5%) |
Technology Access in Allentown
Computing Device Access in Allentown
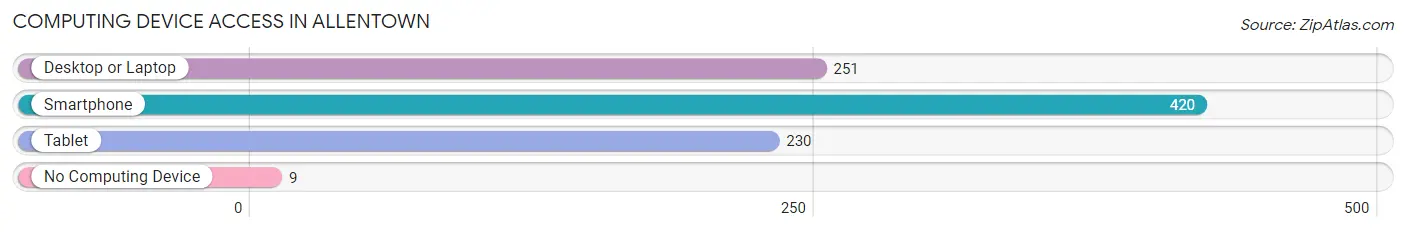
| Device Type | # Households | % Households |
| Desktop or Laptop | 251 | 56.7% |
| Smartphone | 420 | 94.8% |
| Tablet | 230 | 51.9% |
| No Computing Device | 9 | 2.0% |
| Total | 443 | 100.0% |
Internet Access in Allentown
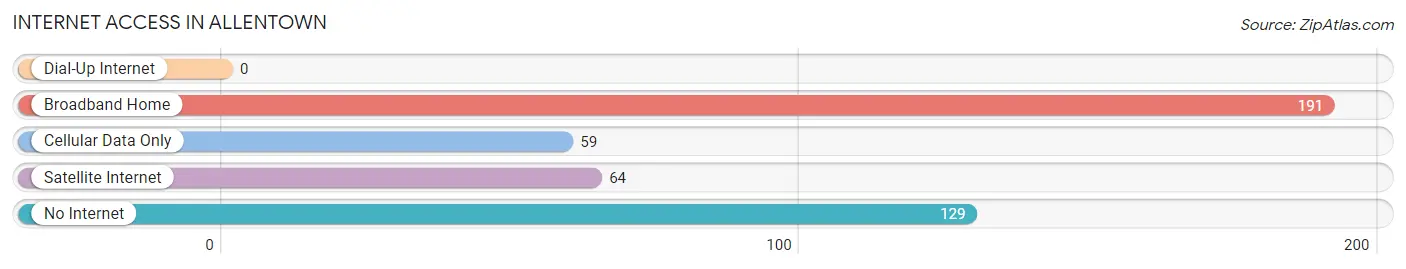
| Internet Type | # Households | % Households |
| Dial-Up Internet | 0 | 0.0% |
| Broadband Home | 191 | 43.1% |
| Cellular Data Only | 59 | 13.3% |
| Satellite Internet | 64 | 14.4% |
| No Internet | 129 | 29.1% |
| Total | 443 | 100.0% |
Allentown Summary
Allentown is a small town located in the state of Florida, in the United States. It is situated in the northern part of the state, in the county of Leon. Allentown is a rural community, with a population of just over 1,000 people. The town is located on the banks of the Ochlockonee River, and is surrounded by lush green forests and rolling hills.
History
Allentown was founded in 1825 by a group of settlers from Georgia. The town was named after the Allens, a prominent family in the area. The Allens were among the first settlers in the area, and their influence can still be seen in the town today. The town was originally a farming community, and the main crops grown were cotton, corn, and tobacco.
In the late 19th century, the town began to grow and develop. The railroad was built through the town, and the town became a hub for the surrounding area. The town also became a popular destination for tourists, as it was close to the Gulf of Mexico.
Geography
Allentown is located in the northern part of the state of Florida, in the county of Leon. The town is situated on the banks of the Ochlockonee River, and is surrounded by lush green forests and rolling hills. The town is located about 30 miles from the state capital, Tallahassee.
The climate in Allentown is humid subtropical, with hot summers and mild winters. The average temperature in the summer is around 90 degrees Fahrenheit, and the average temperature in the winter is around 60 degrees Fahrenheit. The town receives an average of 50 inches of rain per year.
Economy
The economy of Allentown is largely based on agriculture. The town is home to several farms, which produce a variety of crops, including cotton, corn, and tobacco. The town also has a few small businesses, such as restaurants, stores, and a few manufacturing plants.
The town is also home to a few tourist attractions, such as the Ochlockonee River State Park and the Allentown Historical Museum. These attractions bring in a small amount of tourism revenue to the town.
Demographics
As of the 2010 census, the population of Allentown was 1,072. The racial makeup of the town was 94.3% White, 2.3% African American, 0.3% Native American, 0.7% Asian, 0.1% Pacific Islander, and 2.3% from other races. The median household income in the town was $37,500, and the median age was 41.
Allentown is a small, rural town with a close-knit community. The town is home to a variety of churches, and the townspeople are very friendly and welcoming. The town is a great place to raise a family, and the townspeople take pride in their community.
Common Questions
What is Per Capita Income in Allentown?
Per Capita income in Allentown is $32,700.
What is the Median Family Income in Allentown?
Median Family Income in Allentown is $63,029.
What is the Median Household income in Allentown?
Median Household Income in Allentown is $37,527.
What is Inequality or Gini Index in Allentown?
Inequality or Gini Index in Allentown is 0.46.
What is the Total Population of Allentown?
Total Population of Allentown is 1,030.
What is the Total Male Population of Allentown?
Total Male Population of Allentown is 452.
What is the Total Female Population of Allentown?
Total Female Population of Allentown is 578.
What is the Ratio of Males per 100 Females in Allentown?
There are 78.20 Males per 100 Females in Allentown.
What is the Ratio of Females per 100 Males in Allentown?
There are 127.88 Females per 100 Males in Allentown.
What is the Median Population Age in Allentown?
Median Population Age in Allentown is 41.3 Years.
What is the Average Family Size in Allentown
Average Family Size in Allentown is 3.1 People.
What is the Average Household Size in Allentown
Average Household Size in Allentown is 2.3 People.
How Large is the Labor Force in Allentown?
There are 276 People in the Labor Forcein in Allentown.
What is the Percentage of People in the Labor Force in Allentown?
36.3% of People are in the Labor Force in Allentown.