Navarre, FL Map & Demographics
Navarre Map
Navarre Overview
$40,018
PER CAPITA INCOME
$107,698
AVG FAMILY INCOME
$97,376
AVG HOUSEHOLD INCOME
41.6%
WAGE / INCOME GAP [ % ]
58.4¢/ $1
WAGE / INCOME GAP [ $ ]
0.38
INEQUALITY / GINI INDEX
38,829
TOTAL POPULATION
19,657
MALE POPULATION
19,172
FEMALE POPULATION
102.53
MALES / 100 FEMALES
97.53
FEMALES / 100 MALES
38.1
MEDIAN AGE
3.1
AVG FAMILY SIZE
2.8
AVG HOUSEHOLD SIZE
18,815
LABOR FORCE [ PEOPLE ]
62.3%
PERCENT IN LABOR FORCE
5.6%
UNEMPLOYMENT RATE
Navarre Zip Codes
Navarre Area Codes
Income in Navarre
Income Overview in Navarre
Per Capita Income in Navarre is $40,018, while median incomes of families and households are $107,698 and $97,376 respectively.
| Characteristic | Number | Measure |
| Per Capita Income | 38,829 | $40,018 |
| Median Family Income | 10,725 | $107,698 |
| Mean Family Income | 10,725 | $118,543 |
| Median Household Income | 13,987 | $97,376 |
| Mean Household Income | 13,987 | $110,526 |
| Income Deficit | 10,725 | $0 |
| Wage / Income Gap (%) | 38,829 | 41.65% |
| Wage / Income Gap ($) | 38,829 | 58.35¢ per $1 |
| Gini / Inequality Index | 38,829 | 0.38 |
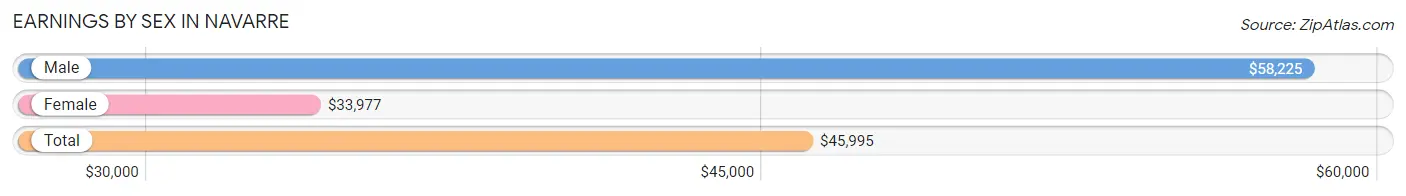
Earnings by Sex in Navarre
Average Earnings in Navarre are $45,995, $58,225 for men and $33,977 for women, a difference of 41.6%.
| Sex | Number | Average Earnings |
| Male | 11,169 (56.7%) | $58,225 |
| Female | 8,534 (43.3%) | $33,977 |
| Total | 19,703 (100.0%) | $45,995 |
Earnings by Sex by Income Bracket in Navarre
The most common earnings brackets in Navarre are $100,000+ for men (2,425 | 21.7%) and $25,000 to $29,999 for women (877 | 10.3%).
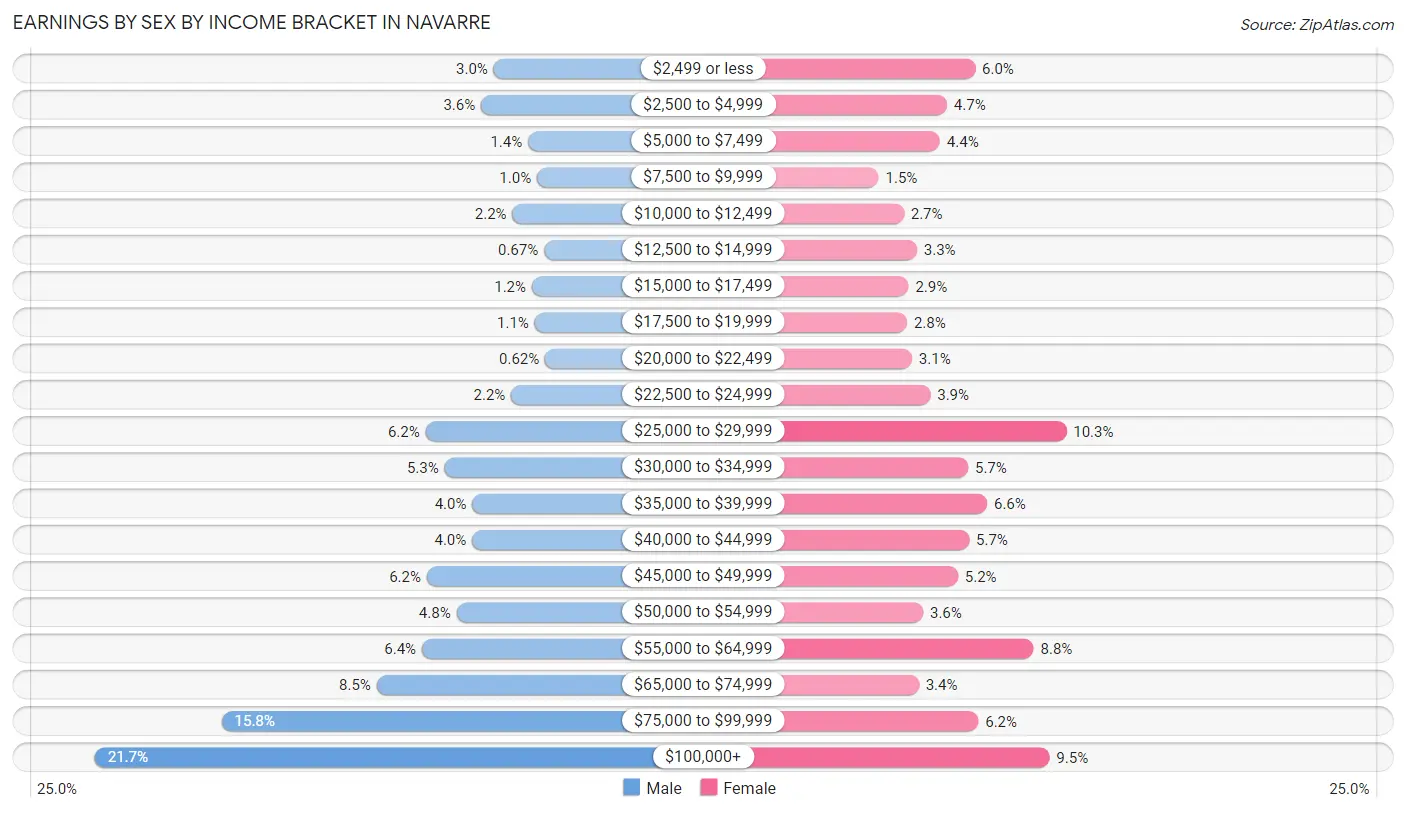
| Income | Male | Female |
| $2,499 or less | 338 (3.0%) | 513 (6.0%) |
| $2,500 to $4,999 | 404 (3.6%) | 400 (4.7%) |
| $5,000 to $7,499 | 159 (1.4%) | 372 (4.4%) |
| $7,500 to $9,999 | 112 (1.0%) | 127 (1.5%) |
| $10,000 to $12,499 | 240 (2.1%) | 228 (2.7%) |
| $12,500 to $14,999 | 75 (0.7%) | 280 (3.3%) |
| $15,000 to $17,499 | 139 (1.2%) | 247 (2.9%) |
| $17,500 to $19,999 | 124 (1.1%) | 241 (2.8%) |
| $20,000 to $22,499 | 69 (0.6%) | 260 (3.0%) |
| $22,500 to $24,999 | 247 (2.2%) | 334 (3.9%) |
| $25,000 to $29,999 | 695 (6.2%) | 877 (10.3%) |
| $30,000 to $34,999 | 595 (5.3%) | 485 (5.7%) |
| $35,000 to $39,999 | 450 (4.0%) | 561 (6.6%) |
| $40,000 to $44,999 | 451 (4.0%) | 489 (5.7%) |
| $45,000 to $49,999 | 688 (6.2%) | 444 (5.2%) |
| $50,000 to $54,999 | 533 (4.8%) | 305 (3.6%) |
| $55,000 to $64,999 | 714 (6.4%) | 747 (8.7%) |
| $65,000 to $74,999 | 950 (8.5%) | 288 (3.4%) |
| $75,000 to $99,999 | 1,761 (15.8%) | 526 (6.2%) |
| $100,000+ | 2,425 (21.7%) | 810 (9.5%) |
| Total | 11,169 (100.0%) | 8,534 (100.0%) |
Earnings by Sex by Educational Attainment in Navarre
Average earnings in Navarre are $67,230 for men and $38,710 for women, a difference of 42.4%. Men with an educational attainment of graduate degree enjoy the highest average annual earnings of $84,837, while those with high school diploma education earn the least with $48,173. Women with an educational attainment of graduate degree earn the most with the average annual earnings of $60,403, while those with high school diploma education have the smallest earnings of $34,263.
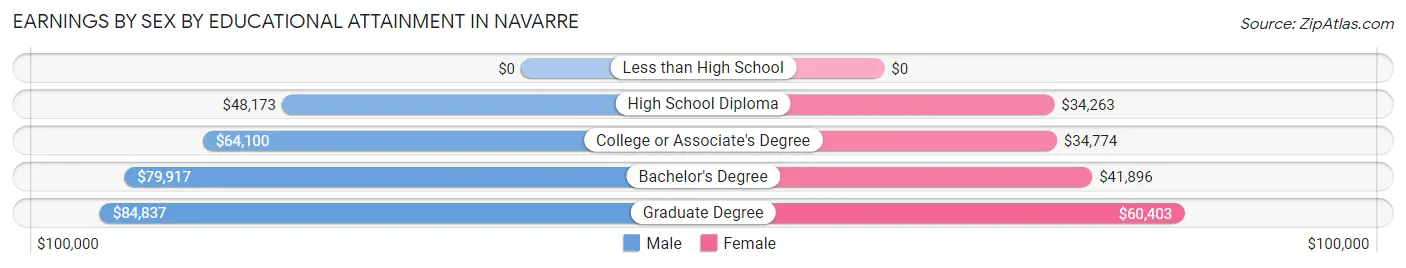
| Educational Attainment | Male Income | Female Income |
| Less than High School | - | - |
| High School Diploma | $48,173 | $34,263 |
| College or Associate's Degree | $64,100 | $34,774 |
| Bachelor's Degree | $79,917 | $41,896 |
| Graduate Degree | $84,837 | $60,403 |
| Total | $67,230 | $38,710 |
Family Income in Navarre
Family Income Brackets in Navarre
According to the Navarre family income data, there are 2,671 families falling into the $100,000 to $149,999 income range, which is the most common income bracket and makes up 24.9% of all families. Conversely, the $10,000 to $14,999 income bracket is the least frequent group with only 75 families (0.7%) belonging to this category.
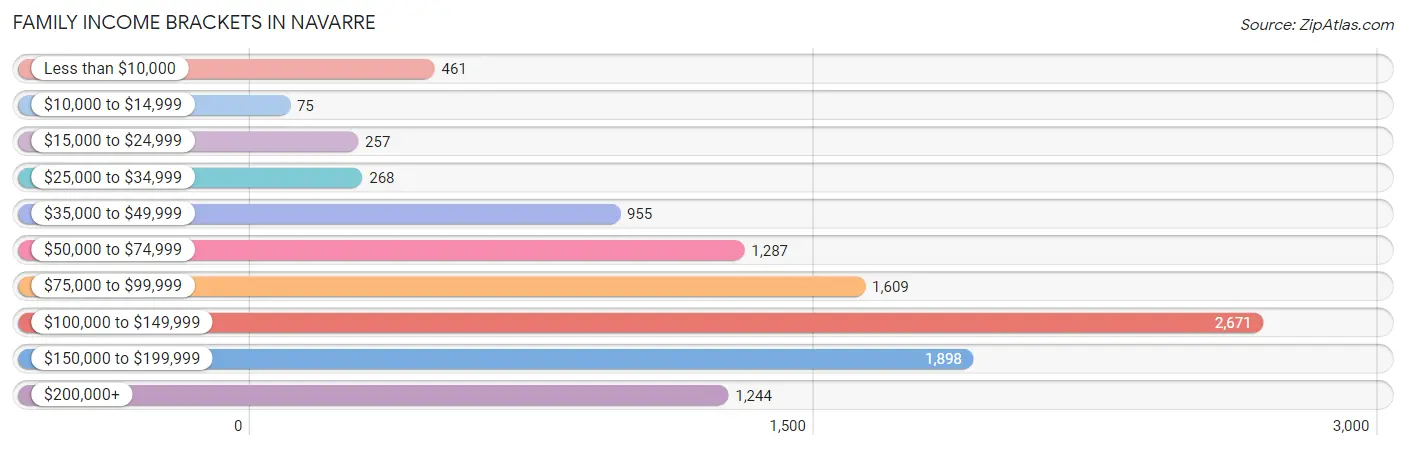
| Income Bracket | # Families | % Families |
| Less than $10,000 | 461 | 4.3% |
| $10,000 to $14,999 | 75 | 0.7% |
| $15,000 to $24,999 | 257 | 2.4% |
| $25,000 to $34,999 | 268 | 2.5% |
| $35,000 to $49,999 | 955 | 8.9% |
| $50,000 to $74,999 | 1,287 | 12.0% |
| $75,000 to $99,999 | 1,609 | 15.0% |
| $100,000 to $149,999 | 2,671 | 24.9% |
| $150,000 to $199,999 | 1,898 | 17.7% |
| $200,000+ | 1,244 | 11.6% |
Family Income by Famaliy Size in Navarre
6-person families (183 | 1.7%) account for the highest median family income in Navarre with $130,052 per family, while 2-person families (4,476 | 41.7%) have the highest median income of $49,863 per family member.
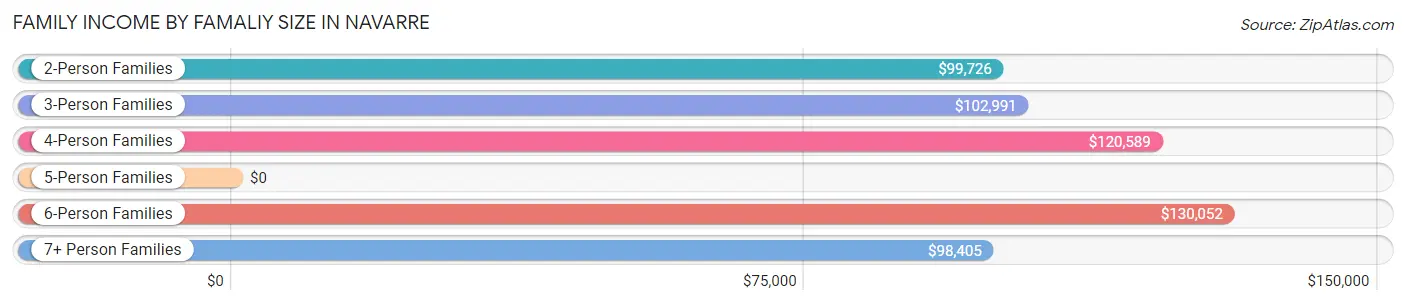
| Income Bracket | # Families | Median Income |
| 2-Person Families | 4,476 (41.7%) | $99,726 |
| 3-Person Families | 2,177 (20.3%) | $102,991 |
| 4-Person Families | 2,563 (23.9%) | $120,589 |
| 5-Person Families | 1,169 (10.9%) | $0 |
| 6-Person Families | 183 (1.7%) | $130,052 |
| 7+ Person Families | 157 (1.5%) | $98,405 |
| Total | 10,725 (100.0%) | $107,698 |
Family Income by Number of Earners in Navarre
The median family income in Navarre is $107,698, with families comprising 3+ earners (1,205) having the highest median family income of $142,321, while families with no earners (1,443) have the lowest median family income of $48,992, accounting for 11.2% and 13.5% of families, respectively.
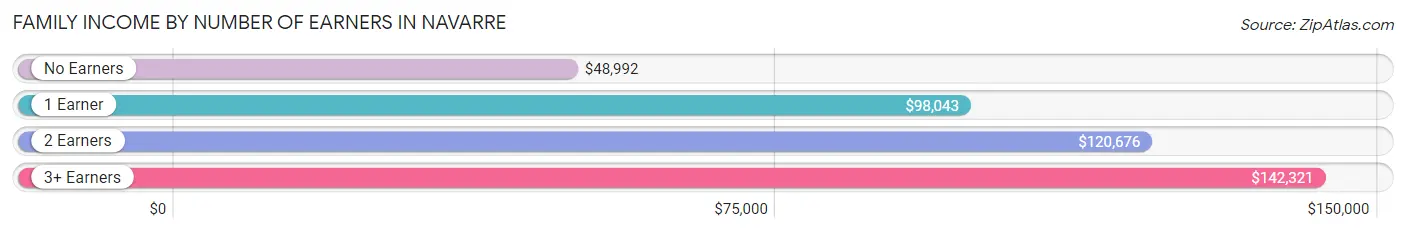
| Number of Earners | # Families | Median Income |
| No Earners | 1,443 (13.5%) | $48,992 |
| 1 Earner | 3,858 (36.0%) | $98,043 |
| 2 Earners | 4,219 (39.3%) | $120,676 |
| 3+ Earners | 1,205 (11.2%) | $142,321 |
| Total | 10,725 (100.0%) | $107,698 |
Household Income in Navarre
Household Income Brackets in Navarre
With 3,021 households falling in the category, the $100,000 to $149,999 income range is the most frequent in Navarre, accounting for 21.6% of all households. In contrast, only 294 households (2.1%) fall into the $10,000 to $14,999 income bracket, making it the least populous group.
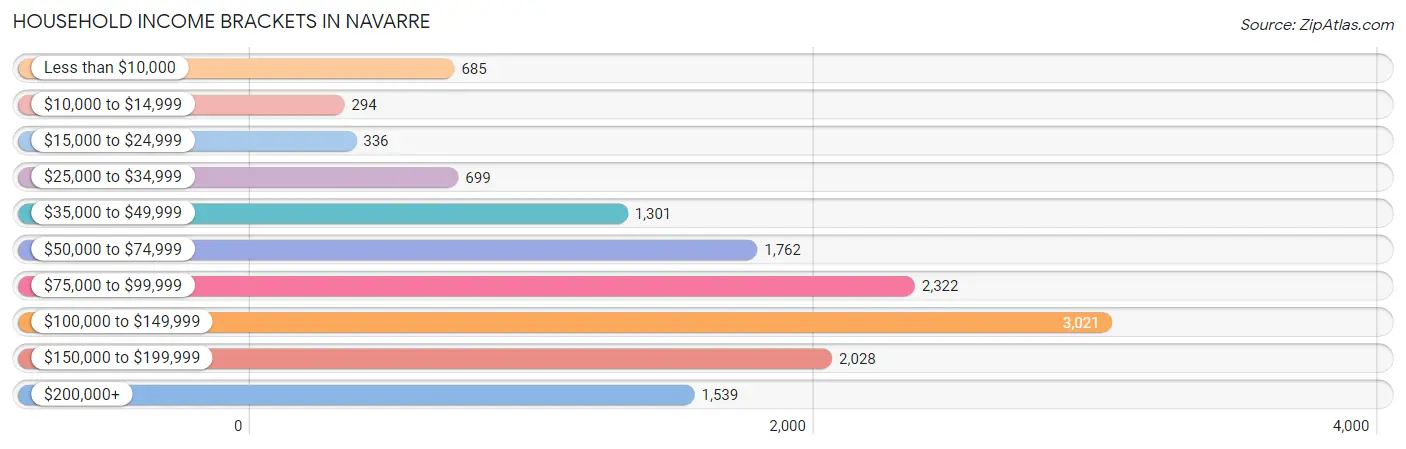
| Income Bracket | # Households | % Households |
| Less than $10,000 | 685 | 4.9% |
| $10,000 to $14,999 | 294 | 2.1% |
| $15,000 to $24,999 | 336 | 2.4% |
| $25,000 to $34,999 | 699 | 5.0% |
| $35,000 to $49,999 | 1,301 | 9.3% |
| $50,000 to $74,999 | 1,762 | 12.6% |
| $75,000 to $99,999 | 2,322 | 16.6% |
| $100,000 to $149,999 | 3,021 | 21.6% |
| $150,000 to $199,999 | 2,028 | 14.5% |
| $200,000+ | 1,539 | 11.0% |
Household Income by Householder Age in Navarre
The median household income in Navarre is $97,376, with the highest median household income of $120,576 found in the 45 to 64 years age bracket for the primary householder. A total of 6,201 households (44.3%) fall into this category. Meanwhile, the 65+ years age bracket for the primary householder has the lowest median household income of $49,710, with 2,506 households (17.9%) in this group.
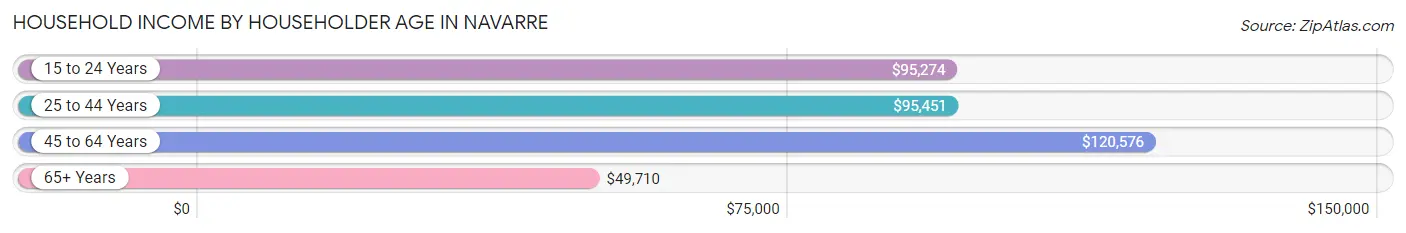
| Income Bracket | # Households | Median Income |
| 15 to 24 Years | 429 (3.1%) | $95,274 |
| 25 to 44 Years | 4,851 (34.7%) | $95,451 |
| 45 to 64 Years | 6,201 (44.3%) | $120,576 |
| 65+ Years | 2,506 (17.9%) | $49,710 |
| Total | 13,987 (100.0%) | $97,376 |
Poverty in Navarre
Income Below Poverty by Sex and Age in Navarre
With 7.5% poverty level for males and 9.7% for females among the residents of Navarre, 75 year old and over males and 15 year old females are the most vulnerable to poverty, with 74 males (12.3%) and 107 females (33.8%) in their respective age groups living below the poverty level.
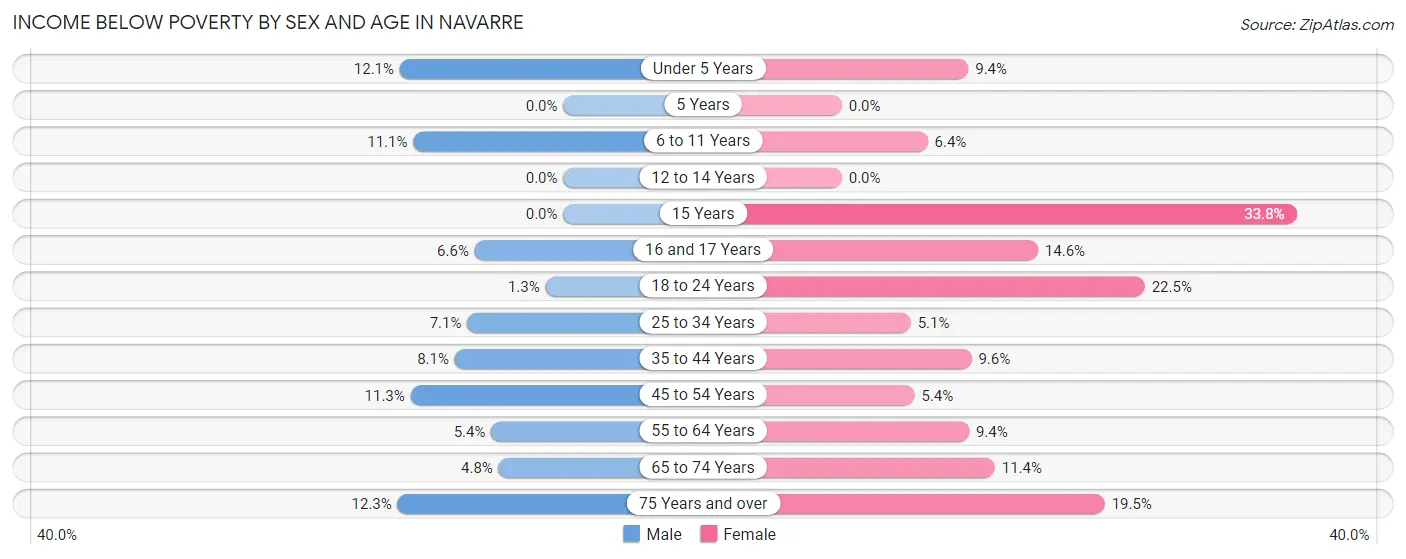
| Age Bracket | Male | Female |
| Under 5 Years | 122 (12.1%) | 81 (9.4%) |
| 5 Years | 0 (0.0%) | 0 (0.0%) |
| 6 to 11 Years | 296 (11.1%) | 101 (6.4%) |
| 12 to 14 Years | 0 (0.0%) | 0 (0.0%) |
| 15 Years | 0 (0.0%) | 107 (33.8%) |
| 16 and 17 Years | 30 (6.6%) | 46 (14.6%) |
| 18 to 24 Years | 25 (1.3%) | 312 (22.5%) |
| 25 to 34 Years | 168 (7.1%) | 119 (5.1%) |
| 35 to 44 Years | 219 (8.1%) | 320 (9.6%) |
| 45 to 54 Years | 332 (11.3%) | 142 (5.4%) |
| 55 to 64 Years | 132 (5.3%) | 273 (9.4%) |
| 65 to 74 Years | 65 (4.8%) | 191 (11.4%) |
| 75 Years and over | 74 (12.3%) | 170 (19.5%) |
| Total | 1,463 (7.5%) | 1,862 (9.7%) |
Income Above Poverty by Sex and Age in Navarre
According to the poverty statistics in Navarre, males aged 5 years and females aged 5 years are the age groups that are most secure financially, with 100.0% of males and 100.0% of females in these age groups living above the poverty line.
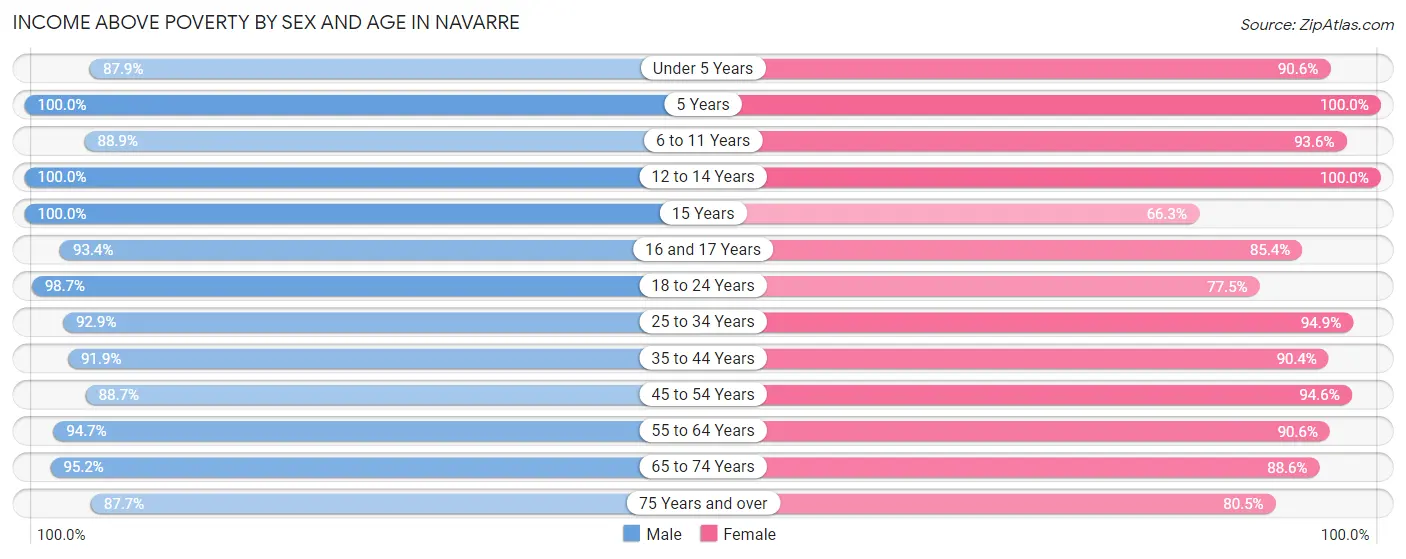
| Age Bracket | Male | Female |
| Under 5 Years | 883 (87.9%) | 782 (90.6%) |
| 5 Years | 163 (100.0%) | 339 (100.0%) |
| 6 to 11 Years | 2,360 (88.9%) | 1,485 (93.6%) |
| 12 to 14 Years | 743 (100.0%) | 642 (100.0%) |
| 15 Years | 216 (100.0%) | 210 (66.2%) |
| 16 and 17 Years | 426 (93.4%) | 270 (85.4%) |
| 18 to 24 Years | 1,862 (98.7%) | 1,075 (77.5%) |
| 25 to 34 Years | 2,188 (92.9%) | 2,204 (94.9%) |
| 35 to 44 Years | 2,499 (91.9%) | 3,004 (90.4%) |
| 45 to 54 Years | 2,595 (88.7%) | 2,487 (94.6%) |
| 55 to 64 Years | 2,337 (94.7%) | 2,620 (90.6%) |
| 65 to 74 Years | 1,289 (95.2%) | 1,491 (88.6%) |
| 75 Years and over | 527 (87.7%) | 701 (80.5%) |
| Total | 18,088 (92.5%) | 17,310 (90.3%) |
Income Below Poverty Among Married-Couple Families in Navarre
The poverty statistics for married-couple families in Navarre show that 6.0% or 541 of the total 8,935 families live below the poverty line. Families with 3 or 4 children have the highest poverty rate of 16.5%, comprising of 149 families. On the other hand, families with 5 or more children have the lowest poverty rate of 0.0%, which includes 0 families.
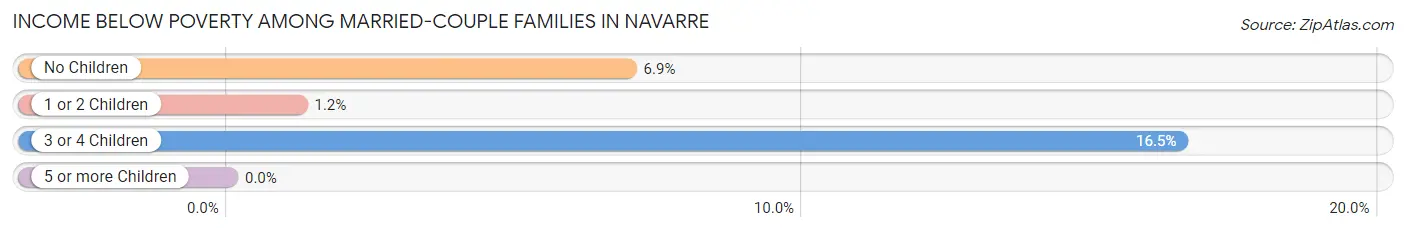
| Children | Above Poverty | Below Poverty |
| No Children | 4,785 (93.1%) | 357 (6.9%) |
| 1 or 2 Children | 2,856 (98.8%) | 35 (1.2%) |
| 3 or 4 Children | 752 (83.5%) | 149 (16.5%) |
| 5 or more Children | 1 (100.0%) | 0 (0.0%) |
| Total | 8,394 (94.0%) | 541 (6.0%) |
Income Below Poverty Among Single-Parent Households in Navarre
According to the poverty data in Navarre, 3.4% or 16 single-father households and 13.9% or 183 single-mother households are living below the poverty line. Among single-father households, those with 1 or 2 children have the highest poverty rate, with 16 households (6.8%) experiencing poverty. Likewise, among single-mother households, those with 1 or 2 children have the highest poverty rate, with 150 households (17.3%) falling below the poverty line.
| Children | Single Father | Single Mother |
| No Children | 0 (0.0%) | 0 (0.0%) |
| 1 or 2 Children | 16 (6.8%) | 150 (17.3%) |
| 3 or 4 Children | 0 (0.0%) | 33 (15.3%) |
| 5 or more Children | 0 (0.0%) | 0 (0.0%) |
| Total | 16 (3.4%) | 183 (13.9%) |
Income Below Poverty Among Married-Couple vs Single-Parent Households in Navarre
The poverty data for Navarre shows that 541 of the married-couple family households (6.0%) and 199 of the single-parent households (11.1%) are living below the poverty level. Within the married-couple family households, those with 3 or 4 children have the highest poverty rate, with 149 households (16.5%) falling below the poverty line. Among the single-parent households, those with 1 or 2 children have the highest poverty rate, with 166 household (15.1%) living below poverty.
| Children | Married-Couple Families | Single-Parent Households |
| No Children | 357 (6.9%) | 0 (0.0%) |
| 1 or 2 Children | 35 (1.2%) | 166 (15.1%) |
| 3 or 4 Children | 149 (16.5%) | 33 (9.8%) |
| 5 or more Children | 0 (0.0%) | 0 (0.0%) |
| Total | 541 (6.0%) | 199 (11.1%) |
Race in Navarre
The most populous races in Navarre are White / Caucasian (31,010 | 79.9%), Hispanic or Latino (3,927 | 10.1%), and Two or more Races (3,070 | 7.9%).
| Race | # Population | % Population |
| Asian | 1,022 | 2.6% |
| Black / African American | 2,218 | 5.7% |
| Hawaiian / Pacific | 24 | 0.1% |
| Hispanic or Latino | 3,927 | 10.1% |
| Native / Alaskan | 37 | 0.1% |
| White / Caucasian | 31,010 | 79.9% |
| Two or more Races | 3,070 | 7.9% |
| Some other Race | 1,448 | 3.7% |
| Total | 38,829 | 100.0% |
Ancestry in Navarre
The most populous ancestries reported in Navarre are German (7,126 | 18.3%), Irish (3,984 | 10.3%), American (3,503 | 9.0%), English (3,424 | 8.8%), and Italian (2,078 | 5.3%), together accounting for 51.8% of all Navarre residents.
| Ancestry | # Population | % Population |
| African | 259 | 0.7% |
| American | 3,503 | 9.0% |
| Arab | 74 | 0.2% |
| Australian | 1 | 0.0% |
| Austrian | 287 | 0.7% |
| Bahamian | 16 | 0.0% |
| Belizean | 54 | 0.1% |
| Bhutanese | 191 | 0.5% |
| Blackfeet | 27 | 0.1% |
| Brazilian | 44 | 0.1% |
| British | 572 | 1.5% |
| Burmese | 42 | 0.1% |
| Cajun | 21 | 0.1% |
| Cambodian | 49 | 0.1% |
| Canadian | 36 | 0.1% |
| Central American | 826 | 2.1% |
| Central American Indian | 37 | 0.1% |
| Cherokee | 394 | 1.0% |
| Chilean | 15 | 0.0% |
| Choctaw | 62 | 0.2% |
| Colombian | 194 | 0.5% |
| Costa Rican | 67 | 0.2% |
| Cree | 34 | 0.1% |
| Creek | 44 | 0.1% |
| Cuban | 549 | 1.4% |
| Czech | 50 | 0.1% |
| Czechoslovakian | 42 | 0.1% |
| Danish | 11 | 0.0% |
| Dominican | 278 | 0.7% |
| Dutch | 386 | 1.0% |
| Dutch West Indian | 14 | 0.0% |
| Eastern European | 80 | 0.2% |
| Ecuadorian | 141 | 0.4% |
| Egyptian | 55 | 0.1% |
| English | 3,424 | 8.8% |
| European | 601 | 1.5% |
| Finnish | 124 | 0.3% |
| French | 651 | 1.7% |
| French Canadian | 454 | 1.2% |
| German | 7,126 | 18.3% |
| Greek | 156 | 0.4% |
| Guatemalan | 34 | 0.1% |
| Honduran | 483 | 1.2% |
| Hungarian | 213 | 0.5% |
| Indian (Asian) | 26 | 0.1% |
| Inupiat | 21 | 0.1% |
| Irish | 3,984 | 10.3% |
| Italian | 2,078 | 5.3% |
| Jamaican | 83 | 0.2% |
| Korean | 888 | 2.3% |
| Lithuanian | 21 | 0.1% |
| Luxembourger | 27 | 0.1% |
| Mexican | 903 | 2.3% |
| Mexican American Indian | 86 | 0.2% |
| Native Hawaiian | 93 | 0.2% |
| Navajo | 250 | 0.6% |
| Northern European | 126 | 0.3% |
| Norwegian | 439 | 1.1% |
| Pakistani | 282 | 0.7% |
| Panamanian | 220 | 0.6% |
| Polish | 960 | 2.5% |
| Portuguese | 86 | 0.2% |
| Puerto Rican | 723 | 1.9% |
| Russian | 1,355 | 3.5% |
| Salvadoran | 22 | 0.1% |
| Scandinavian | 487 | 1.3% |
| Scotch-Irish | 472 | 1.2% |
| Scottish | 547 | 1.4% |
| Slavic | 122 | 0.3% |
| South African | 39 | 0.1% |
| South American | 350 | 0.9% |
| Spaniard | 44 | 0.1% |
| Spanish | 62 | 0.2% |
| Sri Lankan | 285 | 0.7% |
| Subsaharan African | 326 | 0.8% |
| Swedish | 746 | 1.9% |
| Swiss | 7 | 0.0% |
| Syrian | 56 | 0.1% |
| Thai | 166 | 0.4% |
| Trinidadian and Tobagonian | 29 | 0.1% |
| Turkish | 100 | 0.3% |
| Ukrainian | 9 | 0.0% |
| Welsh | 55 | 0.1% |
| West Indian | 43 | 0.1% | View All 84 Rows |
Immigrants in Navarre
The most numerous immigrant groups reported in Navarre came from Latin America (849 | 2.2%), Europe (810 | 2.1%), Asia (725 | 1.9%), South Eastern Asia (519 | 1.3%), and Philippines (378 | 1.0%), together accounting for 8.5% of all Navarre residents.
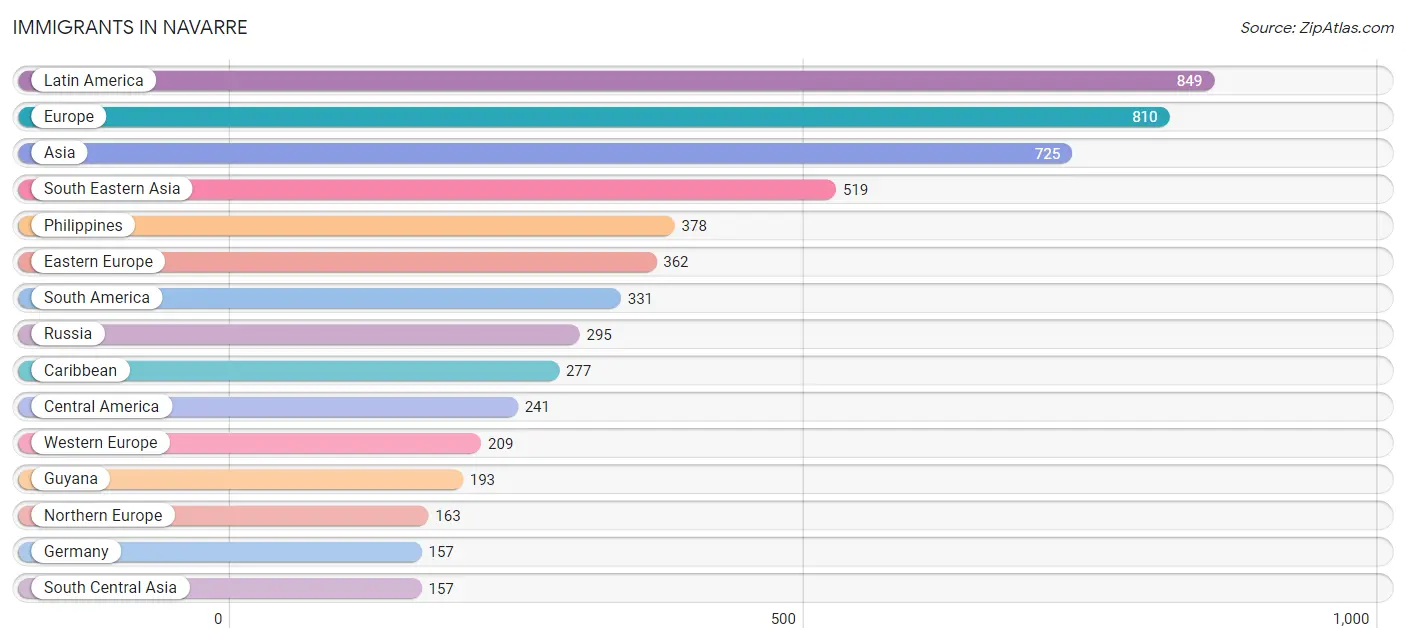
| Immigration Origin | # Population | % Population |
| Africa | 29 | 0.1% |
| Asia | 725 | 1.9% |
| Bangladesh | 137 | 0.4% |
| Barbados | 119 | 0.3% |
| Canada | 32 | 0.1% |
| Caribbean | 277 | 0.7% |
| Central America | 241 | 0.6% |
| Colombia | 138 | 0.4% |
| Costa Rica | 67 | 0.2% |
| Cuba | 74 | 0.2% |
| Czechoslovakia | 25 | 0.1% |
| Eastern Asia | 43 | 0.1% |
| Eastern Europe | 362 | 0.9% |
| England | 47 | 0.1% |
| Europe | 810 | 2.1% |
| France | 19 | 0.1% |
| Germany | 157 | 0.4% |
| Guatemala | 34 | 0.1% |
| Guyana | 193 | 0.5% |
| Honduras | 37 | 0.1% |
| India | 20 | 0.1% |
| Italy | 44 | 0.1% |
| Jamaica | 41 | 0.1% |
| Japan | 43 | 0.1% |
| Latin America | 849 | 2.2% |
| Mexico | 34 | 0.1% |
| Micronesia | 1 | 0.0% |
| Netherlands | 31 | 0.1% |
| Northern Europe | 163 | 0.4% |
| Oceania | 1 | 0.0% |
| Panama | 69 | 0.2% |
| Philippines | 378 | 1.0% |
| Romania | 42 | 0.1% |
| Russia | 295 | 0.8% |
| South Africa | 29 | 0.1% |
| South America | 331 | 0.9% |
| South Central Asia | 157 | 0.4% |
| South Eastern Asia | 519 | 1.3% |
| Southern Europe | 76 | 0.2% |
| Spain | 32 | 0.1% |
| Switzerland | 2 | 0.0% |
| Trinidad and Tobago | 29 | 0.1% |
| Vietnam | 141 | 0.4% |
| Western Europe | 209 | 0.5% | View All 44 Rows |
Sex and Age in Navarre
Sex and Age in Navarre
The most populous age groups in Navarre are 10 to 14 Years (1,978 | 10.1%) for men and 35 to 39 Years (1,961 | 10.2%) for women.
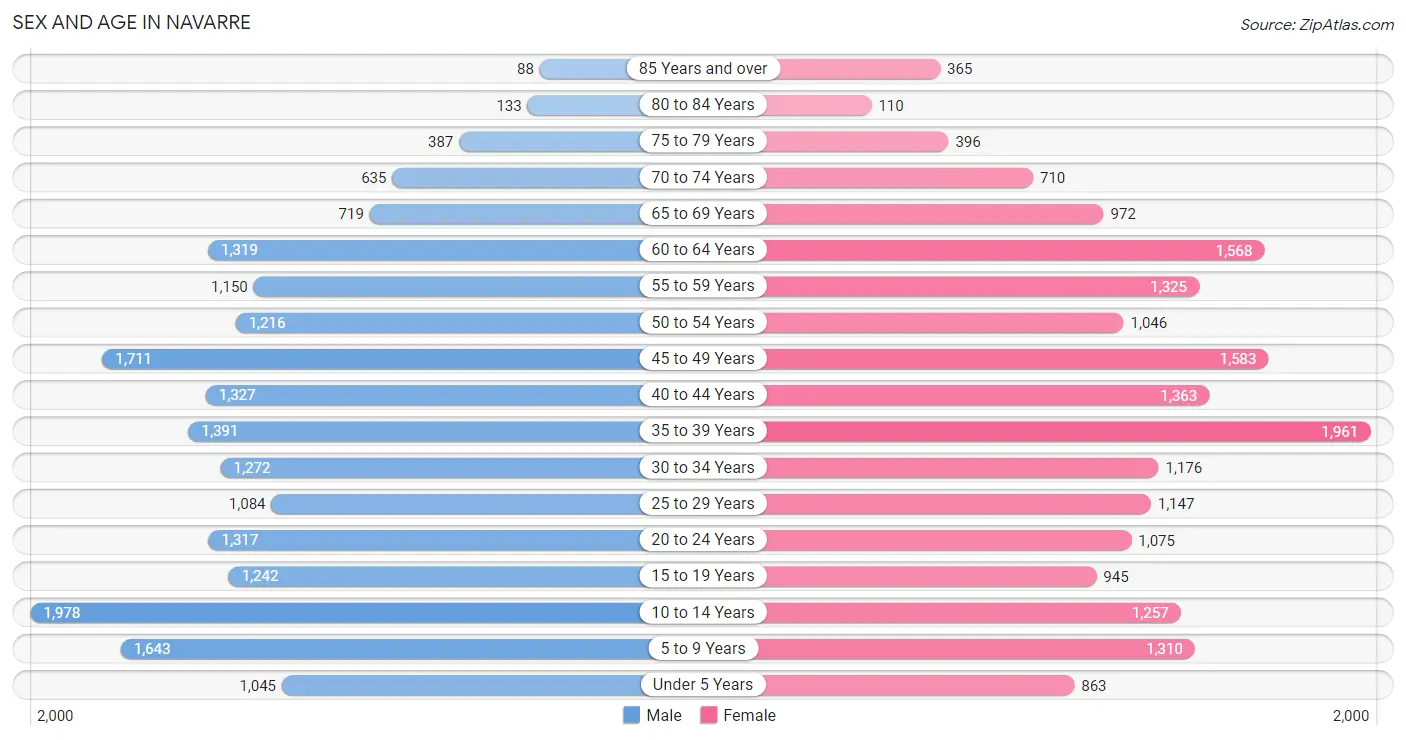
| Age Bracket | Male | Female |
| Under 5 Years | 1,045 (5.3%) | 863 (4.5%) |
| 5 to 9 Years | 1,643 (8.4%) | 1,310 (6.8%) |
| 10 to 14 Years | 1,978 (10.1%) | 1,257 (6.6%) |
| 15 to 19 Years | 1,242 (6.3%) | 945 (4.9%) |
| 20 to 24 Years | 1,317 (6.7%) | 1,075 (5.6%) |
| 25 to 29 Years | 1,084 (5.5%) | 1,147 (6.0%) |
| 30 to 34 Years | 1,272 (6.5%) | 1,176 (6.1%) |
| 35 to 39 Years | 1,391 (7.1%) | 1,961 (10.2%) |
| 40 to 44 Years | 1,327 (6.8%) | 1,363 (7.1%) |
| 45 to 49 Years | 1,711 (8.7%) | 1,583 (8.3%) |
| 50 to 54 Years | 1,216 (6.2%) | 1,046 (5.5%) |
| 55 to 59 Years | 1,150 (5.9%) | 1,325 (6.9%) |
| 60 to 64 Years | 1,319 (6.7%) | 1,568 (8.2%) |
| 65 to 69 Years | 719 (3.7%) | 972 (5.1%) |
| 70 to 74 Years | 635 (3.2%) | 710 (3.7%) |
| 75 to 79 Years | 387 (2.0%) | 396 (2.1%) |
| 80 to 84 Years | 133 (0.7%) | 110 (0.6%) |
| 85 Years and over | 88 (0.4%) | 365 (1.9%) |
| Total | 19,657 (100.0%) | 19,172 (100.0%) |
Families and Households in Navarre
Median Family Size in Navarre
The median family size in Navarre is 3.15 persons per family, with single female/mother families (1,319 | 12.3%) accounting for the largest median family size of 3.47 persons per family. On the other hand, single male/father families (471 | 4.4%) represent the smallest median family size with 2.82 persons per family.
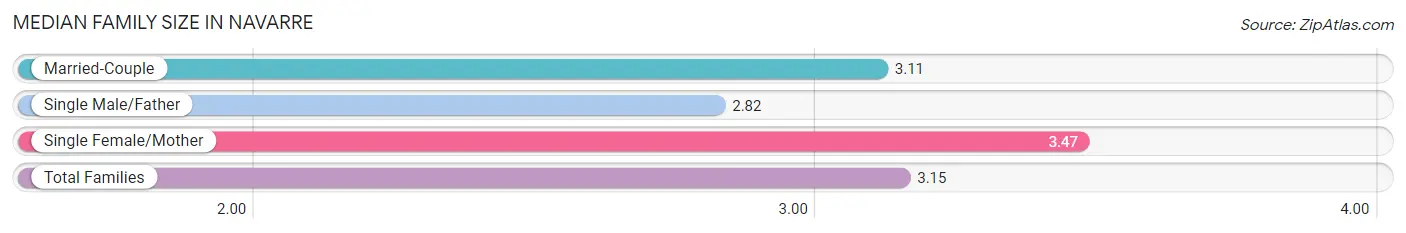
| Family Type | # Families | Family Size |
| Married-Couple | 8,935 (83.3%) | 3.11 |
| Single Male/Father | 471 (4.4%) | 2.82 |
| Single Female/Mother | 1,319 (12.3%) | 3.47 |
| Total Families | 10,725 (100.0%) | 3.15 |
Median Household Size in Navarre
The median household size in Navarre is 2.77 persons per household, with single female/mother households (1,319 | 9.4%) accounting for the largest median household size of 3.76 persons per household. non-family households (3,262 | 23.3%) represent the smallest median household size with 1.31 persons per household.
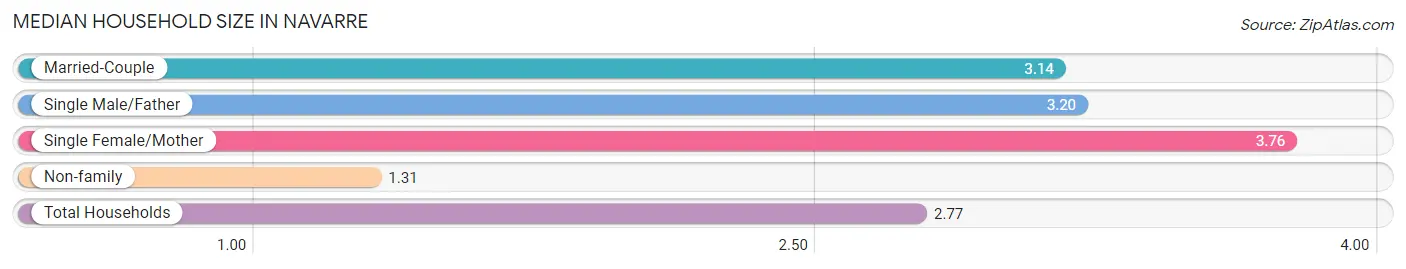
| Household Type | # Households | Household Size |
| Married-Couple | 8,935 (63.9%) | 3.14 |
| Single Male/Father | 471 (3.4%) | 3.20 |
| Single Female/Mother | 1,319 (9.4%) | 3.76 |
| Non-family | 3,262 (23.3%) | 1.31 |
| Total Households | 13,987 (100.0%) | 2.77 |
Household Size by Marriage Status in Navarre
Out of a total of 13,987 households in Navarre, 10,725 (76.7%) are family households, while 3,262 (23.3%) are nonfamily households. The most numerous type of family households are 2-person households, comprising 4,372, and the most common type of nonfamily households are 1-person households, comprising 2,592.
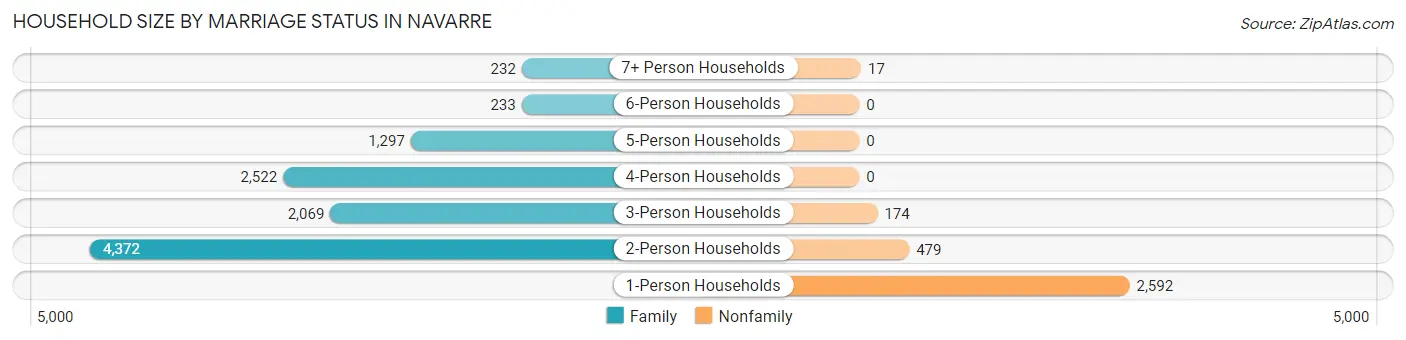
| Household Size | Family Households | Nonfamily Households |
| 1-Person Households | - | 2,592 (18.5%) |
| 2-Person Households | 4,372 (31.3%) | 479 (3.4%) |
| 3-Person Households | 2,069 (14.8%) | 174 (1.2%) |
| 4-Person Households | 2,522 (18.0%) | 0 (0.0%) |
| 5-Person Households | 1,297 (9.3%) | 0 (0.0%) |
| 6-Person Households | 233 (1.7%) | 0 (0.0%) |
| 7+ Person Households | 232 (1.7%) | 17 (0.1%) |
| Total | 10,725 (76.7%) | 3,262 (23.3%) |
Female Fertility in Navarre
Fertility by Age in Navarre
Average fertility rate in Navarre is 24.0 births per 1,000 women. Women in the age bracket of 15 to 19 years have the highest fertility rate with 69.0 births per 1,000 women. Women in the age bracket of 20 to 34 years acount for 65.6% of all women with births.
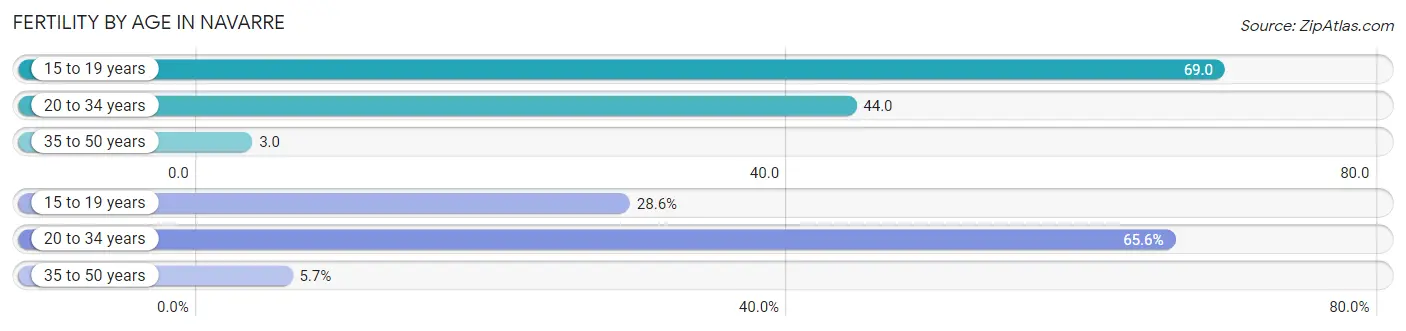
| Age Bracket | Women with Births | Births / 1,000 Women |
| 15 to 19 years | 65 (28.6%) | 69.0 |
| 20 to 34 years | 149 (65.6%) | 44.0 |
| 35 to 50 years | 13 (5.7%) | 3.0 |
| Total | 227 (100.0%) | 24.0 |
Fertility by Age by Marriage Status in Navarre
40.1% of women with births (227) in Navarre are married. The highest percentage of unmarried women with births falls into 15 to 19 years age bracket with 100.0% of them unmarried at the time of birth, while the lowest percentage of unmarried women with births belong to 35 to 50 years age bracket with 0.0% of them unmarried.
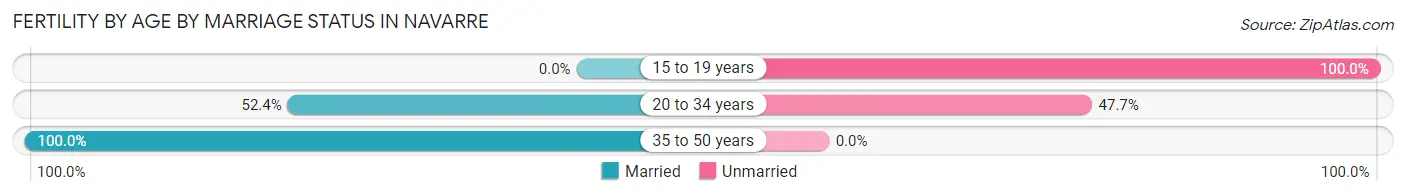
| Age Bracket | Married | Unmarried |
| 15 to 19 years | 0 (0.0%) | 65 (100.0%) |
| 20 to 34 years | 78 (52.3%) | 71 (47.6%) |
| 35 to 50 years | 13 (100.0%) | 0 (0.0%) |
| Total | 91 (40.1%) | 136 (59.9%) |
Fertility by Education in Navarre
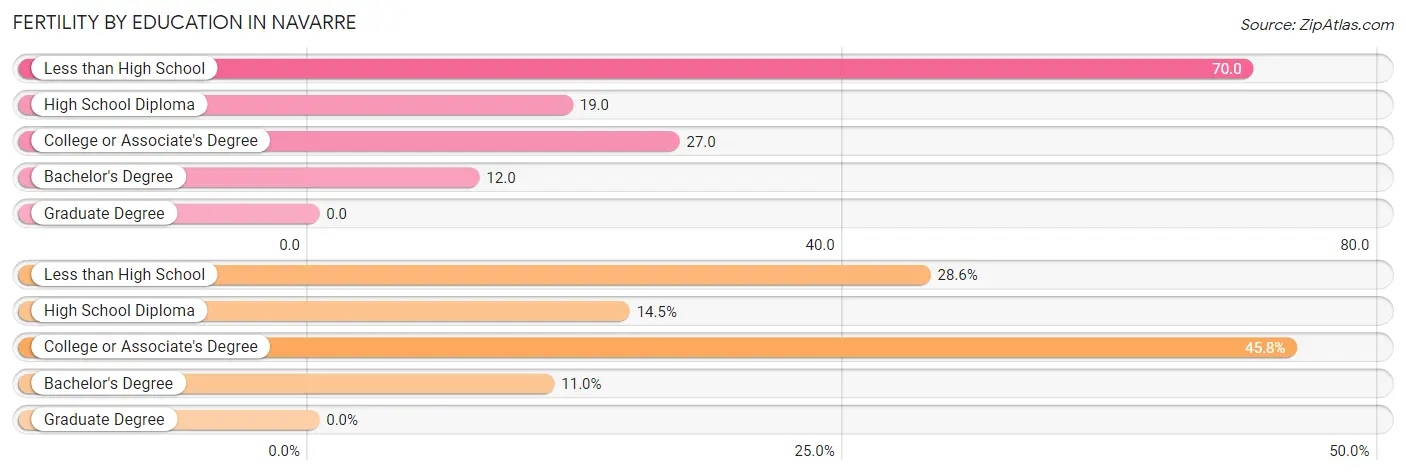
| Educational Attainment | Women with Births | Births / 1,000 Women |
| Less than High School | 65 (28.6%) | 70.0 |
| High School Diploma | 33 (14.5%) | 19.0 |
| College or Associate's Degree | 104 (45.8%) | 27.0 |
| Bachelor's Degree | 25 (11.0%) | 12.0 |
| Graduate Degree | 0 (0.0%) | 0.0 |
| Total | 227 (100.0%) | 24.0 |
Fertility by Education by Marriage Status in Navarre
59.9% of women with births in Navarre are unmarried. Women with the educational attainment of bachelor's degree are most likely to be married with 100.0% of them married at childbirth, while women with the educational attainment of less than high school are least likely to be married with 100.0% of them unmarried at childbirth.
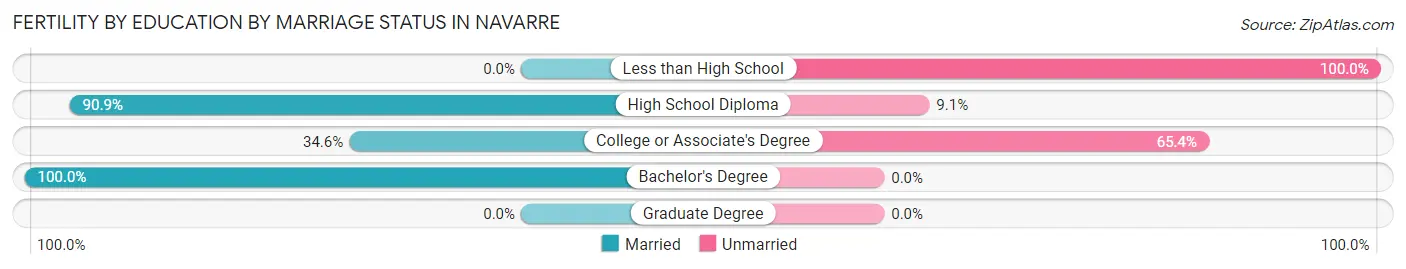
| Educational Attainment | Married | Unmarried |
| Less than High School | 0 (0.0%) | 65 (100.0%) |
| High School Diploma | 30 (90.9%) | 3 (9.1%) |
| College or Associate's Degree | 36 (34.6%) | 68 (65.4%) |
| Bachelor's Degree | 25 (100.0%) | 0 (0.0%) |
| Graduate Degree | 0 (0.0%) | 0 (0.0%) |
| Total | 91 (40.1%) | 136 (59.9%) |
Employment Characteristics in Navarre
Employment by Class of Employer in Navarre
Among the 17,697 employed individuals in Navarre, private company employees (9,320 | 52.7%), federal government employees (5,037 | 28.5%), and self-employed (incorporated) (877 | 5.0%) make up the most common classes of employment.
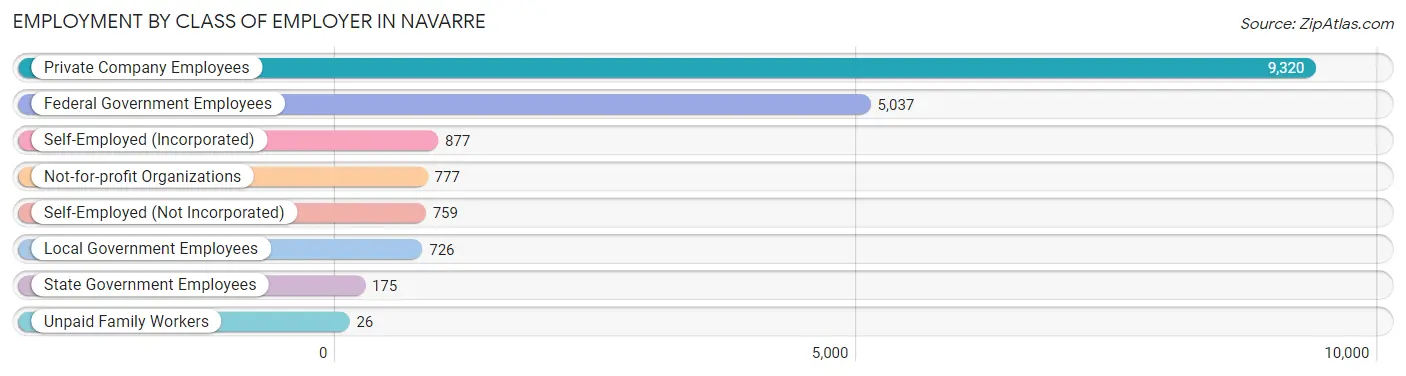
| Employer Class | # Employees | % Employees |
| Private Company Employees | 9,320 | 52.7% |
| Self-Employed (Incorporated) | 877 | 5.0% |
| Self-Employed (Not Incorporated) | 759 | 4.3% |
| Not-for-profit Organizations | 777 | 4.4% |
| Local Government Employees | 726 | 4.1% |
| State Government Employees | 175 | 1.0% |
| Federal Government Employees | 5,037 | 28.5% |
| Unpaid Family Workers | 26 | 0.2% |
| Total | 17,697 | 100.0% |
Employment Status by Age in Navarre
According to the labor force statistics for Navarre, out of the total population over 16 years of age (30,200), 62.3% or 18,815 individuals are in the labor force, with 5.6% or 1,054 of them unemployed. The age group with the highest labor force participation rate is 20 to 24 years, with 83.4% or 1,995 individuals in the labor force. Within the labor force, the 16 to 19 years age range has the highest percentage of unemployed individuals, with 15.0% or 124 of them being unemployed.
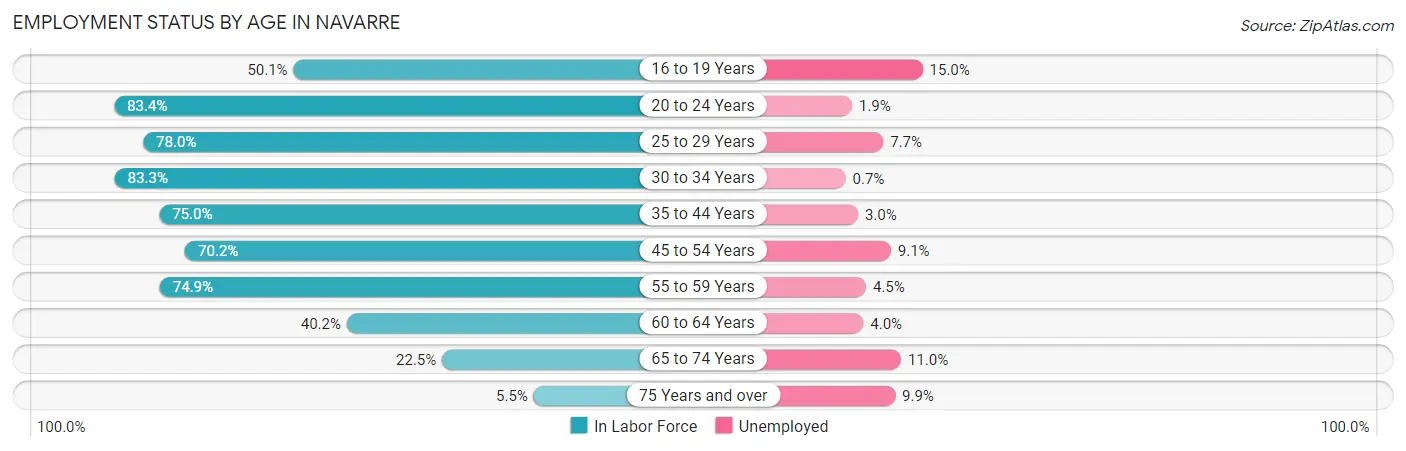
| Age Bracket | In Labor Force | Unemployed |
| 16 to 19 Years | 829 (50.1%) | 124 (15.0%) |
| 20 to 24 Years | 1,995 (83.4%) | 38 (1.9%) |
| 25 to 29 Years | 1,740 (78.0%) | 134 (7.7%) |
| 30 to 34 Years | 2,039 (83.3%) | 14 (0.7%) |
| 35 to 44 Years | 4,532 (75.0%) | 136 (3.0%) |
| 45 to 54 Years | 3,900 (70.2%) | 355 (9.1%) |
| 55 to 59 Years | 1,854 (74.9%) | 83 (4.5%) |
| 60 to 64 Years | 1,161 (40.2%) | 46 (4.0%) |
| 65 to 74 Years | 683 (22.5%) | 75 (11.0%) |
| 75 Years and over | 81 (5.5%) | 8 (9.9%) |
| Total | 18,815 (62.3%) | 1,054 (5.6%) |
Employment Status by Educational Attainment in Navarre
According to labor force statistics for Navarre, 70.4% of individuals (15,234) out of the total population between 25 and 64 years of age (21,639) are in the labor force, with 5.2% or 792 of them being unemployed. The group with the highest labor force participation rate are those with the educational attainment of bachelor's degree or higher, with 79.0% or 5,636 individuals in the labor force. Within the labor force, individuals with bachelor's degree or higher education have the highest percentage of unemployment, with 8.7% or 490 of them being unemployed.
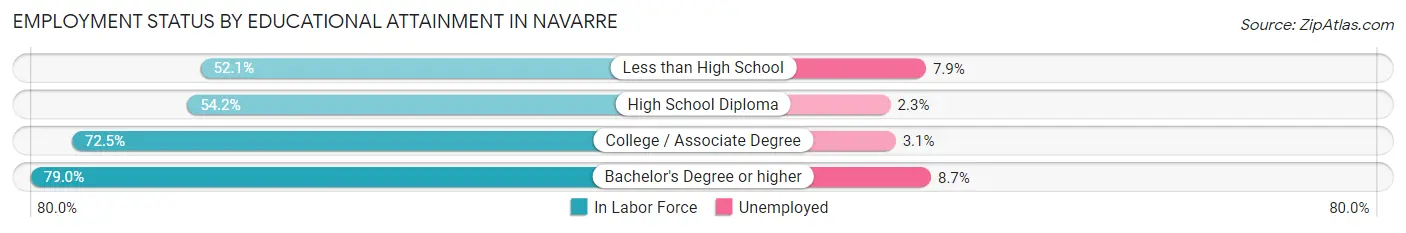
| Educational Attainment | In Labor Force | Unemployed |
| Less than High School | 367 (52.1%) | 56 (7.9%) |
| High School Diploma | 2,322 (54.2%) | 99 (2.3%) |
| College / Associate Degree | 6,900 (72.5%) | 295 (3.1%) |
| Bachelor's Degree or higher | 5,636 (79.0%) | 621 (8.7%) |
| Total | 15,234 (70.4%) | 1,125 (5.2%) |
Employment Occupations by Sex in Navarre
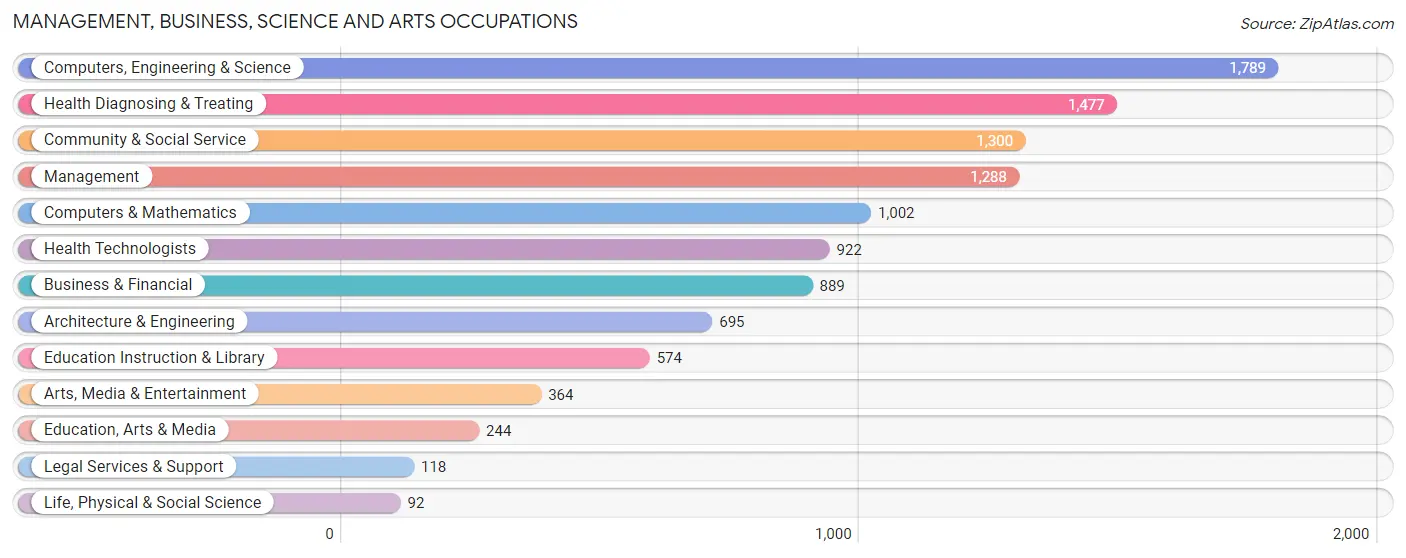
Management, Business, Science and Arts Occupations
The most common Management, Business, Science and Arts occupations in Navarre are Computers, Engineering & Science (1,789 | 11.6%), Health Diagnosing & Treating (1,477 | 9.6%), Community & Social Service (1,300 | 8.5%), Management (1,288 | 8.4%), and Computers & Mathematics (1,002 | 6.5%).
Management, Business, Science and Arts Occupations by Sex
Within the Management, Business, Science and Arts occupations in Navarre, the most male-oriented occupations are Architecture & Engineering (96.1%), Computers, Engineering & Science (81.5%), and Computers & Mathematics (72.7%), while the most female-oriented occupations are Education Instruction & Library (86.8%), Health Diagnosing & Treating (81.2%), and Legal Services & Support (80.5%).
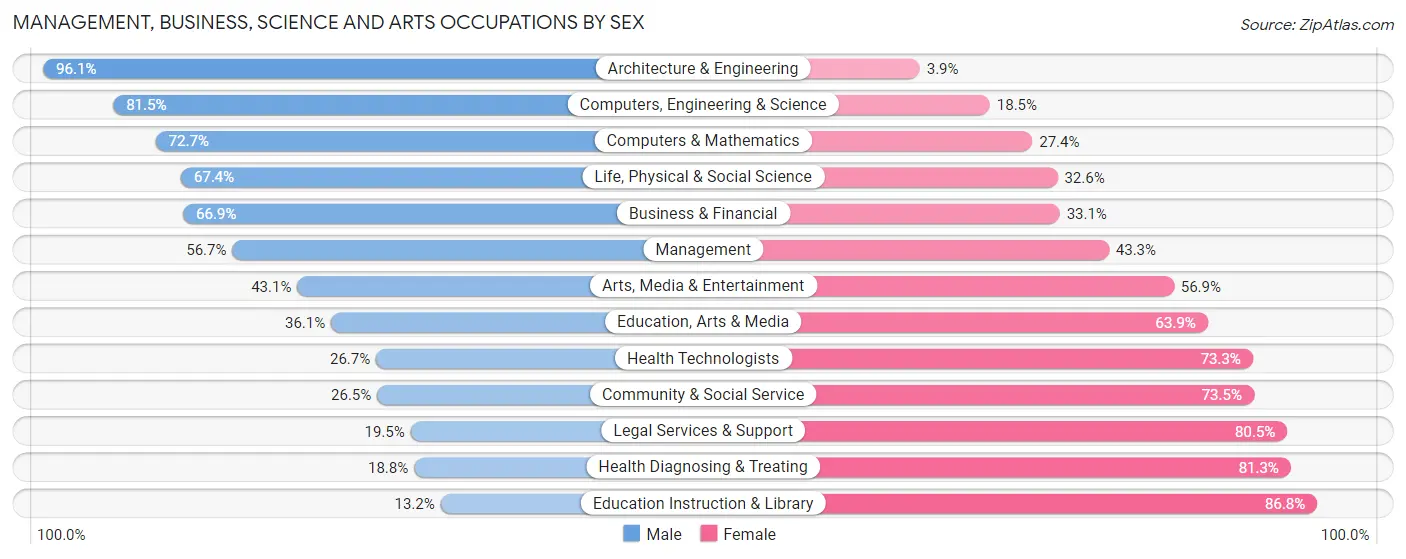
| Occupation | Male | Female |
| Management | 730 (56.7%) | 558 (43.3%) |
| Business & Financial | 595 (66.9%) | 294 (33.1%) |
| Computers, Engineering & Science | 1,458 (81.5%) | 331 (18.5%) |
| Computers & Mathematics | 728 (72.7%) | 274 (27.4%) |
| Architecture & Engineering | 668 (96.1%) | 27 (3.9%) |
| Life, Physical & Social Science | 62 (67.4%) | 30 (32.6%) |
| Community & Social Service | 344 (26.5%) | 956 (73.5%) |
| Education, Arts & Media | 88 (36.1%) | 156 (63.9%) |
| Legal Services & Support | 23 (19.5%) | 95 (80.5%) |
| Education Instruction & Library | 76 (13.2%) | 498 (86.8%) |
| Arts, Media & Entertainment | 157 (43.1%) | 207 (56.9%) |
| Health Diagnosing & Treating | 277 (18.8%) | 1,200 (81.2%) |
| Health Technologists | 246 (26.7%) | 676 (73.3%) |
| Total (Category) | 3,404 (50.5%) | 3,339 (49.5%) |
| Total (Overall) | 8,170 (53.1%) | 7,218 (46.9%) |
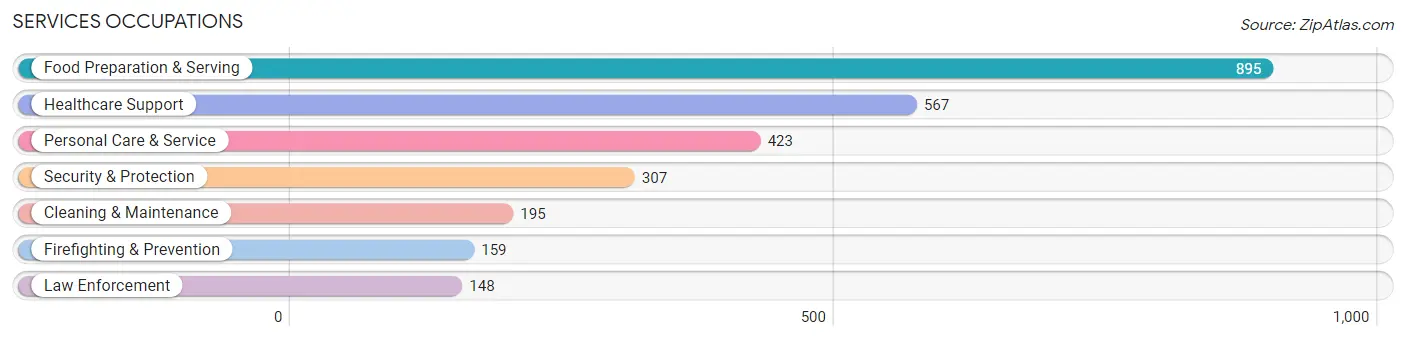
Services Occupations
The most common Services occupations in Navarre are Food Preparation & Serving (895 | 5.8%), Healthcare Support (567 | 3.7%), Personal Care & Service (423 | 2.8%), Security & Protection (307 | 2.0%), and Cleaning & Maintenance (195 | 1.3%).
Services Occupations by Sex
Within the Services occupations in Navarre, the most male-oriented occupations are Firefighting & Prevention (95.0%), Security & Protection (79.1%), and Cleaning & Maintenance (75.9%), while the most female-oriented occupations are Healthcare Support (90.6%), Personal Care & Service (85.8%), and Food Preparation & Serving (54.6%).
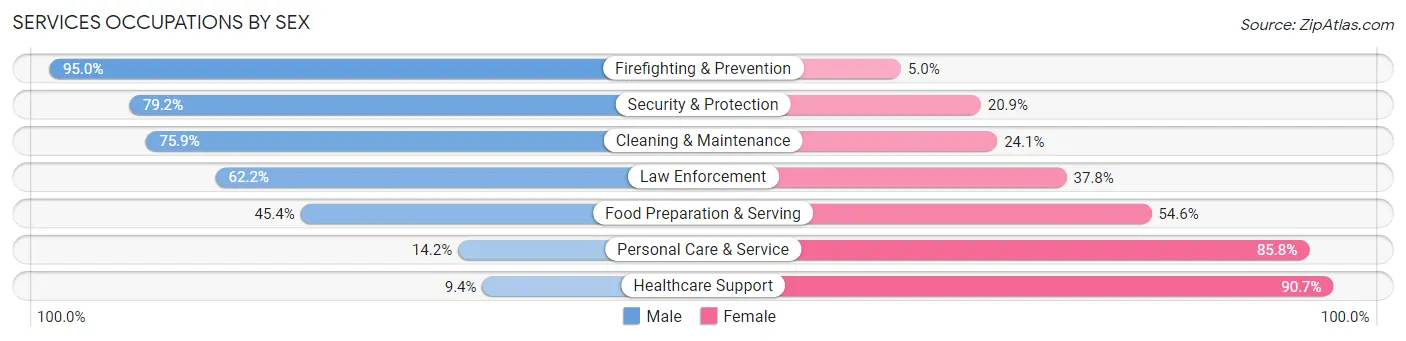
| Occupation | Male | Female |
| Healthcare Support | 53 (9.3%) | 514 (90.6%) |
| Security & Protection | 243 (79.1%) | 64 (20.8%) |
| Firefighting & Prevention | 151 (95.0%) | 8 (5.0%) |
| Law Enforcement | 92 (62.2%) | 56 (37.8%) |
| Food Preparation & Serving | 406 (45.4%) | 489 (54.6%) |
| Cleaning & Maintenance | 148 (75.9%) | 47 (24.1%) |
| Personal Care & Service | 60 (14.2%) | 363 (85.8%) |
| Total (Category) | 910 (38.1%) | 1,477 (61.9%) |
| Total (Overall) | 8,170 (53.1%) | 7,218 (46.9%) |
Sales and Office Occupations
The most common Sales and Office occupations in Navarre are Office & Administration (1,754 | 11.4%), and Sales & Related (1,552 | 10.1%).

Sales and Office Occupations by Sex
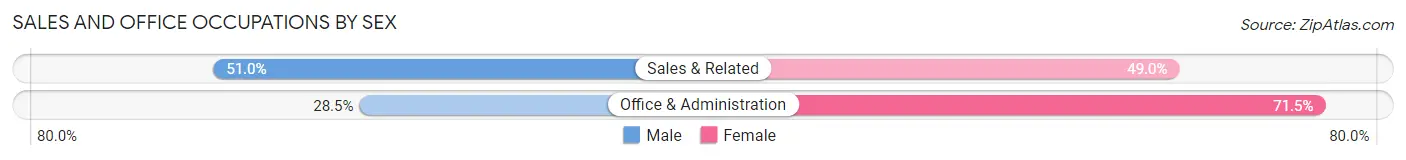
| Occupation | Male | Female |
| Sales & Related | 791 (51.0%) | 761 (49.0%) |
| Office & Administration | 500 (28.5%) | 1,254 (71.5%) |
| Total (Category) | 1,291 (39.1%) | 2,015 (61.0%) |
| Total (Overall) | 8,170 (53.1%) | 7,218 (46.9%) |
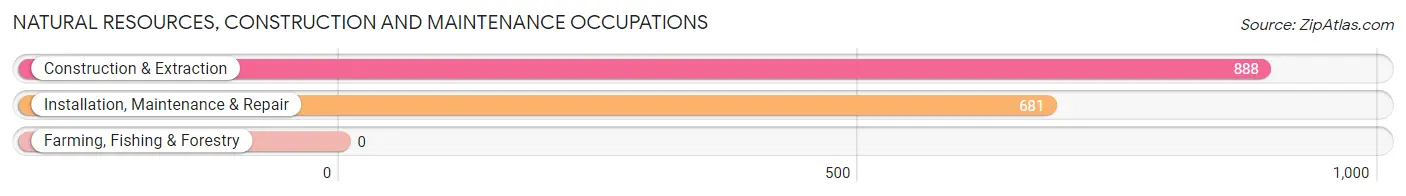
Natural Resources, Construction and Maintenance Occupations
The most common Natural Resources, Construction and Maintenance occupations in Navarre are Construction & Extraction (888 | 5.8%), and Installation, Maintenance & Repair (681 | 4.4%).
Natural Resources, Construction and Maintenance Occupations by Sex
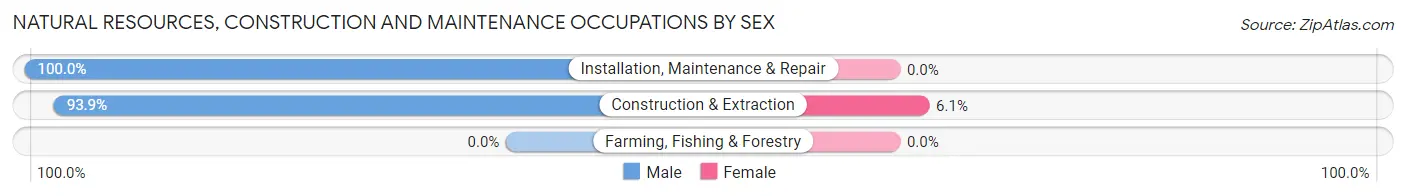
| Occupation | Male | Female |
| Farming, Fishing & Forestry | 0 (0.0%) | 0 (0.0%) |
| Construction & Extraction | 834 (93.9%) | 54 (6.1%) |
| Installation, Maintenance & Repair | 681 (100.0%) | 0 (0.0%) |
| Total (Category) | 1,515 (96.6%) | 54 (3.4%) |
| Total (Overall) | 8,170 (53.1%) | 7,218 (46.9%) |
Production, Transportation and Moving Occupations
The most common Production, Transportation and Moving occupations in Navarre are Transportation (663 | 4.3%), Material Moving (466 | 3.0%), and Production (254 | 1.7%).
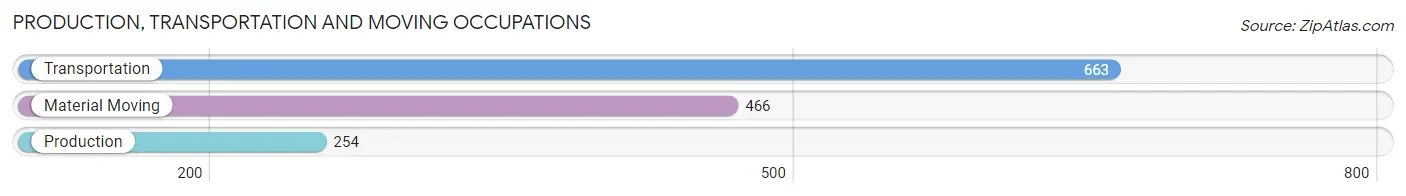
Production, Transportation and Moving Occupations by Sex
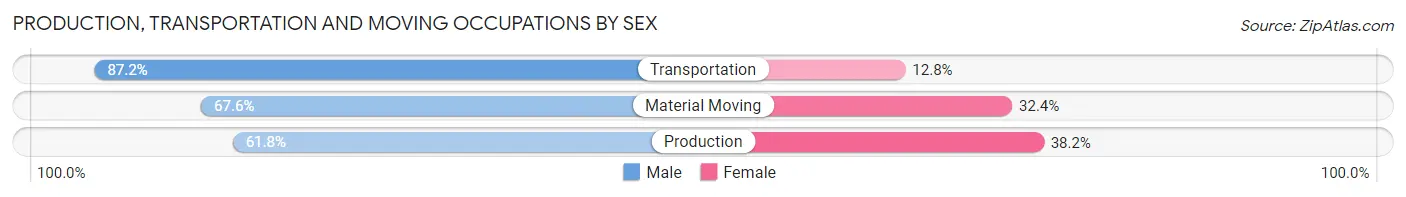
| Occupation | Male | Female |
| Production | 157 (61.8%) | 97 (38.2%) |
| Transportation | 578 (87.2%) | 85 (12.8%) |
| Material Moving | 315 (67.6%) | 151 (32.4%) |
| Total (Category) | 1,050 (75.9%) | 333 (24.1%) |
| Total (Overall) | 8,170 (53.1%) | 7,218 (46.9%) |
Employment Industries by Sex in Navarre
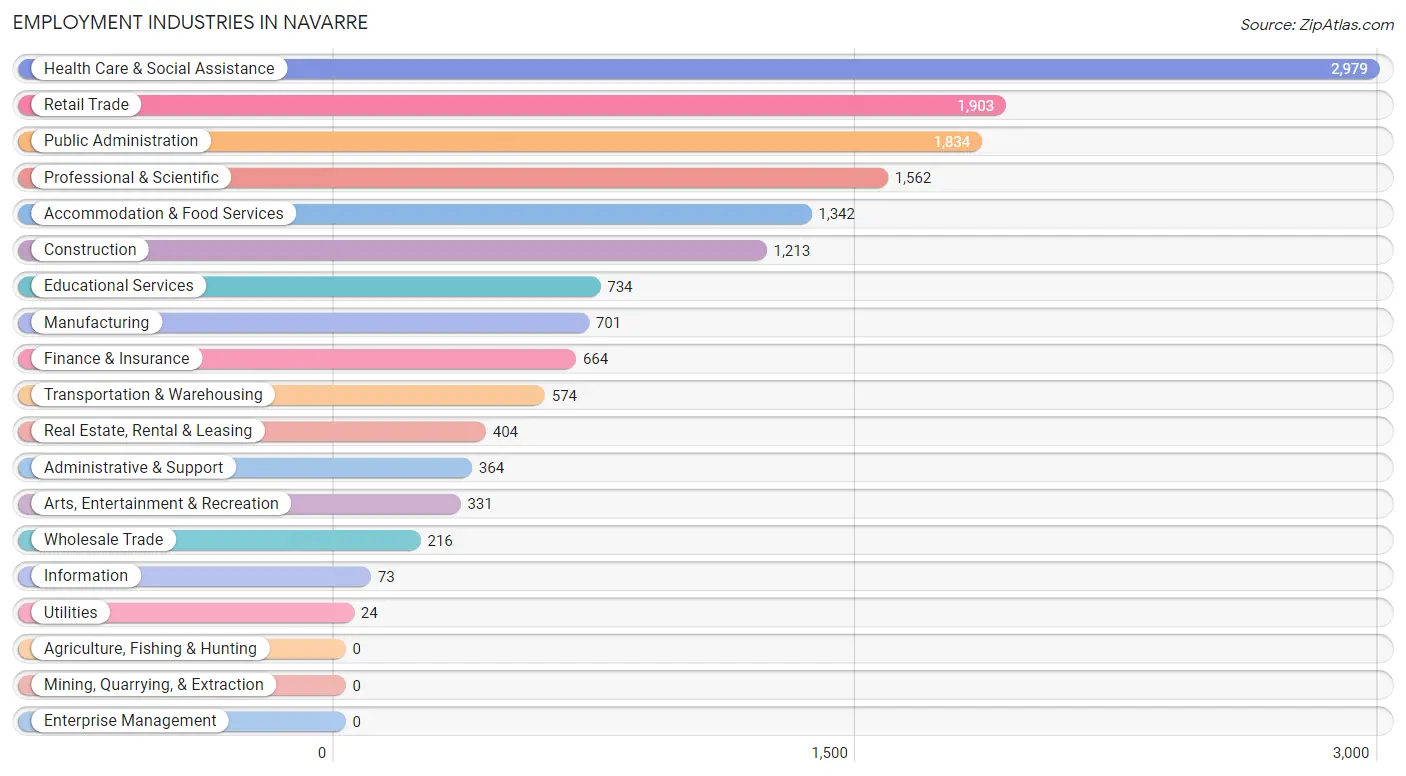
Employment Industries in Navarre
The major employment industries in Navarre include Health Care & Social Assistance (2,979 | 19.4%), Retail Trade (1,903 | 12.4%), Public Administration (1,834 | 11.9%), Professional & Scientific (1,562 | 10.2%), and Accommodation & Food Services (1,342 | 8.7%).
Employment Industries by Sex in Navarre
The Navarre industries that see more men than women are Wholesale Trade (100.0%), Utilities (100.0%), and Construction (90.3%), whereas the industries that tend to have a higher number of women are Educational Services (87.6%), Health Care & Social Assistance (78.3%), and Real Estate, Rental & Leasing (69.3%).
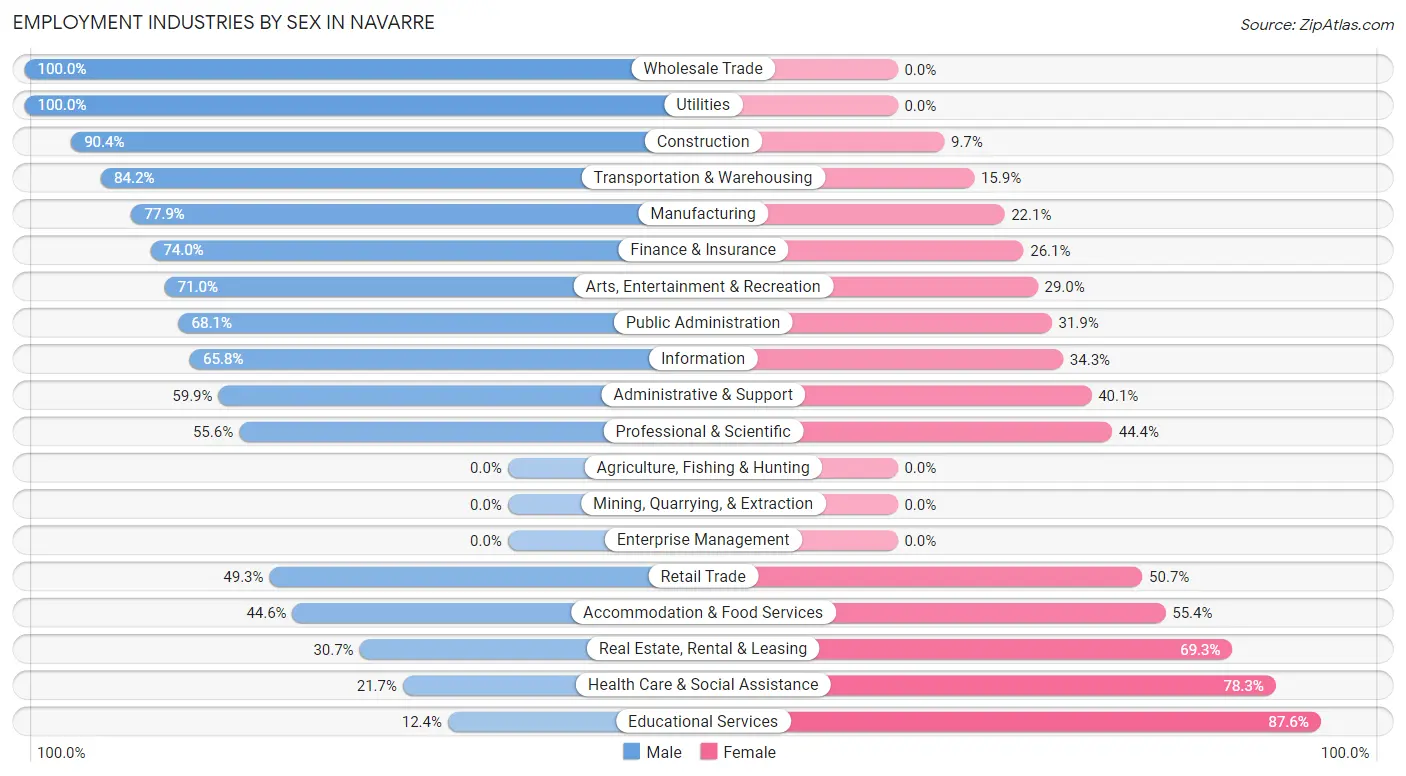
| Industry | Male | Female |
| Agriculture, Fishing & Hunting | 0 (0.0%) | 0 (0.0%) |
| Mining, Quarrying, & Extraction | 0 (0.0%) | 0 (0.0%) |
| Construction | 1,096 (90.3%) | 117 (9.7%) |
| Manufacturing | 546 (77.9%) | 155 (22.1%) |
| Wholesale Trade | 216 (100.0%) | 0 (0.0%) |
| Retail Trade | 939 (49.3%) | 964 (50.7%) |
| Transportation & Warehousing | 483 (84.2%) | 91 (15.9%) |
| Utilities | 24 (100.0%) | 0 (0.0%) |
| Information | 48 (65.7%) | 25 (34.3%) |
| Finance & Insurance | 491 (74.0%) | 173 (26.1%) |
| Real Estate, Rental & Leasing | 124 (30.7%) | 280 (69.3%) |
| Professional & Scientific | 869 (55.6%) | 693 (44.4%) |
| Enterprise Management | 0 (0.0%) | 0 (0.0%) |
| Administrative & Support | 218 (59.9%) | 146 (40.1%) |
| Educational Services | 91 (12.4%) | 643 (87.6%) |
| Health Care & Social Assistance | 647 (21.7%) | 2,332 (78.3%) |
| Arts, Entertainment & Recreation | 235 (71.0%) | 96 (29.0%) |
| Accommodation & Food Services | 598 (44.6%) | 744 (55.4%) |
| Public Administration | 1,249 (68.1%) | 585 (31.9%) |
| Total | 8,170 (53.1%) | 7,218 (46.9%) |
Education in Navarre
School Enrollment in Navarre
The most common levels of schooling among the 10,392 students in Navarre are elementary school (2,811 | 27.1%), middle school (2,376 | 22.9%), and high school (1,921 | 18.5%).
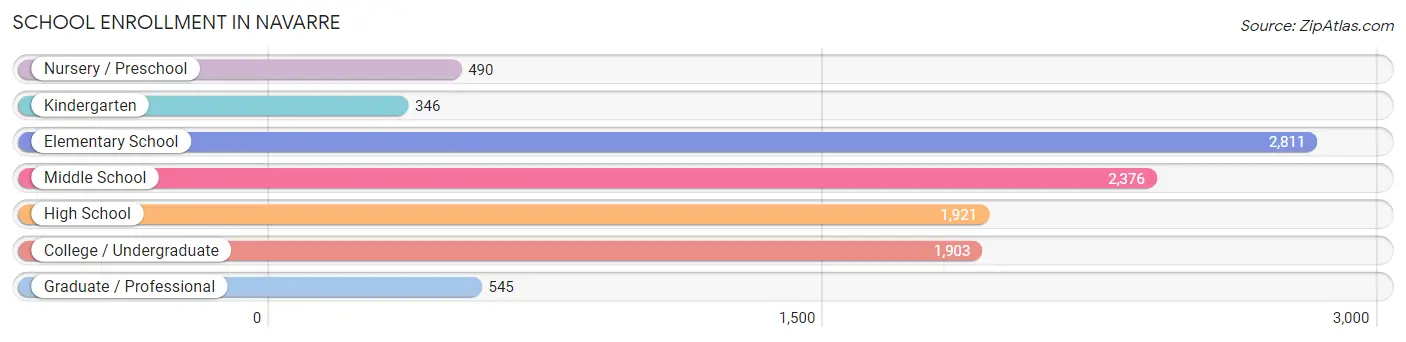
| School Level | # Students | % Students |
| Nursery / Preschool | 490 | 4.7% |
| Kindergarten | 346 | 3.3% |
| Elementary School | 2,811 | 27.1% |
| Middle School | 2,376 | 22.9% |
| High School | 1,921 | 18.5% |
| College / Undergraduate | 1,903 | 18.3% |
| Graduate / Professional | 545 | 5.2% |
| Total | 10,392 | 100.0% |
School Enrollment by Age by Funding Source in Navarre
Out of a total of 10,392 students who are enrolled in schools in Navarre, 1,891 (18.2%) attend a private institution, while the remaining 8,501 (81.8%) are enrolled in public schools. The age group of 3 to 4 year olds has the highest likelihood of being enrolled in private schools, with 183 (74.1% in the age bracket) enrolled. Conversely, the age group of 18 to 19 year olds has the lowest likelihood of being enrolled in a private school, with 561 (100.0% in the age bracket) attending a public institution.
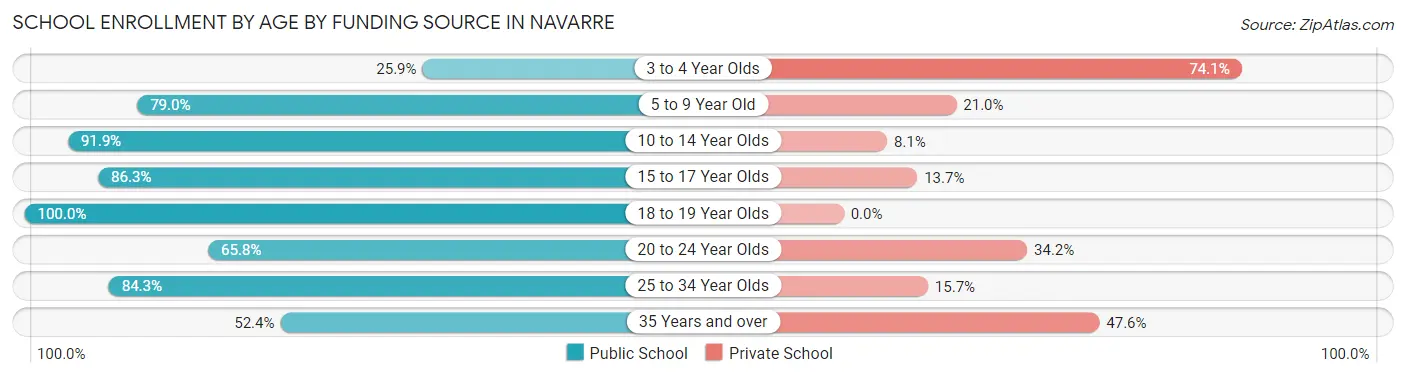
| Age Bracket | Public School | Private School |
| 3 to 4 Year Olds | 64 (25.9%) | 183 (74.1%) |
| 5 to 9 Year Old | 2,274 (79.0%) | 604 (21.0%) |
| 10 to 14 Year Olds | 2,974 (91.9%) | 261 (8.1%) |
| 15 to 17 Year Olds | 1,102 (86.3%) | 175 (13.7%) |
| 18 to 19 Year Olds | 561 (100.0%) | 0 (0.0%) |
| 20 to 24 Year Olds | 499 (65.8%) | 259 (34.2%) |
| 25 to 34 Year Olds | 731 (84.3%) | 136 (15.7%) |
| 35 Years and over | 298 (52.4%) | 271 (47.6%) |
| Total | 8,501 (81.8%) | 1,891 (18.2%) |
Educational Attainment by Field of Study in Navarre
Business (1,935 | 22.4%), science & technology (1,563 | 18.1%), arts & humanities (765 | 8.9%), computers & mathematics (689 | 8.0%), and education (673 | 7.8%) are the most common fields of study among 8,634 individuals in Navarre who have obtained a bachelor's degree or higher.
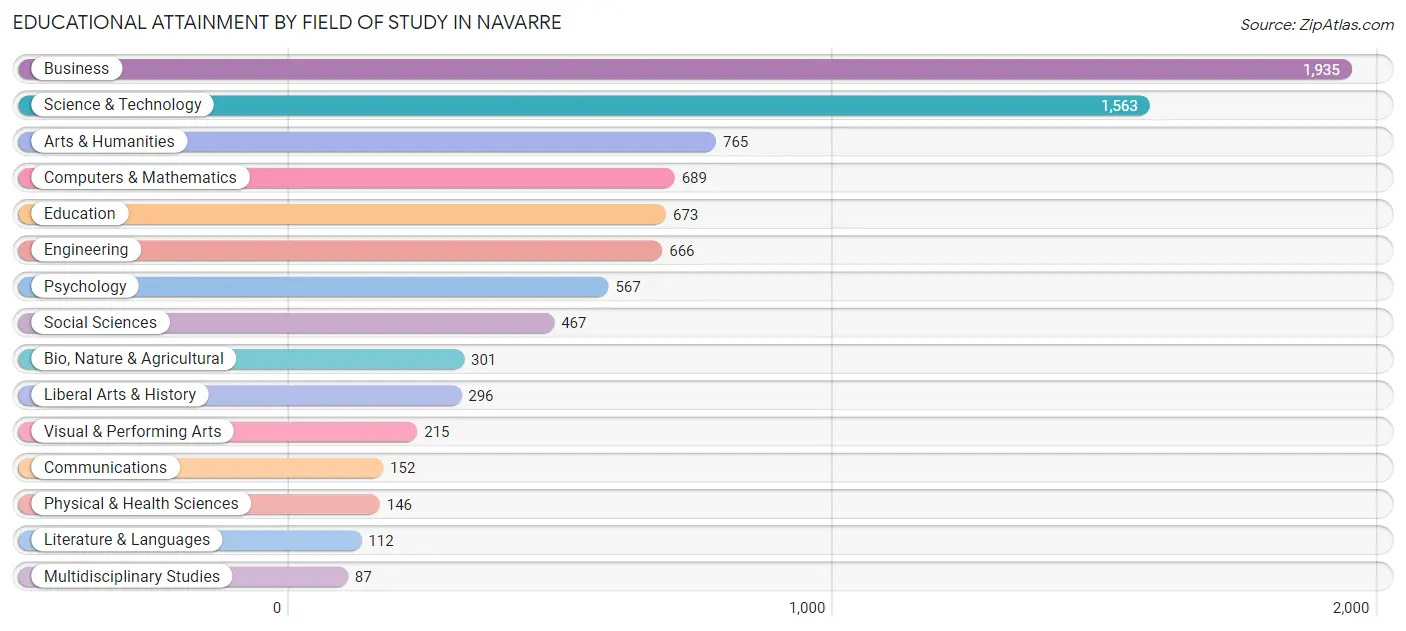
| Field of Study | # Graduates | % Graduates |
| Computers & Mathematics | 689 | 8.0% |
| Bio, Nature & Agricultural | 301 | 3.5% |
| Physical & Health Sciences | 146 | 1.7% |
| Psychology | 567 | 6.6% |
| Social Sciences | 467 | 5.4% |
| Engineering | 666 | 7.7% |
| Multidisciplinary Studies | 87 | 1.0% |
| Science & Technology | 1,563 | 18.1% |
| Business | 1,935 | 22.4% |
| Education | 673 | 7.8% |
| Literature & Languages | 112 | 1.3% |
| Liberal Arts & History | 296 | 3.4% |
| Visual & Performing Arts | 215 | 2.5% |
| Communications | 152 | 1.8% |
| Arts & Humanities | 765 | 8.9% |
| Total | 8,634 | 100.0% |
Transportation & Commute in Navarre
Vehicle Availability by Sex in Navarre
The most prevalent vehicle ownership categories in Navarre are males with 2 vehicles (4,897, accounting for 47.1%) and females with 2 vehicles (3,087, making up 67.0%).
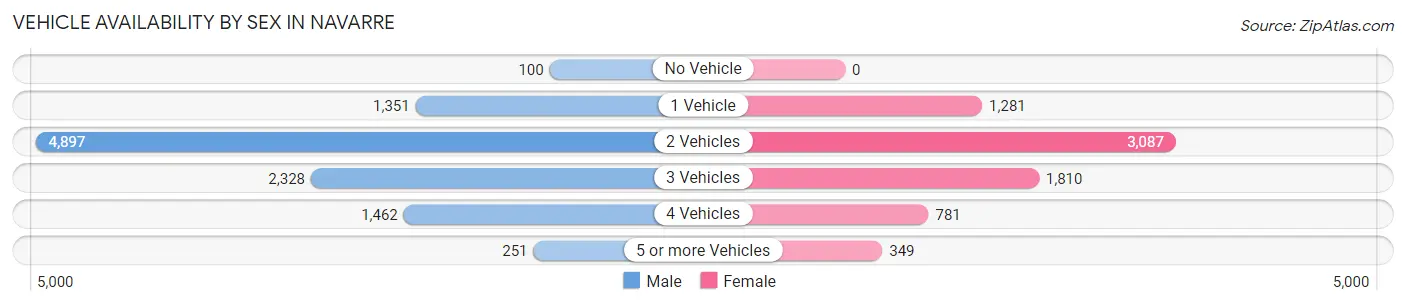
| Vehicles Available | Male | Female |
| No Vehicle | 100 (1.0%) | 0 (0.0%) |
| 1 Vehicle | 1,351 (13.0%) | 1,281 (17.5%) |
| 2 Vehicles | 4,897 (47.1%) | 3,087 (42.2%) |
| 3 Vehicles | 2,328 (22.4%) | 1,810 (24.8%) |
| 4 Vehicles | 1,462 (14.1%) | 781 (10.7%) |
| 5 or more Vehicles | 251 (2.4%) | 349 (4.8%) |
| Total | 10,389 (100.0%) | 7,308 (100.0%) |
Commute Time in Navarre
The most frequently occuring commute durations in Navarre are 45 to 59 minutes (3,007 commuters, 19.2%), 30 to 34 minutes (2,544 commuters, 16.2%), and 15 to 19 minutes (1,820 commuters, 11.6%).
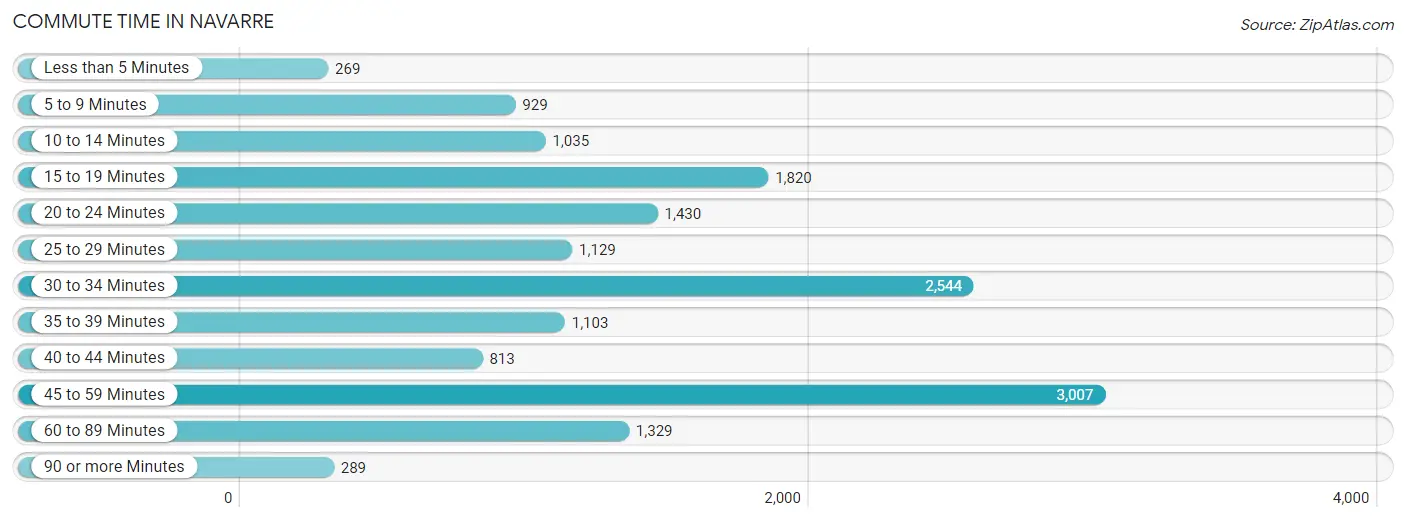
| Commute Time | # Commuters | % Commuters |
| Less than 5 Minutes | 269 | 1.7% |
| 5 to 9 Minutes | 929 | 5.9% |
| 10 to 14 Minutes | 1,035 | 6.6% |
| 15 to 19 Minutes | 1,820 | 11.6% |
| 20 to 24 Minutes | 1,430 | 9.1% |
| 25 to 29 Minutes | 1,129 | 7.2% |
| 30 to 34 Minutes | 2,544 | 16.2% |
| 35 to 39 Minutes | 1,103 | 7.0% |
| 40 to 44 Minutes | 813 | 5.2% |
| 45 to 59 Minutes | 3,007 | 19.2% |
| 60 to 89 Minutes | 1,329 | 8.5% |
| 90 or more Minutes | 289 | 1.8% |
Commute Time by Sex in Navarre
The most common commute times in Navarre are 45 to 59 minutes (1,928 commuters, 20.7%) for males and 45 to 59 minutes (1,079 commuters, 16.8%) for females.
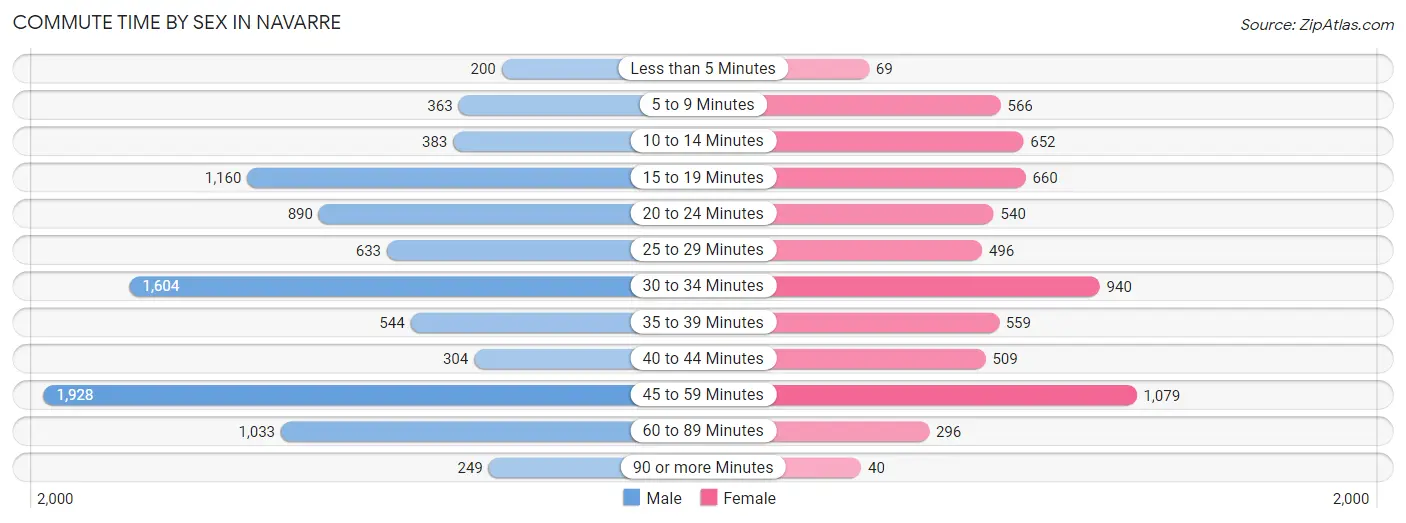
| Commute Time | Male | Female |
| Less than 5 Minutes | 200 (2.1%) | 69 (1.1%) |
| 5 to 9 Minutes | 363 (3.9%) | 566 (8.8%) |
| 10 to 14 Minutes | 383 (4.1%) | 652 (10.2%) |
| 15 to 19 Minutes | 1,160 (12.5%) | 660 (10.3%) |
| 20 to 24 Minutes | 890 (9.6%) | 540 (8.4%) |
| 25 to 29 Minutes | 633 (6.8%) | 496 (7.7%) |
| 30 to 34 Minutes | 1,604 (17.3%) | 940 (14.7%) |
| 35 to 39 Minutes | 544 (5.9%) | 559 (8.7%) |
| 40 to 44 Minutes | 304 (3.3%) | 509 (8.0%) |
| 45 to 59 Minutes | 1,928 (20.7%) | 1,079 (16.8%) |
| 60 to 89 Minutes | 1,033 (11.1%) | 296 (4.6%) |
| 90 or more Minutes | 249 (2.7%) | 40 (0.6%) |
Time of Departure to Work by Sex in Navarre
The most frequent times of departure to work in Navarre are 5:30 AM to 5:59 AM (1,688, 18.2%) for males and 7:00 AM to 7:29 AM (1,001, 15.6%) for females.
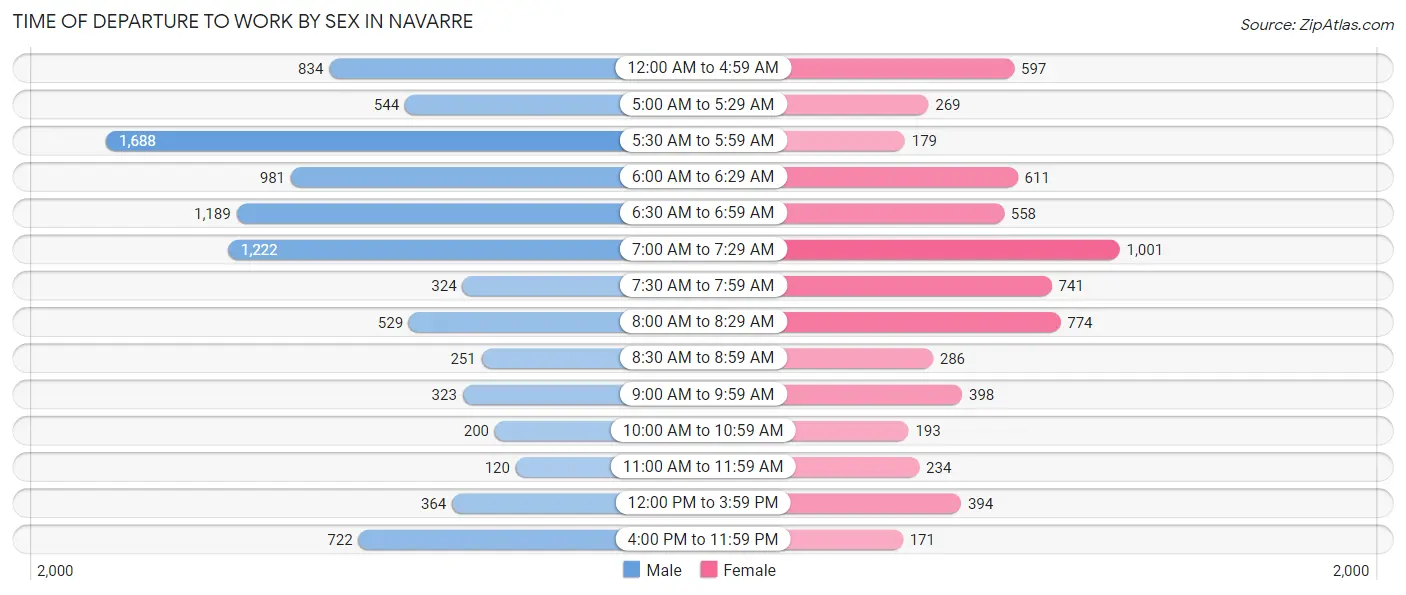
| Time of Departure | Male | Female |
| 12:00 AM to 4:59 AM | 834 (9.0%) | 597 (9.3%) |
| 5:00 AM to 5:29 AM | 544 (5.9%) | 269 (4.2%) |
| 5:30 AM to 5:59 AM | 1,688 (18.2%) | 179 (2.8%) |
| 6:00 AM to 6:29 AM | 981 (10.6%) | 611 (9.5%) |
| 6:30 AM to 6:59 AM | 1,189 (12.8%) | 558 (8.7%) |
| 7:00 AM to 7:29 AM | 1,222 (13.2%) | 1,001 (15.6%) |
| 7:30 AM to 7:59 AM | 324 (3.5%) | 741 (11.6%) |
| 8:00 AM to 8:29 AM | 529 (5.7%) | 774 (12.1%) |
| 8:30 AM to 8:59 AM | 251 (2.7%) | 286 (4.5%) |
| 9:00 AM to 9:59 AM | 323 (3.5%) | 398 (6.2%) |
| 10:00 AM to 10:59 AM | 200 (2.1%) | 193 (3.0%) |
| 11:00 AM to 11:59 AM | 120 (1.3%) | 234 (3.6%) |
| 12:00 PM to 3:59 PM | 364 (3.9%) | 394 (6.1%) |
| 4:00 PM to 11:59 PM | 722 (7.8%) | 171 (2.7%) |
| Total | 9,291 (100.0%) | 6,406 (100.0%) |
Housing Occupancy in Navarre
Occupancy by Ownership in Navarre
Of the total 13,987 dwellings in Navarre, owner-occupied units account for 11,030 (78.9%), while renter-occupied units make up 2,957 (21.1%).
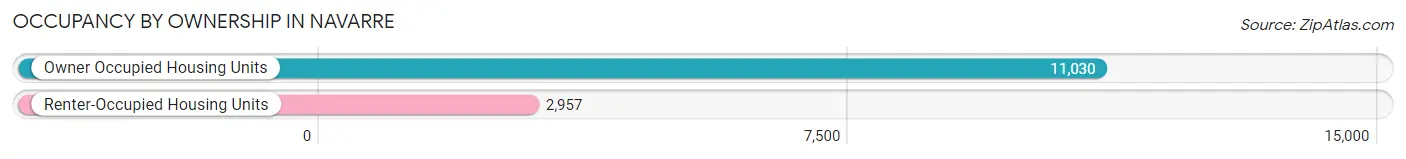
| Occupancy | # Housing Units | % Housing Units |
| Owner Occupied Housing Units | 11,030 | 78.9% |
| Renter-Occupied Housing Units | 2,957 | 21.1% |
| Total Occupied Housing Units | 13,987 | 100.0% |
Occupancy by Household Size in Navarre
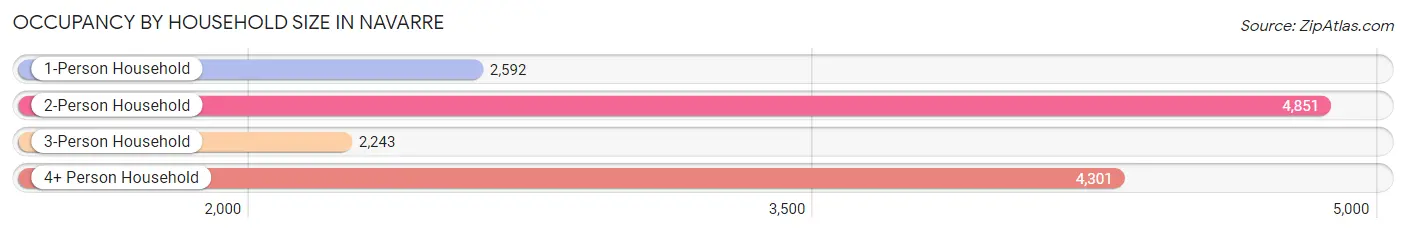
| Household Size | # Housing Units | % Housing Units |
| 1-Person Household | 2,592 | 18.5% |
| 2-Person Household | 4,851 | 34.7% |
| 3-Person Household | 2,243 | 16.0% |
| 4+ Person Household | 4,301 | 30.7% |
| Total Housing Units | 13,987 | 100.0% |
Occupancy by Ownership by Household Size in Navarre
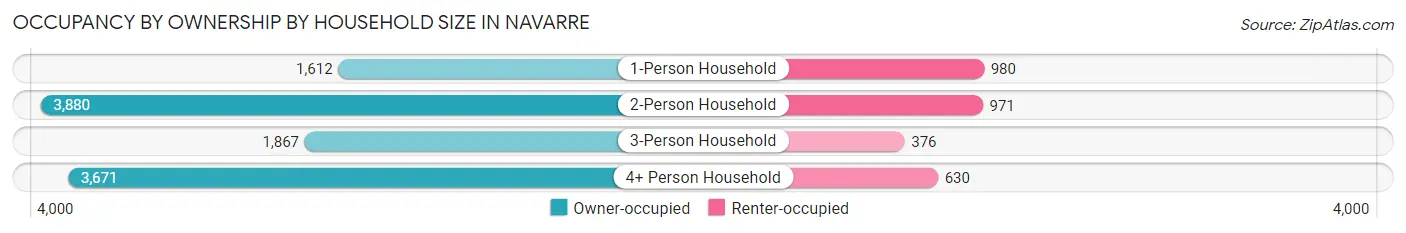
| Household Size | Owner-occupied | Renter-occupied |
| 1-Person Household | 1,612 (62.2%) | 980 (37.8%) |
| 2-Person Household | 3,880 (80.0%) | 971 (20.0%) |
| 3-Person Household | 1,867 (83.2%) | 376 (16.8%) |
| 4+ Person Household | 3,671 (85.4%) | 630 (14.6%) |
| Total Housing Units | 11,030 (78.9%) | 2,957 (21.1%) |
Occupancy by Educational Attainment in Navarre
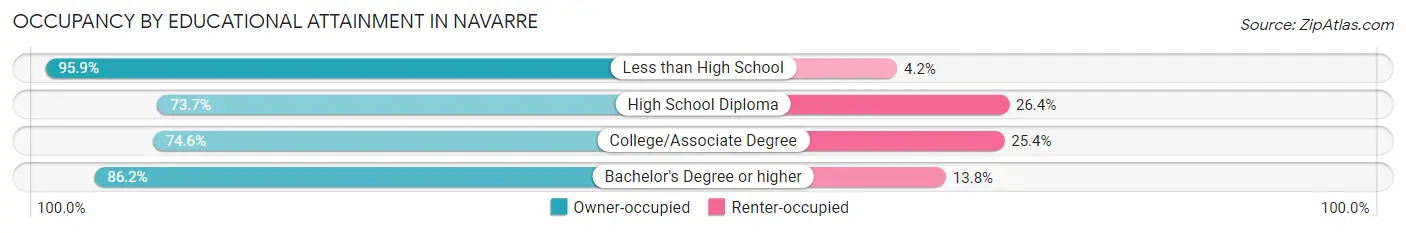
| Household Size | Owner-occupied | Renter-occupied |
| Less than High School | 393 (95.9%) | 17 (4.2%) |
| High School Diploma | 1,618 (73.7%) | 579 (26.4%) |
| College/Associate Degree | 5,069 (74.6%) | 1,727 (25.4%) |
| Bachelor's Degree or higher | 3,950 (86.2%) | 634 (13.8%) |
Occupancy by Age of Householder in Navarre
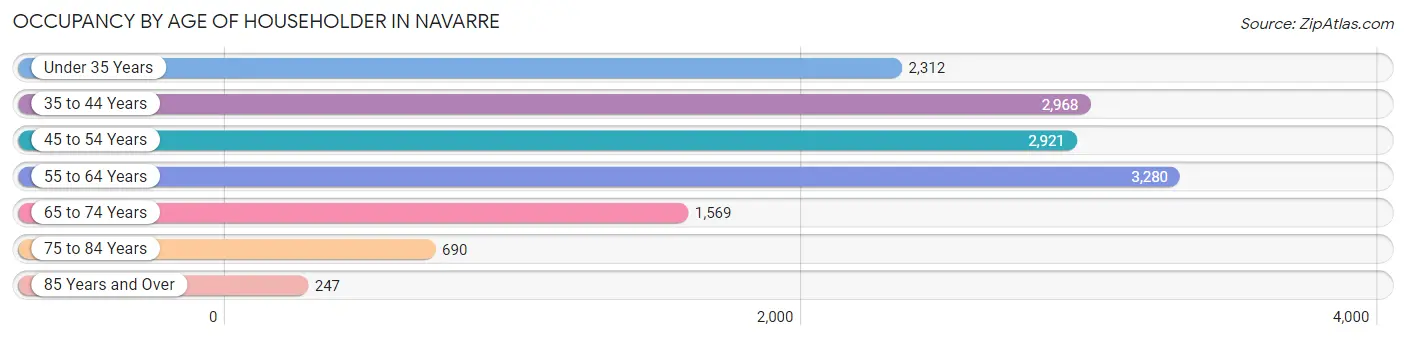
| Age Bracket | # Households | % Households |
| Under 35 Years | 2,312 | 16.5% |
| 35 to 44 Years | 2,968 | 21.2% |
| 45 to 54 Years | 2,921 | 20.9% |
| 55 to 64 Years | 3,280 | 23.4% |
| 65 to 74 Years | 1,569 | 11.2% |
| 75 to 84 Years | 690 | 4.9% |
| 85 Years and Over | 247 | 1.8% |
| Total | 13,987 | 100.0% |
Housing Finances in Navarre
Median Income by Occupancy in Navarre
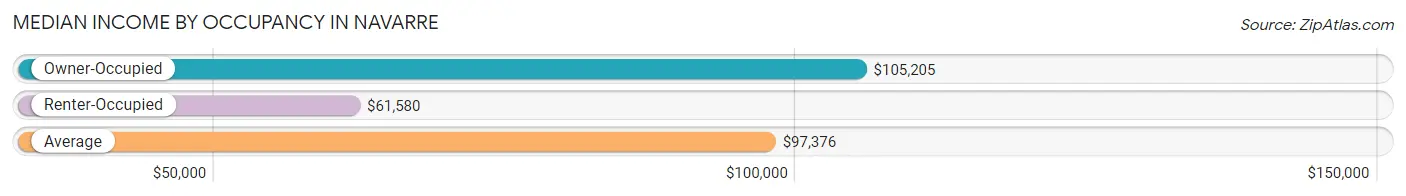
| Occupancy Type | # Households | Median Income |
| Owner-Occupied | 11,030 (78.9%) | $105,205 |
| Renter-Occupied | 2,957 (21.1%) | $61,580 |
| Average | 13,987 (100.0%) | $97,376 |
Occupancy by Householder Income Bracket in Navarre
| Income Bracket | Owner-occupied | Renter-occupied |
| Less than $5,000 | 182 (1.7%) | 363 (12.3%) |
| $5,000 to $9,999 | 86 (0.8%) | 55 (1.9%) |
| $10,000 to $14,999 | 142 (1.3%) | 157 (5.3%) |
| $15,000 to $19,999 | 157 (1.4%) | 0 (0.0%) |
| $20,000 to $24,999 | 175 (1.6%) | 0 (0.0%) |
| $25,000 to $34,999 | 465 (4.2%) | 234 (7.9%) |
| $35,000 to $49,999 | 951 (8.6%) | 344 (11.6%) |
| $50,000 to $74,999 | 1,292 (11.7%) | 470 (15.9%) |
| $75,000 to $99,999 | 1,631 (14.8%) | 688 (23.3%) |
| $100,000 to $149,999 | 2,699 (24.5%) | 323 (10.9%) |
| $150,000 or more | 3,250 (29.5%) | 323 (10.9%) |
| Total | 11,030 (100.0%) | 2,957 (100.0%) |
Monthly Housing Cost Tiers in Navarre
| Monthly Cost | Owner-occupied | Renter-occupied |
| Less than $300 | 392 (3.5%) | 0 (0.0%) |
| $300 to $499 | 907 (8.2%) | 0 (0.0%) |
| $500 to $799 | 1,309 (11.9%) | 142 (4.8%) |
| $800 to $999 | 544 (4.9%) | 92 (3.1%) |
| $1,000 to $1,499 | 1,422 (12.9%) | 699 (23.6%) |
| $1,500 to $1,999 | 3,130 (28.4%) | 1,162 (39.3%) |
| $2,000 to $2,499 | 1,750 (15.9%) | 504 (17.0%) |
| $2,500 to $2,999 | 1,163 (10.5%) | 15 (0.5%) |
| $3,000 or more | 413 (3.7%) | 220 (7.4%) |
| Total | 11,030 (100.0%) | 2,957 (100.0%) |
Physical Housing Characteristics in Navarre
Housing Structures in Navarre
| Structure Type | # Housing Units | % Housing Units |
| Single Unit, Detached | 11,533 | 82.5% |
| Single Unit, Attached | 426 | 3.0% |
| 2 Unit Apartments | 186 | 1.3% |
| 3 or 4 Unit Apartments | 92 | 0.7% |
| 5 to 9 Unit Apartments | 14 | 0.1% |
| 10 or more Apartments | 842 | 6.0% |
| Mobile Home / Other | 894 | 6.4% |
| Total | 13,987 | 100.0% |
Housing Structures by Occupancy in Navarre
| Structure Type | Owner-occupied | Renter-occupied |
| Single Unit, Detached | 10,144 (88.0%) | 1,389 (12.0%) |
| Single Unit, Attached | 186 (43.7%) | 240 (56.3%) |
| 2 Unit Apartments | 0 (0.0%) | 186 (100.0%) |
| 3 or 4 Unit Apartments | 17 (18.5%) | 75 (81.5%) |
| 5 to 9 Unit Apartments | 0 (0.0%) | 14 (100.0%) |
| 10 or more Apartments | 59 (7.0%) | 783 (93.0%) |
| Mobile Home / Other | 624 (69.8%) | 270 (30.2%) |
| Total | 11,030 (78.9%) | 2,957 (21.1%) |
Housing Structures by Number of Rooms in Navarre
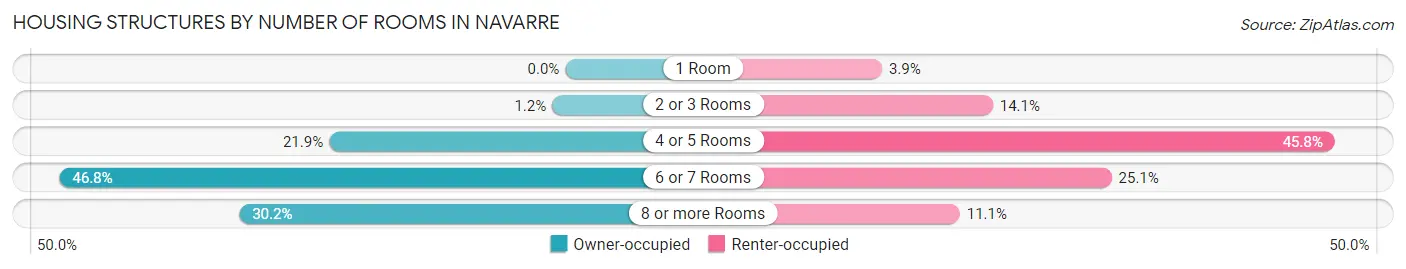
| Number of Rooms | Owner-occupied | Renter-occupied |
| 1 Room | 0 (0.0%) | 115 (3.9%) |
| 2 or 3 Rooms | 135 (1.2%) | 418 (14.1%) |
| 4 or 5 Rooms | 2,410 (21.8%) | 1,353 (45.8%) |
| 6 or 7 Rooms | 5,160 (46.8%) | 743 (25.1%) |
| 8 or more Rooms | 3,325 (30.1%) | 328 (11.1%) |
| Total | 11,030 (100.0%) | 2,957 (100.0%) |
Housing Structure by Heating Type in Navarre
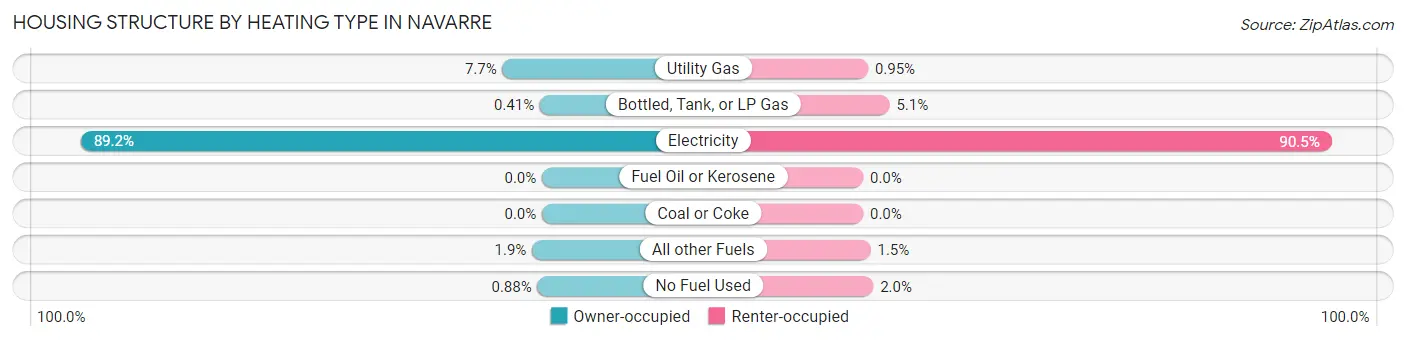
| Heating Type | Owner-occupied | Renter-occupied |
| Utility Gas | 844 (7.6%) | 28 (0.9%) |
| Bottled, Tank, or LP Gas | 45 (0.4%) | 151 (5.1%) |
| Electricity | 9,833 (89.1%) | 2,677 (90.5%) |
| Fuel Oil or Kerosene | 0 (0.0%) | 0 (0.0%) |
| Coal or Coke | 0 (0.0%) | 0 (0.0%) |
| All other Fuels | 211 (1.9%) | 43 (1.5%) |
| No Fuel Used | 97 (0.9%) | 58 (2.0%) |
| Total | 11,030 (100.0%) | 2,957 (100.0%) |
Household Vehicle Usage in Navarre
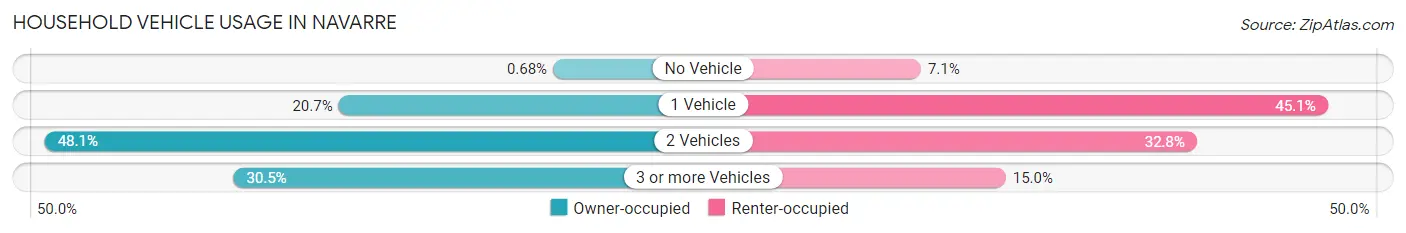
| Vehicles per Household | Owner-occupied | Renter-occupied |
| No Vehicle | 75 (0.7%) | 210 (7.1%) |
| 1 Vehicle | 2,283 (20.7%) | 1,332 (45.1%) |
| 2 Vehicles | 5,308 (48.1%) | 971 (32.8%) |
| 3 or more Vehicles | 3,364 (30.5%) | 444 (15.0%) |
| Total | 11,030 (100.0%) | 2,957 (100.0%) |
Real Estate & Mortgages in Navarre
Real Estate and Mortgage Overview in Navarre
| Characteristic | Without Mortgage | With Mortgage |
| Housing Units | 3,069 | 7,961 |
| Median Property Value | $301,100 | $325,700 |
| Median Household Income | $93,339 | $2,412 |
| Monthly Housing Costs | $594 | $393 |
| Real Estate Taxes | $1,836 | $485 |
Property Value by Mortgage Status in Navarre
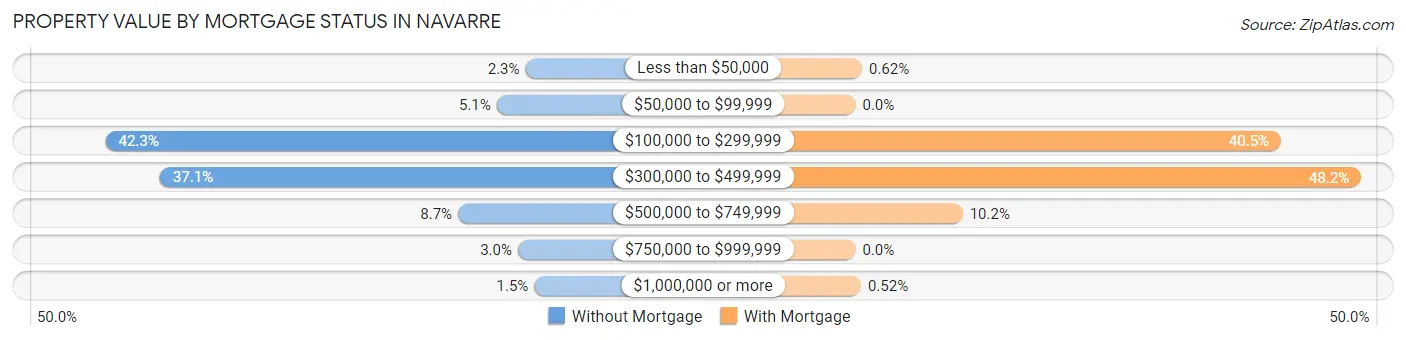
| Property Value | Without Mortgage | With Mortgage |
| Less than $50,000 | 71 (2.3%) | 49 (0.6%) |
| $50,000 to $99,999 | 155 (5.1%) | 0 (0.0%) |
| $100,000 to $299,999 | 1,298 (42.3%) | 3,225 (40.5%) |
| $300,000 to $499,999 | 1,139 (37.1%) | 3,833 (48.1%) |
| $500,000 to $749,999 | 268 (8.7%) | 813 (10.2%) |
| $750,000 to $999,999 | 93 (3.0%) | 0 (0.0%) |
| $1,000,000 or more | 45 (1.5%) | 41 (0.5%) |
| Total | 3,069 (100.0%) | 7,961 (100.0%) |
Household Income by Mortgage Status in Navarre
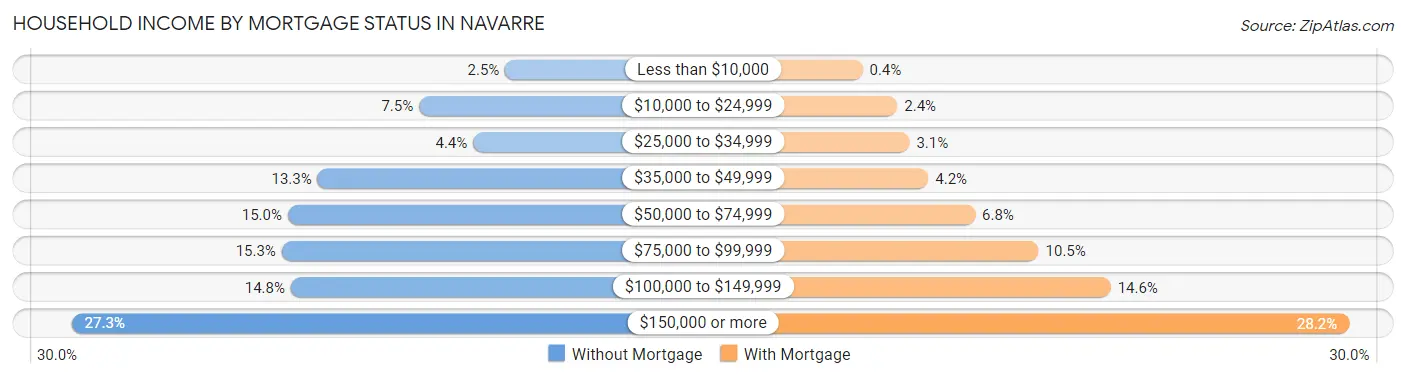
| Household Income | Without Mortgage | With Mortgage |
| Less than $10,000 | 78 (2.5%) | 32 (0.4%) |
| $10,000 to $24,999 | 229 (7.5%) | 190 (2.4%) |
| $25,000 to $34,999 | 134 (4.4%) | 245 (3.1%) |
| $35,000 to $49,999 | 407 (13.3%) | 331 (4.2%) |
| $50,000 to $74,999 | 459 (15.0%) | 544 (6.8%) |
| $75,000 to $99,999 | 470 (15.3%) | 833 (10.5%) |
| $100,000 to $149,999 | 454 (14.8%) | 1,161 (14.6%) |
| $150,000 or more | 838 (27.3%) | 2,245 (28.2%) |
| Total | 3,069 (100.0%) | 7,961 (100.0%) |
Property Value to Household Income Ratio in Navarre
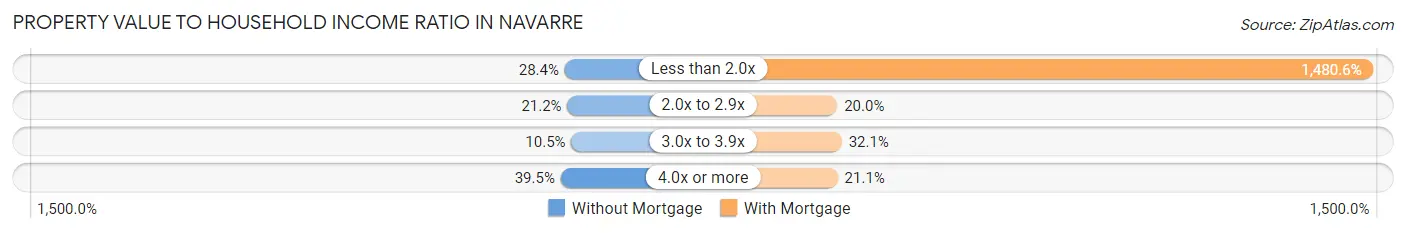
| Value-to-Income Ratio | Without Mortgage | With Mortgage |
| Less than 2.0x | 872 (28.4%) | 117,870 (1,480.6%) |
| 2.0x to 2.9x | 649 (21.1%) | 1,588 (20.0%) |
| 3.0x to 3.9x | 321 (10.5%) | 2,553 (32.1%) |
| 4.0x or more | 1,212 (39.5%) | 1,681 (21.1%) |
| Total | 3,069 (100.0%) | 7,961 (100.0%) |
Real Estate Taxes by Mortgage Status in Navarre
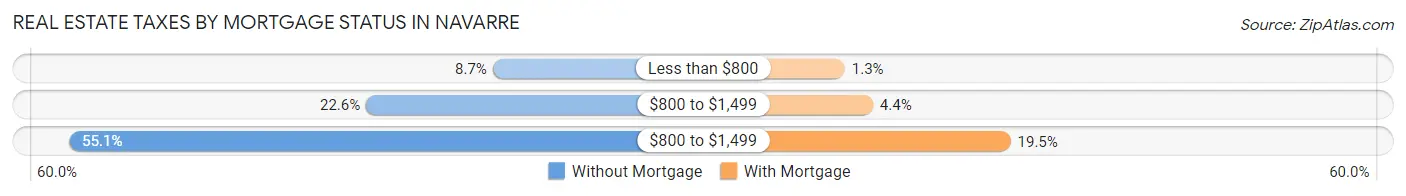
| Property Taxes | Without Mortgage | With Mortgage |
| Less than $800 | 267 (8.7%) | 103 (1.3%) |
| $800 to $1,499 | 693 (22.6%) | 348 (4.4%) |
| $800 to $1,499 | 1,692 (55.1%) | 1,549 (19.5%) |
| Total | 3,069 (100.0%) | 7,961 (100.0%) |
Health & Disability in Navarre
Health Insurance Coverage by Age in Navarre
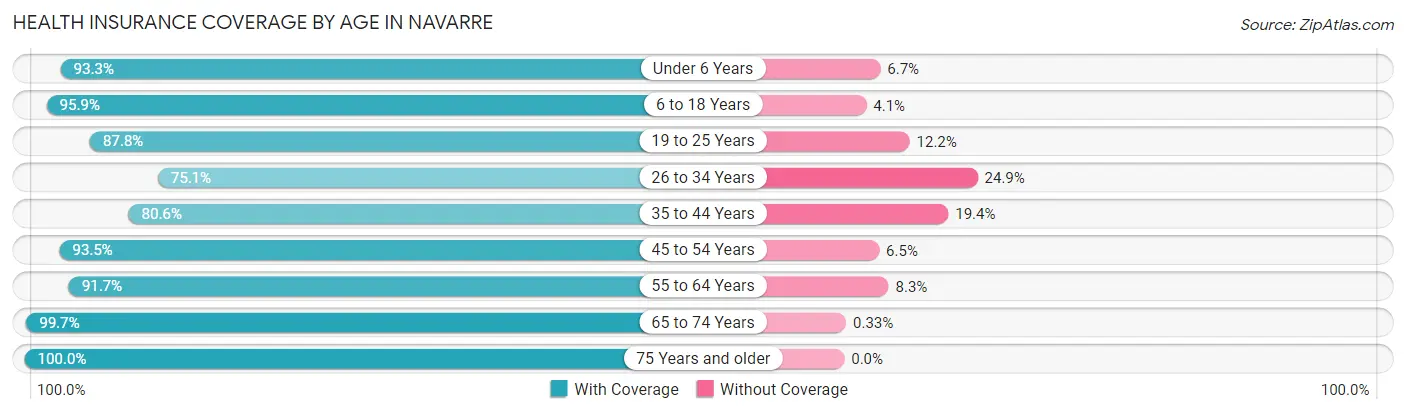
| Age Bracket | With Coverage | Without Coverage |
| Under 6 Years | 2,248 (93.3%) | 162 (6.7%) |
| 6 to 18 Years | 7,142 (95.9%) | 306 (4.1%) |
| 19 to 25 Years | 2,207 (87.8%) | 306 (12.2%) |
| 26 to 34 Years | 2,436 (75.1%) | 806 (24.9%) |
| 35 to 44 Years | 4,407 (80.6%) | 1,061 (19.4%) |
| 45 to 54 Years | 5,006 (93.5%) | 348 (6.5%) |
| 55 to 64 Years | 4,919 (91.7%) | 443 (8.3%) |
| 65 to 74 Years | 3,026 (99.7%) | 10 (0.3%) |
| 75 Years and older | 1,472 (100.0%) | 0 (0.0%) |
| Total | 32,863 (90.5%) | 3,442 (9.5%) |
Health Insurance Coverage by Citizenship Status in Navarre
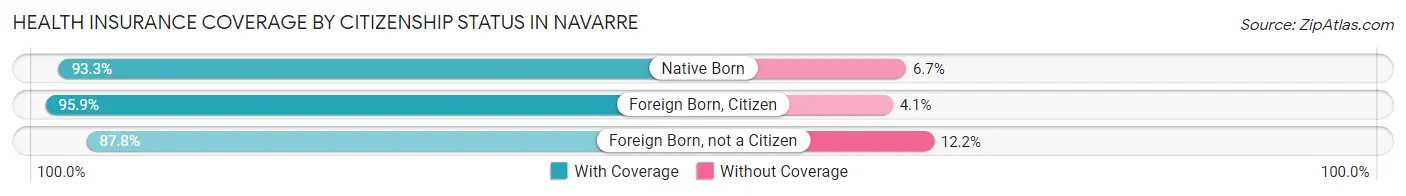
| Citizenship Status | With Coverage | Without Coverage |
| Native Born | 2,248 (93.3%) | 162 (6.7%) |
| Foreign Born, Citizen | 7,142 (95.9%) | 306 (4.1%) |
| Foreign Born, not a Citizen | 2,207 (87.8%) | 306 (12.2%) |
Health Insurance Coverage by Household Income in Navarre
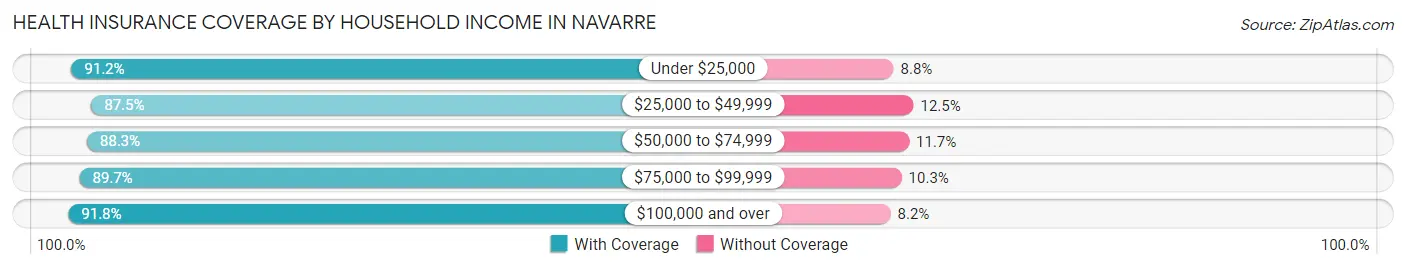
| Household Income | With Coverage | Without Coverage |
| Under $25,000 | 2,029 (91.2%) | 195 (8.8%) |
| $25,000 to $49,999 | 3,479 (87.5%) | 497 (12.5%) |
| $50,000 to $74,999 | 3,648 (88.3%) | 482 (11.7%) |
| $75,000 to $99,999 | 5,349 (89.7%) | 613 (10.3%) |
| $100,000 and over | 18,347 (91.8%) | 1,642 (8.2%) |
Public vs Private Health Insurance Coverage by Age in Navarre
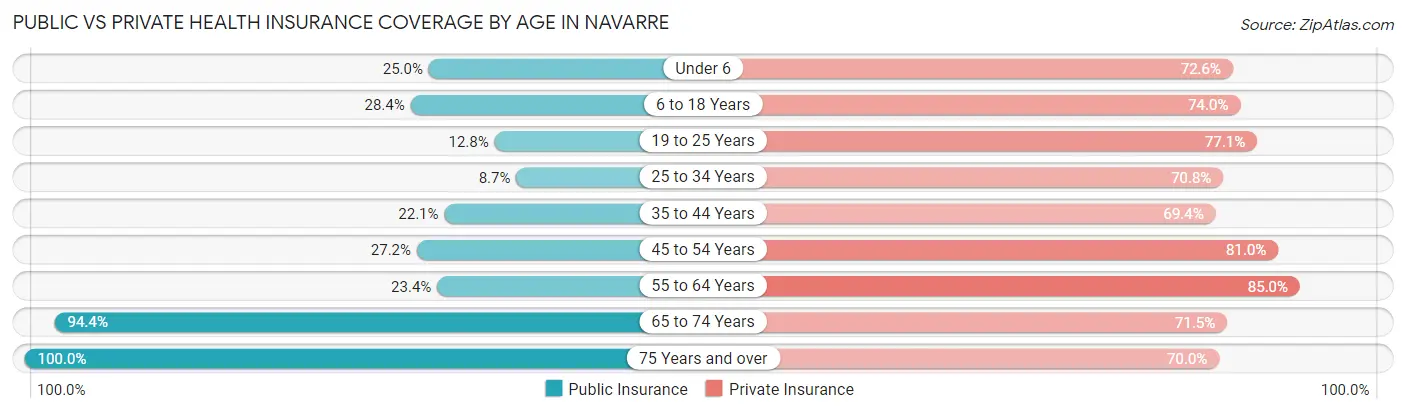
| Age Bracket | Public Insurance | Private Insurance |
| Under 6 | 602 (25.0%) | 1,749 (72.6%) |
| 6 to 18 Years | 2,112 (28.4%) | 5,508 (74.0%) |
| 19 to 25 Years | 321 (12.8%) | 1,937 (77.1%) |
| 25 to 34 Years | 283 (8.7%) | 2,295 (70.8%) |
| 35 to 44 Years | 1,208 (22.1%) | 3,793 (69.4%) |
| 45 to 54 Years | 1,456 (27.2%) | 4,336 (81.0%) |
| 55 to 64 Years | 1,256 (23.4%) | 4,559 (85.0%) |
| 65 to 74 Years | 2,867 (94.4%) | 2,171 (71.5%) |
| 75 Years and over | 1,472 (100.0%) | 1,031 (70.0%) |
| Total | 11,577 (31.9%) | 27,379 (75.4%) |
Disability Status by Sex by Age in Navarre
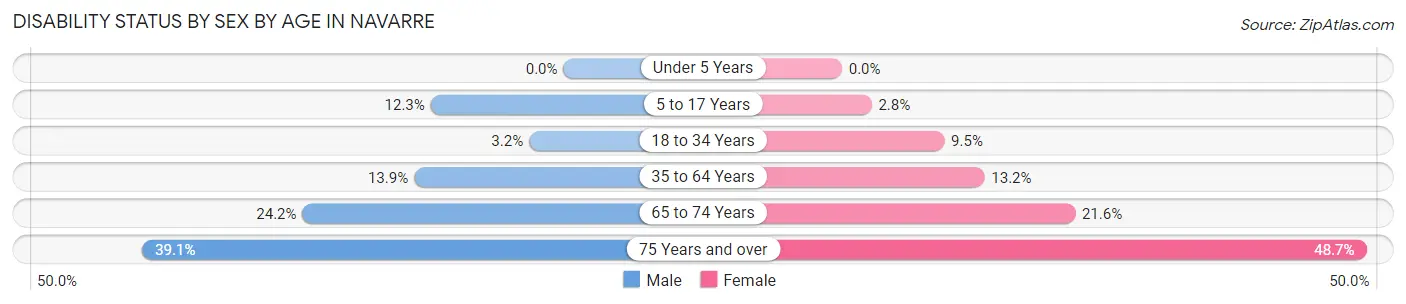
| Age Bracket | Male | Female |
| Under 5 Years | 0 (0.0%) | 0 (0.0%) |
| 5 to 17 Years | 529 (12.3%) | 88 (2.8%) |
| 18 to 34 Years | 85 (3.2%) | 337 (9.5%) |
| 35 to 64 Years | 1,018 (13.9%) | 1,169 (13.2%) |
| 65 to 74 Years | 328 (24.2%) | 364 (21.6%) |
| 75 Years and over | 235 (39.1%) | 424 (48.7%) |
Disability Class by Sex by Age in Navarre
Disability Class: Hearing Difficulty
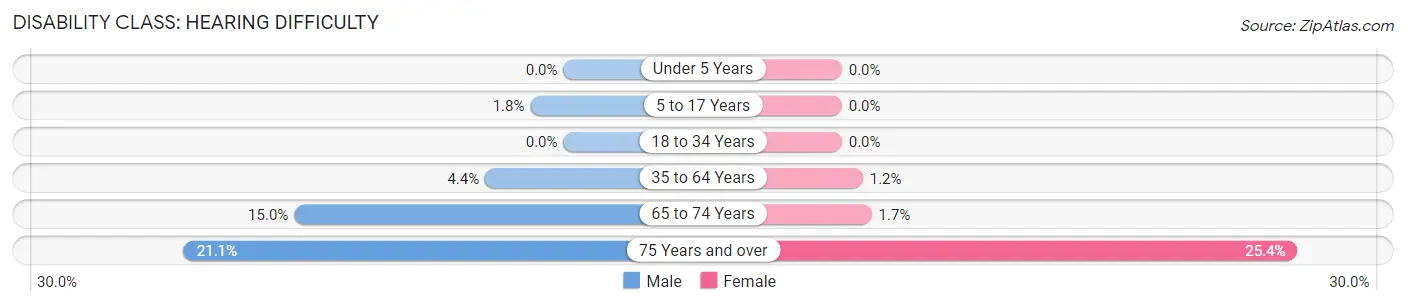
| Age Bracket | Male | Female |
| Under 5 Years | 0 (0.0%) | 0 (0.0%) |
| 5 to 17 Years | 79 (1.8%) | 0 (0.0%) |
| 18 to 34 Years | 0 (0.0%) | 0 (0.0%) |
| 35 to 64 Years | 320 (4.4%) | 103 (1.2%) |
| 65 to 74 Years | 203 (15.0%) | 28 (1.7%) |
| 75 Years and over | 127 (21.1%) | 221 (25.4%) |
Disability Class: Vision Difficulty
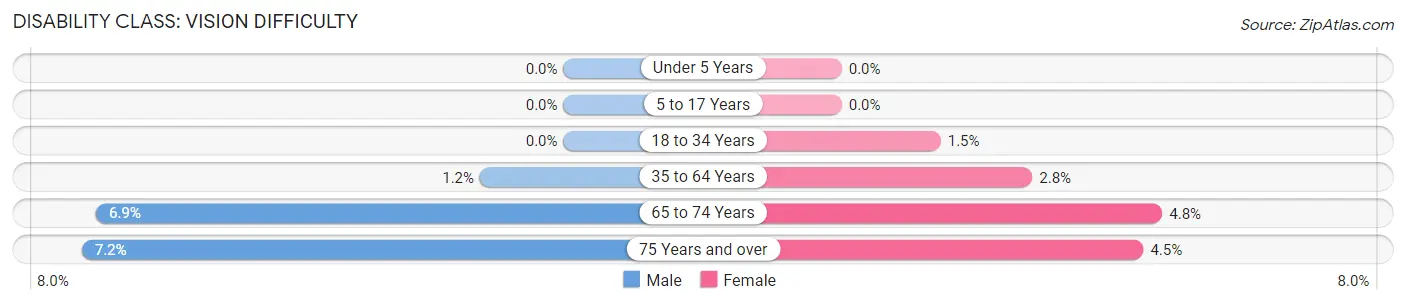
| Age Bracket | Male | Female |
| Under 5 Years | 0 (0.0%) | 0 (0.0%) |
| 5 to 17 Years | 0 (0.0%) | 0 (0.0%) |
| 18 to 34 Years | 0 (0.0%) | 52 (1.5%) |
| 35 to 64 Years | 91 (1.2%) | 250 (2.8%) |
| 65 to 74 Years | 94 (6.9%) | 80 (4.8%) |
| 75 Years and over | 43 (7.1%) | 39 (4.5%) |
Disability Class: Cognitive Difficulty
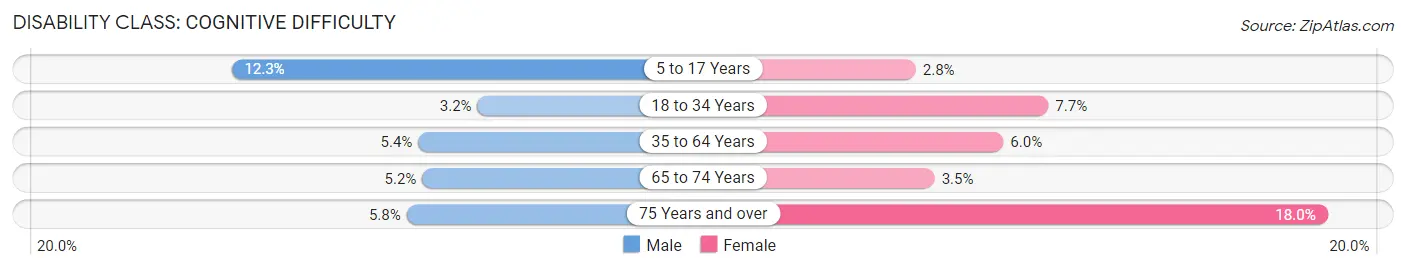
| Age Bracket | Male | Female |
| 5 to 17 Years | 529 (12.3%) | 88 (2.8%) |
| 18 to 34 Years | 85 (3.2%) | 272 (7.7%) |
| 35 to 64 Years | 396 (5.4%) | 530 (6.0%) |
| 65 to 74 Years | 71 (5.2%) | 58 (3.5%) |
| 75 Years and over | 35 (5.8%) | 157 (18.0%) |
Disability Class: Ambulatory Difficulty
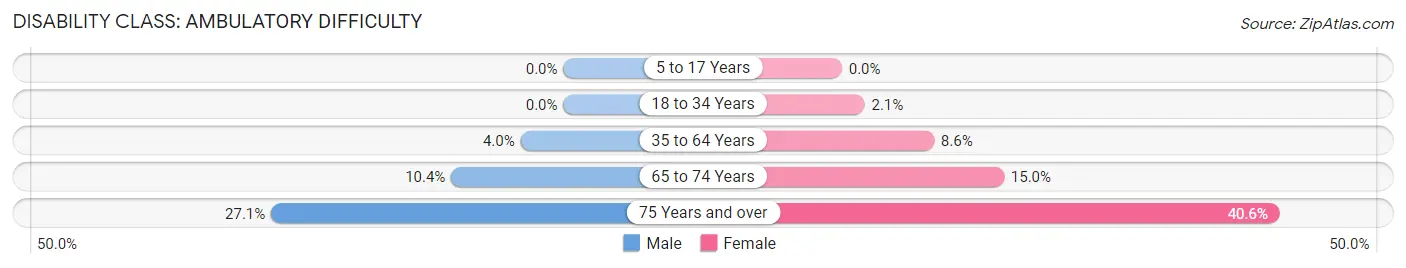
| Age Bracket | Male | Female |
| 5 to 17 Years | 0 (0.0%) | 0 (0.0%) |
| 18 to 34 Years | 0 (0.0%) | 75 (2.1%) |
| 35 to 64 Years | 292 (4.0%) | 756 (8.6%) |
| 65 to 74 Years | 141 (10.4%) | 253 (15.0%) |
| 75 Years and over | 163 (27.1%) | 354 (40.6%) |
Disability Class: Self-Care Difficulty
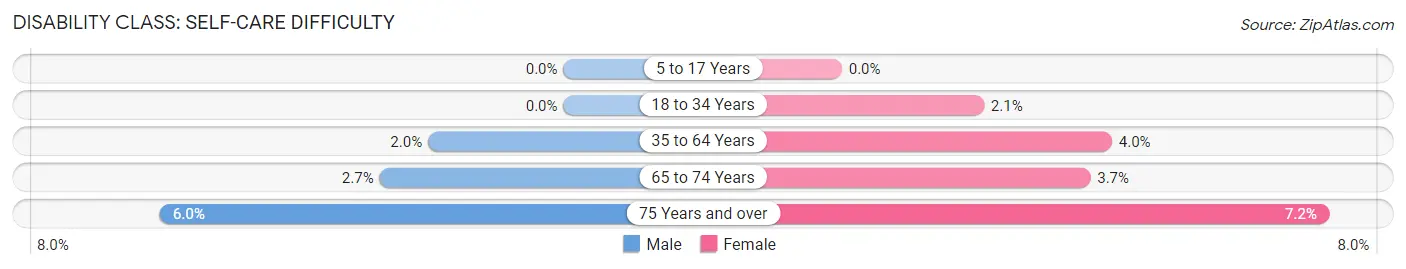
| Age Bracket | Male | Female |
| 5 to 17 Years | 0 (0.0%) | 0 (0.0%) |
| 18 to 34 Years | 0 (0.0%) | 75 (2.1%) |
| 35 to 64 Years | 148 (2.0%) | 354 (4.0%) |
| 65 to 74 Years | 37 (2.7%) | 62 (3.7%) |
| 75 Years and over | 36 (6.0%) | 63 (7.2%) |
Technology Access in Navarre
Computing Device Access in Navarre
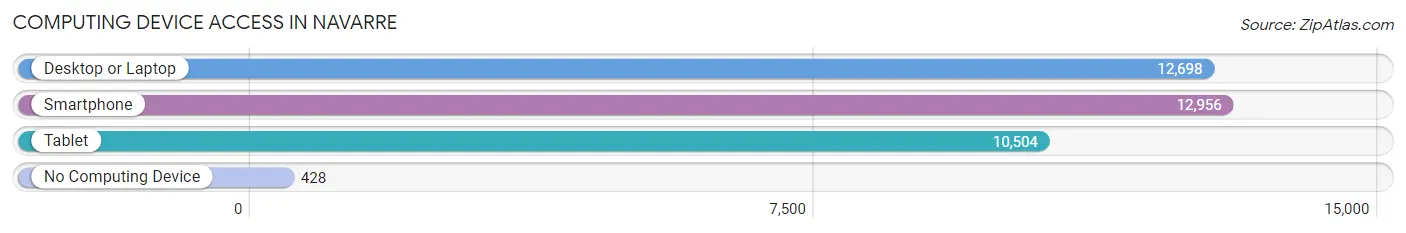
| Device Type | # Households | % Households |
| Desktop or Laptop | 12,698 | 90.8% |
| Smartphone | 12,956 | 92.6% |
| Tablet | 10,504 | 75.1% |
| No Computing Device | 428 | 3.1% |
| Total | 13,987 | 100.0% |
Internet Access in Navarre
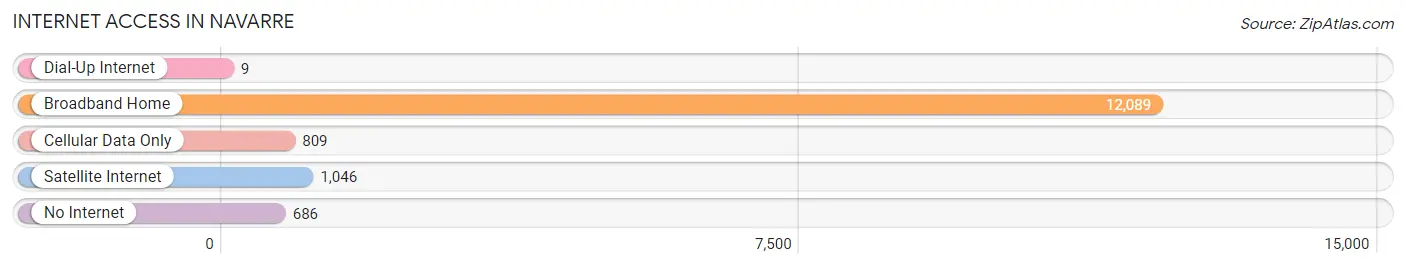
| Internet Type | # Households | % Households |
| Dial-Up Internet | 9 | 0.1% |
| Broadband Home | 12,089 | 86.4% |
| Cellular Data Only | 809 | 5.8% |
| Satellite Internet | 1,046 | 7.5% |
| No Internet | 686 | 4.9% |
| Total | 13,987 | 100.0% |
Navarre Summary
History
The history of Navarre, Florida dates back to the early 1800s when the area was inhabited by Native American tribes. The first recorded European settlement in the area was in 1819 when a group of settlers from Georgia arrived and established a trading post. The settlement was named Navarre after the Spanish explorer, Don Tristan de Luna y Arellano, who explored the area in 1559.
In 1821, the United States acquired the area from Spain as part of the Adams-Onis Treaty. The area was then organized as part of Escambia County. In 1844, the county was divided into two parts, with the western part becoming Santa Rosa County. Navarre was then established as a town in 1887.
The town grew slowly over the next few decades, with the population reaching just over 500 by the 1940s. The area experienced a population boom in the 1950s and 1960s, as the military presence in the area increased due to the establishment of nearby Eglin Air Force Base. The population of Navarre grew to over 1,000 by the 1970s.
In the 1980s, Navarre began to experience rapid growth as the area became a popular tourist destination. The population of Navarre increased to over 5,000 by the 1990s. The town was officially incorporated in 1999, and the population has continued to grow since then. As of 2020, the population of Navarre is estimated to be around 20,000.
Geography
Navarre is located in the Florida Panhandle, in Santa Rosa County. It is situated on the Gulf of Mexico, about 25 miles east of Pensacola. The town is bordered by the Santa Rosa Sound to the north, the Gulf of Mexico to the south, and the Blackwater River to the east.
The town covers an area of approximately 11 square miles, with a total land area of 8.7 square miles. The terrain is mostly flat, with some low hills in the northern part of the town. The climate is humid subtropical, with hot, humid summers and mild winters.
Economy
The economy of Navarre is largely driven by tourism. The town is a popular destination for beachgoers, with its white sand beaches and crystal clear waters. The area is also home to several military installations, including Eglin Air Force Base and Hurlburt Field.
Navarre is also home to a number of businesses, including restaurants, retail stores, and hotels. The town is also home to a number of manufacturing companies, including a paper mill and a plastics factory.
Demographics
As of the 2010 census, the population of Navarre was 19,236. The racial makeup of the town was 90.3% White, 4.2% African American, 0.7% Native American, 1.2% Asian, 0.1% Pacific Islander, 1.7% from other races, and 1.9% from two or more races. Hispanic or Latino of any race were 5.2% of the population.
The median household income in Navarre was $50,945, and the median family income was $60,945. The per capita income was $25,945. About 8.3% of the population was below the poverty line.
Common Questions
What is Per Capita Income in Navarre?
Per Capita income in Navarre is $40,018.
What is the Median Family Income in Navarre?
Median Family Income in Navarre is $107,698.
What is the Median Household income in Navarre?
Median Household Income in Navarre is $97,376.
What is Income or Wage Gap in Navarre?
Income or Wage Gap in Navarre is 41.6%.
Women in Navarre earn 58.4 cents for every dollar earned by a man.
What is Inequality or Gini Index in Navarre?
Inequality or Gini Index in Navarre is 0.38.
What is the Total Population of Navarre?
Total Population of Navarre is 38,829.
What is the Total Male Population of Navarre?
Total Male Population of Navarre is 19,657.
What is the Total Female Population of Navarre?
Total Female Population of Navarre is 19,172.
What is the Ratio of Males per 100 Females in Navarre?
There are 102.53 Males per 100 Females in Navarre.
What is the Ratio of Females per 100 Males in Navarre?
There are 97.53 Females per 100 Males in Navarre.
What is the Median Population Age in Navarre?
Median Population Age in Navarre is 38.1 Years.
What is the Average Family Size in Navarre
Average Family Size in Navarre is 3.1 People.
What is the Average Household Size in Navarre
Average Household Size in Navarre is 2.8 People.
How Large is the Labor Force in Navarre?
There are 18,815 People in the Labor Forcein in Navarre.
What is the Percentage of People in the Labor Force in Navarre?
62.3% of People are in the Labor Force in Navarre.
What is the Unemployment Rate in Navarre?
Unemployment Rate in Navarre is 5.6%.