Center Point, AL Map & Demographics
Center Point Map
Center Point Overview
$25,001
PER CAPITA INCOME
$52,424
AVG FAMILY INCOME
$49,886
AVG HOUSEHOLD INCOME
32.4%
WAGE / INCOME GAP [ % ]
67.6¢/ $1
WAGE / INCOME GAP [ $ ]
$11,575
FAMILY INCOME DEFICIT
0.40
INEQUALITY / GINI INDEX
16,279
TOTAL POPULATION
7,967
MALE POPULATION
8,312
FEMALE POPULATION
95.85
MALES / 100 FEMALES
104.33
FEMALES / 100 MALES
33.9
MEDIAN AGE
3.5
AVG FAMILY SIZE
2.9
AVG HOUSEHOLD SIZE
7,514
LABOR FORCE [ PEOPLE ]
62.0%
PERCENT IN LABOR FORCE
10.0%
UNEMPLOYMENT RATE
Center Point Area Codes
Income in Center Point
Income Overview in Center Point
Per Capita Income in Center Point is $25,001, while median incomes of families and households are $52,424 and $49,886 respectively.
| Characteristic | Number | Measure |
| Per Capita Income | 16,279 | $25,001 |
| Median Family Income | 3,993 | $52,424 |
| Mean Family Income | 3,993 | $69,141 |
| Median Household Income | 5,643 | $49,886 |
| Mean Household Income | 5,643 | $62,648 |
| Income Deficit | 3,993 | $11,575 |
| Wage / Income Gap (%) | 16,279 | 32.43% |
| Wage / Income Gap ($) | 16,279 | 67.57¢ per $1 |
| Gini / Inequality Index | 16,279 | 0.40 |
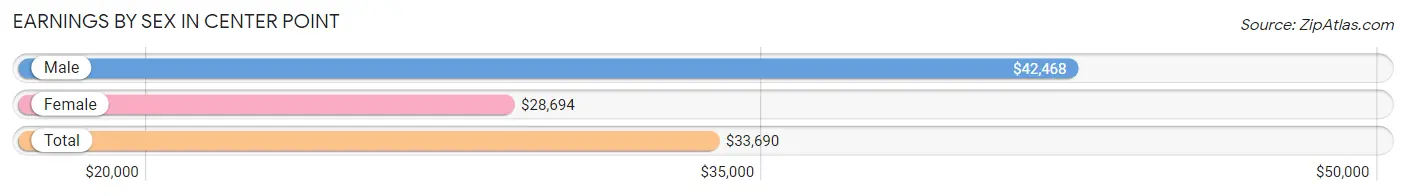
Earnings by Sex in Center Point
Average Earnings in Center Point are $33,690, $42,468 for men and $28,694 for women, a difference of 32.4%.
| Sex | Number | Average Earnings |
| Male | 3,572 (49.2%) | $42,468 |
| Female | 3,688 (50.8%) | $28,694 |
| Total | 7,260 (100.0%) | $33,690 |
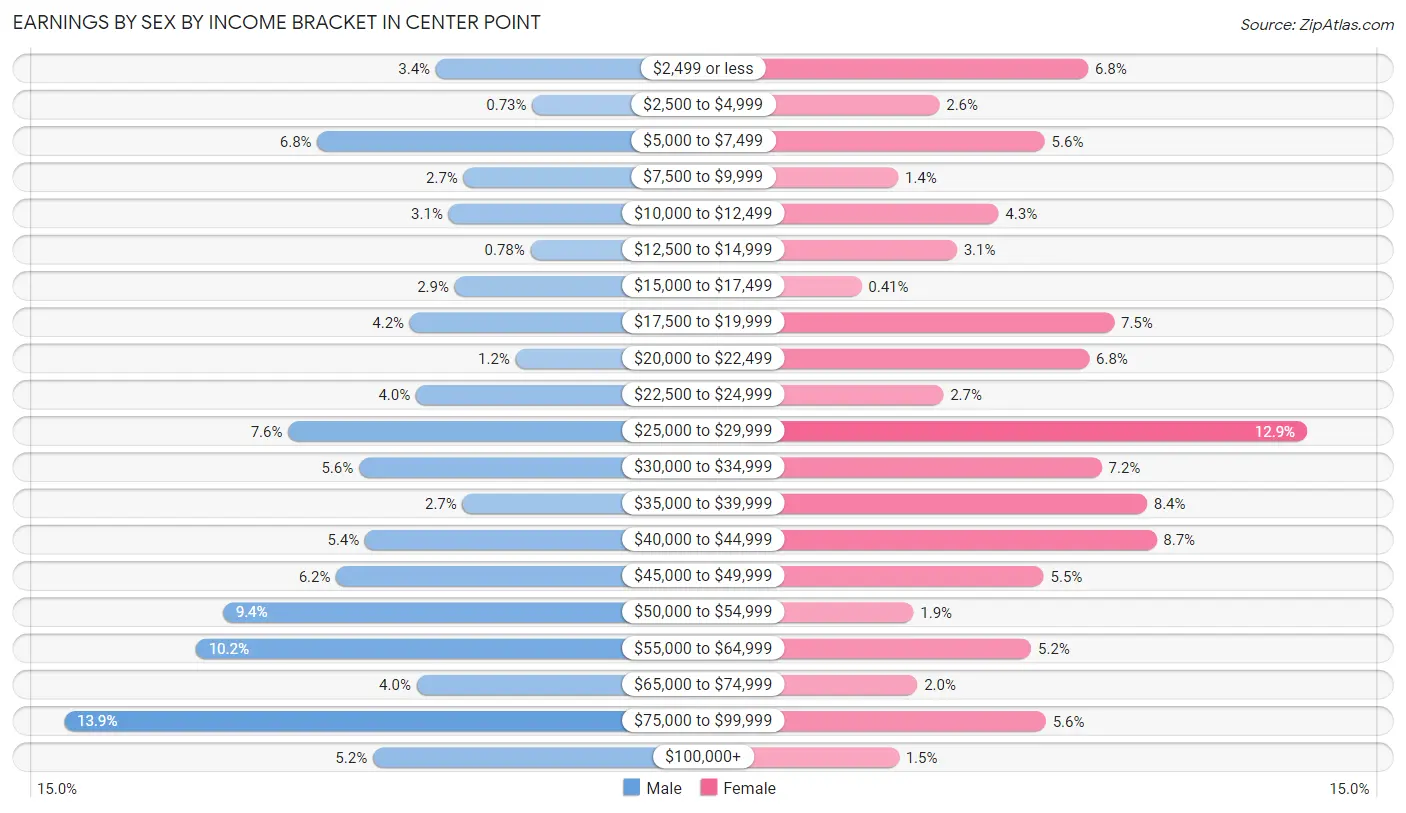
Earnings by Sex by Income Bracket in Center Point
The most common earnings brackets in Center Point are $75,000 to $99,999 for men (496 | 13.9%) and $25,000 to $29,999 for women (477 | 12.9%).
| Income | Male | Female |
| $2,499 or less | 123 (3.4%) | 250 (6.8%) |
| $2,500 to $4,999 | 26 (0.7%) | 96 (2.6%) |
| $5,000 to $7,499 | 242 (6.8%) | 205 (5.6%) |
| $7,500 to $9,999 | 95 (2.7%) | 53 (1.4%) |
| $10,000 to $12,499 | 110 (3.1%) | 157 (4.3%) |
| $12,500 to $14,999 | 28 (0.8%) | 114 (3.1%) |
| $15,000 to $17,499 | 104 (2.9%) | 15 (0.4%) |
| $17,500 to $19,999 | 149 (4.2%) | 277 (7.5%) |
| $20,000 to $22,499 | 43 (1.2%) | 251 (6.8%) |
| $22,500 to $24,999 | 143 (4.0%) | 100 (2.7%) |
| $25,000 to $29,999 | 271 (7.6%) | 477 (12.9%) |
| $30,000 to $34,999 | 200 (5.6%) | 264 (7.2%) |
| $35,000 to $39,999 | 96 (2.7%) | 311 (8.4%) |
| $40,000 to $44,999 | 194 (5.4%) | 321 (8.7%) |
| $45,000 to $49,999 | 223 (6.2%) | 204 (5.5%) |
| $50,000 to $54,999 | 337 (9.4%) | 69 (1.9%) |
| $55,000 to $64,999 | 364 (10.2%) | 191 (5.2%) |
| $65,000 to $74,999 | 142 (4.0%) | 73 (2.0%) |
| $75,000 to $99,999 | 496 (13.9%) | 206 (5.6%) |
| $100,000+ | 186 (5.2%) | 54 (1.5%) |
| Total | 3,572 (100.0%) | 3,688 (100.0%) |
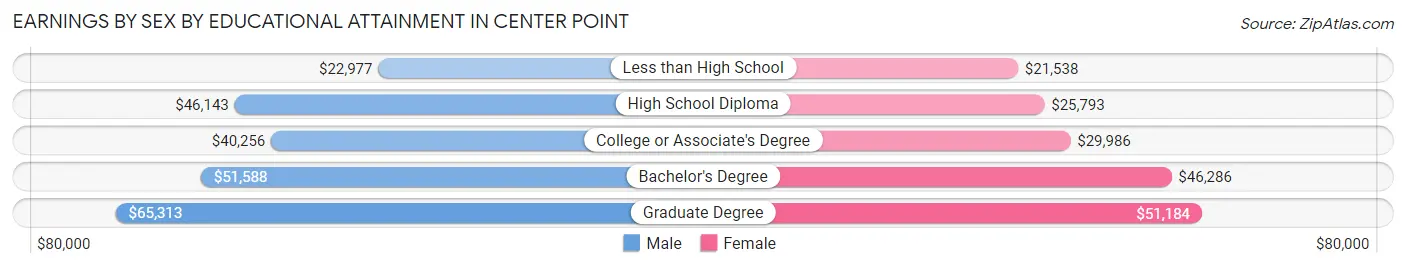
Earnings by Sex by Educational Attainment in Center Point
Average earnings in Center Point are $46,067 for men and $30,196 for women, a difference of 34.4%. Men with an educational attainment of graduate degree enjoy the highest average annual earnings of $65,313, while those with less than high school education earn the least with $22,977. Women with an educational attainment of graduate degree earn the most with the average annual earnings of $51,184, while those with less than high school education have the smallest earnings of $21,538.
| Educational Attainment | Male Income | Female Income |
| Less than High School | $22,977 | $21,538 |
| High School Diploma | $46,143 | $25,793 |
| College or Associate's Degree | $40,256 | $29,986 |
| Bachelor's Degree | $51,588 | $46,286 |
| Graduate Degree | $65,313 | $51,184 |
| Total | $46,067 | $30,196 |
Family Income in Center Point
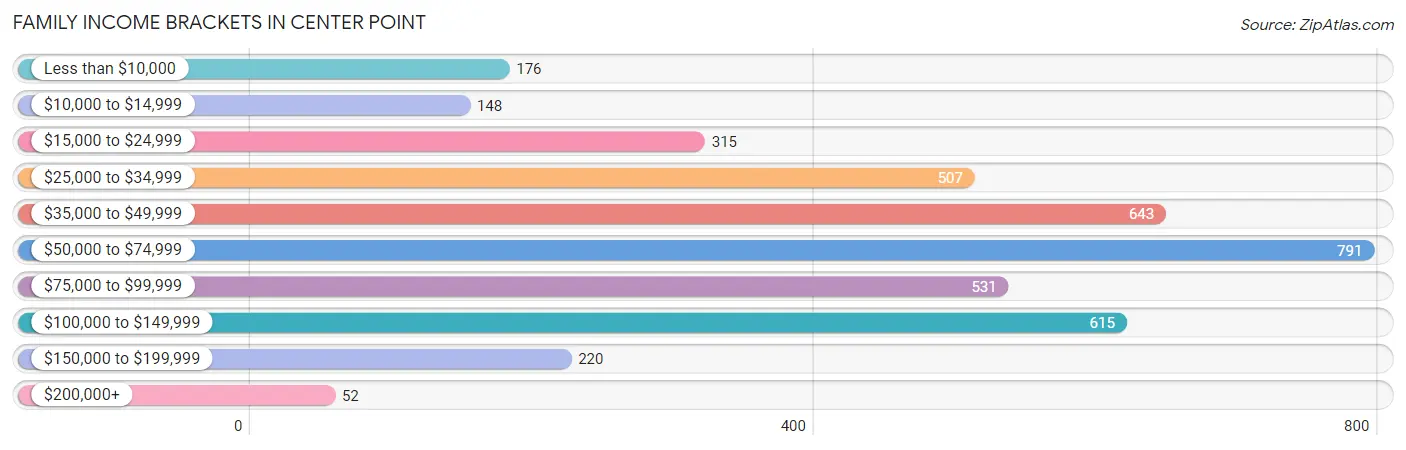
Family Income Brackets in Center Point
According to the Center Point family income data, there are 791 families falling into the $50,000 to $74,999 income range, which is the most common income bracket and makes up 19.8% of all families. Conversely, the $200,000+ income bracket is the least frequent group with only 52 families (1.3%) belonging to this category.
| Income Bracket | # Families | % Families |
| Less than $10,000 | 176 | 4.4% |
| $10,000 to $14,999 | 148 | 3.7% |
| $15,000 to $24,999 | 315 | 7.9% |
| $25,000 to $34,999 | 507 | 12.7% |
| $35,000 to $49,999 | 643 | 16.1% |
| $50,000 to $74,999 | 791 | 19.8% |
| $75,000 to $99,999 | 531 | 13.3% |
| $100,000 to $149,999 | 615 | 15.4% |
| $150,000 to $199,999 | 220 | 5.5% |
| $200,000+ | 52 | 1.3% |
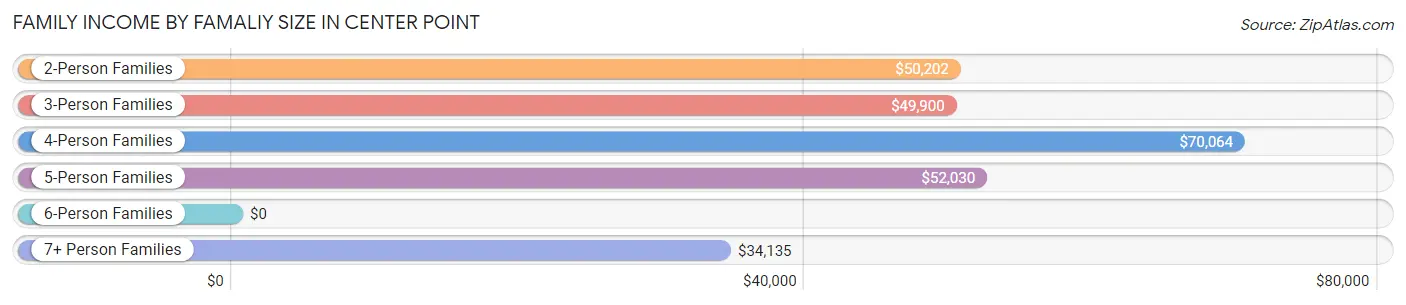
Family Income by Famaliy Size in Center Point
4-person families (886 | 22.2%) account for the highest median family income in Center Point with $70,064 per family, while 2-person families (1,638 | 41.0%) have the highest median income of $25,101 per family member.
| Income Bracket | # Families | Median Income |
| 2-Person Families | 1,638 (41.0%) | $50,202 |
| 3-Person Families | 894 (22.4%) | $49,900 |
| 4-Person Families | 886 (22.2%) | $70,064 |
| 5-Person Families | 439 (11.0%) | $52,030 |
| 6-Person Families | 57 (1.4%) | $0 |
| 7+ Person Families | 79 (2.0%) | $34,135 |
| Total | 3,993 (100.0%) | $52,424 |
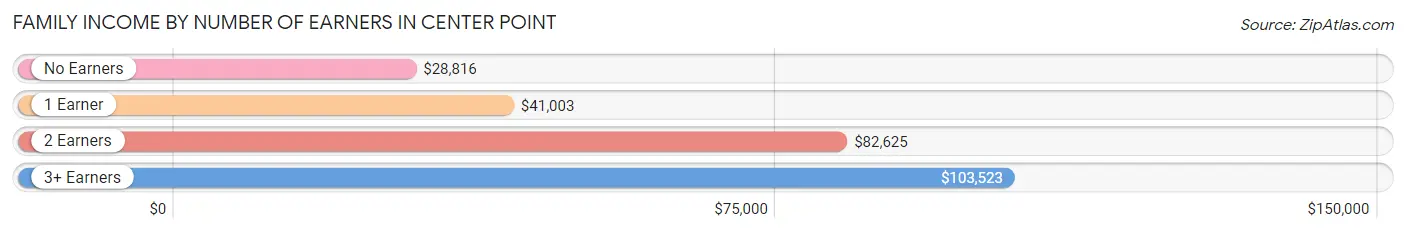
Family Income by Number of Earners in Center Point
The median family income in Center Point is $52,424, with families comprising 3+ earners (163) having the highest median family income of $103,523, while families with no earners (544) have the lowest median family income of $28,816, accounting for 4.1% and 13.6% of families, respectively.
| Number of Earners | # Families | Median Income |
| No Earners | 544 (13.6%) | $28,816 |
| 1 Earner | 1,627 (40.7%) | $41,003 |
| 2 Earners | 1,659 (41.5%) | $82,625 |
| 3+ Earners | 163 (4.1%) | $103,523 |
| Total | 3,993 (100.0%) | $52,424 |
Household Income in Center Point
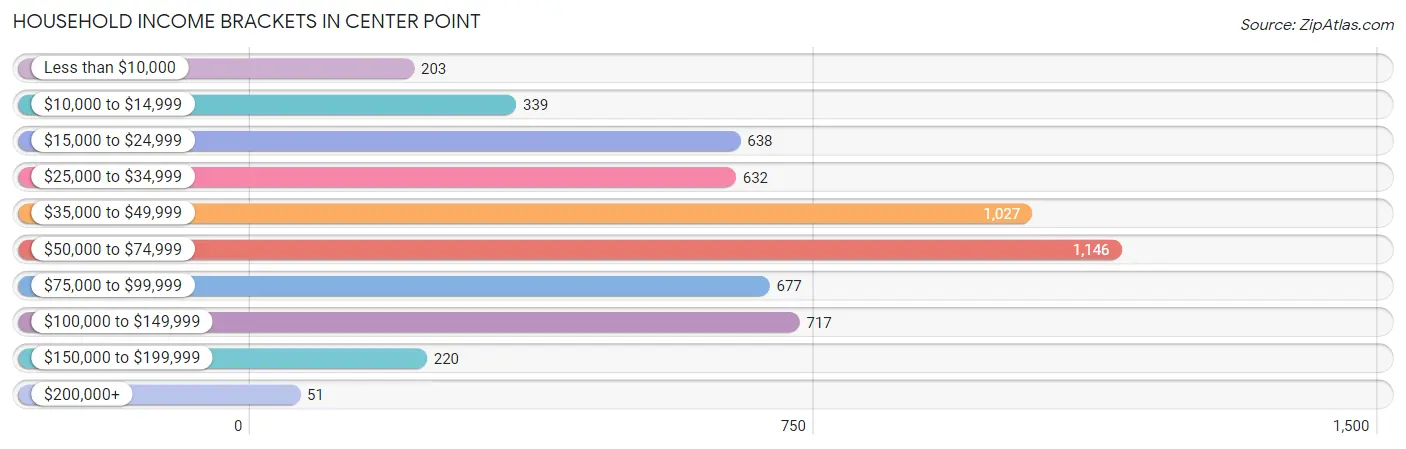
Household Income Brackets in Center Point
With 1,146 households falling in the category, the $50,000 to $74,999 income range is the most frequent in Center Point, accounting for 20.3% of all households. In contrast, only 51 households (0.9%) fall into the $200,000+ income bracket, making it the least populous group.
| Income Bracket | # Households | % Households |
| Less than $10,000 | 203 | 3.6% |
| $10,000 to $14,999 | 339 | 6.0% |
| $15,000 to $24,999 | 638 | 11.3% |
| $25,000 to $34,999 | 632 | 11.2% |
| $35,000 to $49,999 | 1,027 | 18.2% |
| $50,000 to $74,999 | 1,146 | 20.3% |
| $75,000 to $99,999 | 677 | 12.0% |
| $100,000 to $149,999 | 717 | 12.7% |
| $150,000 to $199,999 | 220 | 3.9% |
| $200,000+ | 51 | 0.9% |
Household Income by Householder Age in Center Point
The median household income in Center Point is $49,886, with the highest median household income of $57,766 found in the 45 to 64 years age bracket for the primary householder. A total of 2,103 households (37.3%) fall into this category. Meanwhile, the 15 to 24 years age bracket for the primary householder has the lowest median household income of $0, with 47 households (0.8%) in this group.
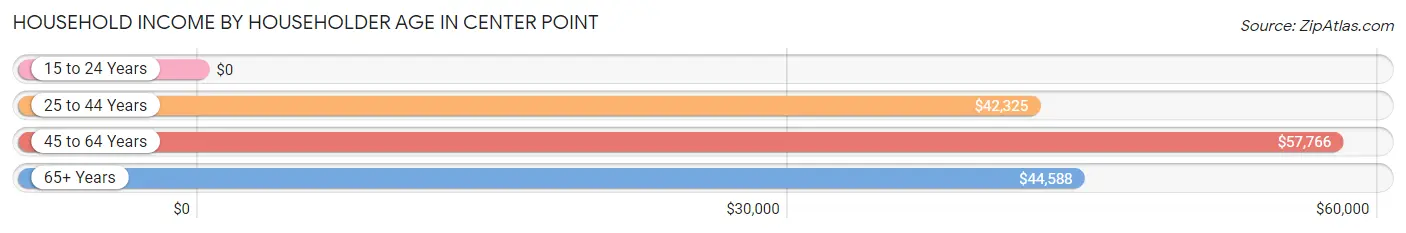
| Income Bracket | # Households | Median Income |
| 15 to 24 Years | 47 (0.8%) | $0 |
| 25 to 44 Years | 2,306 (40.9%) | $42,325 |
| 45 to 64 Years | 2,103 (37.3%) | $57,766 |
| 65+ Years | 1,187 (21.0%) | $44,588 |
| Total | 5,643 (100.0%) | $49,886 |
Poverty in Center Point
Income Below Poverty by Sex and Age in Center Point
With 18.3% poverty level for males and 19.8% for females among the residents of Center Point, 15 year old males and 15 year old females are the most vulnerable to poverty, with 100 males (59.5%) and 19 females (59.4%) in their respective age groups living below the poverty level.
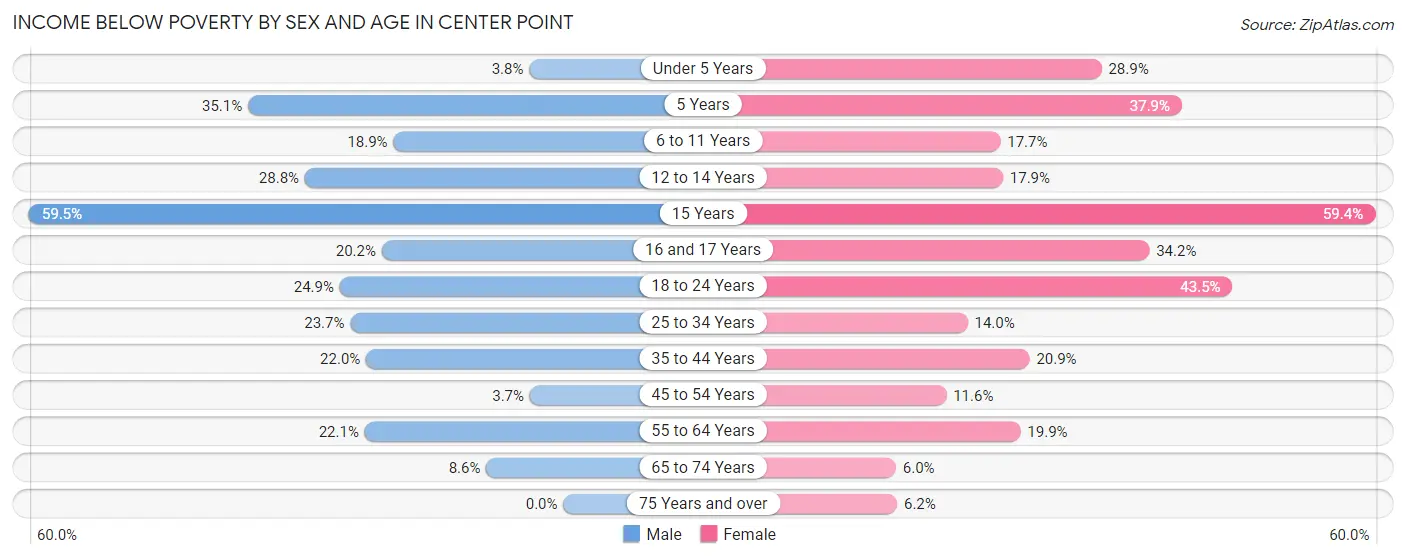
| Age Bracket | Male | Female |
| Under 5 Years | 17 (3.8%) | 118 (28.9%) |
| 5 Years | 59 (35.1%) | 89 (37.9%) |
| 6 to 11 Years | 193 (18.9%) | 143 (17.6%) |
| 12 to 14 Years | 135 (28.8%) | 68 (17.9%) |
| 15 Years | 100 (59.5%) | 19 (59.4%) |
| 16 and 17 Years | 56 (20.2%) | 151 (34.2%) |
| 18 to 24 Years | 124 (24.9%) | 241 (43.5%) |
| 25 to 34 Years | 266 (23.7%) | 181 (14.0%) |
| 35 to 44 Years | 204 (22.0%) | 274 (20.9%) |
| 45 to 54 Years | 40 (3.7%) | 97 (11.6%) |
| 55 to 64 Years | 215 (22.1%) | 186 (19.9%) |
| 65 to 74 Years | 37 (8.6%) | 38 (6.0%) |
| 75 Years and over | 0 (0.0%) | 22 (6.1%) |
| Total | 1,446 (18.3%) | 1,627 (19.8%) |
Income Above Poverty by Sex and Age in Center Point
According to the poverty statistics in Center Point, males aged 75 years and over and females aged 65 to 74 years are the age groups that are most secure financially, with 100.0% of males and 94.0% of females in these age groups living above the poverty line.
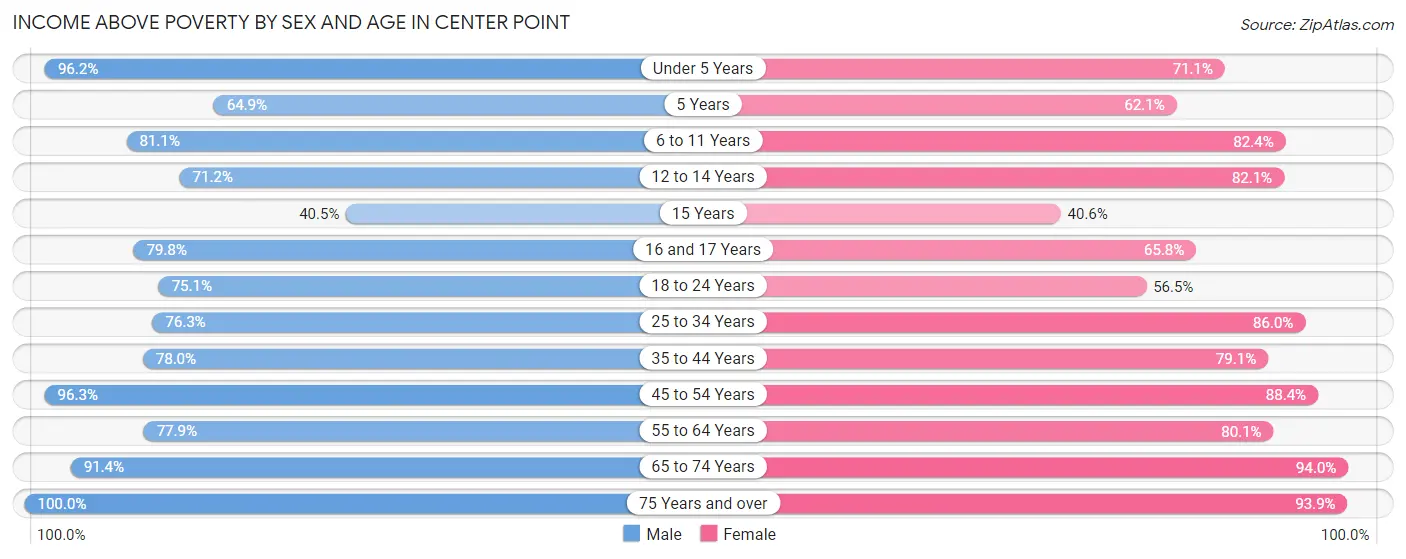
| Age Bracket | Male | Female |
| Under 5 Years | 432 (96.2%) | 290 (71.1%) |
| 5 Years | 109 (64.9%) | 146 (62.1%) |
| 6 to 11 Years | 827 (81.1%) | 667 (82.4%) |
| 12 to 14 Years | 334 (71.2%) | 311 (82.1%) |
| 15 Years | 68 (40.5%) | 13 (40.6%) |
| 16 and 17 Years | 221 (79.8%) | 290 (65.8%) |
| 18 to 24 Years | 374 (75.1%) | 313 (56.5%) |
| 25 to 34 Years | 855 (76.3%) | 1,112 (86.0%) |
| 35 to 44 Years | 725 (78.0%) | 1,037 (79.1%) |
| 45 to 54 Years | 1,031 (96.3%) | 737 (88.4%) |
| 55 to 64 Years | 757 (77.9%) | 749 (80.1%) |
| 65 to 74 Years | 394 (91.4%) | 593 (94.0%) |
| 75 Years and over | 309 (100.0%) | 336 (93.9%) |
| Total | 6,436 (81.7%) | 6,594 (80.2%) |
Income Below Poverty Among Married-Couple Families in Center Point
The poverty statistics for married-couple families in Center Point show that 7.4% or 159 of the total 2,158 families live below the poverty line. Families with 5 or more children have the highest poverty rate of 100.0%, comprising of 14 families. On the other hand, families with 1 or 2 children have the lowest poverty rate of 5.9%, which includes 56 families.
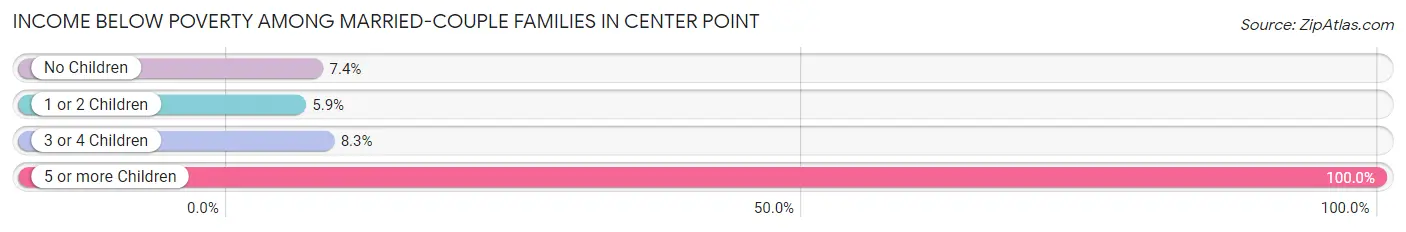
| Children | Above Poverty | Below Poverty |
| No Children | 956 (92.6%) | 76 (7.4%) |
| 1 or 2 Children | 900 (94.1%) | 56 (5.9%) |
| 3 or 4 Children | 143 (91.7%) | 13 (8.3%) |
| 5 or more Children | 0 (0.0%) | 14 (100.0%) |
| Total | 1,999 (92.6%) | 159 (7.4%) |
Income Below Poverty Among Single-Parent Households in Center Point
According to the poverty data in Center Point, 28.3% or 113 single-father households and 23.3% or 335 single-mother households are living below the poverty line. Among single-father households, those with 1 or 2 children have the highest poverty rate, with 92 households (50.3%) experiencing poverty. Likewise, among single-mother households, those with 3 or 4 children have the highest poverty rate, with 108 households (76.1%) falling below the poverty line.
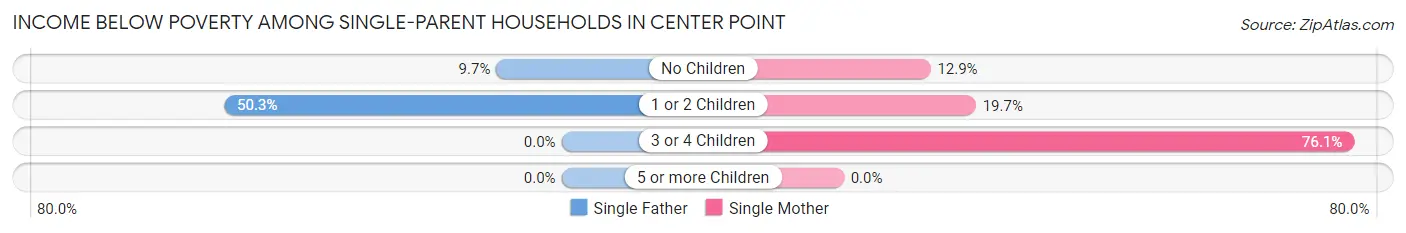
| Children | Single Father | Single Mother |
| No Children | 21 (9.7%) | 53 (12.9%) |
| 1 or 2 Children | 92 (50.3%) | 174 (19.7%) |
| 3 or 4 Children | 0 (0.0%) | 108 (76.1%) |
| 5 or more Children | 0 (0.0%) | 0 (0.0%) |
| Total | 113 (28.3%) | 335 (23.3%) |
Income Below Poverty Among Married-Couple vs Single-Parent Households in Center Point
The poverty data for Center Point shows that 159 of the married-couple family households (7.4%) and 448 of the single-parent households (24.4%) are living below the poverty level. Within the married-couple family households, those with 5 or more children have the highest poverty rate, with 14 households (100.0%) falling below the poverty line. Among the single-parent households, those with 3 or 4 children have the highest poverty rate, with 108 household (76.1%) living below poverty.
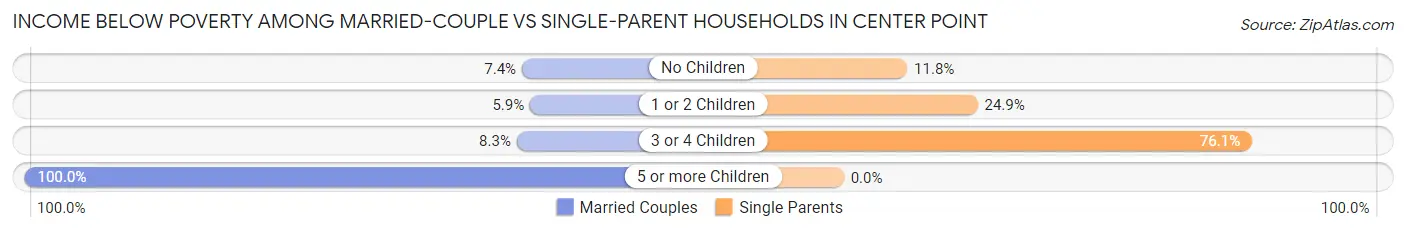
| Children | Married-Couple Families | Single-Parent Households |
| No Children | 76 (7.4%) | 74 (11.8%) |
| 1 or 2 Children | 56 (5.9%) | 266 (24.9%) |
| 3 or 4 Children | 13 (8.3%) | 108 (76.1%) |
| 5 or more Children | 14 (100.0%) | 0 (0.0%) |
| Total | 159 (7.4%) | 448 (24.4%) |
Race in Center Point
The most populous races in Center Point are Black / African American (11,819 | 72.6%), White / Caucasian (3,405 | 20.9%), and Hispanic or Latino (745 | 4.6%).
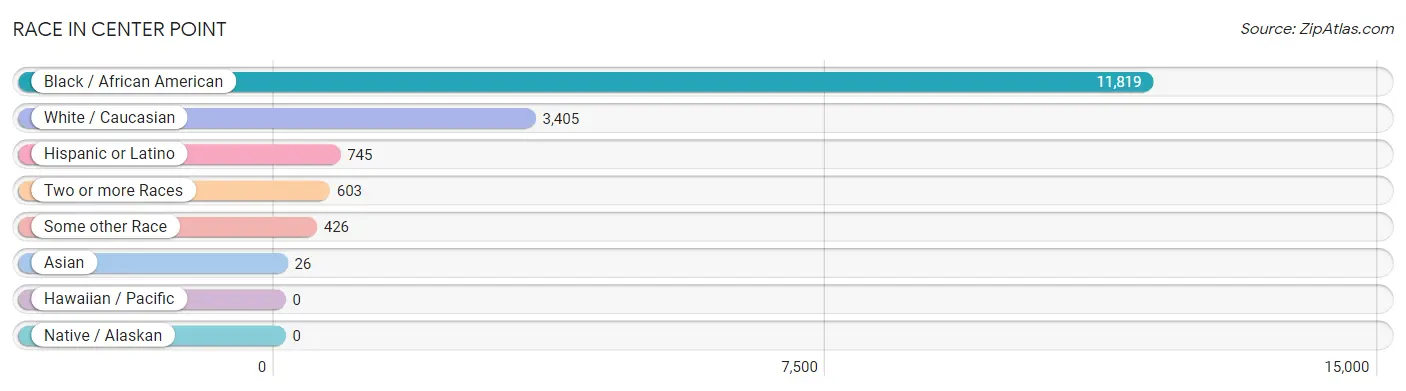
| Race | # Population | % Population |
| Asian | 26 | 0.2% |
| Black / African American | 11,819 | 72.6% |
| Hawaiian / Pacific | 0 | 0.0% |
| Hispanic or Latino | 745 | 4.6% |
| Native / Alaskan | 0 | 0.0% |
| White / Caucasian | 3,405 | 20.9% |
| Two or more Races | 603 | 3.7% |
| Some other Race | 426 | 2.6% |
| Total | 16,279 | 100.0% |
Ancestry in Center Point
The most populous ancestries reported in Center Point are Subsaharan African (1,245 | 7.6%), African (1,211 | 7.4%), American (739 | 4.5%), Mexican (612 | 3.8%), and Irish (560 | 3.4%), together accounting for 26.8% of all Center Point residents.
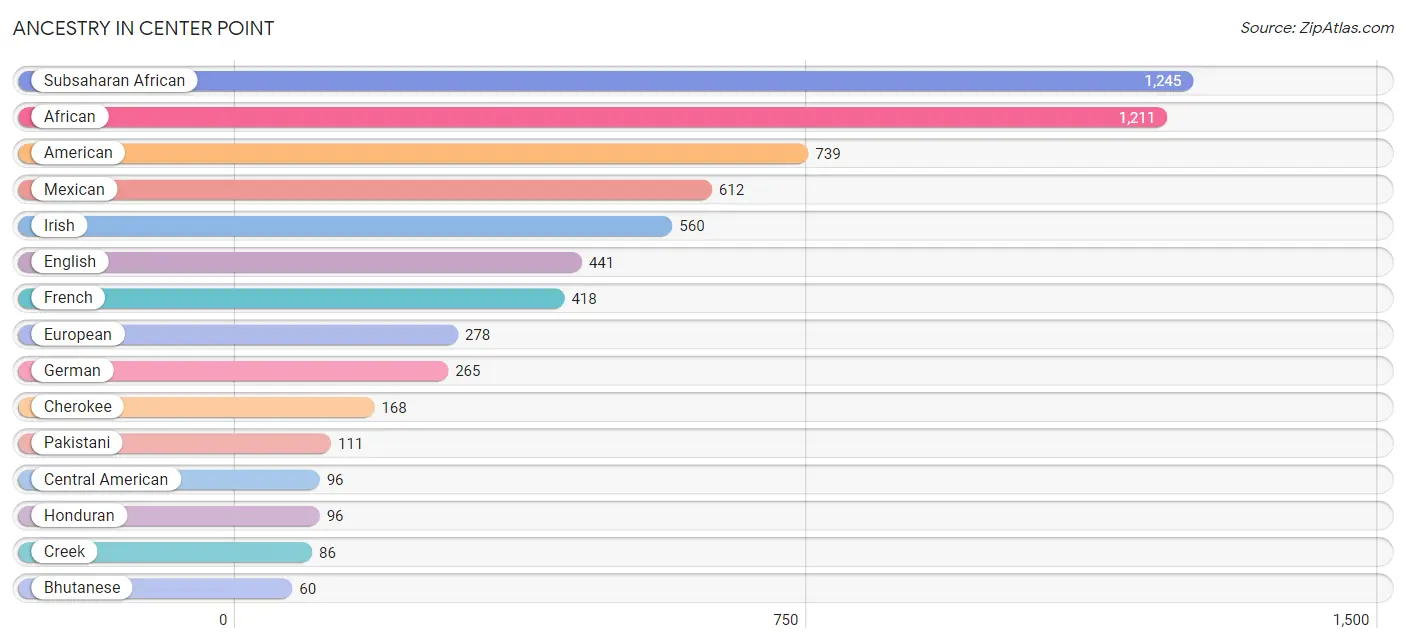
| Ancestry | # Population | % Population |
| African | 1,211 | 7.4% |
| American | 739 | 4.5% |
| Bhutanese | 60 | 0.4% |
| Blackfeet | 30 | 0.2% |
| British | 29 | 0.2% |
| Burmese | 12 | 0.1% |
| Central American | 96 | 0.6% |
| Central American Indian | 53 | 0.3% |
| Cherokee | 168 | 1.0% |
| Colombian | 5 | 0.0% |
| Creek | 86 | 0.5% |
| Cuban | 8 | 0.1% |
| Czech | 26 | 0.2% |
| Dutch | 13 | 0.1% |
| Eastern European | 9 | 0.1% |
| English | 441 | 2.7% |
| European | 278 | 1.7% |
| French | 418 | 2.6% |
| German | 265 | 1.6% |
| Haitian | 57 | 0.4% |
| Honduran | 96 | 0.6% |
| Hungarian | 24 | 0.2% |
| Indian (Asian) | 7 | 0.0% |
| Irish | 560 | 3.4% |
| Italian | 15 | 0.1% |
| Kenyan | 7 | 0.0% |
| Korean | 49 | 0.3% |
| Mexican | 612 | 3.8% |
| Mexican American Indian | 34 | 0.2% |
| Nigerian | 27 | 0.2% |
| Pakistani | 111 | 0.7% |
| Polish | 28 | 0.2% |
| Scandinavian | 9 | 0.1% |
| Scotch-Irish | 38 | 0.2% |
| Scottish | 58 | 0.4% |
| South American | 22 | 0.1% |
| Spaniard | 7 | 0.0% |
| Sri Lankan | 8 | 0.1% |
| Subsaharan African | 1,245 | 7.6% |
| Swedish | 2 | 0.0% |
| Ukrainian | 10 | 0.1% |
| Venezuelan | 17 | 0.1% |
| Welsh | 13 | 0.1% | View All 43 Rows |
Immigrants in Center Point
The most numerous immigrant groups reported in Center Point came from Latin America (369 | 2.3%), Central America (332 | 2.0%), Mexico (236 | 1.5%), Honduras (96 | 0.6%), and South America (37 | 0.2%), together accounting for 6.6% of all Center Point residents.
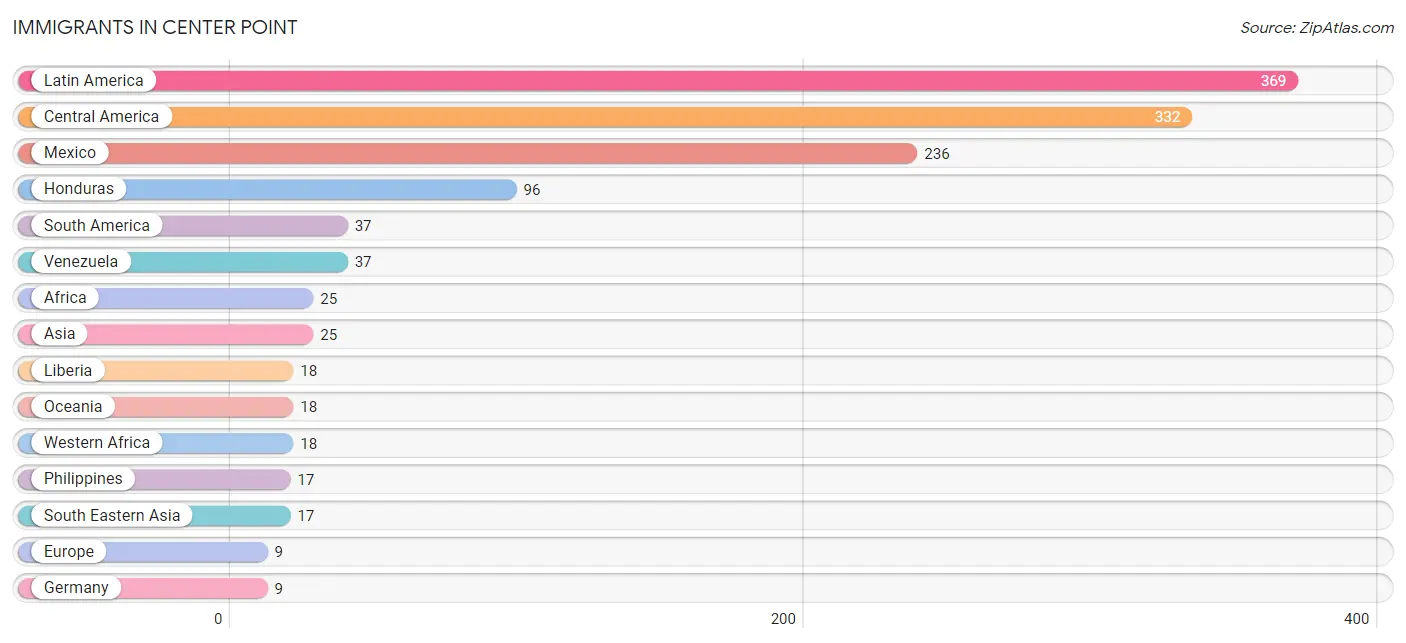
| Immigration Origin | # Population | % Population |
| Africa | 25 | 0.2% |
| Asia | 25 | 0.2% |
| Central America | 332 | 2.0% |
| Eastern Africa | 7 | 0.0% |
| Europe | 9 | 0.1% |
| Germany | 9 | 0.1% |
| Honduras | 96 | 0.6% |
| India | 8 | 0.1% |
| Kenya | 7 | 0.0% |
| Latin America | 369 | 2.3% |
| Liberia | 18 | 0.1% |
| Mexico | 236 | 1.5% |
| Oceania | 18 | 0.1% |
| Philippines | 17 | 0.1% |
| South America | 37 | 0.2% |
| South Central Asia | 8 | 0.1% |
| South Eastern Asia | 17 | 0.1% |
| Venezuela | 37 | 0.2% |
| Western Africa | 18 | 0.1% |
| Western Europe | 9 | 0.1% | View All 20 Rows |
Sex and Age in Center Point
Sex and Age in Center Point
The most populous age groups in Center Point are 5 to 9 Years (910 | 11.4%) for men and 40 to 44 Years (799 | 9.6%) for women.
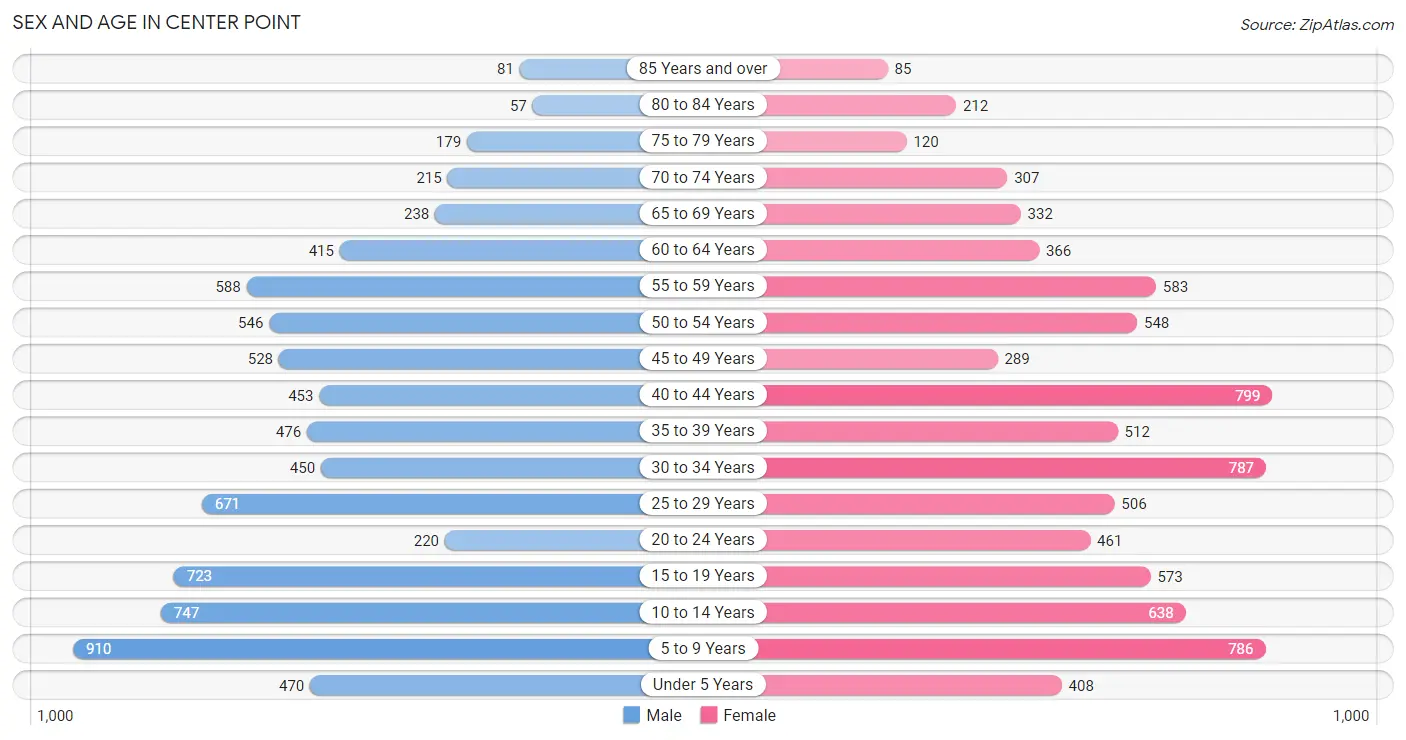
| Age Bracket | Male | Female |
| Under 5 Years | 470 (5.9%) | 408 (4.9%) |
| 5 to 9 Years | 910 (11.4%) | 786 (9.5%) |
| 10 to 14 Years | 747 (9.4%) | 638 (7.7%) |
| 15 to 19 Years | 723 (9.1%) | 573 (6.9%) |
| 20 to 24 Years | 220 (2.8%) | 461 (5.6%) |
| 25 to 29 Years | 671 (8.4%) | 506 (6.1%) |
| 30 to 34 Years | 450 (5.7%) | 787 (9.5%) |
| 35 to 39 Years | 476 (6.0%) | 512 (6.2%) |
| 40 to 44 Years | 453 (5.7%) | 799 (9.6%) |
| 45 to 49 Years | 528 (6.6%) | 289 (3.5%) |
| 50 to 54 Years | 546 (6.9%) | 548 (6.6%) |
| 55 to 59 Years | 588 (7.4%) | 583 (7.0%) |
| 60 to 64 Years | 415 (5.2%) | 366 (4.4%) |
| 65 to 69 Years | 238 (3.0%) | 332 (4.0%) |
| 70 to 74 Years | 215 (2.7%) | 307 (3.7%) |
| 75 to 79 Years | 179 (2.2%) | 120 (1.4%) |
| 80 to 84 Years | 57 (0.7%) | 212 (2.5%) |
| 85 Years and over | 81 (1.0%) | 85 (1.0%) |
| Total | 7,967 (100.0%) | 8,312 (100.0%) |
Families and Households in Center Point
Median Family Size in Center Point
The median family size in Center Point is 3.45 persons per family, with married-couple families (2,158 | 54.0%) accounting for the largest median family size of 3.65 persons per family. On the other hand, single male/father families (399 | 10.0%) represent the smallest median family size with 3.11 persons per family.
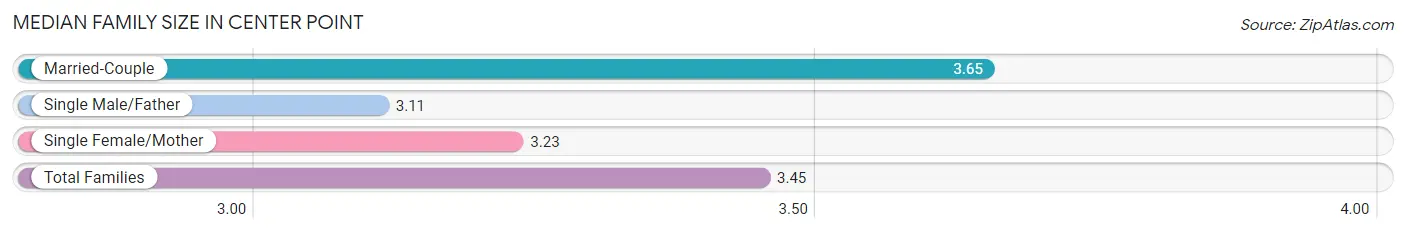
| Family Type | # Families | Family Size |
| Married-Couple | 2,158 (54.0%) | 3.65 |
| Single Male/Father | 399 (10.0%) | 3.11 |
| Single Female/Mother | 1,436 (36.0%) | 3.23 |
| Total Families | 3,993 (100.0%) | 3.45 |
Median Household Size in Center Point
The median household size in Center Point is 2.85 persons per household, with married-couple households (2,158 | 38.2%) accounting for the largest median household size of 3.66 persons per household. non-family households (1,650 | 29.2%) represent the smallest median household size with 1.17 persons per household.
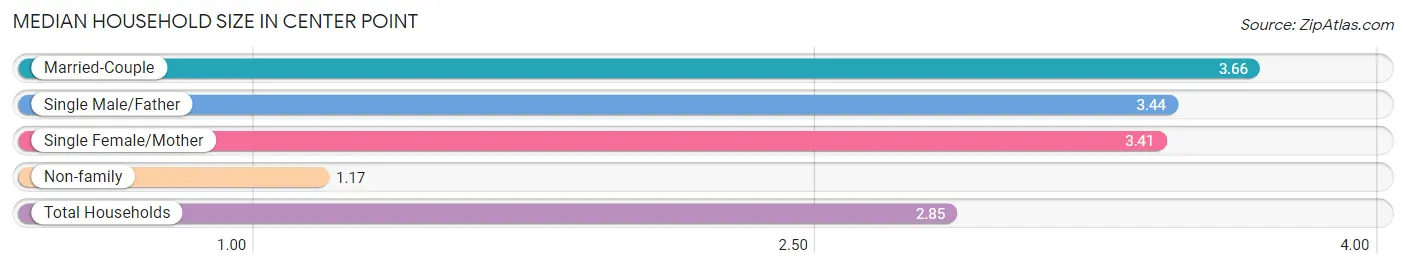
| Household Type | # Households | Household Size |
| Married-Couple | 2,158 (38.2%) | 3.66 |
| Single Male/Father | 399 (7.1%) | 3.44 |
| Single Female/Mother | 1,436 (25.5%) | 3.41 |
| Non-family | 1,650 (29.2%) | 1.17 |
| Total Households | 5,643 (100.0%) | 2.85 |
Household Size by Marriage Status in Center Point
Out of a total of 5,643 households in Center Point, 3,993 (70.8%) are family households, while 1,650 (29.2%) are nonfamily households. The most numerous type of family households are 2-person households, comprising 1,552, and the most common type of nonfamily households are 1-person households, comprising 1,430.
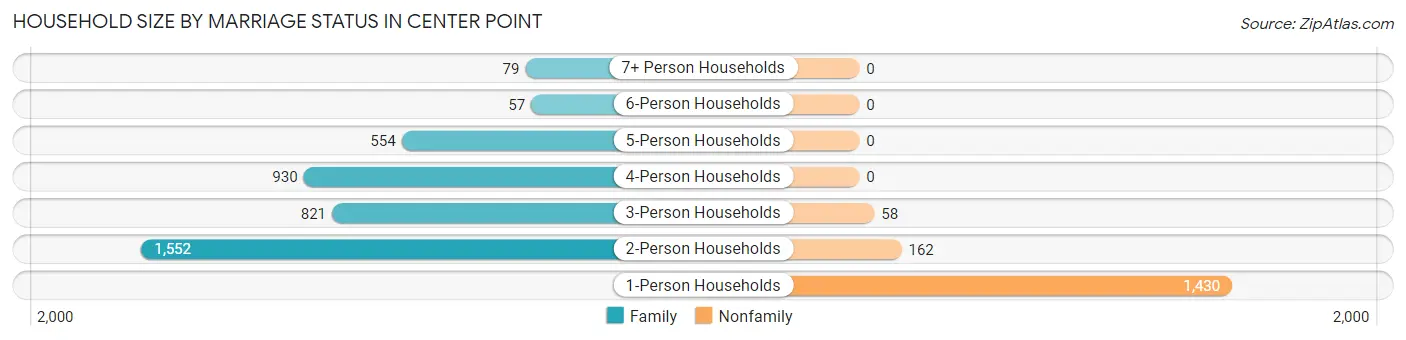
| Household Size | Family Households | Nonfamily Households |
| 1-Person Households | - | 1,430 (25.3%) |
| 2-Person Households | 1,552 (27.5%) | 162 (2.9%) |
| 3-Person Households | 821 (14.5%) | 58 (1.0%) |
| 4-Person Households | 930 (16.5%) | 0 (0.0%) |
| 5-Person Households | 554 (9.8%) | 0 (0.0%) |
| 6-Person Households | 57 (1.0%) | 0 (0.0%) |
| 7+ Person Households | 79 (1.4%) | 0 (0.0%) |
| Total | 3,993 (70.8%) | 1,650 (29.2%) |
Female Fertility in Center Point
Fertility by Age in Center Point
Average fertility rate in Center Point is 68.0 births per 1,000 women. Women in the age bracket of 20 to 34 years have the highest fertility rate with 104.0 births per 1,000 women. Women in the age bracket of 20 to 34 years acount for 65.1% of all women with births.
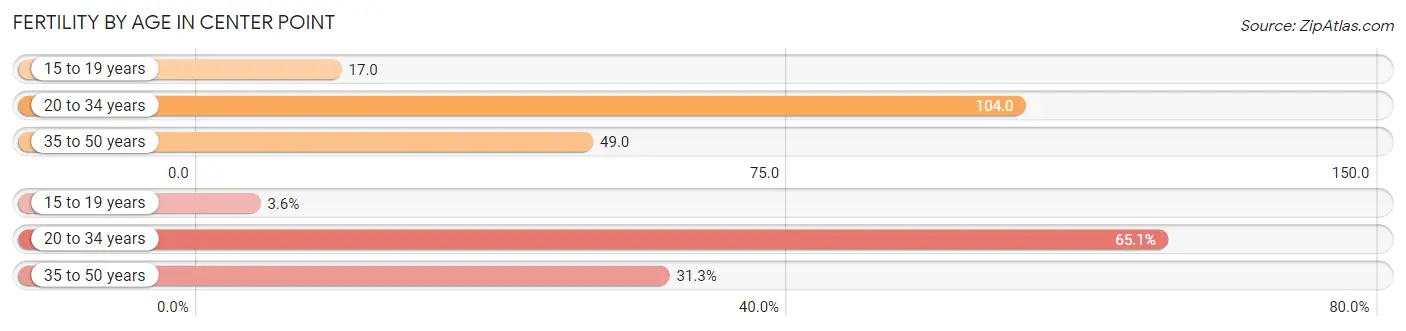
| Age Bracket | Women with Births | Births / 1,000 Women |
| 15 to 19 years | 10 (3.6%) | 17.0 |
| 20 to 34 years | 183 (65.1%) | 104.0 |
| 35 to 50 years | 88 (31.3%) | 49.0 |
| Total | 281 (100.0%) | 68.0 |
Fertility by Age by Marriage Status in Center Point
49.5% of women with births (281) in Center Point are married. The highest percentage of unmarried women with births falls into 35 to 50 years age bracket with 61.4% of them unmarried at the time of birth, while the lowest percentage of unmarried women with births belong to 15 to 19 years age bracket with 0.0% of them unmarried.
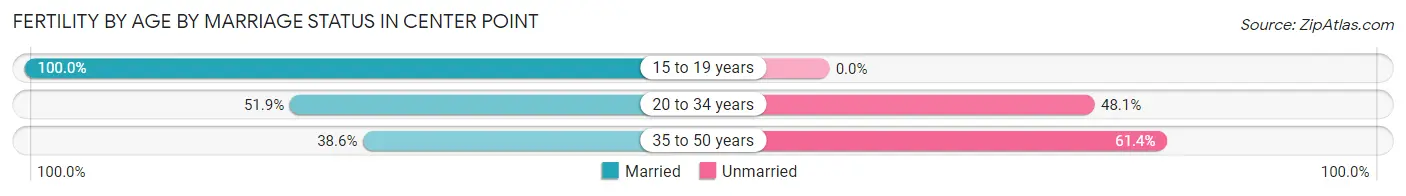
| Age Bracket | Married | Unmarried |
| 15 to 19 years | 10 (100.0%) | 0 (0.0%) |
| 20 to 34 years | 95 (51.9%) | 88 (48.1%) |
| 35 to 50 years | 34 (38.6%) | 54 (61.4%) |
| Total | 139 (49.5%) | 142 (50.5%) |
Fertility by Education in Center Point
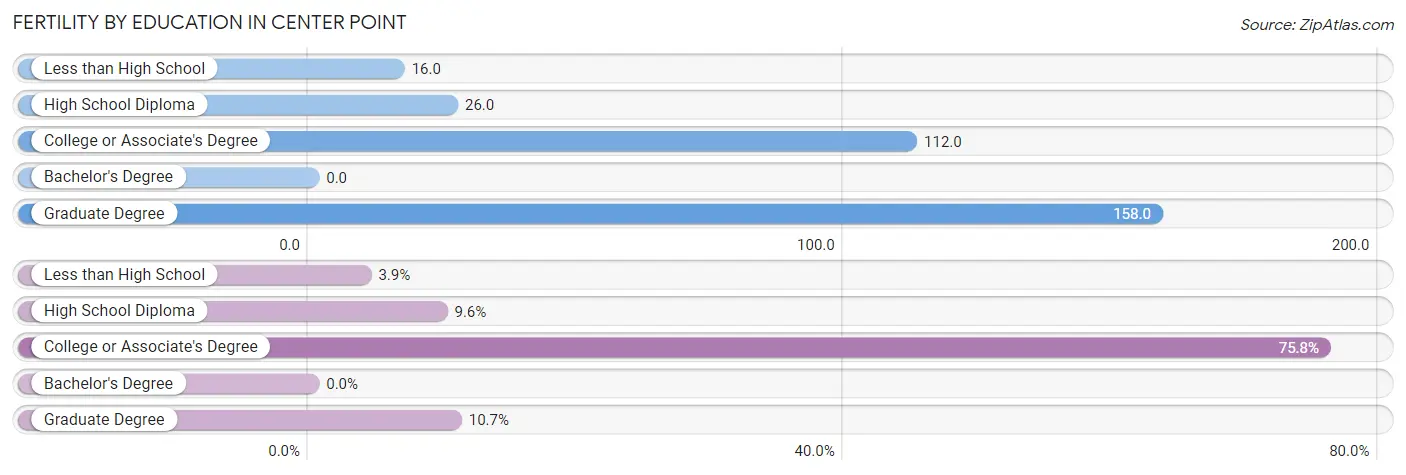
| Educational Attainment | Women with Births | Births / 1,000 Women |
| Less than High School | 11 (3.9%) | 16.0 |
| High School Diploma | 27 (9.6%) | 26.0 |
| College or Associate's Degree | 213 (75.8%) | 112.0 |
| Bachelor's Degree | 0 (0.0%) | 0.0 |
| Graduate Degree | 30 (10.7%) | 158.0 |
| Total | 281 (100.0%) | 68.0 |
Fertility by Education by Marriage Status in Center Point
50.5% of women with births in Center Point are unmarried. Women with the educational attainment of graduate degree are most likely to be married with 100.0% of them married at childbirth, while women with the educational attainment of high school diploma are least likely to be married with 100.0% of them unmarried at childbirth.
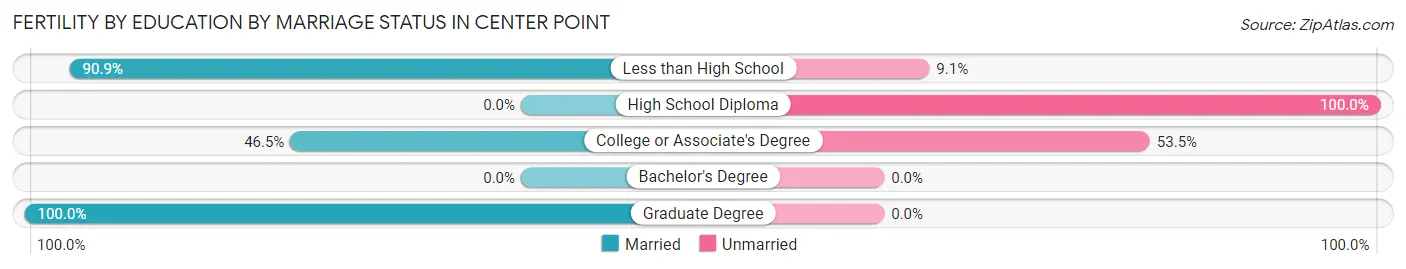
| Educational Attainment | Married | Unmarried |
| Less than High School | 10 (90.9%) | 1 (9.1%) |
| High School Diploma | 0 (0.0%) | 27 (100.0%) |
| College or Associate's Degree | 99 (46.5%) | 114 (53.5%) |
| Bachelor's Degree | 0 (0.0%) | 0 (0.0%) |
| Graduate Degree | 30 (100.0%) | 0 (0.0%) |
| Total | 139 (49.5%) | 142 (50.5%) |
Employment Characteristics in Center Point
Employment by Class of Employer in Center Point
Among the 6,690 employed individuals in Center Point, private company employees (4,895 | 73.2%), not-for-profit organizations (435 | 6.5%), and federal government employees (432 | 6.5%) make up the most common classes of employment.
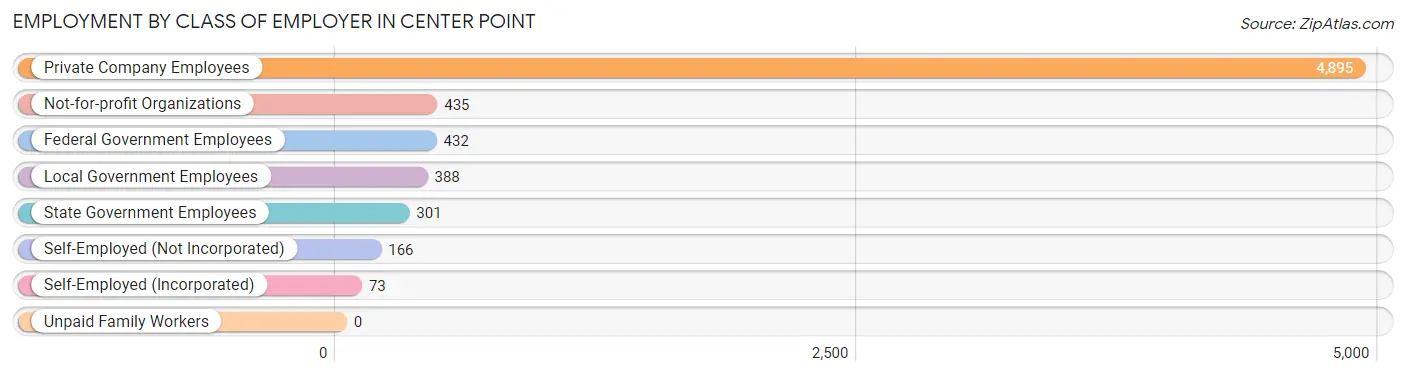
| Employer Class | # Employees | % Employees |
| Private Company Employees | 4,895 | 73.2% |
| Self-Employed (Incorporated) | 73 | 1.1% |
| Self-Employed (Not Incorporated) | 166 | 2.5% |
| Not-for-profit Organizations | 435 | 6.5% |
| Local Government Employees | 388 | 5.8% |
| State Government Employees | 301 | 4.5% |
| Federal Government Employees | 432 | 6.5% |
| Unpaid Family Workers | 0 | 0.0% |
| Total | 6,690 | 100.0% |
Employment Status by Age in Center Point
According to the labor force statistics for Center Point, out of the total population over 16 years of age (12,120), 62.0% or 7,514 individuals are in the labor force, with 10.0% or 751 of them unemployed. The age group with the highest labor force participation rate is 25 to 29 years, with 88.5% or 1,042 individuals in the labor force. Within the labor force, the 16 to 19 years age range has the highest percentage of unemployed individuals, with 35.5% or 115 of them being unemployed.
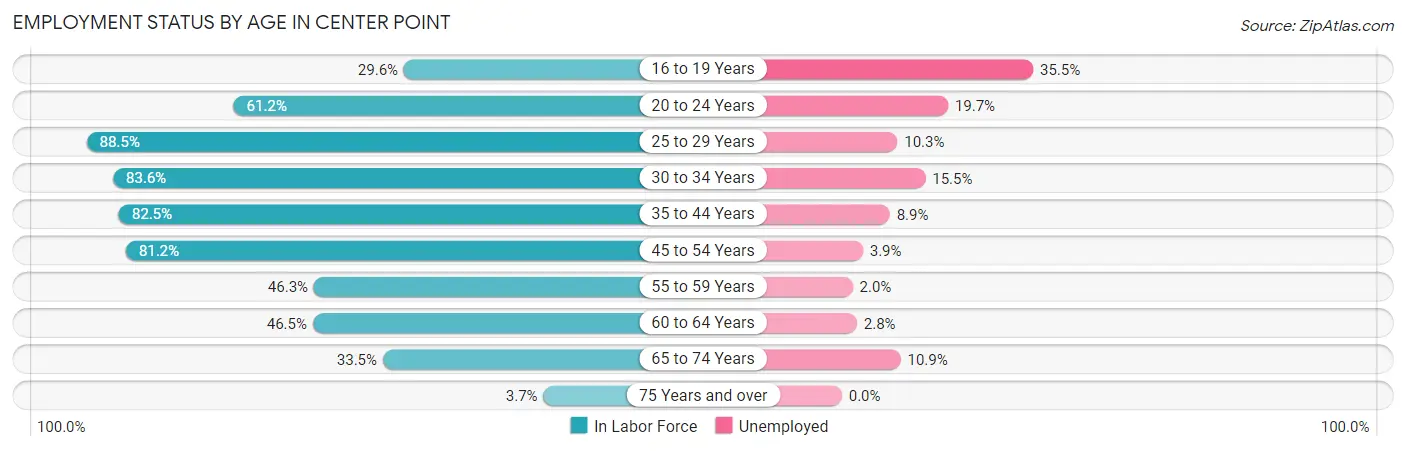
| Age Bracket | In Labor Force | Unemployed |
| 16 to 19 Years | 324 (29.6%) | 115 (35.5%) |
| 20 to 24 Years | 417 (61.2%) | 82 (19.7%) |
| 25 to 29 Years | 1,042 (88.5%) | 107 (10.3%) |
| 30 to 34 Years | 1,034 (83.6%) | 160 (15.5%) |
| 35 to 44 Years | 1,848 (82.5%) | 164 (8.9%) |
| 45 to 54 Years | 1,552 (81.2%) | 61 (3.9%) |
| 55 to 59 Years | 542 (46.3%) | 11 (2.0%) |
| 60 to 64 Years | 363 (46.5%) | 10 (2.8%) |
| 65 to 74 Years | 366 (33.5%) | 40 (10.9%) |
| 75 Years and over | 27 (3.7%) | 0 (0.0%) |
| Total | 7,514 (62.0%) | 751 (10.0%) |
Employment Status by Educational Attainment in Center Point
According to labor force statistics for Center Point, 74.9% of individuals (6,379) out of the total population between 25 and 64 years of age (8,517) are in the labor force, with 8.0% or 510 of them being unemployed. The group with the highest labor force participation rate are those with the educational attainment of bachelor's degree or higher, with 83.9% or 1,174 individuals in the labor force. Within the labor force, individuals with high school diploma education have the highest percentage of unemployment, with 12.2% or 280 of them being unemployed.
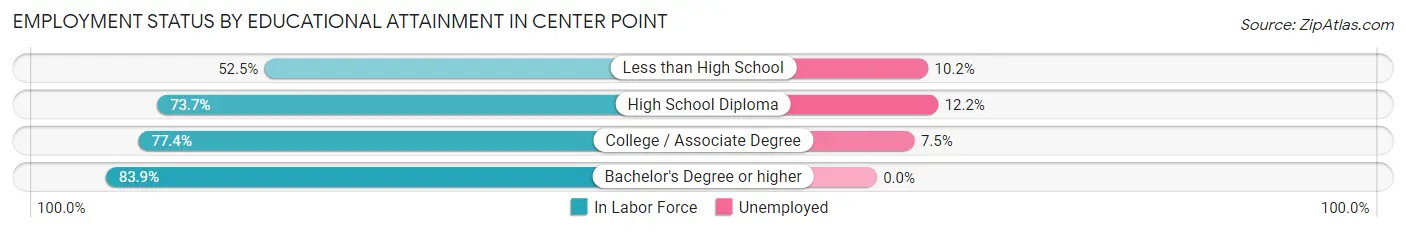
| Educational Attainment | In Labor Force | Unemployed |
| Less than High School | 392 (52.5%) | 76 (10.2%) |
| High School Diploma | 2,297 (73.7%) | 380 (12.2%) |
| College / Associate Degree | 2,519 (77.4%) | 244 (7.5%) |
| Bachelor's Degree or higher | 1,174 (83.9%) | 0 (0.0%) |
| Total | 6,379 (74.9%) | 681 (8.0%) |
Employment Occupations by Sex in Center Point
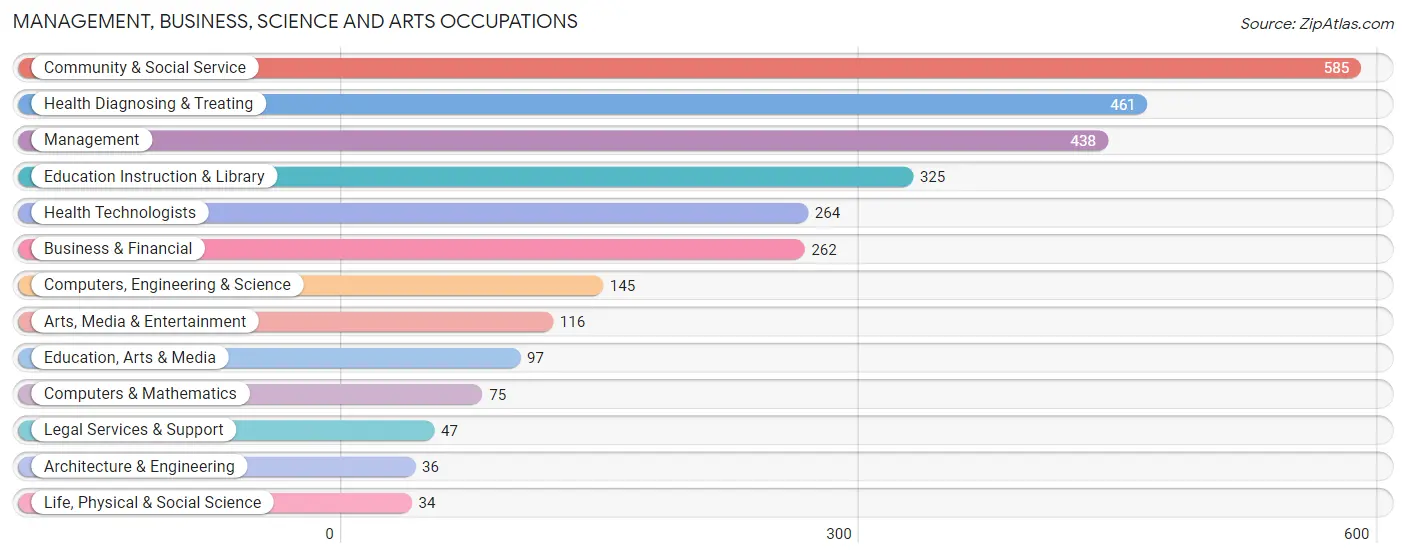
Management, Business, Science and Arts Occupations
The most common Management, Business, Science and Arts occupations in Center Point are Community & Social Service (585 | 8.7%), Health Diagnosing & Treating (461 | 6.8%), Management (438 | 6.5%), Education Instruction & Library (325 | 4.8%), and Health Technologists (264 | 3.9%).
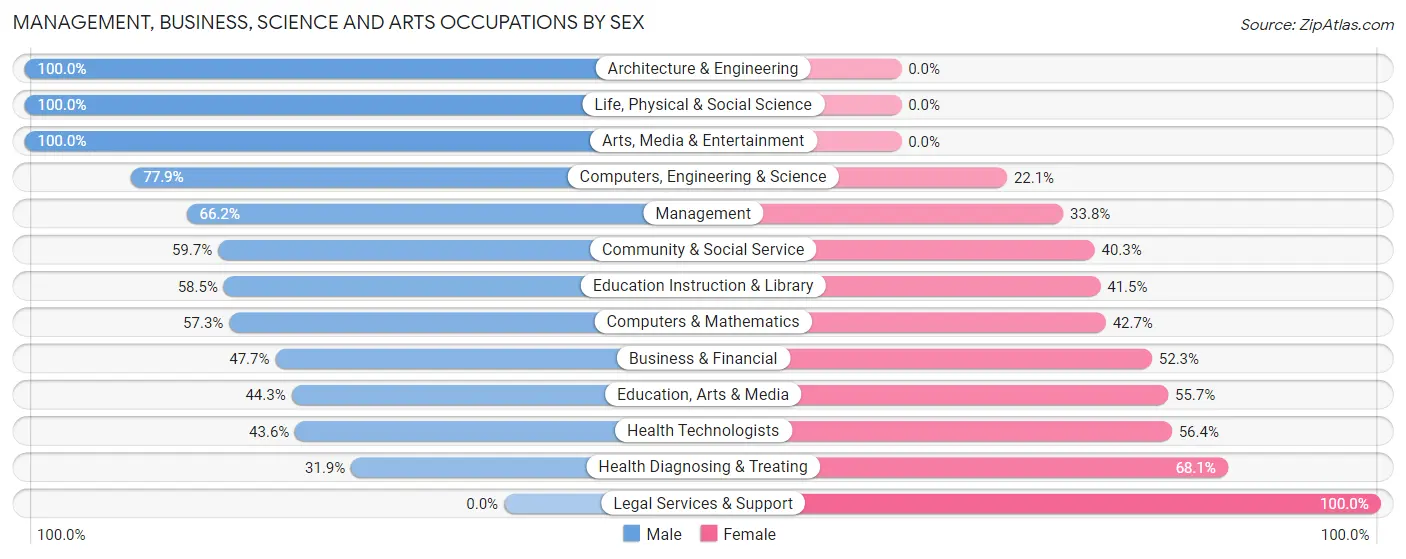
Management, Business, Science and Arts Occupations by Sex
Within the Management, Business, Science and Arts occupations in Center Point, the most male-oriented occupations are Architecture & Engineering (100.0%), Life, Physical & Social Science (100.0%), and Arts, Media & Entertainment (100.0%), while the most female-oriented occupations are Legal Services & Support (100.0%), Health Diagnosing & Treating (68.1%), and Health Technologists (56.4%).
| Occupation | Male | Female |
| Management | 290 (66.2%) | 148 (33.8%) |
| Business & Financial | 125 (47.7%) | 137 (52.3%) |
| Computers, Engineering & Science | 113 (77.9%) | 32 (22.1%) |
| Computers & Mathematics | 43 (57.3%) | 32 (42.7%) |
| Architecture & Engineering | 36 (100.0%) | 0 (0.0%) |
| Life, Physical & Social Science | 34 (100.0%) | 0 (0.0%) |
| Community & Social Service | 349 (59.7%) | 236 (40.3%) |
| Education, Arts & Media | 43 (44.3%) | 54 (55.7%) |
| Legal Services & Support | 0 (0.0%) | 47 (100.0%) |
| Education Instruction & Library | 190 (58.5%) | 135 (41.5%) |
| Arts, Media & Entertainment | 116 (100.0%) | 0 (0.0%) |
| Health Diagnosing & Treating | 147 (31.9%) | 314 (68.1%) |
| Health Technologists | 115 (43.6%) | 149 (56.4%) |
| Total (Category) | 1,024 (54.1%) | 867 (45.9%) |
| Total (Overall) | 3,303 (48.9%) | 3,454 (51.1%) |
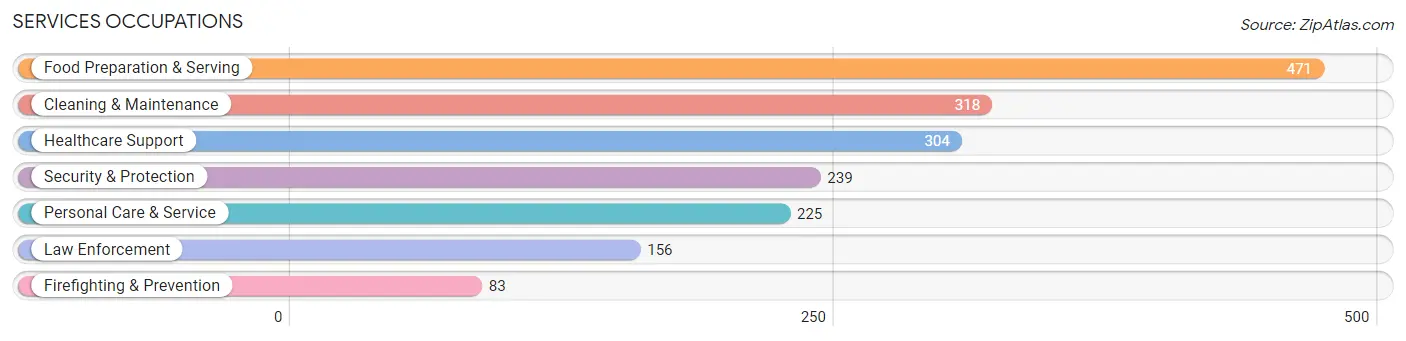
Services Occupations
The most common Services occupations in Center Point are Food Preparation & Serving (471 | 7.0%), Cleaning & Maintenance (318 | 4.7%), Healthcare Support (304 | 4.5%), Security & Protection (239 | 3.5%), and Personal Care & Service (225 | 3.3%).
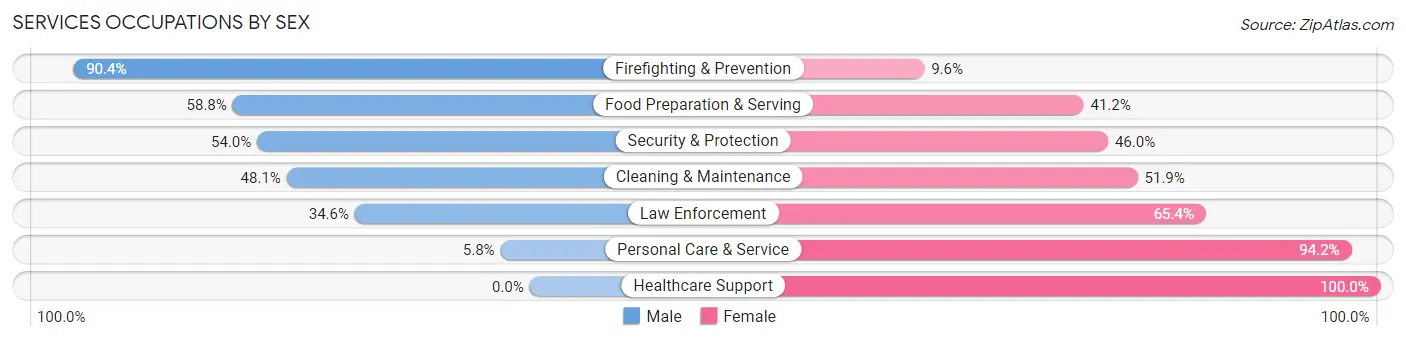
Services Occupations by Sex
Within the Services occupations in Center Point, the most male-oriented occupations are Firefighting & Prevention (90.4%), Food Preparation & Serving (58.8%), and Security & Protection (54.0%), while the most female-oriented occupations are Healthcare Support (100.0%), Personal Care & Service (94.2%), and Law Enforcement (65.4%).
| Occupation | Male | Female |
| Healthcare Support | 0 (0.0%) | 304 (100.0%) |
| Security & Protection | 129 (54.0%) | 110 (46.0%) |
| Firefighting & Prevention | 75 (90.4%) | 8 (9.6%) |
| Law Enforcement | 54 (34.6%) | 102 (65.4%) |
| Food Preparation & Serving | 277 (58.8%) | 194 (41.2%) |
| Cleaning & Maintenance | 153 (48.1%) | 165 (51.9%) |
| Personal Care & Service | 13 (5.8%) | 212 (94.2%) |
| Total (Category) | 572 (36.7%) | 985 (63.3%) |
| Total (Overall) | 3,303 (48.9%) | 3,454 (51.1%) |
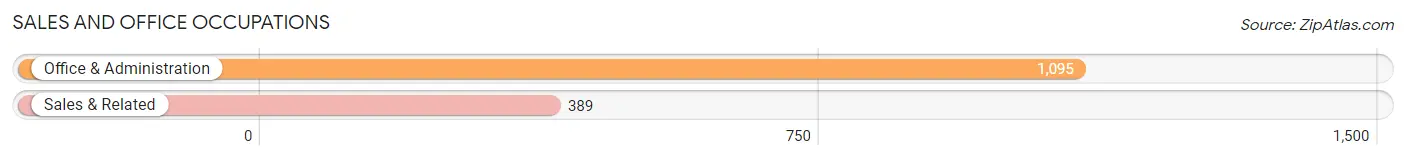
Sales and Office Occupations
The most common Sales and Office occupations in Center Point are Office & Administration (1,095 | 16.2%), and Sales & Related (389 | 5.8%).
Sales and Office Occupations by Sex
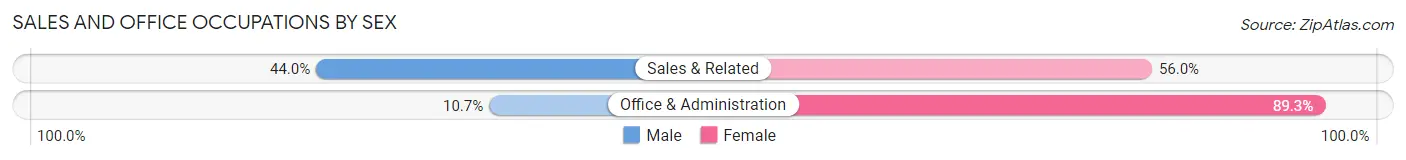
| Occupation | Male | Female |
| Sales & Related | 171 (44.0%) | 218 (56.0%) |
| Office & Administration | 117 (10.7%) | 978 (89.3%) |
| Total (Category) | 288 (19.4%) | 1,196 (80.6%) |
| Total (Overall) | 3,303 (48.9%) | 3,454 (51.1%) |
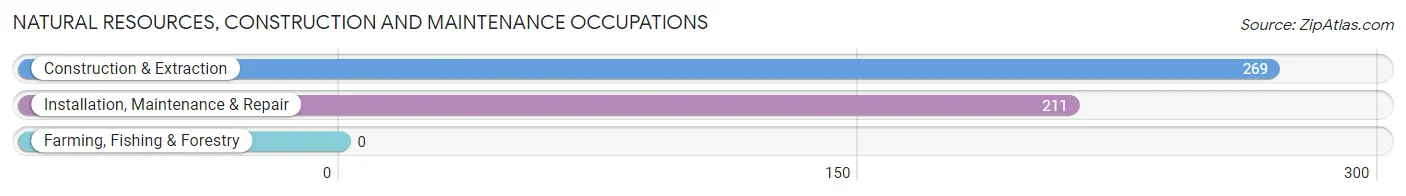
Natural Resources, Construction and Maintenance Occupations
The most common Natural Resources, Construction and Maintenance occupations in Center Point are Construction & Extraction (269 | 4.0%), and Installation, Maintenance & Repair (211 | 3.1%).
Natural Resources, Construction and Maintenance Occupations by Sex
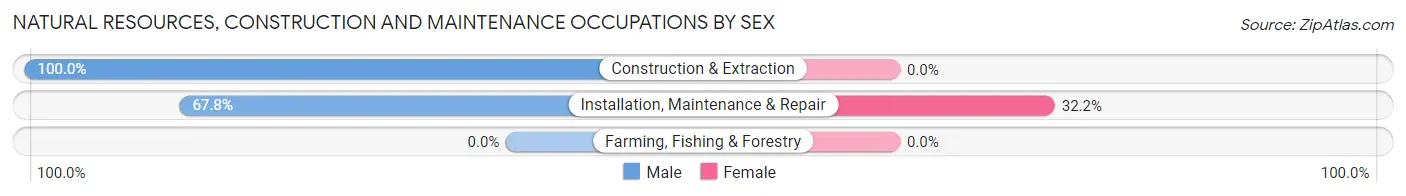
| Occupation | Male | Female |
| Farming, Fishing & Forestry | 0 (0.0%) | 0 (0.0%) |
| Construction & Extraction | 269 (100.0%) | 0 (0.0%) |
| Installation, Maintenance & Repair | 143 (67.8%) | 68 (32.2%) |
| Total (Category) | 412 (85.8%) | 68 (14.2%) |
| Total (Overall) | 3,303 (48.9%) | 3,454 (51.1%) |
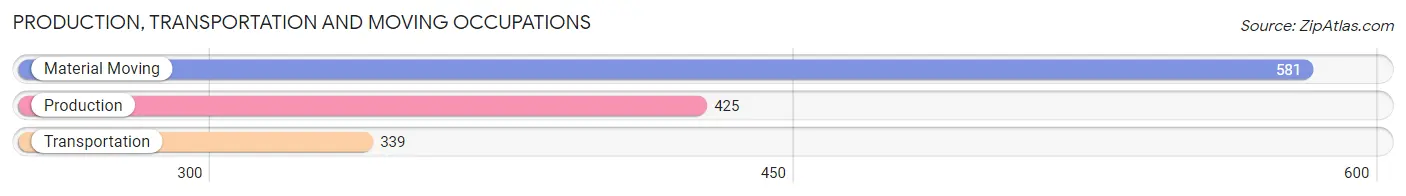
Production, Transportation and Moving Occupations
The most common Production, Transportation and Moving occupations in Center Point are Material Moving (581 | 8.6%), Production (425 | 6.3%), and Transportation (339 | 5.0%).
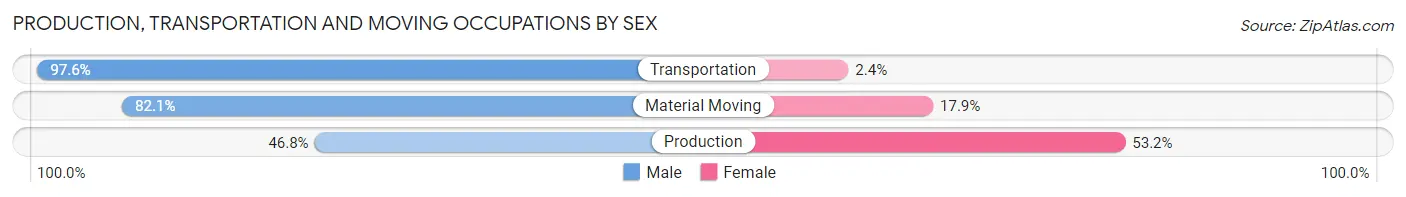
Production, Transportation and Moving Occupations by Sex
| Occupation | Male | Female |
| Production | 199 (46.8%) | 226 (53.2%) |
| Transportation | 331 (97.6%) | 8 (2.4%) |
| Material Moving | 477 (82.1%) | 104 (17.9%) |
| Total (Category) | 1,007 (74.9%) | 338 (25.1%) |
| Total (Overall) | 3,303 (48.9%) | 3,454 (51.1%) |
Employment Industries by Sex in Center Point
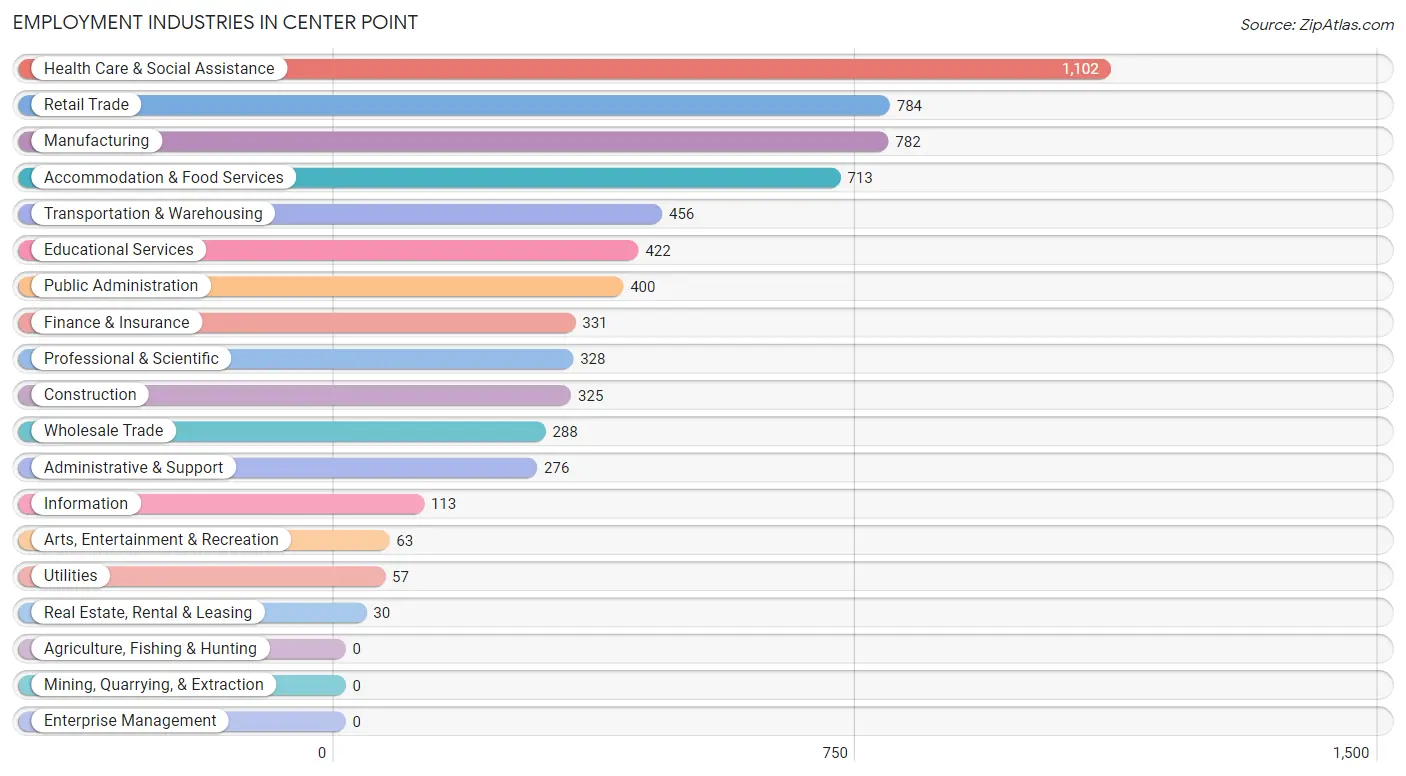
Employment Industries in Center Point
The major employment industries in Center Point include Health Care & Social Assistance (1,102 | 16.3%), Retail Trade (784 | 11.6%), Manufacturing (782 | 11.6%), Accommodation & Food Services (713 | 10.5%), and Transportation & Warehousing (456 | 6.8%).
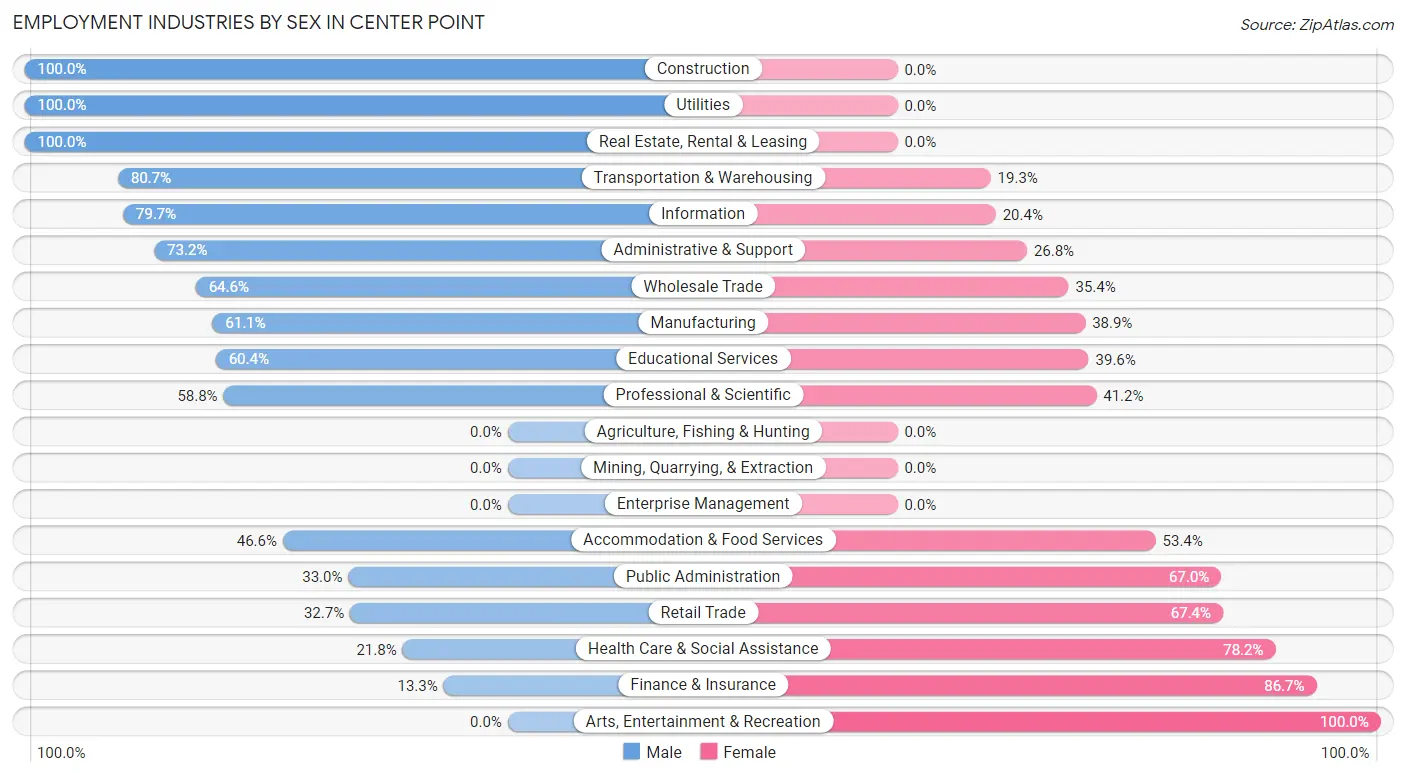
Employment Industries by Sex in Center Point
The Center Point industries that see more men than women are Construction (100.0%), Utilities (100.0%), and Real Estate, Rental & Leasing (100.0%), whereas the industries that tend to have a higher number of women are Arts, Entertainment & Recreation (100.0%), Finance & Insurance (86.7%), and Health Care & Social Assistance (78.2%).
| Industry | Male | Female |
| Agriculture, Fishing & Hunting | 0 (0.0%) | 0 (0.0%) |
| Mining, Quarrying, & Extraction | 0 (0.0%) | 0 (0.0%) |
| Construction | 325 (100.0%) | 0 (0.0%) |
| Manufacturing | 478 (61.1%) | 304 (38.9%) |
| Wholesale Trade | 186 (64.6%) | 102 (35.4%) |
| Retail Trade | 256 (32.7%) | 528 (67.3%) |
| Transportation & Warehousing | 368 (80.7%) | 88 (19.3%) |
| Utilities | 57 (100.0%) | 0 (0.0%) |
| Information | 90 (79.6%) | 23 (20.3%) |
| Finance & Insurance | 44 (13.3%) | 287 (86.7%) |
| Real Estate, Rental & Leasing | 30 (100.0%) | 0 (0.0%) |
| Professional & Scientific | 193 (58.8%) | 135 (41.2%) |
| Enterprise Management | 0 (0.0%) | 0 (0.0%) |
| Administrative & Support | 202 (73.2%) | 74 (26.8%) |
| Educational Services | 255 (60.4%) | 167 (39.6%) |
| Health Care & Social Assistance | 240 (21.8%) | 862 (78.2%) |
| Arts, Entertainment & Recreation | 0 (0.0%) | 63 (100.0%) |
| Accommodation & Food Services | 332 (46.6%) | 381 (53.4%) |
| Public Administration | 132 (33.0%) | 268 (67.0%) |
| Total | 3,303 (48.9%) | 3,454 (51.1%) |
Education in Center Point
School Enrollment in Center Point
The most common levels of schooling among the 5,219 students in Center Point are high school (1,406 | 26.9%), elementary school (1,331 | 25.5%), and middle school (818 | 15.7%).
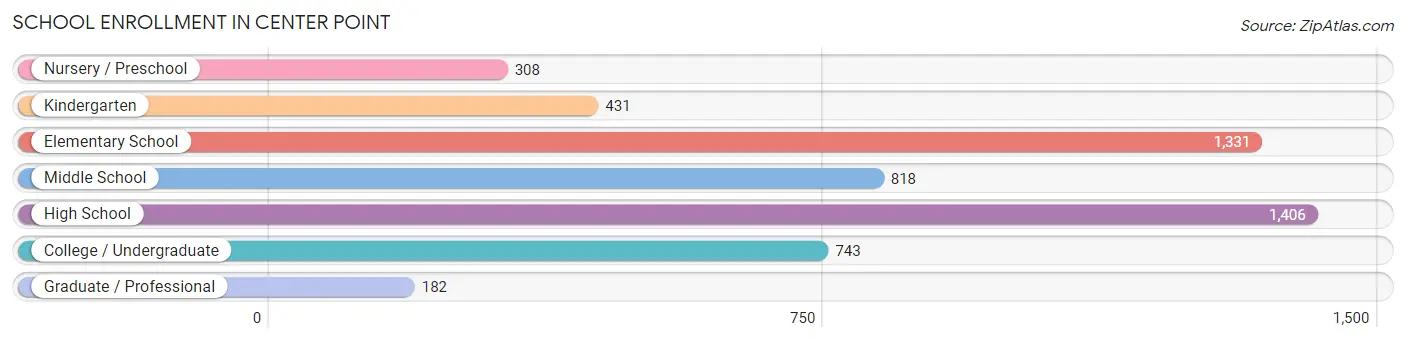
| School Level | # Students | % Students |
| Nursery / Preschool | 308 | 5.9% |
| Kindergarten | 431 | 8.3% |
| Elementary School | 1,331 | 25.5% |
| Middle School | 818 | 15.7% |
| High School | 1,406 | 26.9% |
| College / Undergraduate | 743 | 14.2% |
| Graduate / Professional | 182 | 3.5% |
| Total | 5,219 | 100.0% |
School Enrollment by Age by Funding Source in Center Point
Out of a total of 5,219 students who are enrolled in schools in Center Point, 793 (15.2%) attend a private institution, while the remaining 4,426 (84.8%) are enrolled in public schools. The age group of 3 to 4 year olds has the highest likelihood of being enrolled in private schools, with 90 (45.7% in the age bracket) enrolled. Conversely, the age group of 5 to 9 year old has the lowest likelihood of being enrolled in a private school, with 1,644 (96.9% in the age bracket) attending a public institution.
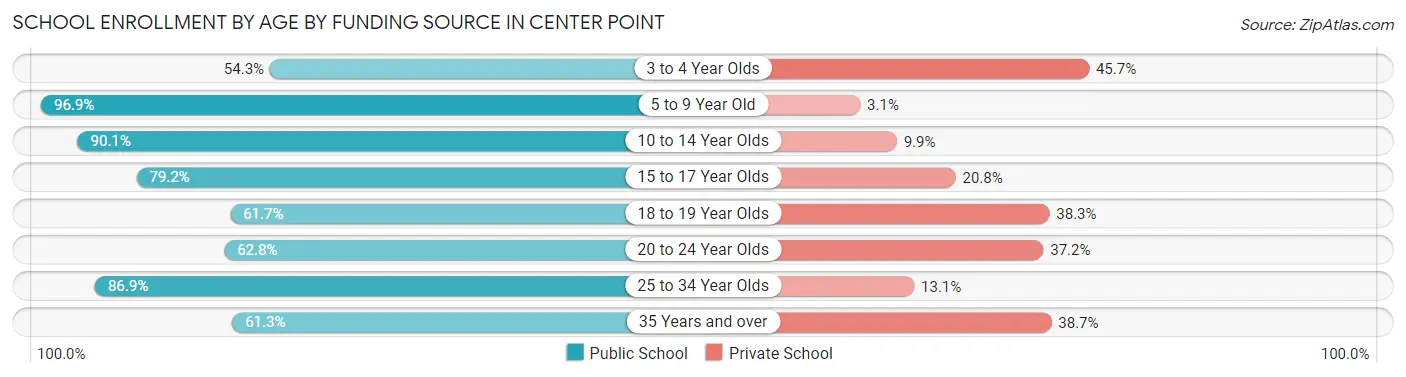
| Age Bracket | Public School | Private School |
| 3 to 4 Year Olds | 107 (54.3%) | 90 (45.7%) |
| 5 to 9 Year Old | 1,644 (96.9%) | 52 (3.1%) |
| 10 to 14 Year Olds | 1,213 (90.1%) | 133 (9.9%) |
| 15 to 17 Year Olds | 657 (79.2%) | 173 (20.8%) |
| 18 to 19 Year Olds | 153 (61.7%) | 95 (38.3%) |
| 20 to 24 Year Olds | 147 (62.8%) | 87 (37.2%) |
| 25 to 34 Year Olds | 331 (86.9%) | 50 (13.1%) |
| 35 Years and over | 176 (61.3%) | 111 (38.7%) |
| Total | 4,426 (84.8%) | 793 (15.2%) |
Educational Attainment by Field of Study in Center Point
Education (527 | 28.5%), business (354 | 19.1%), science & technology (202 | 10.9%), arts & humanities (176 | 9.5%), and computers & mathematics (90 | 4.9%) are the most common fields of study among 1,852 individuals in Center Point who have obtained a bachelor's degree or higher.
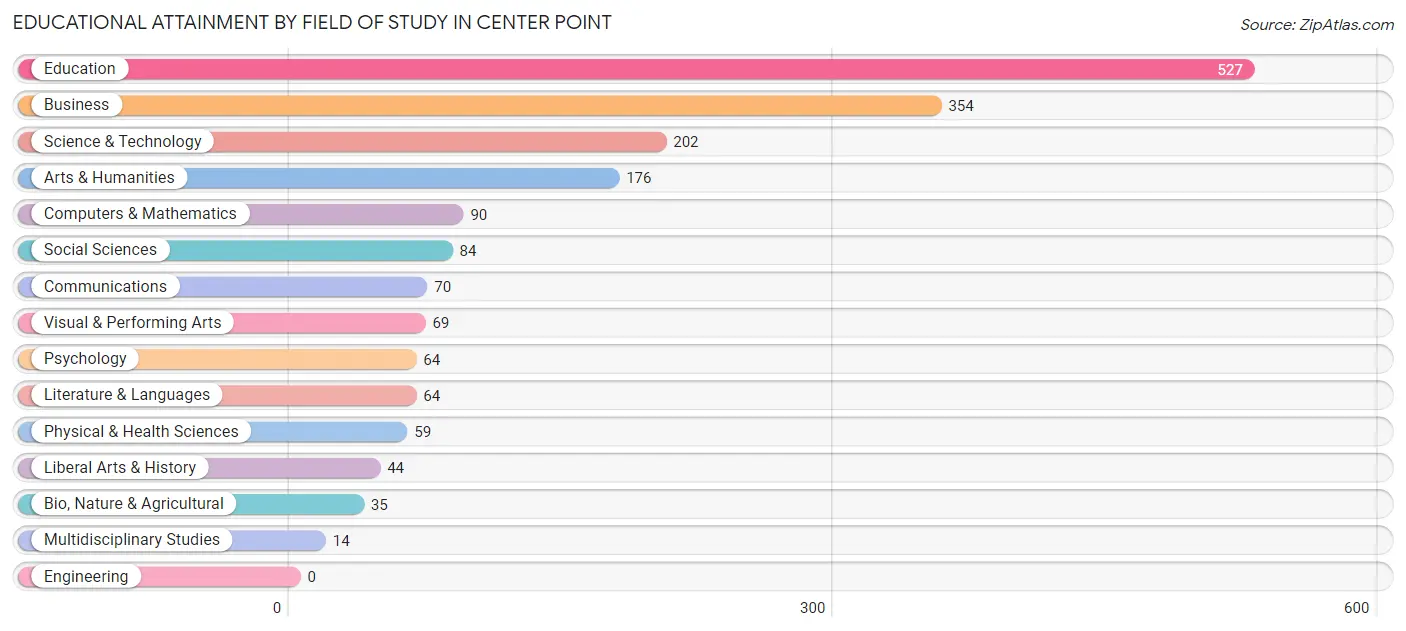
| Field of Study | # Graduates | % Graduates |
| Computers & Mathematics | 90 | 4.9% |
| Bio, Nature & Agricultural | 35 | 1.9% |
| Physical & Health Sciences | 59 | 3.2% |
| Psychology | 64 | 3.5% |
| Social Sciences | 84 | 4.5% |
| Engineering | 0 | 0.0% |
| Multidisciplinary Studies | 14 | 0.8% |
| Science & Technology | 202 | 10.9% |
| Business | 354 | 19.1% |
| Education | 527 | 28.5% |
| Literature & Languages | 64 | 3.5% |
| Liberal Arts & History | 44 | 2.4% |
| Visual & Performing Arts | 69 | 3.7% |
| Communications | 70 | 3.8% |
| Arts & Humanities | 176 | 9.5% |
| Total | 1,852 | 100.0% |
Transportation & Commute in Center Point
Vehicle Availability by Sex in Center Point
The most prevalent vehicle ownership categories in Center Point are males with 2 vehicles (1,263, accounting for 38.4%) and females with 2 vehicles (1,105, making up 37.1%).
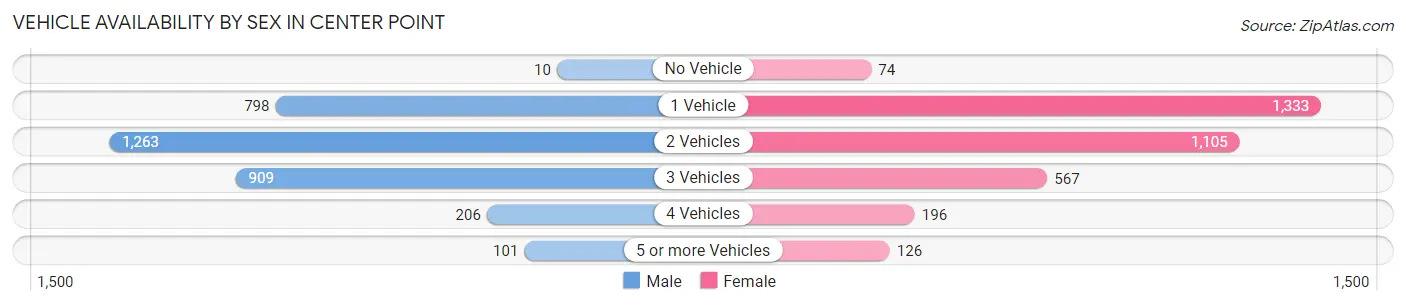
| Vehicles Available | Male | Female |
| No Vehicle | 10 (0.3%) | 74 (2.2%) |
| 1 Vehicle | 798 (24.3%) | 1,333 (39.2%) |
| 2 Vehicles | 1,263 (38.4%) | 1,105 (32.5%) |
| 3 Vehicles | 909 (27.7%) | 567 (16.7%) |
| 4 Vehicles | 206 (6.3%) | 196 (5.8%) |
| 5 or more Vehicles | 101 (3.1%) | 126 (3.7%) |
| Total | 3,287 (100.0%) | 3,401 (100.0%) |
Commute Time in Center Point
The most frequently occuring commute durations in Center Point are 30 to 34 minutes (1,609 commuters, 25.4%), 20 to 24 minutes (866 commuters, 13.7%), and 15 to 19 minutes (685 commuters, 10.8%).
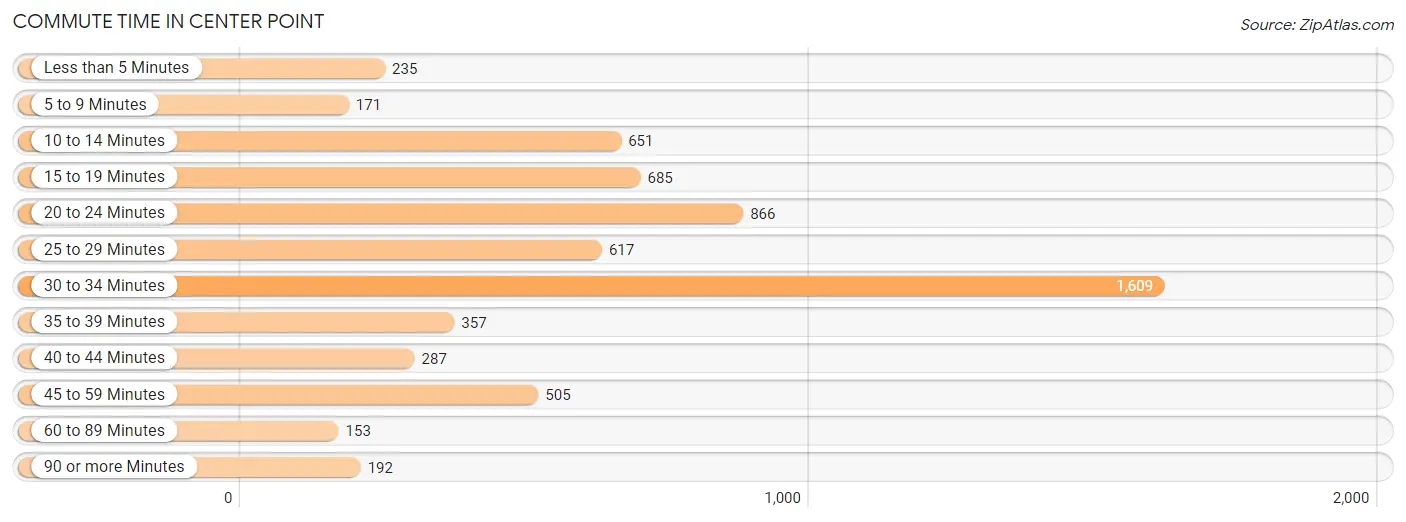
| Commute Time | # Commuters | % Commuters |
| Less than 5 Minutes | 235 | 3.7% |
| 5 to 9 Minutes | 171 | 2.7% |
| 10 to 14 Minutes | 651 | 10.3% |
| 15 to 19 Minutes | 685 | 10.8% |
| 20 to 24 Minutes | 866 | 13.7% |
| 25 to 29 Minutes | 617 | 9.8% |
| 30 to 34 Minutes | 1,609 | 25.4% |
| 35 to 39 Minutes | 357 | 5.6% |
| 40 to 44 Minutes | 287 | 4.5% |
| 45 to 59 Minutes | 505 | 8.0% |
| 60 to 89 Minutes | 153 | 2.4% |
| 90 or more Minutes | 192 | 3.0% |
Commute Time by Sex in Center Point
The most common commute times in Center Point are 30 to 34 minutes (982 commuters, 31.3%) for males and 30 to 34 minutes (627 commuters, 19.7%) for females.
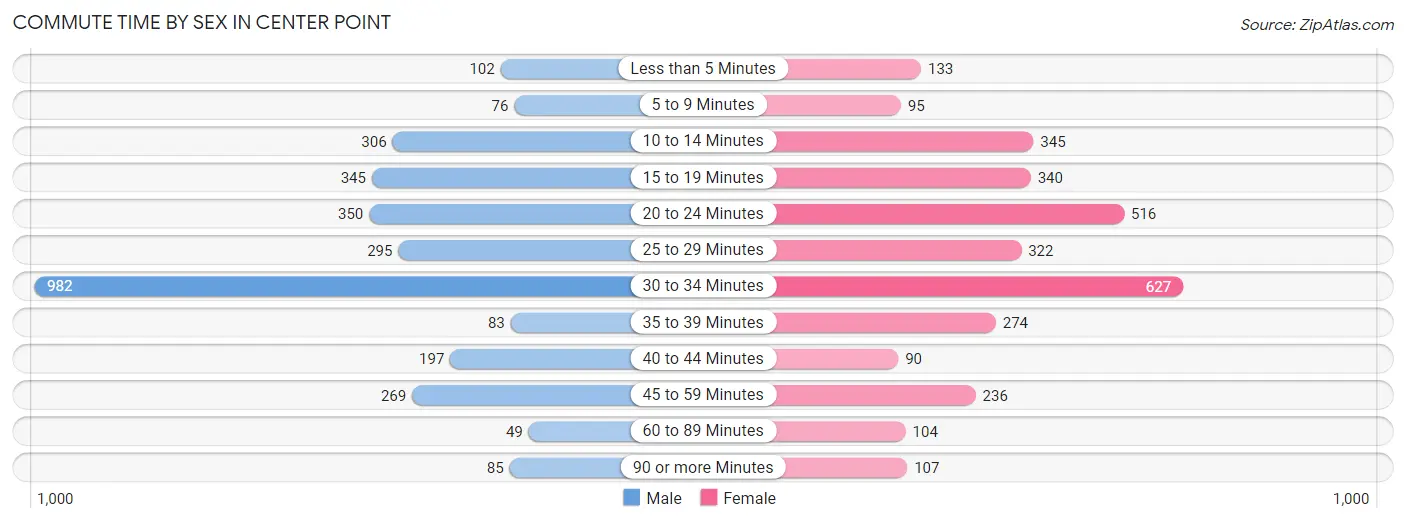
| Commute Time | Male | Female |
| Less than 5 Minutes | 102 (3.3%) | 133 (4.2%) |
| 5 to 9 Minutes | 76 (2.4%) | 95 (3.0%) |
| 10 to 14 Minutes | 306 (9.8%) | 345 (10.8%) |
| 15 to 19 Minutes | 345 (11.0%) | 340 (10.7%) |
| 20 to 24 Minutes | 350 (11.2%) | 516 (16.2%) |
| 25 to 29 Minutes | 295 (9.4%) | 322 (10.1%) |
| 30 to 34 Minutes | 982 (31.3%) | 627 (19.7%) |
| 35 to 39 Minutes | 83 (2.6%) | 274 (8.6%) |
| 40 to 44 Minutes | 197 (6.3%) | 90 (2.8%) |
| 45 to 59 Minutes | 269 (8.6%) | 236 (7.4%) |
| 60 to 89 Minutes | 49 (1.6%) | 104 (3.3%) |
| 90 or more Minutes | 85 (2.7%) | 107 (3.4%) |
Time of Departure to Work by Sex in Center Point
The most frequent times of departure to work in Center Point are 7:00 AM to 7:29 AM (418, 13.3%) for males and 7:00 AM to 7:29 AM (587, 18.4%) for females.
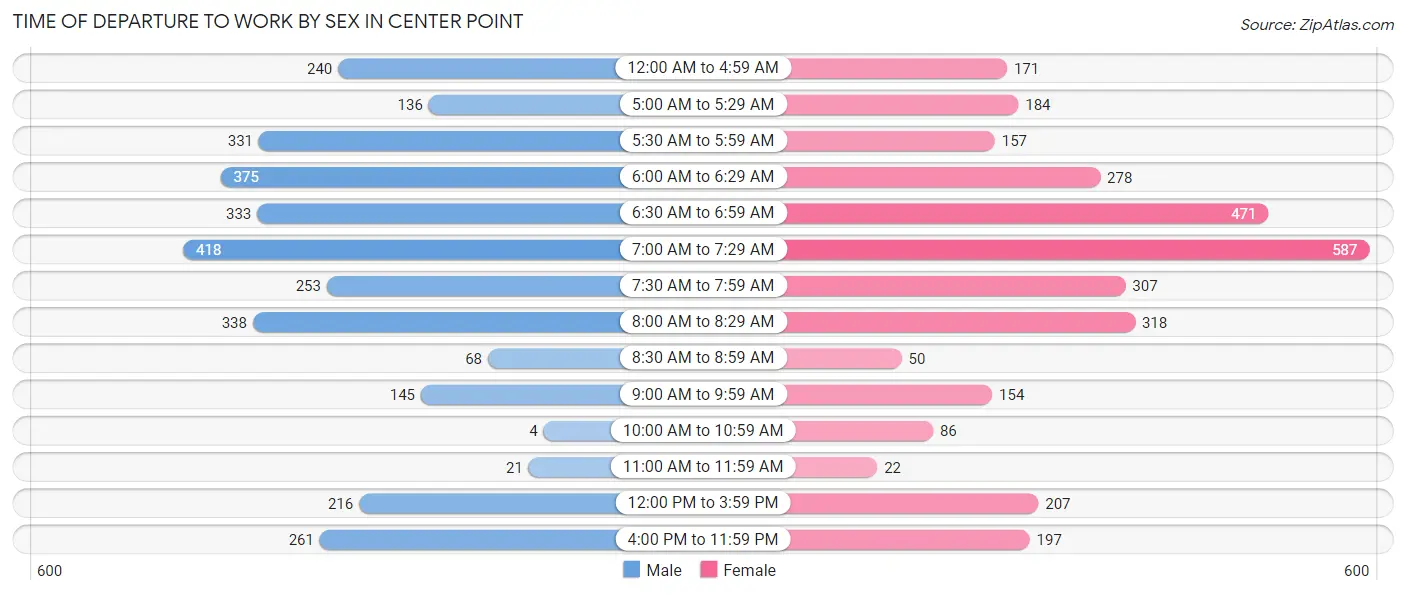
| Time of Departure | Male | Female |
| 12:00 AM to 4:59 AM | 240 (7.6%) | 171 (5.4%) |
| 5:00 AM to 5:29 AM | 136 (4.3%) | 184 (5.8%) |
| 5:30 AM to 5:59 AM | 331 (10.5%) | 157 (4.9%) |
| 6:00 AM to 6:29 AM | 375 (11.9%) | 278 (8.7%) |
| 6:30 AM to 6:59 AM | 333 (10.6%) | 471 (14.8%) |
| 7:00 AM to 7:29 AM | 418 (13.3%) | 587 (18.4%) |
| 7:30 AM to 7:59 AM | 253 (8.1%) | 307 (9.6%) |
| 8:00 AM to 8:29 AM | 338 (10.8%) | 318 (10.0%) |
| 8:30 AM to 8:59 AM | 68 (2.2%) | 50 (1.6%) |
| 9:00 AM to 9:59 AM | 145 (4.6%) | 154 (4.8%) |
| 10:00 AM to 10:59 AM | 4 (0.1%) | 86 (2.7%) |
| 11:00 AM to 11:59 AM | 21 (0.7%) | 22 (0.7%) |
| 12:00 PM to 3:59 PM | 216 (6.9%) | 207 (6.5%) |
| 4:00 PM to 11:59 PM | 261 (8.3%) | 197 (6.2%) |
| Total | 3,139 (100.0%) | 3,189 (100.0%) |
Housing Occupancy in Center Point
Occupancy by Ownership in Center Point
Of the total 5,643 dwellings in Center Point, owner-occupied units account for 3,331 (59.0%), while renter-occupied units make up 2,312 (41.0%).
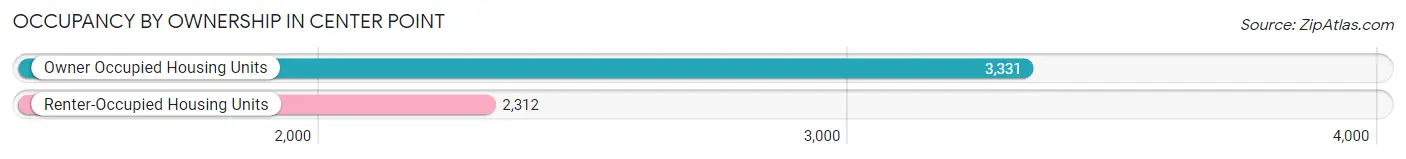
| Occupancy | # Housing Units | % Housing Units |
| Owner Occupied Housing Units | 3,331 | 59.0% |
| Renter-Occupied Housing Units | 2,312 | 41.0% |
| Total Occupied Housing Units | 5,643 | 100.0% |
Occupancy by Household Size in Center Point
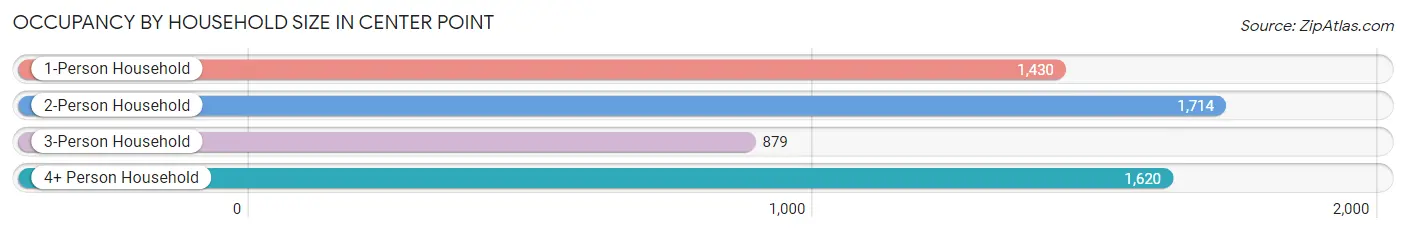
| Household Size | # Housing Units | % Housing Units |
| 1-Person Household | 1,430 | 25.3% |
| 2-Person Household | 1,714 | 30.4% |
| 3-Person Household | 879 | 15.6% |
| 4+ Person Household | 1,620 | 28.7% |
| Total Housing Units | 5,643 | 100.0% |
Occupancy by Ownership by Household Size in Center Point
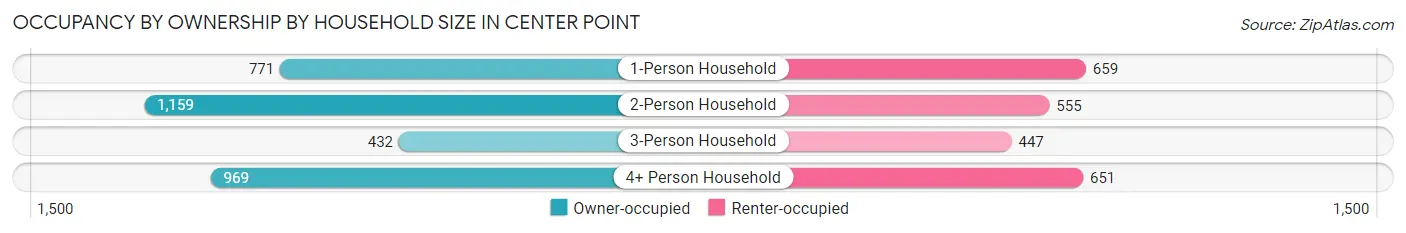
| Household Size | Owner-occupied | Renter-occupied |
| 1-Person Household | 771 (53.9%) | 659 (46.1%) |
| 2-Person Household | 1,159 (67.6%) | 555 (32.4%) |
| 3-Person Household | 432 (49.1%) | 447 (50.8%) |
| 4+ Person Household | 969 (59.8%) | 651 (40.2%) |
| Total Housing Units | 3,331 (59.0%) | 2,312 (41.0%) |
Occupancy by Educational Attainment in Center Point
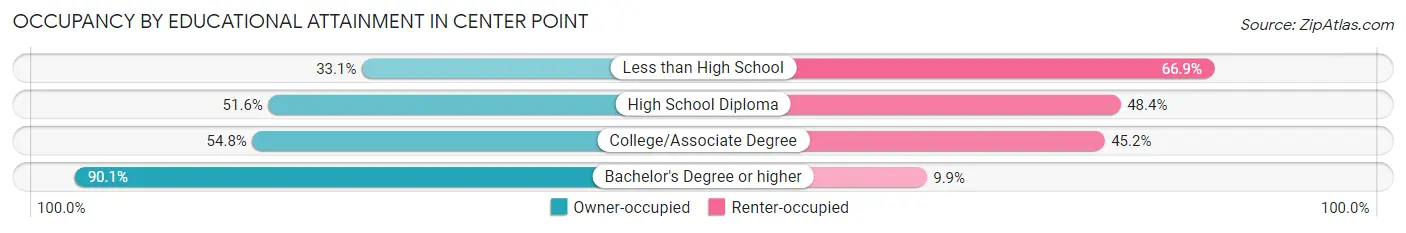
| Household Size | Owner-occupied | Renter-occupied |
| Less than High School | 122 (33.1%) | 247 (66.9%) |
| High School Diploma | 1,027 (51.6%) | 963 (48.4%) |
| College/Associate Degree | 1,204 (54.8%) | 994 (45.2%) |
| Bachelor's Degree or higher | 978 (90.1%) | 108 (9.9%) |
Occupancy by Age of Householder in Center Point
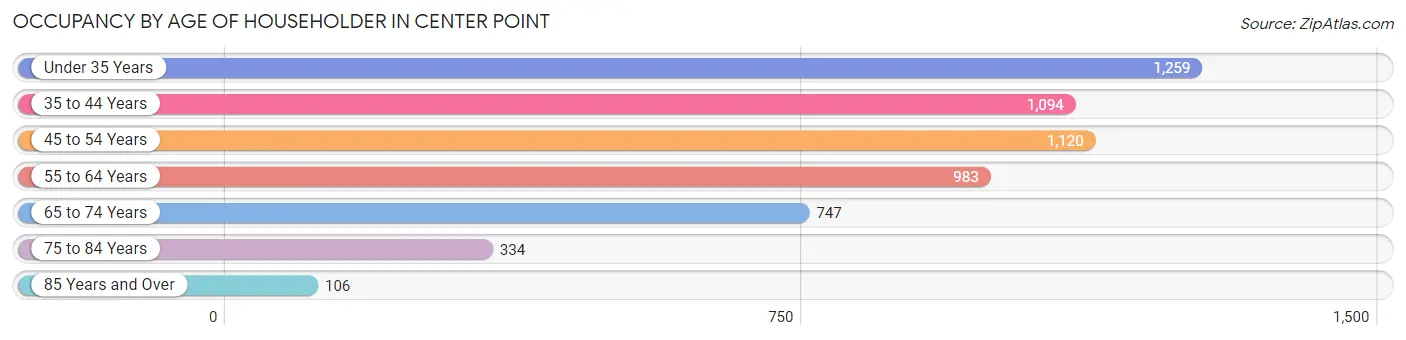
| Age Bracket | # Households | % Households |
| Under 35 Years | 1,259 | 22.3% |
| 35 to 44 Years | 1,094 | 19.4% |
| 45 to 54 Years | 1,120 | 19.9% |
| 55 to 64 Years | 983 | 17.4% |
| 65 to 74 Years | 747 | 13.2% |
| 75 to 84 Years | 334 | 5.9% |
| 85 Years and Over | 106 | 1.9% |
| Total | 5,643 | 100.0% |
Housing Finances in Center Point
Median Income by Occupancy in Center Point
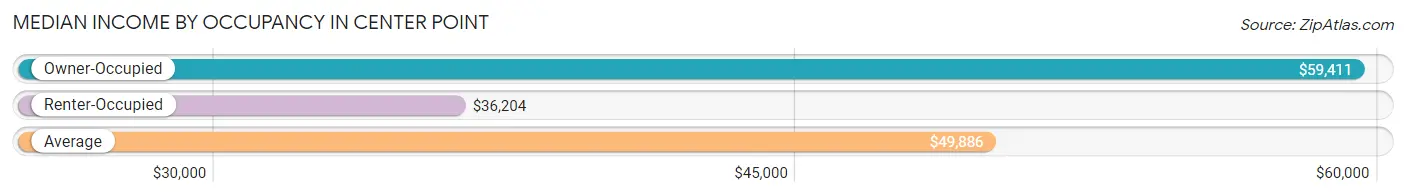
| Occupancy Type | # Households | Median Income |
| Owner-Occupied | 3,331 (59.0%) | $59,411 |
| Renter-Occupied | 2,312 (41.0%) | $36,204 |
| Average | 5,643 (100.0%) | $49,886 |
Occupancy by Householder Income Bracket in Center Point
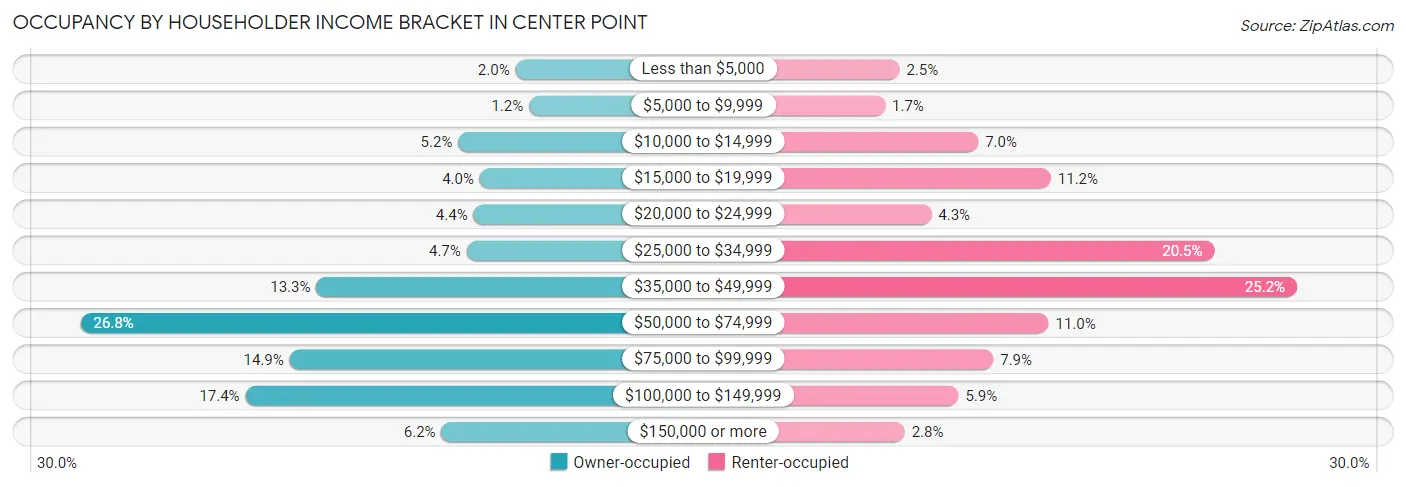
| Income Bracket | Owner-occupied | Renter-occupied |
| Less than $5,000 | 65 (1.9%) | 58 (2.5%) |
| $5,000 to $9,999 | 39 (1.2%) | 39 (1.7%) |
| $10,000 to $14,999 | 174 (5.2%) | 162 (7.0%) |
| $15,000 to $19,999 | 133 (4.0%) | 258 (11.2%) |
| $20,000 to $24,999 | 145 (4.3%) | 100 (4.3%) |
| $25,000 to $34,999 | 158 (4.7%) | 474 (20.5%) |
| $35,000 to $49,999 | 444 (13.3%) | 583 (25.2%) |
| $50,000 to $74,999 | 893 (26.8%) | 255 (11.0%) |
| $75,000 to $99,999 | 495 (14.9%) | 182 (7.9%) |
| $100,000 to $149,999 | 579 (17.4%) | 136 (5.9%) |
| $150,000 or more | 206 (6.2%) | 65 (2.8%) |
| Total | 3,331 (100.0%) | 2,312 (100.0%) |
Monthly Housing Cost Tiers in Center Point
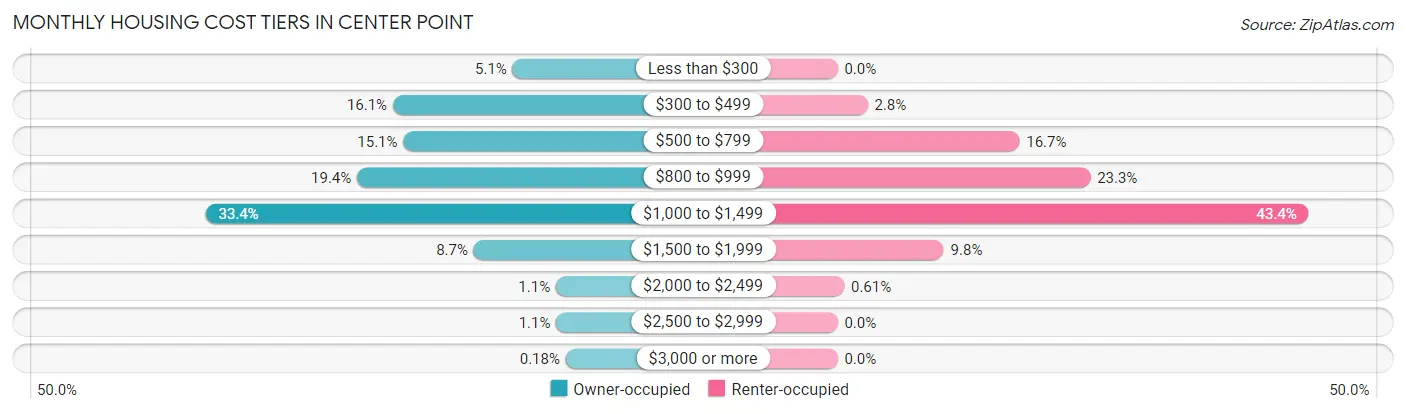
| Monthly Cost | Owner-occupied | Renter-occupied |
| Less than $300 | 169 (5.1%) | 0 (0.0%) |
| $300 to $499 | 536 (16.1%) | 64 (2.8%) |
| $500 to $799 | 504 (15.1%) | 387 (16.7%) |
| $800 to $999 | 646 (19.4%) | 538 (23.3%) |
| $1,000 to $1,499 | 1,111 (33.4%) | 1,003 (43.4%) |
| $1,500 to $1,999 | 288 (8.6%) | 226 (9.8%) |
| $2,000 to $2,499 | 36 (1.1%) | 14 (0.6%) |
| $2,500 to $2,999 | 35 (1.1%) | 0 (0.0%) |
| $3,000 or more | 6 (0.2%) | 0 (0.0%) |
| Total | 3,331 (100.0%) | 2,312 (100.0%) |
Physical Housing Characteristics in Center Point
Housing Structures in Center Point
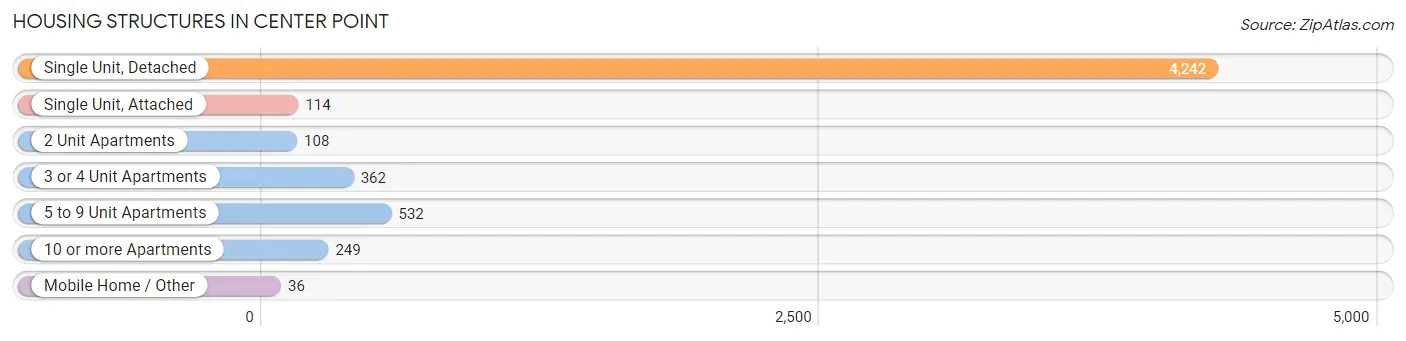
| Structure Type | # Housing Units | % Housing Units |
| Single Unit, Detached | 4,242 | 75.2% |
| Single Unit, Attached | 114 | 2.0% |
| 2 Unit Apartments | 108 | 1.9% |
| 3 or 4 Unit Apartments | 362 | 6.4% |
| 5 to 9 Unit Apartments | 532 | 9.4% |
| 10 or more Apartments | 249 | 4.4% |
| Mobile Home / Other | 36 | 0.6% |
| Total | 5,643 | 100.0% |
Housing Structures by Occupancy in Center Point
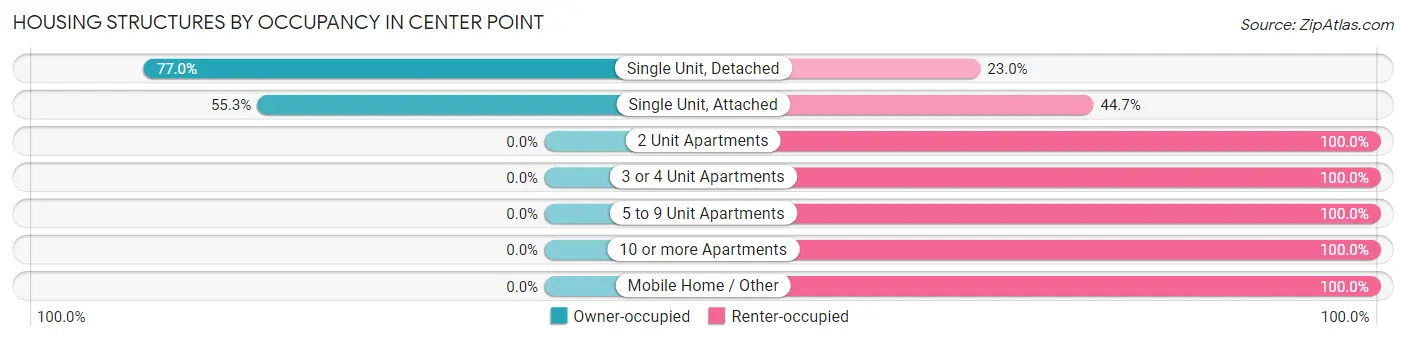
| Structure Type | Owner-occupied | Renter-occupied |
| Single Unit, Detached | 3,268 (77.0%) | 974 (23.0%) |
| Single Unit, Attached | 63 (55.3%) | 51 (44.7%) |
| 2 Unit Apartments | 0 (0.0%) | 108 (100.0%) |
| 3 or 4 Unit Apartments | 0 (0.0%) | 362 (100.0%) |
| 5 to 9 Unit Apartments | 0 (0.0%) | 532 (100.0%) |
| 10 or more Apartments | 0 (0.0%) | 249 (100.0%) |
| Mobile Home / Other | 0 (0.0%) | 36 (100.0%) |
| Total | 3,331 (59.0%) | 2,312 (41.0%) |
Housing Structures by Number of Rooms in Center Point
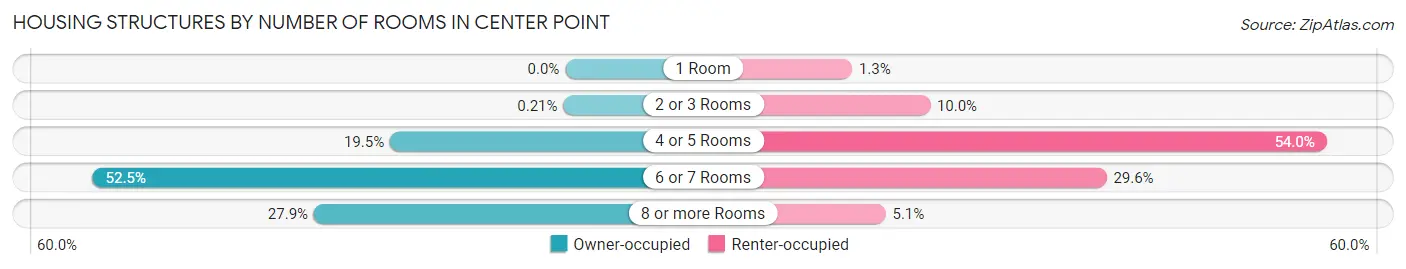
| Number of Rooms | Owner-occupied | Renter-occupied |
| 1 Room | 0 (0.0%) | 31 (1.3%) |
| 2 or 3 Rooms | 7 (0.2%) | 231 (10.0%) |
| 4 or 5 Rooms | 648 (19.5%) | 1,249 (54.0%) |
| 6 or 7 Rooms | 1,747 (52.4%) | 684 (29.6%) |
| 8 or more Rooms | 929 (27.9%) | 117 (5.1%) |
| Total | 3,331 (100.0%) | 2,312 (100.0%) |
Housing Structure by Heating Type in Center Point
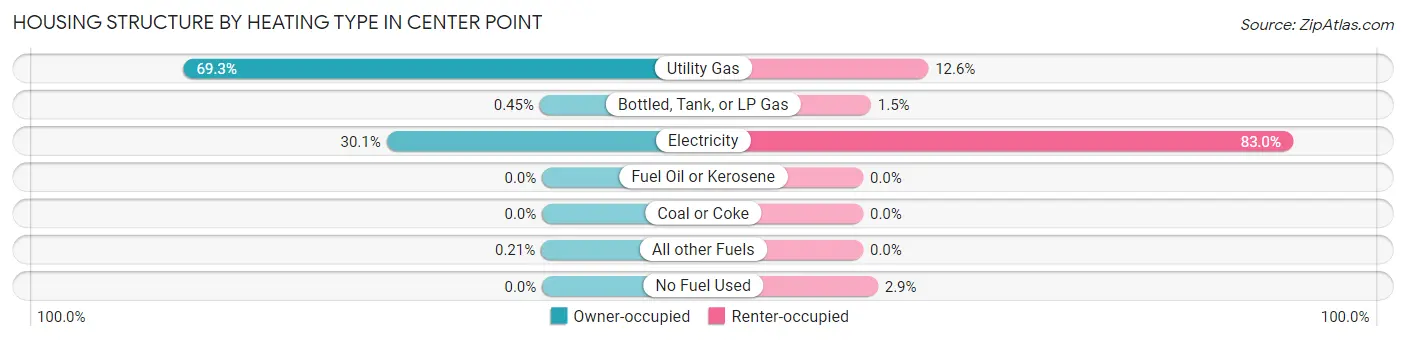
| Heating Type | Owner-occupied | Renter-occupied |
| Utility Gas | 2,308 (69.3%) | 291 (12.6%) |
| Bottled, Tank, or LP Gas | 15 (0.4%) | 35 (1.5%) |
| Electricity | 1,001 (30.0%) | 1,920 (83.0%) |
| Fuel Oil or Kerosene | 0 (0.0%) | 0 (0.0%) |
| Coal or Coke | 0 (0.0%) | 0 (0.0%) |
| All other Fuels | 7 (0.2%) | 0 (0.0%) |
| No Fuel Used | 0 (0.0%) | 66 (2.9%) |
| Total | 3,331 (100.0%) | 2,312 (100.0%) |
Household Vehicle Usage in Center Point
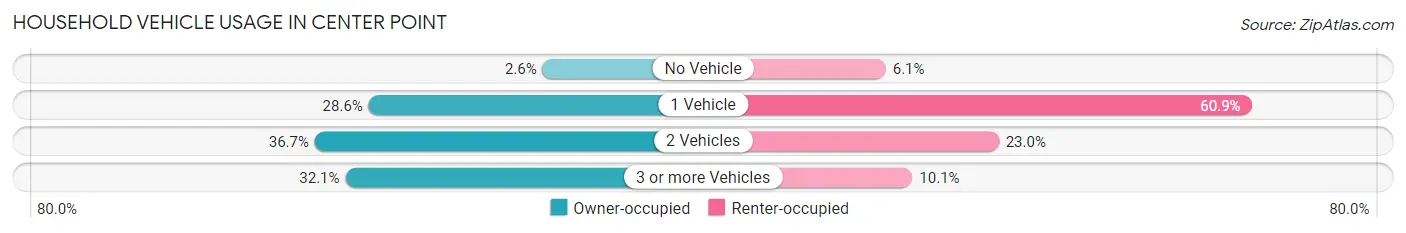
| Vehicles per Household | Owner-occupied | Renter-occupied |
| No Vehicle | 88 (2.6%) | 141 (6.1%) |
| 1 Vehicle | 953 (28.6%) | 1,407 (60.9%) |
| 2 Vehicles | 1,221 (36.7%) | 531 (23.0%) |
| 3 or more Vehicles | 1,069 (32.1%) | 233 (10.1%) |
| Total | 3,331 (100.0%) | 2,312 (100.0%) |
Real Estate & Mortgages in Center Point
Real Estate and Mortgage Overview in Center Point
| Characteristic | Without Mortgage | With Mortgage |
| Housing Units | 1,068 | 2,263 |
| Median Property Value | $122,500 | $117,600 |
| Median Household Income | $57,424 | $124 |
| Monthly Housing Costs | $410 | $6 |
| Real Estate Taxes | $729 | $300 |
Property Value by Mortgage Status in Center Point
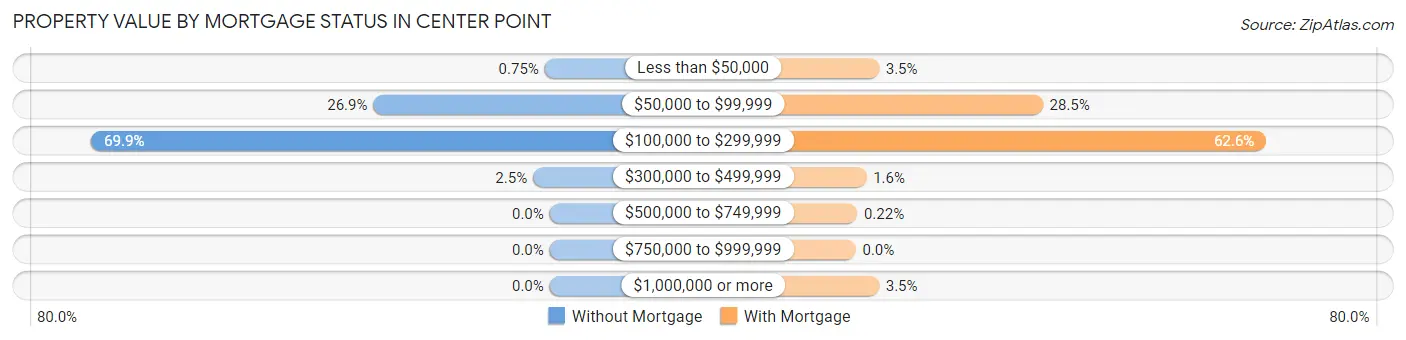
| Property Value | Without Mortgage | With Mortgage |
| Less than $50,000 | 8 (0.7%) | 80 (3.5%) |
| $50,000 to $99,999 | 287 (26.9%) | 645 (28.5%) |
| $100,000 to $299,999 | 746 (69.9%) | 1,416 (62.6%) |
| $300,000 to $499,999 | 27 (2.5%) | 37 (1.6%) |
| $500,000 to $749,999 | 0 (0.0%) | 5 (0.2%) |
| $750,000 to $999,999 | 0 (0.0%) | 0 (0.0%) |
| $1,000,000 or more | 0 (0.0%) | 80 (3.5%) |
| Total | 1,068 (100.0%) | 2,263 (100.0%) |
Household Income by Mortgage Status in Center Point
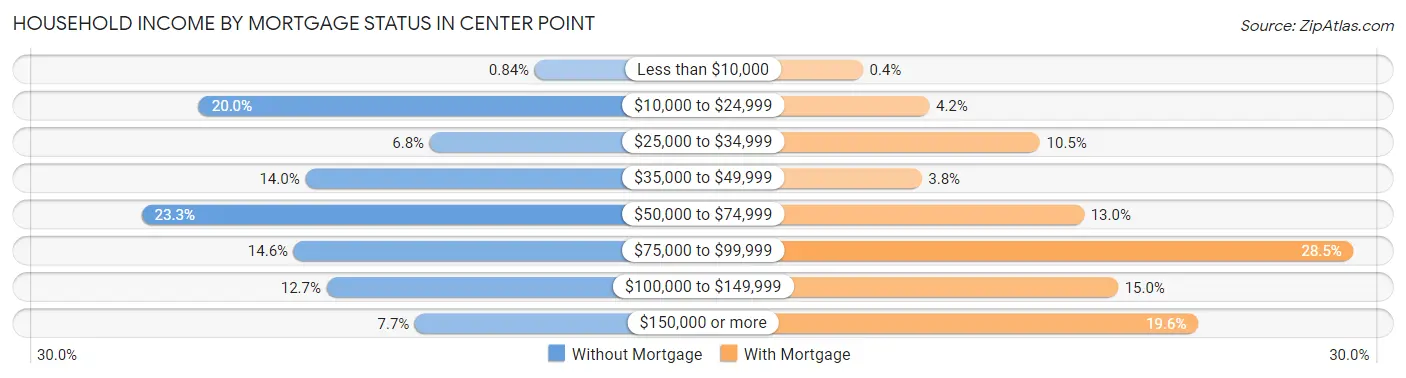
| Household Income | Without Mortgage | With Mortgage |
| Less than $10,000 | 9 (0.8%) | 9 (0.4%) |
| $10,000 to $24,999 | 214 (20.0%) | 95 (4.2%) |
| $25,000 to $34,999 | 73 (6.8%) | 238 (10.5%) |
| $35,000 to $49,999 | 149 (14.0%) | 85 (3.8%) |
| $50,000 to $74,999 | 249 (23.3%) | 295 (13.0%) |
| $75,000 to $99,999 | 156 (14.6%) | 644 (28.5%) |
| $100,000 to $149,999 | 136 (12.7%) | 339 (15.0%) |
| $150,000 or more | 82 (7.7%) | 443 (19.6%) |
| Total | 1,068 (100.0%) | 2,263 (100.0%) |
Property Value to Household Income Ratio in Center Point
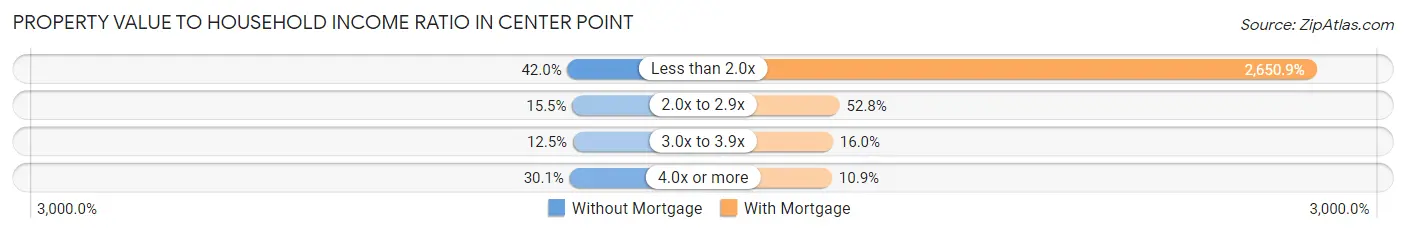
| Value-to-Income Ratio | Without Mortgage | With Mortgage |
| Less than 2.0x | 449 (42.0%) | 59,990 (2,650.9%) |
| 2.0x to 2.9x | 165 (15.4%) | 1,195 (52.8%) |
| 3.0x to 3.9x | 133 (12.4%) | 362 (16.0%) |
| 4.0x or more | 321 (30.1%) | 247 (10.9%) |
| Total | 1,068 (100.0%) | 2,263 (100.0%) |
Real Estate Taxes by Mortgage Status in Center Point
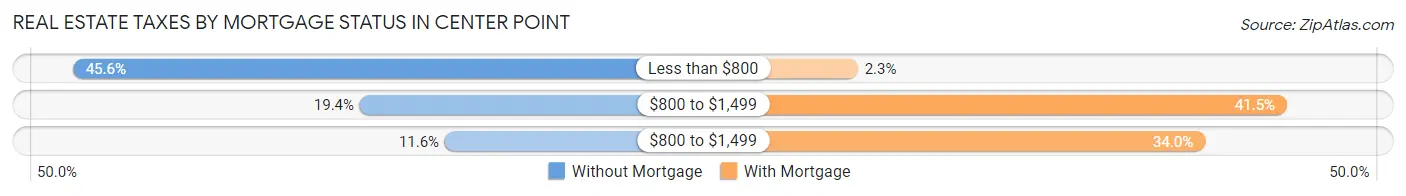
| Property Taxes | Without Mortgage | With Mortgage |
| Less than $800 | 487 (45.6%) | 51 (2.2%) |
| $800 to $1,499 | 207 (19.4%) | 938 (41.4%) |
| $800 to $1,499 | 124 (11.6%) | 769 (34.0%) |
| Total | 1,068 (100.0%) | 2,263 (100.0%) |
Health & Disability in Center Point
Health Insurance Coverage by Age in Center Point
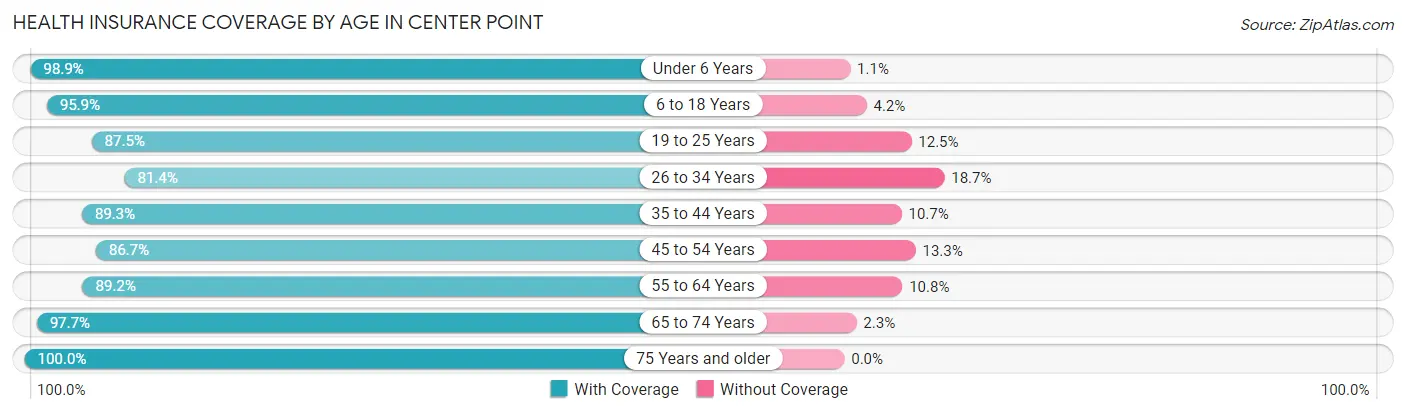
| Age Bracket | With Coverage | Without Coverage |
| Under 6 Years | 1,267 (98.9%) | 14 (1.1%) |
| 6 to 18 Years | 3,645 (95.9%) | 158 (4.2%) |
| 19 to 25 Years | 958 (87.5%) | 137 (12.5%) |
| 26 to 34 Years | 1,758 (81.4%) | 403 (18.6%) |
| 35 to 44 Years | 2,001 (89.3%) | 239 (10.7%) |
| 45 to 54 Years | 1,652 (86.7%) | 253 (13.3%) |
| 55 to 64 Years | 1,701 (89.2%) | 206 (10.8%) |
| 65 to 74 Years | 1,038 (97.7%) | 24 (2.3%) |
| 75 Years and older | 667 (100.0%) | 0 (0.0%) |
| Total | 14,687 (91.1%) | 1,434 (8.9%) |
Health Insurance Coverage by Citizenship Status in Center Point
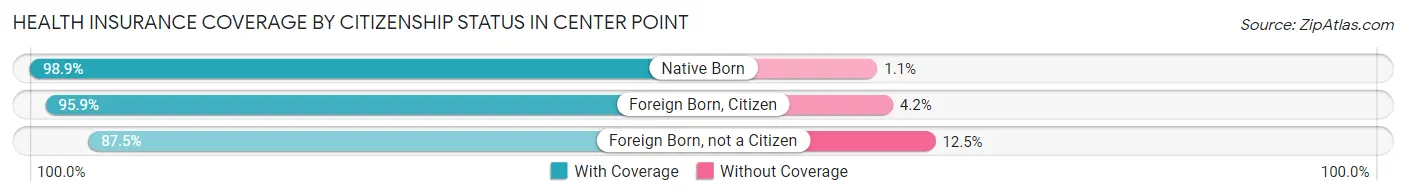
| Citizenship Status | With Coverage | Without Coverage |
| Native Born | 1,267 (98.9%) | 14 (1.1%) |
| Foreign Born, Citizen | 3,645 (95.9%) | 158 (4.2%) |
| Foreign Born, not a Citizen | 958 (87.5%) | 137 (12.5%) |
Health Insurance Coverage by Household Income in Center Point
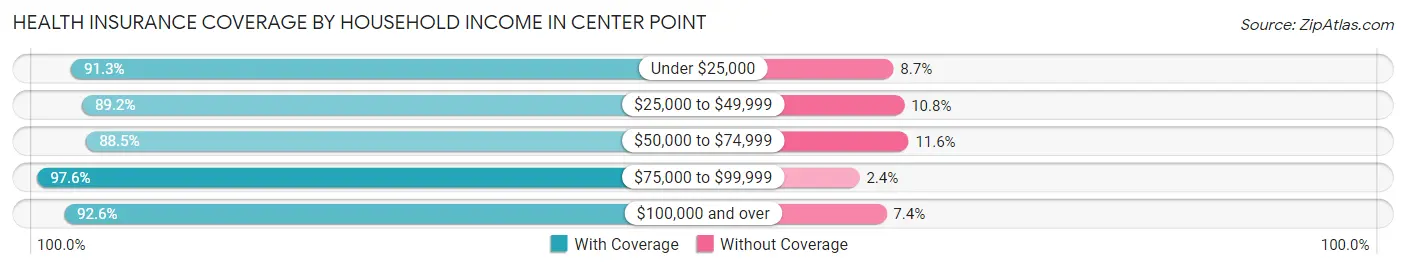
| Household Income | With Coverage | Without Coverage |
| Under $25,000 | 2,280 (91.3%) | 218 (8.7%) |
| $25,000 to $49,999 | 4,411 (89.2%) | 532 (10.8%) |
| $50,000 to $74,999 | 2,942 (88.4%) | 384 (11.6%) |
| $75,000 to $99,999 | 1,898 (97.6%) | 46 (2.4%) |
| $100,000 and over | 3,132 (92.6%) | 251 (7.4%) |
Public vs Private Health Insurance Coverage by Age in Center Point
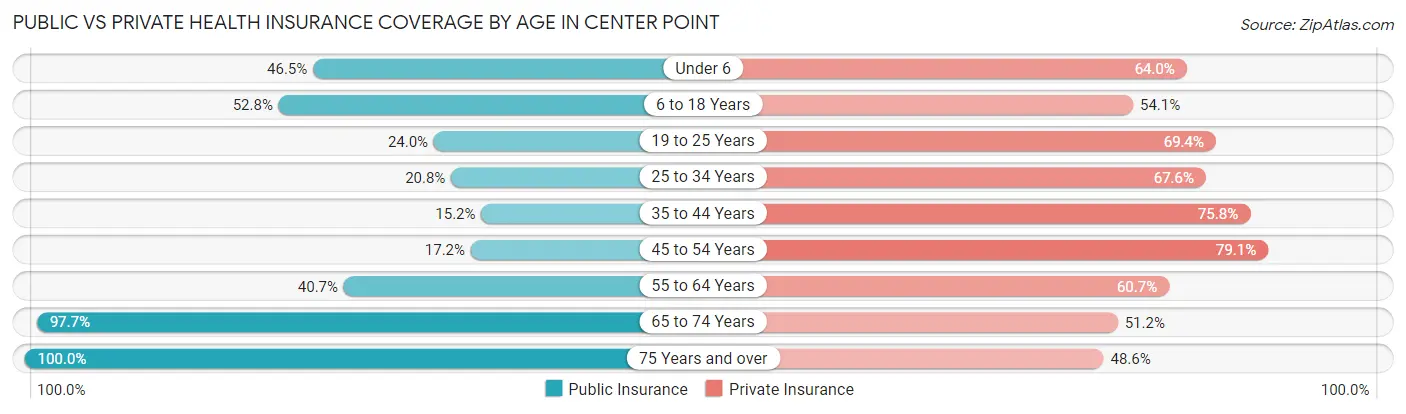
| Age Bracket | Public Insurance | Private Insurance |
| Under 6 | 595 (46.5%) | 820 (64.0%) |
| 6 to 18 Years | 2,009 (52.8%) | 2,056 (54.1%) |
| 19 to 25 Years | 263 (24.0%) | 760 (69.4%) |
| 25 to 34 Years | 450 (20.8%) | 1,460 (67.6%) |
| 35 to 44 Years | 341 (15.2%) | 1,697 (75.8%) |
| 45 to 54 Years | 327 (17.2%) | 1,507 (79.1%) |
| 55 to 64 Years | 777 (40.7%) | 1,158 (60.7%) |
| 65 to 74 Years | 1,038 (97.7%) | 544 (51.2%) |
| 75 Years and over | 667 (100.0%) | 324 (48.6%) |
| Total | 6,467 (40.1%) | 10,326 (64.0%) |
Disability Status by Sex by Age in Center Point
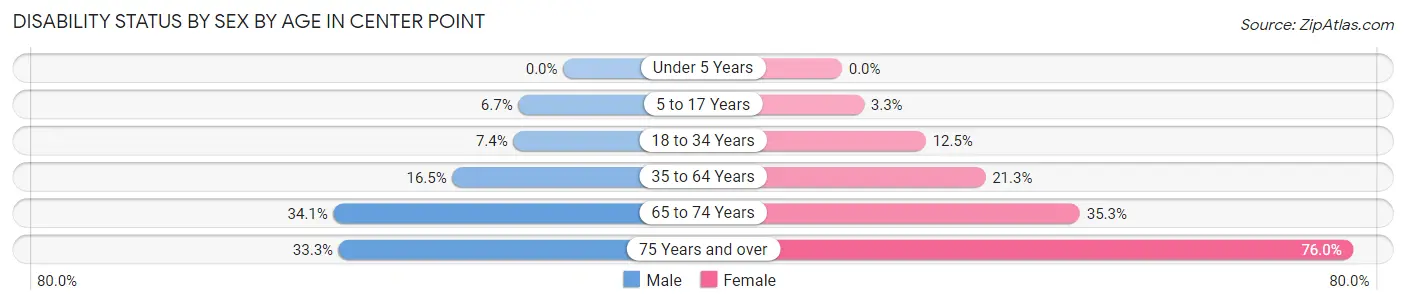
| Age Bracket | Male | Female |
| Under 5 Years | 0 (0.0%) | 0 (0.0%) |
| 5 to 17 Years | 140 (6.7%) | 62 (3.3%) |
| 18 to 34 Years | 119 (7.4%) | 231 (12.5%) |
| 35 to 64 Years | 489 (16.5%) | 656 (21.3%) |
| 65 to 74 Years | 147 (34.1%) | 223 (35.3%) |
| 75 Years and over | 103 (33.3%) | 272 (76.0%) |
Disability Class by Sex by Age in Center Point
Disability Class: Hearing Difficulty
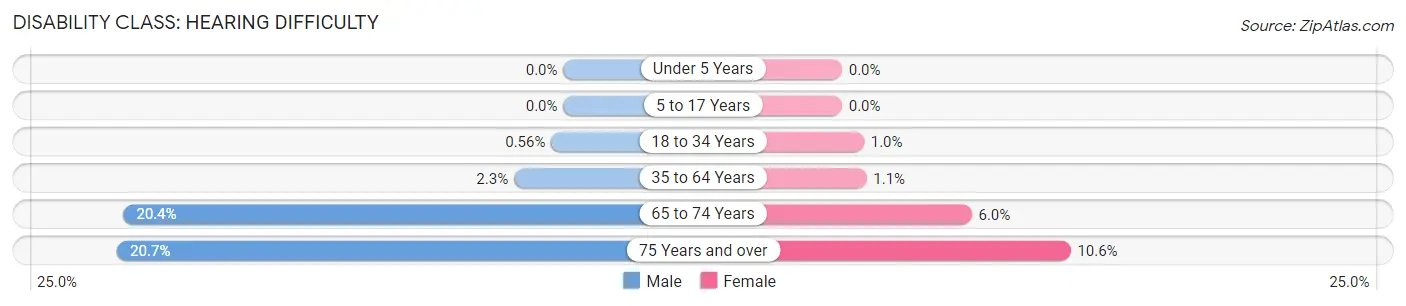
| Age Bracket | Male | Female |
| Under 5 Years | 0 (0.0%) | 0 (0.0%) |
| 5 to 17 Years | 0 (0.0%) | 0 (0.0%) |
| 18 to 34 Years | 9 (0.6%) | 19 (1.0%) |
| 35 to 64 Years | 68 (2.3%) | 35 (1.1%) |
| 65 to 74 Years | 88 (20.4%) | 38 (6.0%) |
| 75 Years and over | 64 (20.7%) | 38 (10.6%) |
Disability Class: Vision Difficulty
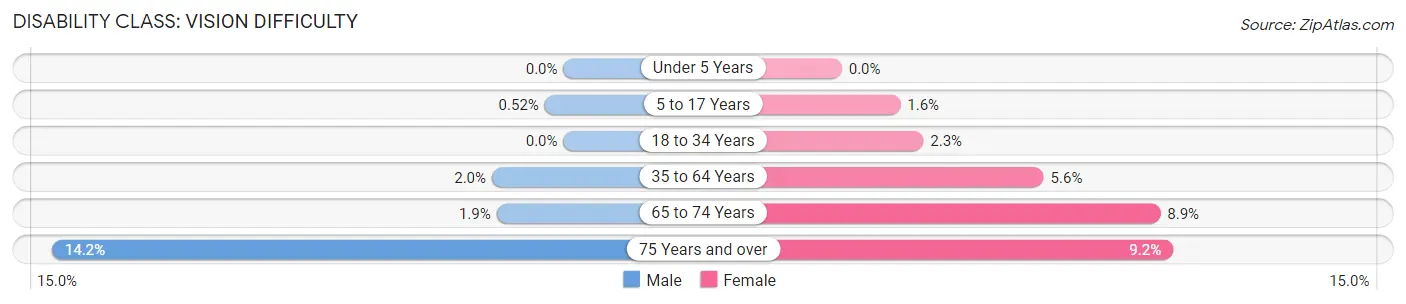
| Age Bracket | Male | Female |
| Under 5 Years | 0 (0.0%) | 0 (0.0%) |
| 5 to 17 Years | 11 (0.5%) | 31 (1.6%) |
| 18 to 34 Years | 0 (0.0%) | 42 (2.3%) |
| 35 to 64 Years | 59 (2.0%) | 173 (5.6%) |
| 65 to 74 Years | 8 (1.9%) | 56 (8.9%) |
| 75 Years and over | 44 (14.2%) | 33 (9.2%) |
Disability Class: Cognitive Difficulty
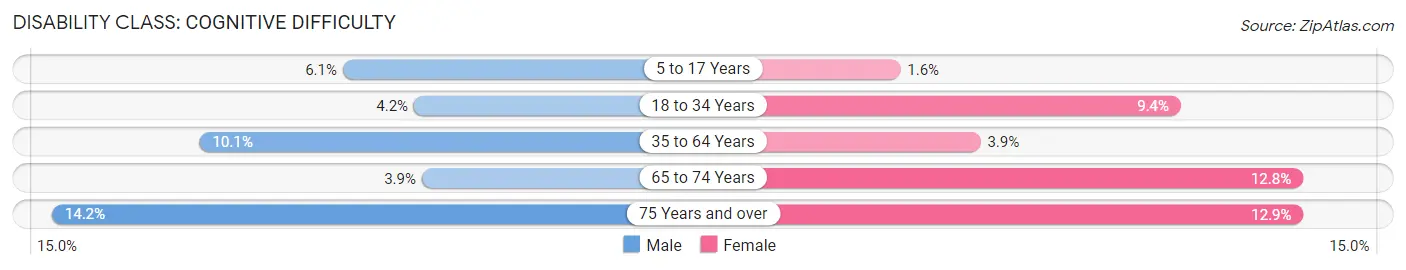
| Age Bracket | Male | Female |
| 5 to 17 Years | 129 (6.1%) | 31 (1.6%) |
| 18 to 34 Years | 67 (4.2%) | 175 (9.4%) |
| 35 to 64 Years | 301 (10.1%) | 119 (3.9%) |
| 65 to 74 Years | 17 (3.9%) | 81 (12.8%) |
| 75 Years and over | 44 (14.2%) | 46 (12.9%) |
Disability Class: Ambulatory Difficulty
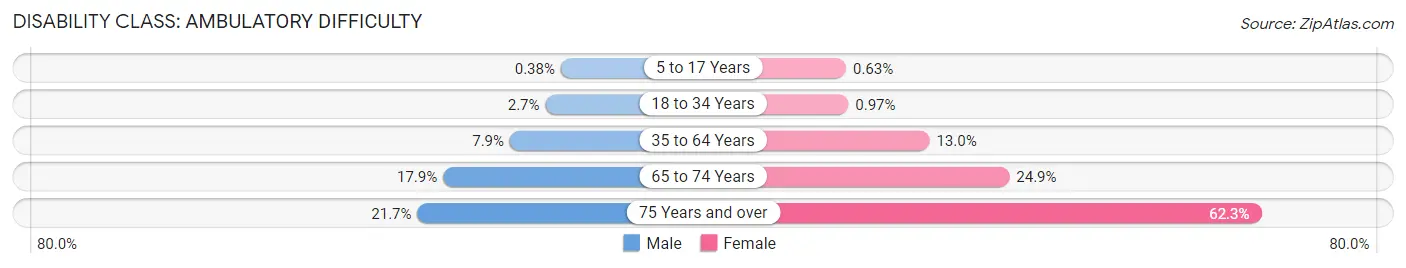
| Age Bracket | Male | Female |
| 5 to 17 Years | 8 (0.4%) | 12 (0.6%) |
| 18 to 34 Years | 43 (2.7%) | 18 (1.0%) |
| 35 to 64 Years | 236 (7.9%) | 401 (13.0%) |
| 65 to 74 Years | 77 (17.9%) | 157 (24.9%) |
| 75 Years and over | 67 (21.7%) | 223 (62.3%) |
Disability Class: Self-Care Difficulty
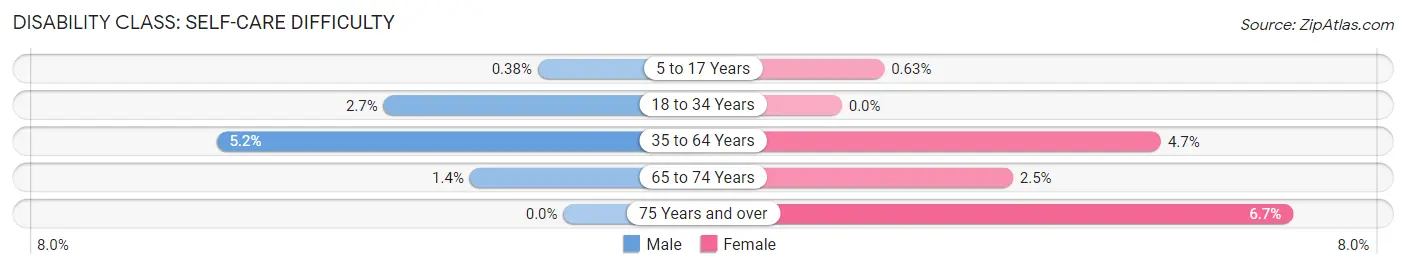
| Age Bracket | Male | Female |
| 5 to 17 Years | 8 (0.4%) | 12 (0.6%) |
| 18 to 34 Years | 43 (2.7%) | 0 (0.0%) |
| 35 to 64 Years | 153 (5.1%) | 146 (4.7%) |
| 65 to 74 Years | 6 (1.4%) | 16 (2.5%) |
| 75 Years and over | 0 (0.0%) | 24 (6.7%) |
Technology Access in Center Point
Computing Device Access in Center Point
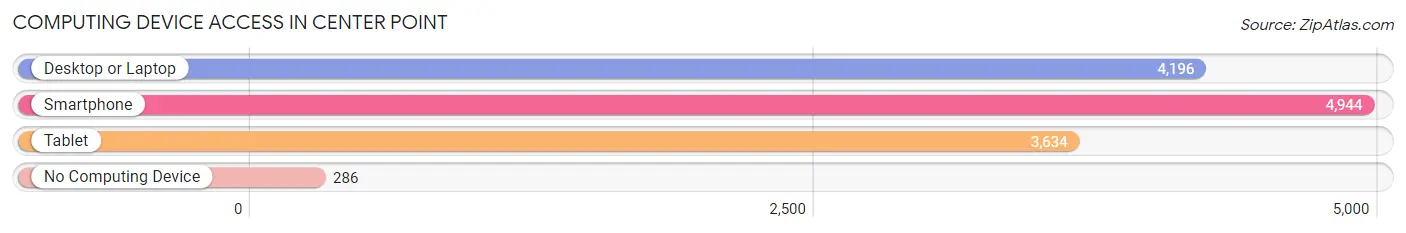
| Device Type | # Households | % Households |
| Desktop or Laptop | 4,196 | 74.4% |
| Smartphone | 4,944 | 87.6% |
| Tablet | 3,634 | 64.4% |
| No Computing Device | 286 | 5.1% |
| Total | 5,643 | 100.0% |
Internet Access in Center Point
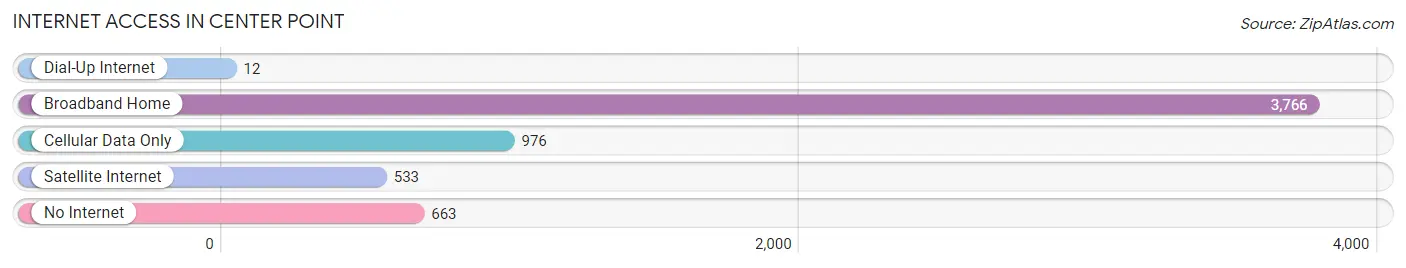
| Internet Type | # Households | % Households |
| Dial-Up Internet | 12 | 0.2% |
| Broadband Home | 3,766 | 66.7% |
| Cellular Data Only | 976 | 17.3% |
| Satellite Internet | 533 | 9.5% |
| No Internet | 663 | 11.7% |
| Total | 5,643 | 100.0% |
Center Point Summary
Point, Alabama is a small city located in the center of the state of Alabama. It is located in Jefferson County and is part of the Birmingham-Hoover Metropolitan Statistical Area. The city has a population of approximately 8,000 people and is the county seat of Jefferson County.
History
The area that is now known as Center Point was first settled in the early 1800s by settlers from the Carolinas and Georgia. The area was originally known as "Pinchgut" due to the fact that the settlers had to pinch their stomachs to make it through the narrow passageway that led to the area. The name was eventually changed to Center Point due to its location at the center of Jefferson County.
The city was officially incorporated in 1887 and was named after the nearby Center Point Church. The city quickly grew and by the early 1900s, it had become a thriving community with a population of over 1,000 people.
Geography
Center Point is located in the center of Jefferson County, Alabama. It is situated at the intersection of Interstate 59 and Interstate 65, making it easily accessible from all parts of the state. The city is located approximately 20 miles north of Birmingham and is part of the Birmingham-Hoover Metropolitan Statistical Area.
The city has a total area of 8.2 square miles, all of which is land. The city is located in the foothills of the Appalachian Mountains and is surrounded by rolling hills and forests. The city is also located near the Cahaba River, which provides a scenic backdrop for the city.
Economy
The economy of Center Point is largely based on manufacturing and retail. The city is home to several large manufacturing companies, including Vulcan Materials, which produces construction materials, and the Birmingham Steel Corporation, which produces steel products. The city is also home to several retail stores, including Walmart, Target, and Home Depot.
The city also has a thriving tourism industry, with several attractions, including the Birmingham Zoo, the Birmingham Botanical Gardens, and the Birmingham Museum of Art.
Demographics
As of the 2010 census, the population of Center Point was 8,114. The racial makeup of the city was 79.2% White, 16.2% African American, 0.3% Native American, 0.7% Asian, 0.1% Pacific Islander, 1.3% from other races, and 2.4% from two or more races. Hispanic or Latino of any race were 3.2% of the population.
The median income for a household in the city was $37,917, and the median income for a family was $45,938. The per capita income for the city was $19,945. About 11.2% of families and 14.2% of the population were below the poverty line, including 19.2% of those under age 18 and 8.2% of those age 65 or over.
Conclusion
Center Point, Alabama is a small city located in the center of the state of Alabama. It is located in Jefferson County and is part of the Birmingham-Hoover Metropolitan Statistical Area. The city has a population of approximately 8,000 people and is the county seat of Jefferson County. The city has a long history and is home to several large manufacturing companies and retail stores. The city also has a thriving tourism industry, with several attractions, including the Birmingham Zoo, the Birmingham Botanical Gardens, and the Birmingham Museum of Art. The population of Center Point is largely white, with a small percentage of African Americans, Native Americans, Asians, and other races. The median income for a household in the city is $37,917, and the median income for a family is $45,938.
Common Questions
What is Per Capita Income in Center Point?
Per Capita income in Center Point is $25,001.
What is the Median Family Income in Center Point?
Median Family Income in Center Point is $52,424.
What is the Median Household income in Center Point?
Median Household Income in Center Point is $49,886.
What is Income or Wage Gap in Center Point?
Income or Wage Gap in Center Point is 32.4%.
Women in Center Point earn 67.6 cents for every dollar earned by a man.
What is Family Income Deficit in Center Point?
Family Income Deficit in Center Point is $11,575.
Families that are below poverty line in Center Point earn $11,575 less on average than the poverty threshold level.
What is Inequality or Gini Index in Center Point?
Inequality or Gini Index in Center Point is 0.40.
What is the Total Population of Center Point?
Total Population of Center Point is 16,279.
What is the Total Male Population of Center Point?
Total Male Population of Center Point is 7,967.
What is the Total Female Population of Center Point?
Total Female Population of Center Point is 8,312.
What is the Ratio of Males per 100 Females in Center Point?
There are 95.85 Males per 100 Females in Center Point.
What is the Ratio of Females per 100 Males in Center Point?
There are 104.33 Females per 100 Males in Center Point.
What is the Median Population Age in Center Point?
Median Population Age in Center Point is 33.9 Years.
What is the Average Family Size in Center Point
Average Family Size in Center Point is 3.5 People.
What is the Average Household Size in Center Point
Average Household Size in Center Point is 2.9 People.
How Large is the Labor Force in Center Point?
There are 7,514 People in the Labor Forcein in Center Point.
What is the Percentage of People in the Labor Force in Center Point?
62.0% of People are in the Labor Force in Center Point.
What is the Unemployment Rate in Center Point?
Unemployment Rate in Center Point is 10.0%.