Gordon, AL Map & Demographics
Gordon Map
Gordon Overview
$26,431
PER CAPITA INCOME
$58,000
AVG FAMILY INCOME
$41,500
AVG HOUSEHOLD INCOME
85.4%
WAGE / INCOME GAP [ % ]
14.6¢/ $1
WAGE / INCOME GAP [ $ ]
0.42
INEQUALITY / GINI INDEX
356
TOTAL POPULATION
164
MALE POPULATION
192
FEMALE POPULATION
85.42
MALES / 100 FEMALES
117.07
FEMALES / 100 MALES
55.1
MEDIAN AGE
3.5
AVG FAMILY SIZE
2.2
AVG HOUSEHOLD SIZE
157
LABOR FORCE [ PEOPLE ]
45.8%
PERCENT IN LABOR FORCE
22.9%
UNEMPLOYMENT RATE
Gordon Zip Codes
Gordon Area Codes
Income in Gordon
Income Overview in Gordon
Per Capita Income in Gordon is $26,431, while median incomes of families and households are $58,000 and $41,500 respectively.
| Characteristic | Number | Measure |
| Per Capita Income | 356 | $26,431 |
| Median Family Income | 68 | $58,000 |
| Mean Family Income | 68 | $68,434 |
| Median Household Income | 158 | $41,500 |
| Mean Household Income | 158 | $51,878 |
| Income Deficit | 68 | $0 |
| Wage / Income Gap (%) | 356 | 85.38% |
| Wage / Income Gap ($) | 356 | 14.62¢ per $1 |
| Gini / Inequality Index | 356 | 0.42 |
Earnings by Sex in Gordon
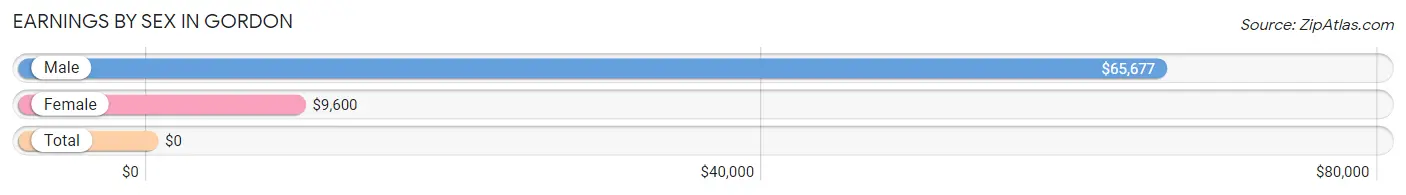
| Sex | Number | Average Earnings |
| Male | 83 (46.4%) | $65,677 |
| Female | 96 (53.6%) | $9,600 |
| Total | 179 (100.0%) | $0 |
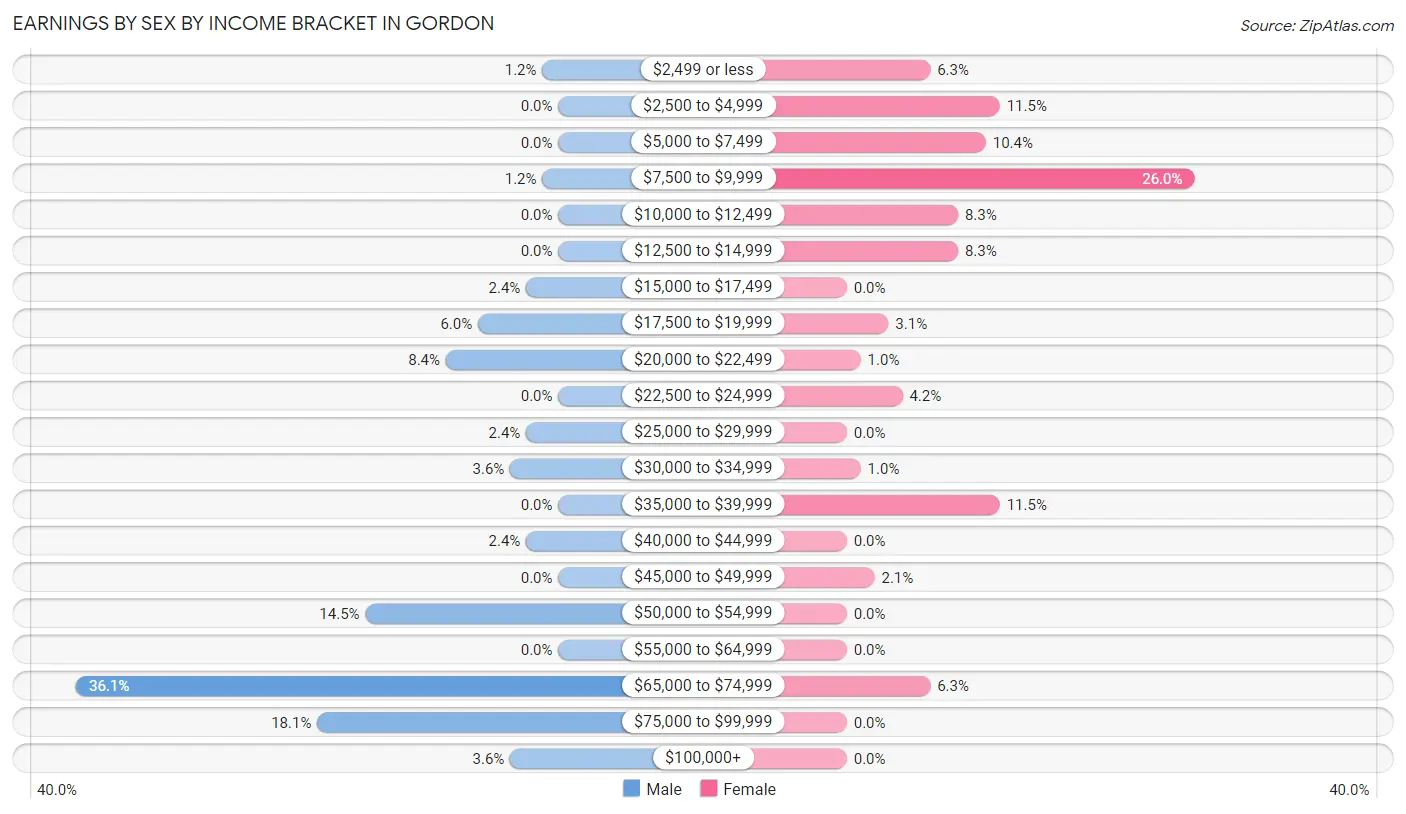
Earnings by Sex by Income Bracket in Gordon
The most common earnings brackets in Gordon are $65,000 to $74,999 for men (30 | 36.1%) and $7,500 to $9,999 for women (25 | 26.0%).
| Income | Male | Female |
| $2,499 or less | 1 (1.2%) | 6 (6.2%) |
| $2,500 to $4,999 | 0 (0.0%) | 11 (11.5%) |
| $5,000 to $7,499 | 0 (0.0%) | 10 (10.4%) |
| $7,500 to $9,999 | 1 (1.2%) | 25 (26.0%) |
| $10,000 to $12,499 | 0 (0.0%) | 8 (8.3%) |
| $12,500 to $14,999 | 0 (0.0%) | 8 (8.3%) |
| $15,000 to $17,499 | 2 (2.4%) | 0 (0.0%) |
| $17,500 to $19,999 | 5 (6.0%) | 3 (3.1%) |
| $20,000 to $22,499 | 7 (8.4%) | 1 (1.0%) |
| $22,500 to $24,999 | 0 (0.0%) | 4 (4.2%) |
| $25,000 to $29,999 | 2 (2.4%) | 0 (0.0%) |
| $30,000 to $34,999 | 3 (3.6%) | 1 (1.0%) |
| $35,000 to $39,999 | 0 (0.0%) | 11 (11.5%) |
| $40,000 to $44,999 | 2 (2.4%) | 0 (0.0%) |
| $45,000 to $49,999 | 0 (0.0%) | 2 (2.1%) |
| $50,000 to $54,999 | 12 (14.5%) | 0 (0.0%) |
| $55,000 to $64,999 | 0 (0.0%) | 0 (0.0%) |
| $65,000 to $74,999 | 30 (36.1%) | 6 (6.2%) |
| $75,000 to $99,999 | 15 (18.1%) | 0 (0.0%) |
| $100,000+ | 3 (3.6%) | 0 (0.0%) |
| Total | 83 (100.0%) | 96 (100.0%) |
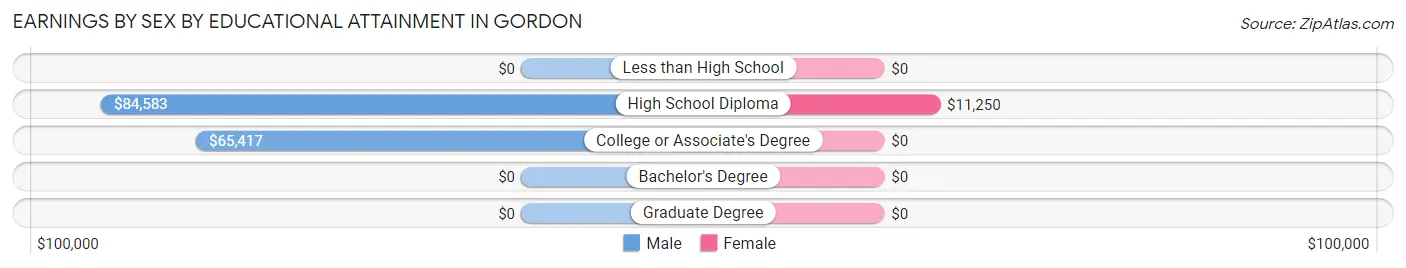
Earnings by Sex by Educational Attainment in Gordon
Average earnings in Gordon are $65,417 for men and $12,813 for women, a difference of 80.4%. Men with an educational attainment of high school diploma enjoy the highest average annual earnings of $84,583, while those with college or associate's degree education earn the least with $65,417. Women with an educational attainment of high school diploma earn the most with the average annual earnings of $11,250, while those with high school diploma education have the smallest earnings of $11,250.
| Educational Attainment | Male Income | Female Income |
| Less than High School | - | - |
| High School Diploma | $84,583 | $11,250 |
| College or Associate's Degree | $65,417 | $0 |
| Bachelor's Degree | - | - |
| Graduate Degree | - | - |
| Total | $65,417 | $12,813 |
Family Income in Gordon
Family Income Brackets in Gordon
According to the Gordon family income data, there are 16 families falling into the $50,000 to $74,999 income range, which is the most common income bracket and makes up 23.5% of all families.
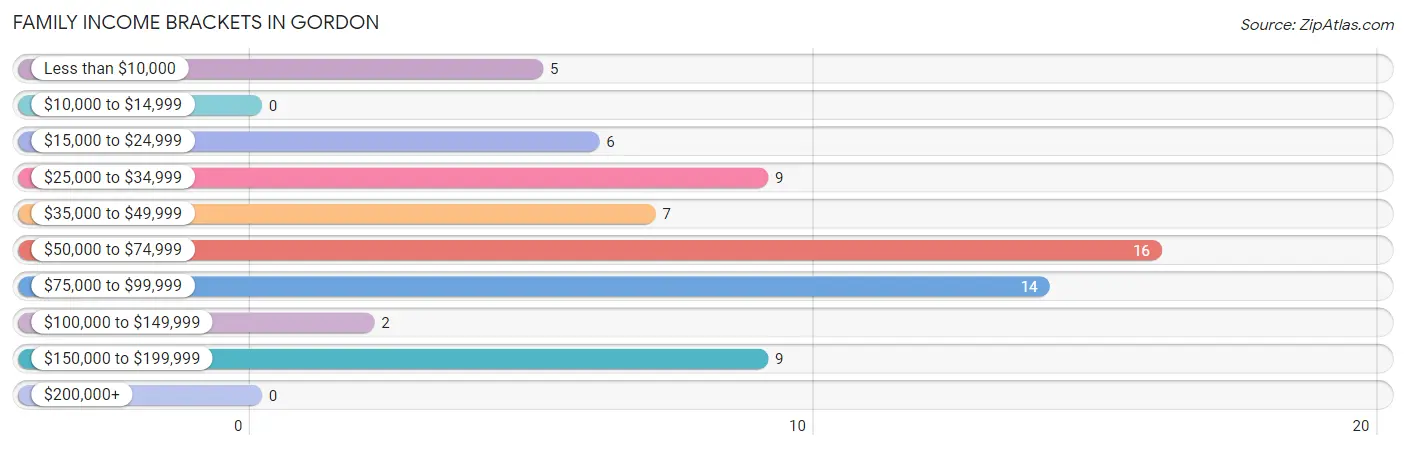
| Income Bracket | # Families | % Families |
| Less than $10,000 | 5 | 7.4% |
| $10,000 to $14,999 | 0 | 0.0% |
| $15,000 to $24,999 | 6 | 8.8% |
| $25,000 to $34,999 | 9 | 13.2% |
| $35,000 to $49,999 | 7 | 10.3% |
| $50,000 to $74,999 | 16 | 23.5% |
| $75,000 to $99,999 | 14 | 20.6% |
| $100,000 to $149,999 | 2 | 2.9% |
| $150,000 to $199,999 | 9 | 13.2% |
| $200,000+ | 0 | 0.0% |
Family Income by Famaliy Size in Gordon
4-person families (16 | 23.5%) account for the highest median family income in Gordon with $82,500 per family, while 2-person families (39 | 57.4%) have the highest median income of $26,771 per family member.
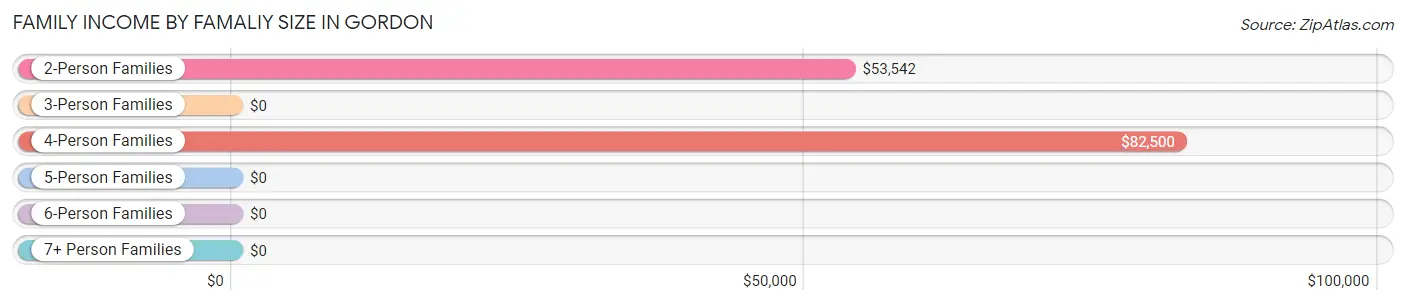
| Income Bracket | # Families | Median Income |
| 2-Person Families | 39 (57.4%) | $53,542 |
| 3-Person Families | 12 (17.6%) | $0 |
| 4-Person Families | 16 (23.5%) | $82,500 |
| 5-Person Families | 0 (0.0%) | $0 |
| 6-Person Families | 1 (1.5%) | $0 |
| 7+ Person Families | 0 (0.0%) | $0 |
| Total | 68 (100.0%) | $58,000 |
Family Income by Number of Earners in Gordon
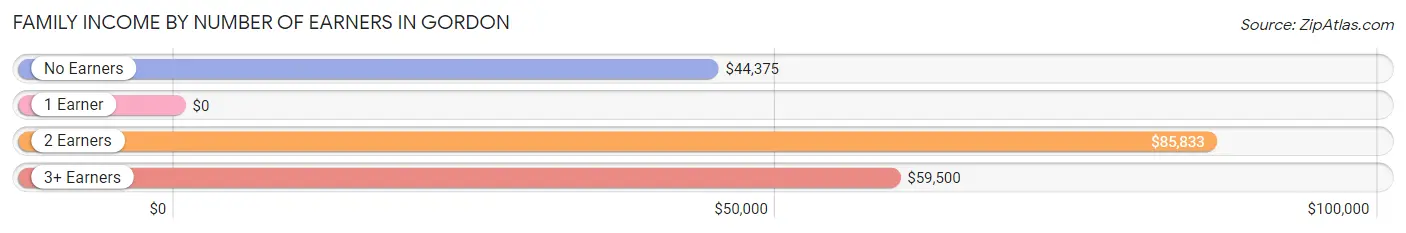
| Number of Earners | # Families | Median Income |
| No Earners | 17 (25.0%) | $44,375 |
| 1 Earner | 23 (33.8%) | $0 |
| 2 Earners | 20 (29.4%) | $85,833 |
| 3+ Earners | 8 (11.8%) | $59,500 |
| Total | 68 (100.0%) | $58,000 |
Household Income in Gordon
Household Income Brackets in Gordon
With 43 households falling in the category, the $75,000 to $99,999 income range is the most frequent in Gordon, accounting for 27.2% of all households.
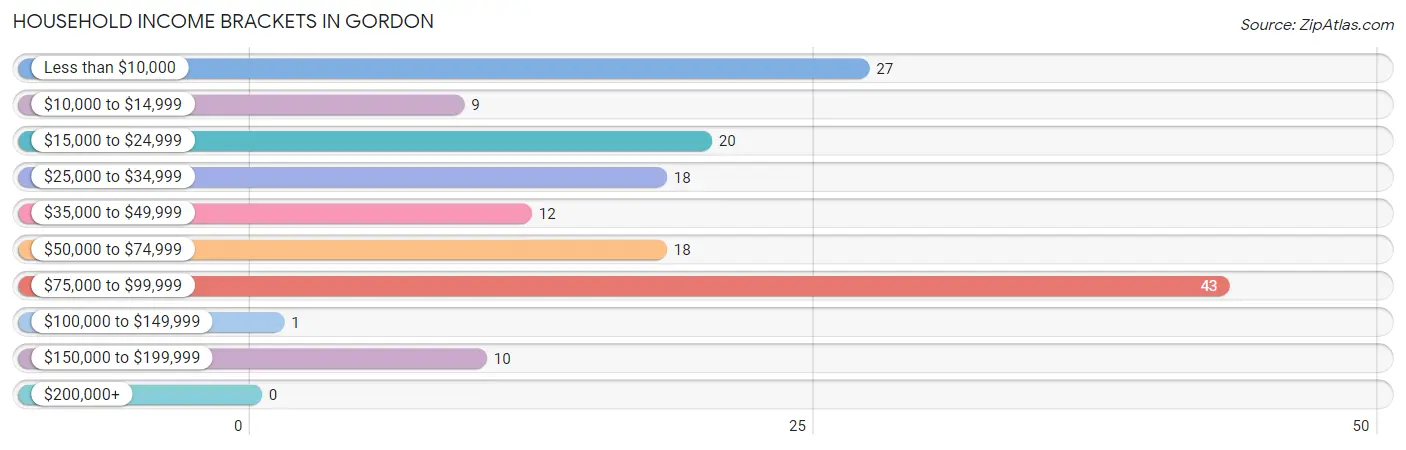
| Income Bracket | # Households | % Households |
| Less than $10,000 | 27 | 17.1% |
| $10,000 to $14,999 | 9 | 5.7% |
| $15,000 to $24,999 | 20 | 12.7% |
| $25,000 to $34,999 | 18 | 11.4% |
| $35,000 to $49,999 | 12 | 7.6% |
| $50,000 to $74,999 | 18 | 11.4% |
| $75,000 to $99,999 | 43 | 27.2% |
| $100,000 to $149,999 | 1 | 0.6% |
| $150,000 to $199,999 | 10 | 6.3% |
| $200,000+ | 0 | 0.0% |
Household Income by Householder Age in Gordon
The median household income in Gordon is $41,500, with the highest median household income of $66,250 found in the 45 to 64 years age bracket for the primary householder. A total of 94 households (59.5%) fall into this category. Meanwhile, the 15 to 24 years age bracket for the primary householder has the lowest median household income of $0, with 6 households (3.8%) in this group.
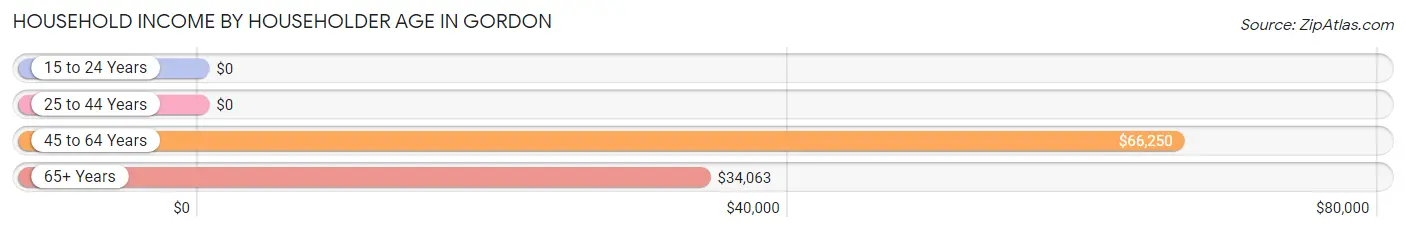
| Income Bracket | # Households | Median Income |
| 15 to 24 Years | 6 (3.8%) | $0 |
| 25 to 44 Years | 13 (8.2%) | $0 |
| 45 to 64 Years | 94 (59.5%) | $66,250 |
| 65+ Years | 45 (28.5%) | $34,063 |
| Total | 158 (100.0%) | $41,500 |
Poverty in Gordon
Income Below Poverty by Sex and Age in Gordon
With 5.5% poverty level for males and 41.1% for females among the residents of Gordon, 55 to 64 year old males and 25 to 34 year old females are the most vulnerable to poverty, with 7 males (12.1%) and 20 females (90.9%) in their respective age groups living below the poverty level.
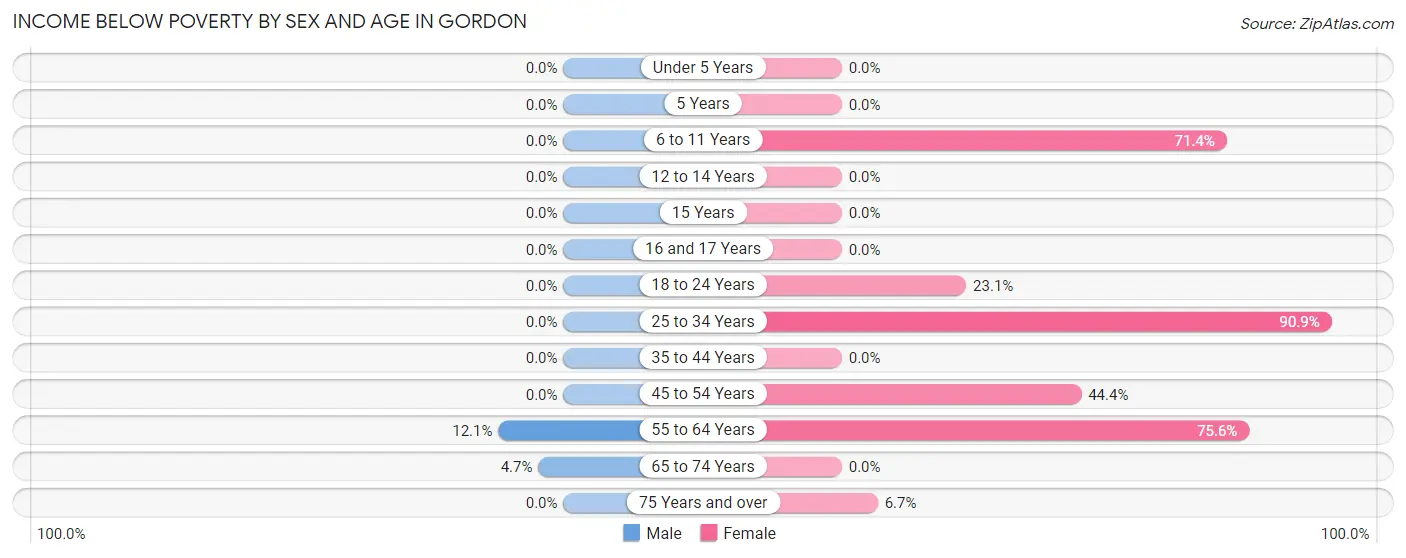
| Age Bracket | Male | Female |
| Under 5 Years | 0 (0.0%) | 0 (0.0%) |
| 5 Years | 0 (0.0%) | 0 (0.0%) |
| 6 to 11 Years | 0 (0.0%) | 5 (71.4%) |
| 12 to 14 Years | 0 (0.0%) | 0 (0.0%) |
| 15 Years | 0 (0.0%) | 0 (0.0%) |
| 16 and 17 Years | 0 (0.0%) | 0 (0.0%) |
| 18 to 24 Years | 0 (0.0%) | 6 (23.1%) |
| 25 to 34 Years | 0 (0.0%) | 20 (90.9%) |
| 35 to 44 Years | 0 (0.0%) | 0 (0.0%) |
| 45 to 54 Years | 0 (0.0%) | 16 (44.4%) |
| 55 to 64 Years | 7 (12.1%) | 31 (75.6%) |
| 65 to 74 Years | 2 (4.6%) | 0 (0.0%) |
| 75 Years and over | 0 (0.0%) | 1 (6.7%) |
| Total | 9 (5.5%) | 79 (41.1%) |
Income Above Poverty by Sex and Age in Gordon
According to the poverty statistics in Gordon, males aged under 5 years and females aged 12 to 14 years are the age groups that are most secure financially, with 100.0% of males and 100.0% of females in these age groups living above the poverty line.
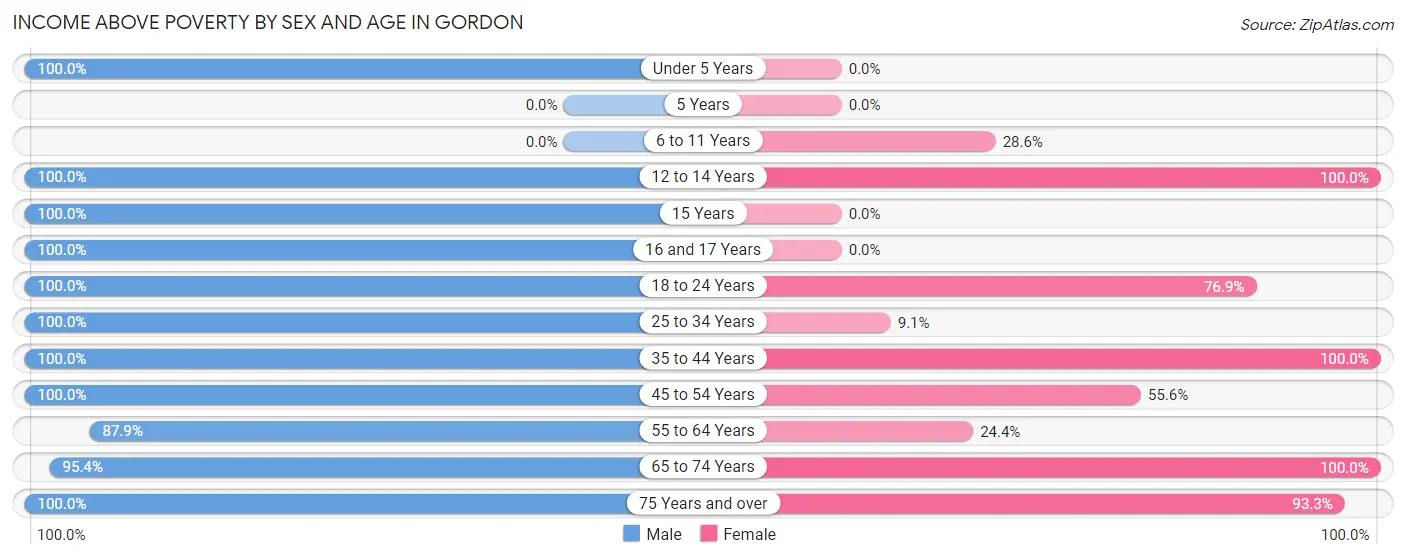
| Age Bracket | Male | Female |
| Under 5 Years | 1 (100.0%) | 0 (0.0%) |
| 5 Years | 0 (0.0%) | 0 (0.0%) |
| 6 to 11 Years | 0 (0.0%) | 2 (28.6%) |
| 12 to 14 Years | 2 (100.0%) | 1 (100.0%) |
| 15 Years | 2 (100.0%) | 0 (0.0%) |
| 16 and 17 Years | 1 (100.0%) | 0 (0.0%) |
| 18 to 24 Years | 6 (100.0%) | 20 (76.9%) |
| 25 to 34 Years | 16 (100.0%) | 2 (9.1%) |
| 35 to 44 Years | 11 (100.0%) | 24 (100.0%) |
| 45 to 54 Years | 20 (100.0%) | 20 (55.6%) |
| 55 to 64 Years | 51 (87.9%) | 10 (24.4%) |
| 65 to 74 Years | 41 (95.4%) | 20 (100.0%) |
| 75 Years and over | 4 (100.0%) | 14 (93.3%) |
| Total | 155 (94.5%) | 113 (58.9%) |
Income Below Poverty Among Married-Couple Families in Gordon
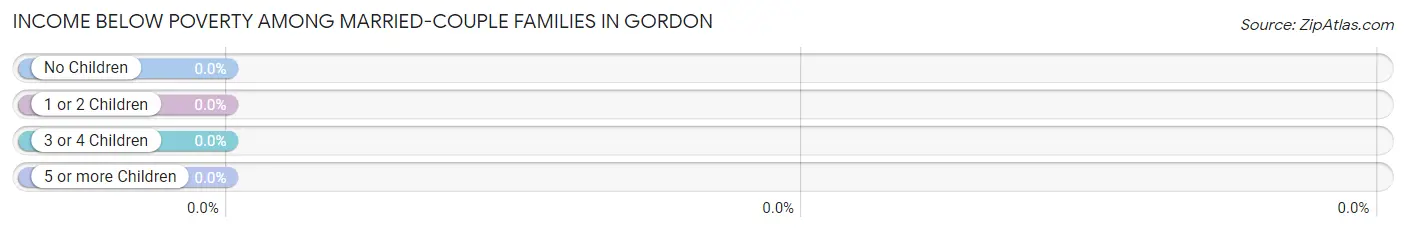
| Children | Above Poverty | Below Poverty |
| No Children | 23 (100.0%) | 0 (0.0%) |
| 1 or 2 Children | 4 (100.0%) | 0 (0.0%) |
| 3 or 4 Children | 0 (0.0%) | 0 (0.0%) |
| 5 or more Children | 0 (0.0%) | 0 (0.0%) |
| Total | 27 (100.0%) | 0 (0.0%) |
Income Below Poverty Among Single-Parent Households in Gordon
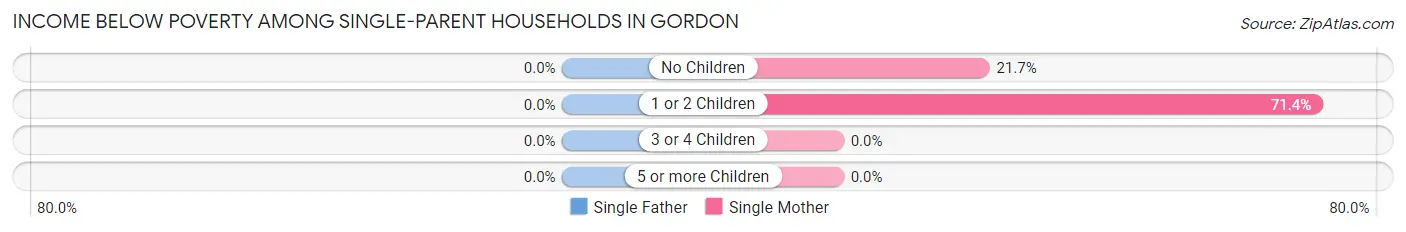
| Children | Single Father | Single Mother |
| No Children | 0 (0.0%) | 5 (21.7%) |
| 1 or 2 Children | 0 (0.0%) | 5 (71.4%) |
| 3 or 4 Children | 0 (0.0%) | 0 (0.0%) |
| 5 or more Children | 0 (0.0%) | 0 (0.0%) |
| Total | 0 (0.0%) | 10 (33.3%) |
Income Below Poverty Among Married-Couple vs Single-Parent Households in Gordon
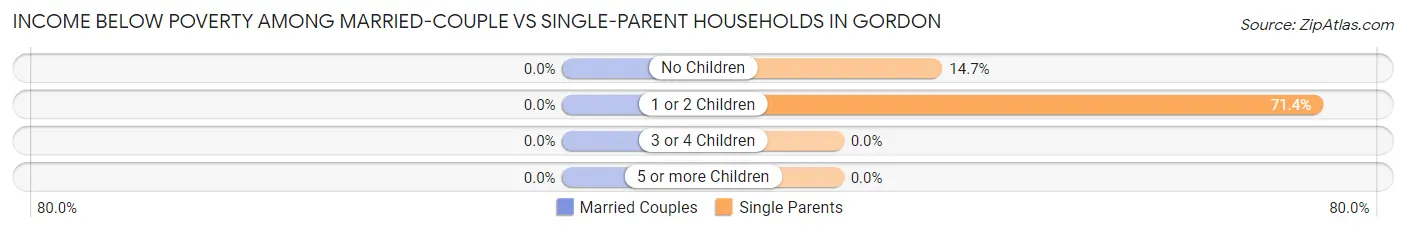
| Children | Married-Couple Families | Single-Parent Households |
| No Children | 0 (0.0%) | 5 (14.7%) |
| 1 or 2 Children | 0 (0.0%) | 5 (71.4%) |
| 3 or 4 Children | 0 (0.0%) | 0 (0.0%) |
| 5 or more Children | 0 (0.0%) | 0 (0.0%) |
| Total | 0 (0.0%) | 10 (24.4%) |
Race in Gordon
The most populous races in Gordon are Black / African American (255 | 71.6%), White / Caucasian (91 | 25.6%), and Two or more Races (5 | 1.4%).
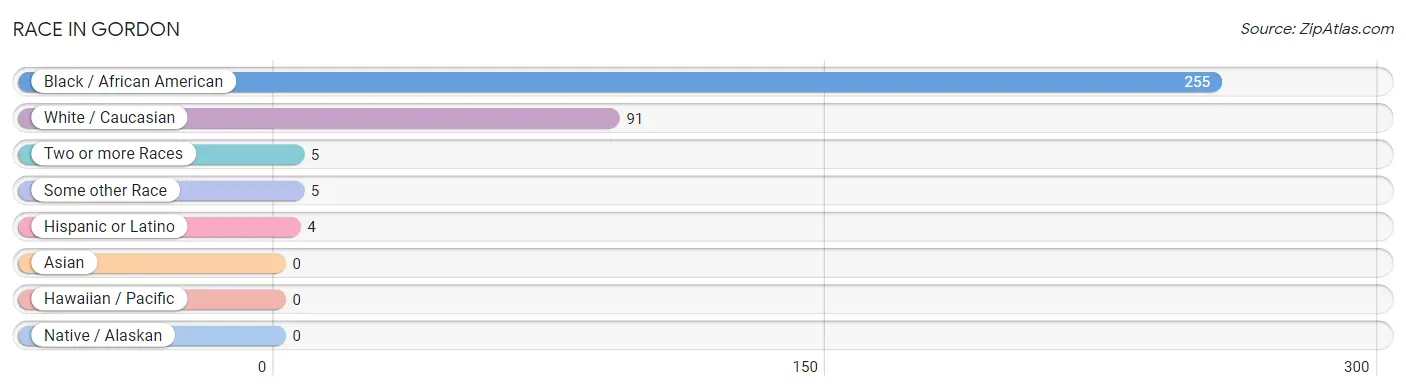
| Race | # Population | % Population |
| Asian | 0 | 0.0% |
| Black / African American | 255 | 71.6% |
| Hawaiian / Pacific | 0 | 0.0% |
| Hispanic or Latino | 4 | 1.1% |
| Native / Alaskan | 0 | 0.0% |
| White / Caucasian | 91 | 25.6% |
| Two or more Races | 5 | 1.4% |
| Some other Race | 5 | 1.4% |
| Total | 356 | 100.0% |
Ancestry in Gordon
The most populous ancestries reported in Gordon are American (69 | 19.4%), English (13 | 3.6%), German (5 | 1.4%), Irish (5 | 1.4%), and Puerto Rican (4 | 1.1%), together accounting for 27.0% of all Gordon residents.
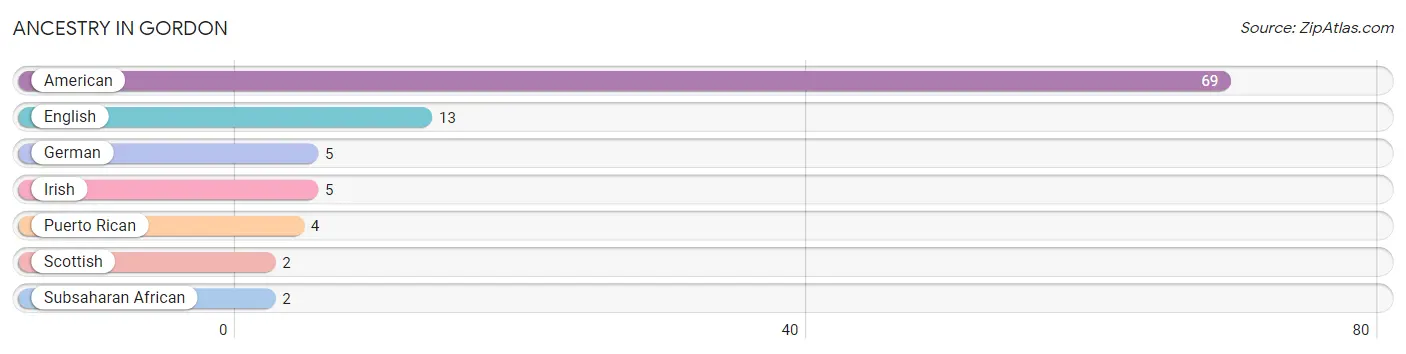
| Ancestry | # Population | % Population |
| American | 69 | 19.4% |
| English | 13 | 3.6% |
| German | 5 | 1.4% |
| Irish | 5 | 1.4% |
| Puerto Rican | 4 | 1.1% |
| Scottish | 2 | 0.6% |
| Subsaharan African | 2 | 0.6% | View All 7 Rows |
Immigrants in Gordon
The most numerous immigrant groups reported in Gordon came from Europe (1 | 0.3%), Southern Europe (1 | 0.3%), and Spain (1 | 0.3%), together accounting for 0.8% of all Gordon residents.
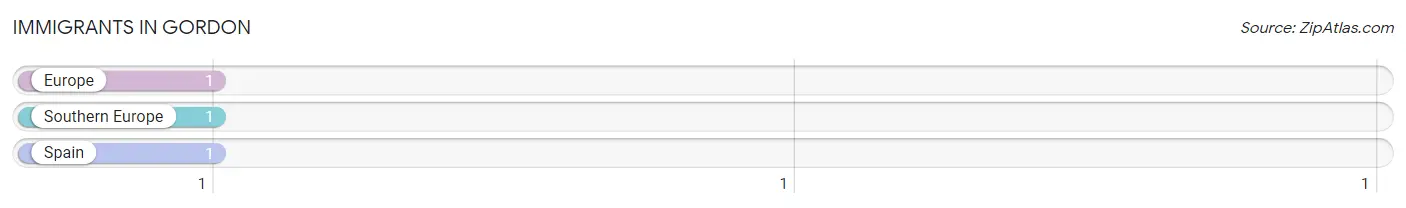
| Immigration Origin | # Population | % Population |
| Europe | 1 | 0.3% |
| Southern Europe | 1 | 0.3% |
| Spain | 1 | 0.3% | View All 3 Rows |
Sex and Age in Gordon
Sex and Age in Gordon
The most populous age groups in Gordon are 55 to 59 Years (43 | 26.2%) for men and 55 to 59 Years (29 | 15.1%) for women.
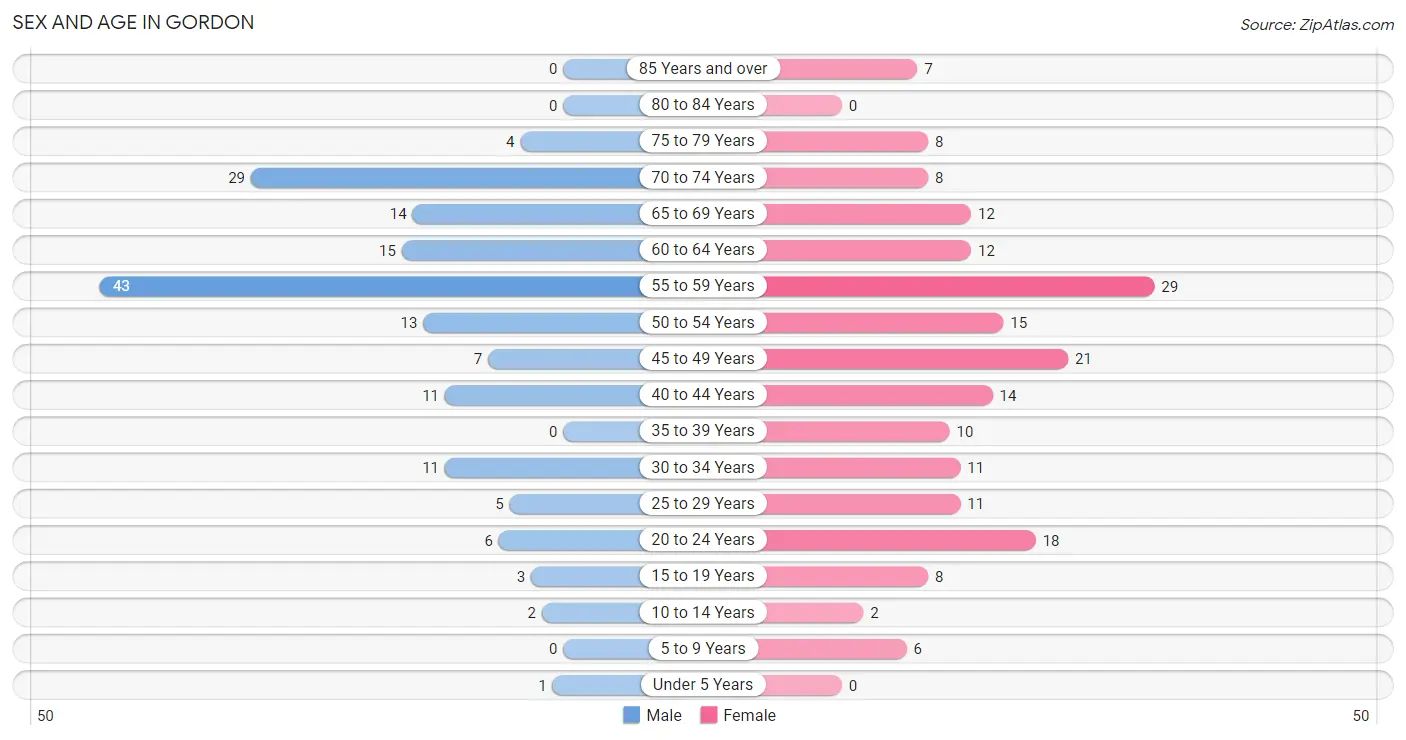
| Age Bracket | Male | Female |
| Under 5 Years | 1 (0.6%) | 0 (0.0%) |
| 5 to 9 Years | 0 (0.0%) | 6 (3.1%) |
| 10 to 14 Years | 2 (1.2%) | 2 (1.0%) |
| 15 to 19 Years | 3 (1.8%) | 8 (4.2%) |
| 20 to 24 Years | 6 (3.7%) | 18 (9.4%) |
| 25 to 29 Years | 5 (3.0%) | 11 (5.7%) |
| 30 to 34 Years | 11 (6.7%) | 11 (5.7%) |
| 35 to 39 Years | 0 (0.0%) | 10 (5.2%) |
| 40 to 44 Years | 11 (6.7%) | 14 (7.3%) |
| 45 to 49 Years | 7 (4.3%) | 21 (10.9%) |
| 50 to 54 Years | 13 (7.9%) | 15 (7.8%) |
| 55 to 59 Years | 43 (26.2%) | 29 (15.1%) |
| 60 to 64 Years | 15 (9.1%) | 12 (6.2%) |
| 65 to 69 Years | 14 (8.5%) | 12 (6.2%) |
| 70 to 74 Years | 29 (17.7%) | 8 (4.2%) |
| 75 to 79 Years | 4 (2.4%) | 8 (4.2%) |
| 80 to 84 Years | 0 (0.0%) | 0 (0.0%) |
| 85 Years and over | 0 (0.0%) | 7 (3.6%) |
| Total | 164 (100.0%) | 192 (100.0%) |
Families and Households in Gordon
Median Family Size in Gordon
The median family size in Gordon is 3.47 persons per family, with single female/mother families (30 | 44.1%) accounting for the largest median family size of 4.03 persons per family. On the other hand, married-couple families (27 | 39.7%) represent the smallest median family size with 2.67 persons per family.
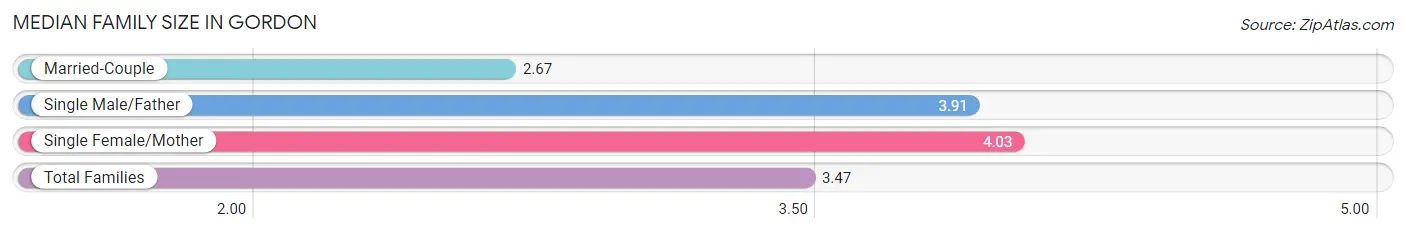
| Family Type | # Families | Family Size |
| Married-Couple | 27 (39.7%) | 2.67 |
| Single Male/Father | 11 (16.2%) | 3.91 |
| Single Female/Mother | 30 (44.1%) | 4.03 |
| Total Families | 68 (100.0%) | 3.47 |
Median Household Size in Gordon
The median household size in Gordon is 2.25 persons per household, with single female/mother households (30 | 19.0%) accounting for the largest median household size of 4.03 persons per household. non-family households (90 | 57.0%) represent the smallest median household size with 1.29 persons per household.
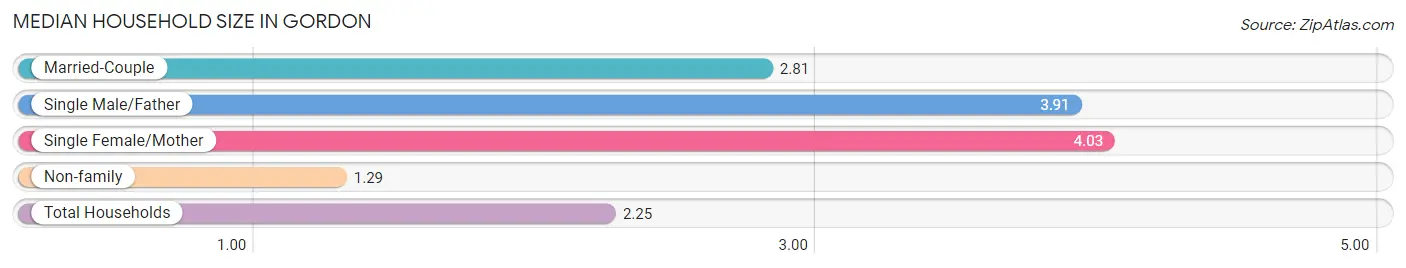
| Household Type | # Households | Household Size |
| Married-Couple | 27 (17.1%) | 2.81 |
| Single Male/Father | 11 (7.0%) | 3.91 |
| Single Female/Mother | 30 (19.0%) | 4.03 |
| Non-family | 90 (57.0%) | 1.29 |
| Total Households | 158 (100.0%) | 2.25 |
Household Size by Marriage Status in Gordon
Out of a total of 158 households in Gordon, 68 (43.0%) are family households, while 90 (57.0%) are nonfamily households. The most numerous type of family households are 2-person households, comprising 38, and the most common type of nonfamily households are 1-person households, comprising 61.
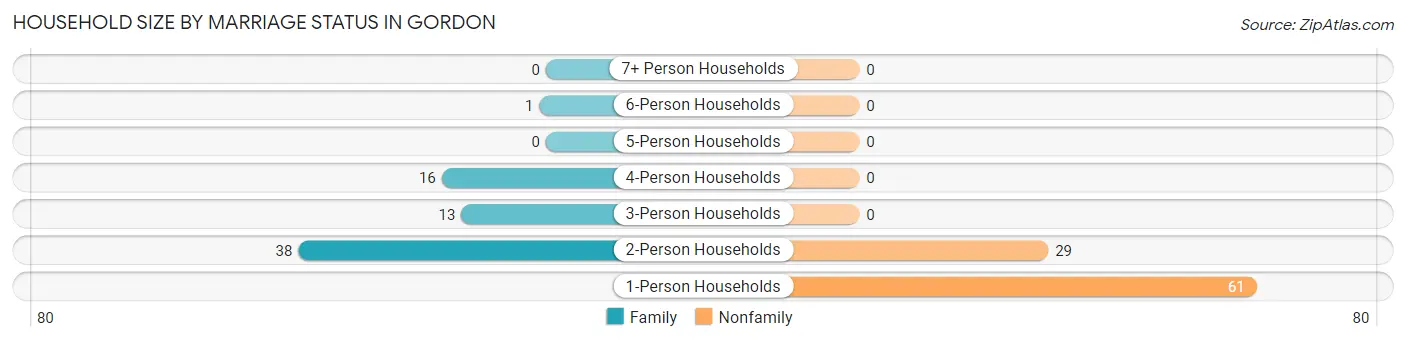
| Household Size | Family Households | Nonfamily Households |
| 1-Person Households | - | 61 (38.6%) |
| 2-Person Households | 38 (24.0%) | 29 (18.3%) |
| 3-Person Households | 13 (8.2%) | 0 (0.0%) |
| 4-Person Households | 16 (10.1%) | 0 (0.0%) |
| 5-Person Households | 0 (0.0%) | 0 (0.0%) |
| 6-Person Households | 1 (0.6%) | 0 (0.0%) |
| 7+ Person Households | 0 (0.0%) | 0 (0.0%) |
| Total | 68 (43.0%) | 90 (57.0%) |
Female Fertility in Gordon
Fertility by Age in Gordon
Average fertility rate in Gordon is 110.0 births per 1,000 women. Women in the age bracket of 20 to 34 years have the highest fertility rate with 225.0 births per 1,000 women. Women in the age bracket of 20 to 34 years acount for 81.8% of all women with births.
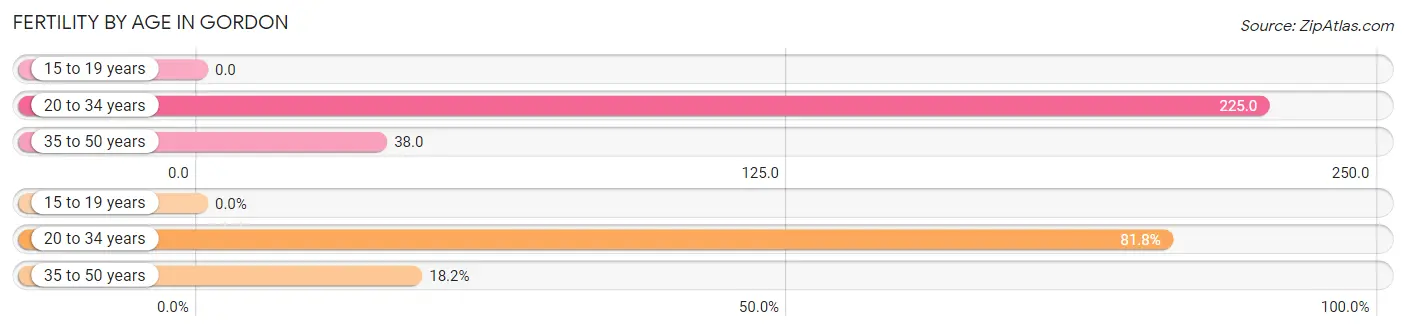
| Age Bracket | Women with Births | Births / 1,000 Women |
| 15 to 19 years | 0 (0.0%) | 0.0 |
| 20 to 34 years | 9 (81.8%) | 225.0 |
| 35 to 50 years | 2 (18.2%) | 38.0 |
| Total | 11 (100.0%) | 110.0 |
Fertility by Age by Marriage Status in Gordon
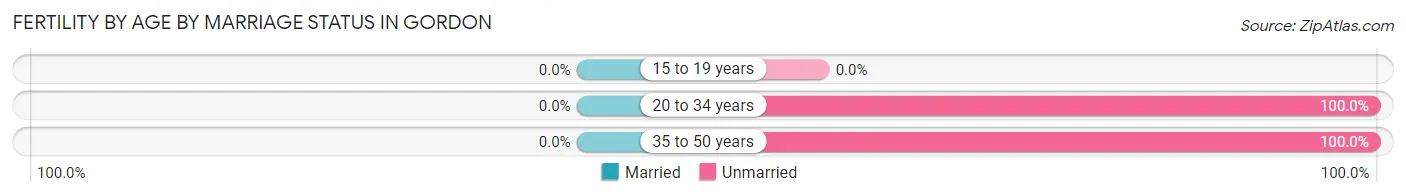
| Age Bracket | Married | Unmarried |
| 15 to 19 years | 0 (0.0%) | 0 (0.0%) |
| 20 to 34 years | 0 (0.0%) | 9 (100.0%) |
| 35 to 50 years | 0 (0.0%) | 2 (100.0%) |
| Total | 0 (0.0%) | 11 (100.0%) |
Fertility by Education in Gordon
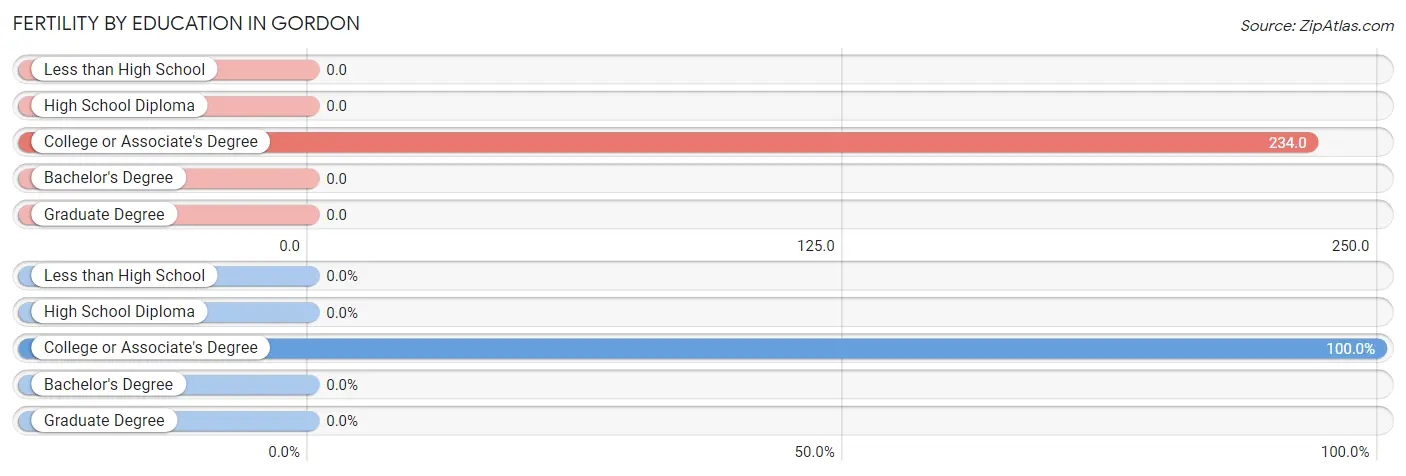
| Educational Attainment | Women with Births | Births / 1,000 Women |
| Less than High School | 0 (0.0%) | 0.0 |
| High School Diploma | 0 (0.0%) | 0.0 |
| College or Associate's Degree | 11 (100.0%) | 234.0 |
| Bachelor's Degree | 0 (0.0%) | 0.0 |
| Graduate Degree | 0 (0.0%) | 0.0 |
| Total | 11 (100.0%) | 110.0 |
Fertility by Education by Marriage Status in Gordon
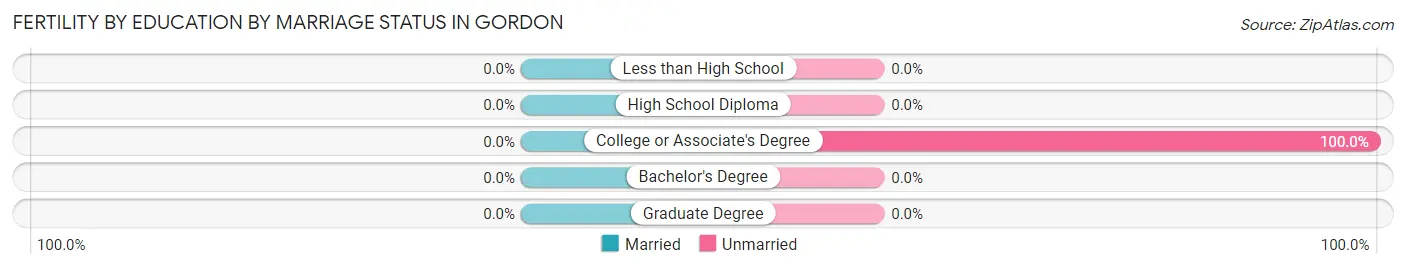
| Educational Attainment | Married | Unmarried |
| Less than High School | 0 (0.0%) | 0 (0.0%) |
| High School Diploma | 0 (0.0%) | 0 (0.0%) |
| College or Associate's Degree | 0 (0.0%) | 11 (100.0%) |
| Bachelor's Degree | 0 (0.0%) | 0 (0.0%) |
| Graduate Degree | 0 (0.0%) | 0 (0.0%) |
| Total | 0 (0.0%) | 11 (100.0%) |
Employment Characteristics in Gordon
Employment by Class of Employer in Gordon
Among the 115 employed individuals in Gordon, private company employees (91 | 79.1%), state government employees (14 | 12.2%), and local government employees (8 | 7.0%) make up the most common classes of employment.
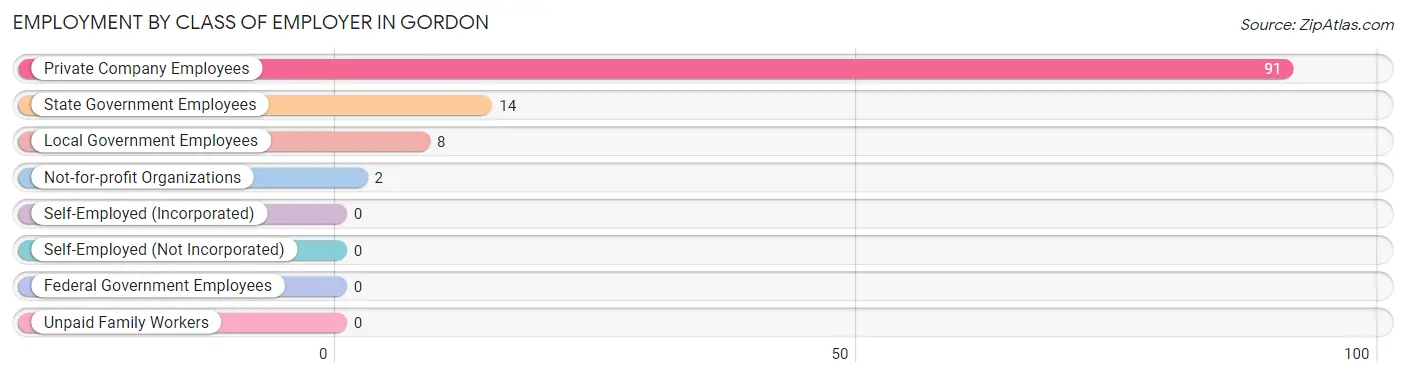
| Employer Class | # Employees | % Employees |
| Private Company Employees | 91 | 79.1% |
| Self-Employed (Incorporated) | 0 | 0.0% |
| Self-Employed (Not Incorporated) | 0 | 0.0% |
| Not-for-profit Organizations | 2 | 1.7% |
| Local Government Employees | 8 | 7.0% |
| State Government Employees | 14 | 12.2% |
| Federal Government Employees | 0 | 0.0% |
| Unpaid Family Workers | 0 | 0.0% |
| Total | 115 | 100.0% |
Employment Status by Age in Gordon
According to the labor force statistics for Gordon, out of the total population over 16 years of age (343), 45.8% or 157 individuals are in the labor force, with 22.9% or 36 of them unemployed. The age group with the highest labor force participation rate is 20 to 24 years, with 100.0% or 24 individuals in the labor force. Within the labor force, the 30 to 34 years age range has the highest percentage of unemployed individuals, with 40.9% or 9 of them being unemployed.
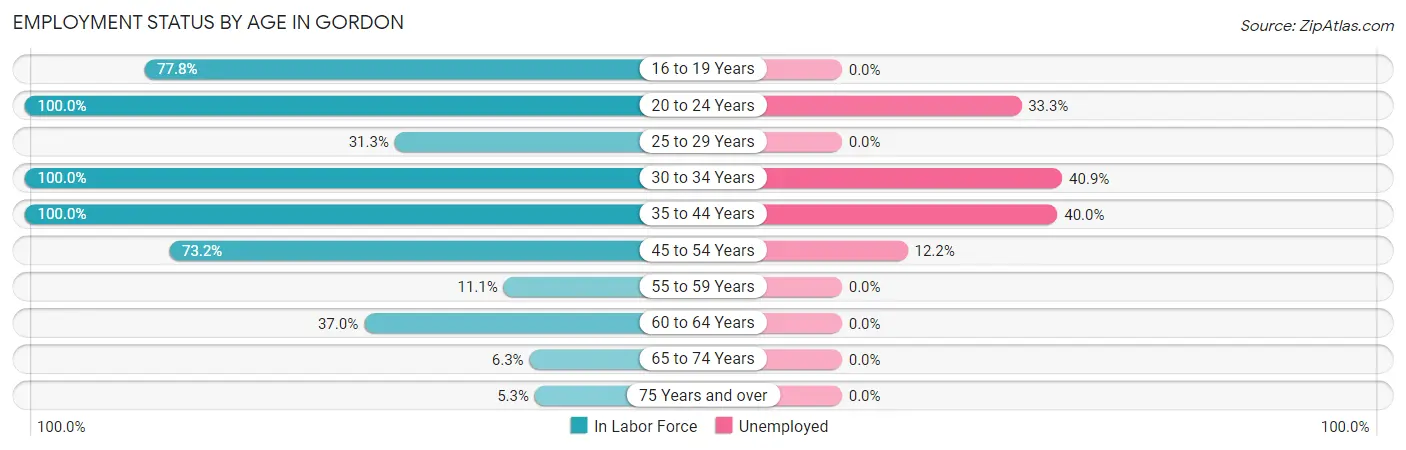
| Age Bracket | In Labor Force | Unemployed |
| 16 to 19 Years | 7 (77.8%) | 0 (0.0%) |
| 20 to 24 Years | 24 (100.0%) | 8 (33.3%) |
| 25 to 29 Years | 5 (31.3%) | 0 (0.0%) |
| 30 to 34 Years | 22 (100.0%) | 9 (40.9%) |
| 35 to 44 Years | 35 (100.0%) | 14 (40.0%) |
| 45 to 54 Years | 41 (73.2%) | 5 (12.2%) |
| 55 to 59 Years | 8 (11.1%) | 0 (0.0%) |
| 60 to 64 Years | 10 (37.0%) | 0 (0.0%) |
| 65 to 74 Years | 4 (6.3%) | 0 (0.0%) |
| 75 Years and over | 1 (5.3%) | 0 (0.0%) |
| Total | 157 (45.8%) | 36 (22.9%) |
Employment Status by Educational Attainment in Gordon
According to labor force statistics for Gordon, 53.1% of individuals (121) out of the total population between 25 and 64 years of age (228) are in the labor force, with 23.1% or 28 of them being unemployed. The group with the highest labor force participation rate are those with the educational attainment of bachelor's degree or higher, with 100.0% or 5 individuals in the labor force. Within the labor force, individuals with less than high school education have the highest percentage of unemployment, with 94.4% or 17 of them being unemployed.
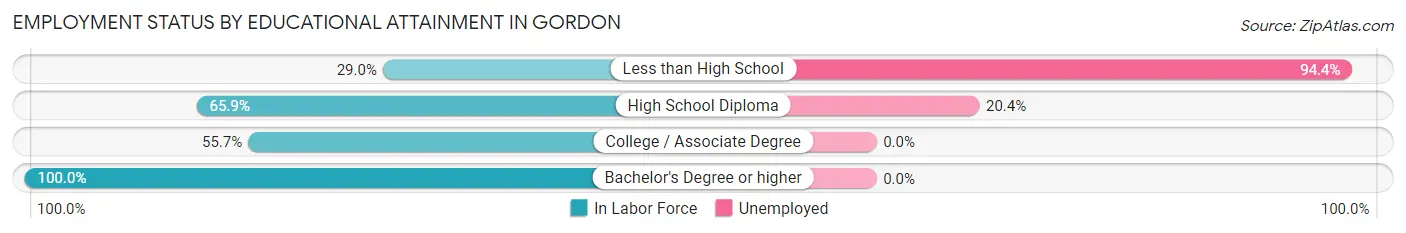
| Educational Attainment | In Labor Force | Unemployed |
| Less than High School | 18 (29.0%) | 59 (94.4%) |
| High School Diploma | 54 (65.9%) | 17 (20.4%) |
| College / Associate Degree | 44 (55.7%) | 0 (0.0%) |
| Bachelor's Degree or higher | 5 (100.0%) | 0 (0.0%) |
| Total | 121 (53.1%) | 53 (23.1%) |
Employment Occupations by Sex in Gordon
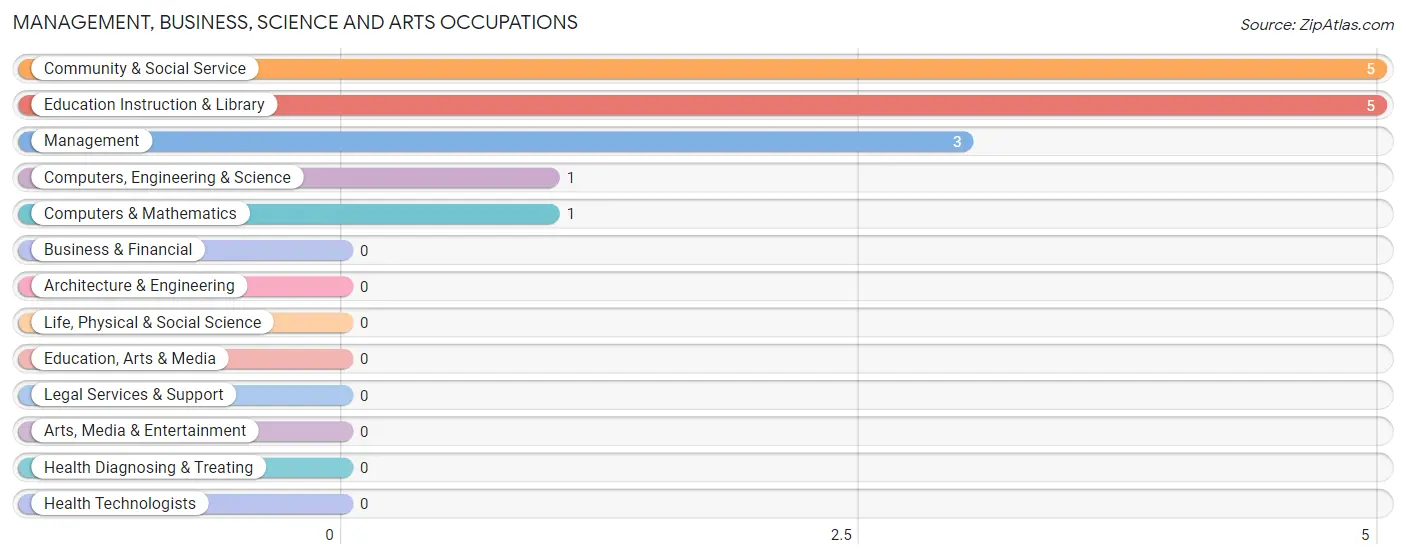
Management, Business, Science and Arts Occupations
The most common Management, Business, Science and Arts occupations in Gordon are Community & Social Service (5 | 4.1%), Education Instruction & Library (5 | 4.1%), Management (3 | 2.5%), Computers, Engineering & Science (1 | 0.8%), and Computers & Mathematics (1 | 0.8%).
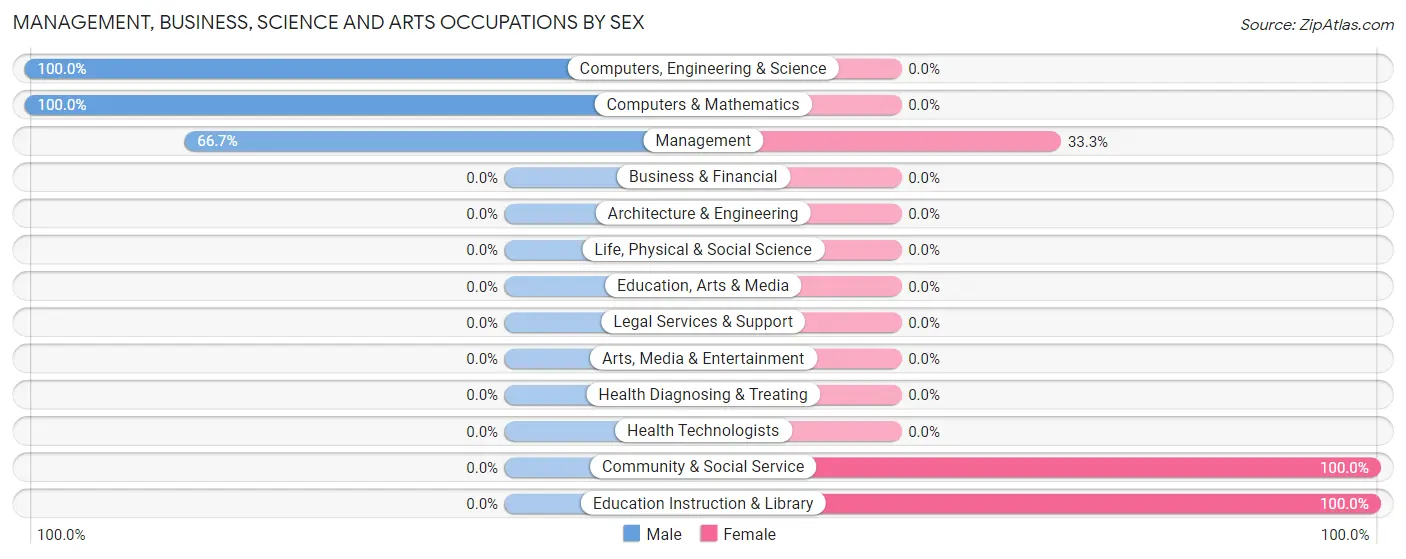
Management, Business, Science and Arts Occupations by Sex
Within the Management, Business, Science and Arts occupations in Gordon, the most male-oriented occupations are Computers, Engineering & Science (100.0%), Computers & Mathematics (100.0%), and Management (66.7%), while the most female-oriented occupations are Community & Social Service (100.0%), Education Instruction & Library (100.0%), and Management (33.3%).
| Occupation | Male | Female |
| Management | 2 (66.7%) | 1 (33.3%) |
| Business & Financial | 0 (0.0%) | 0 (0.0%) |
| Computers, Engineering & Science | 1 (100.0%) | 0 (0.0%) |
| Computers & Mathematics | 1 (100.0%) | 0 (0.0%) |
| Architecture & Engineering | 0 (0.0%) | 0 (0.0%) |
| Life, Physical & Social Science | 0 (0.0%) | 0 (0.0%) |
| Community & Social Service | 0 (0.0%) | 5 (100.0%) |
| Education, Arts & Media | 0 (0.0%) | 0 (0.0%) |
| Legal Services & Support | 0 (0.0%) | 0 (0.0%) |
| Education Instruction & Library | 0 (0.0%) | 5 (100.0%) |
| Arts, Media & Entertainment | 0 (0.0%) | 0 (0.0%) |
| Health Diagnosing & Treating | 0 (0.0%) | 0 (0.0%) |
| Health Technologists | 0 (0.0%) | 0 (0.0%) |
| Total (Category) | 3 (33.3%) | 6 (66.7%) |
| Total (Overall) | 53 (43.8%) | 68 (56.2%) |
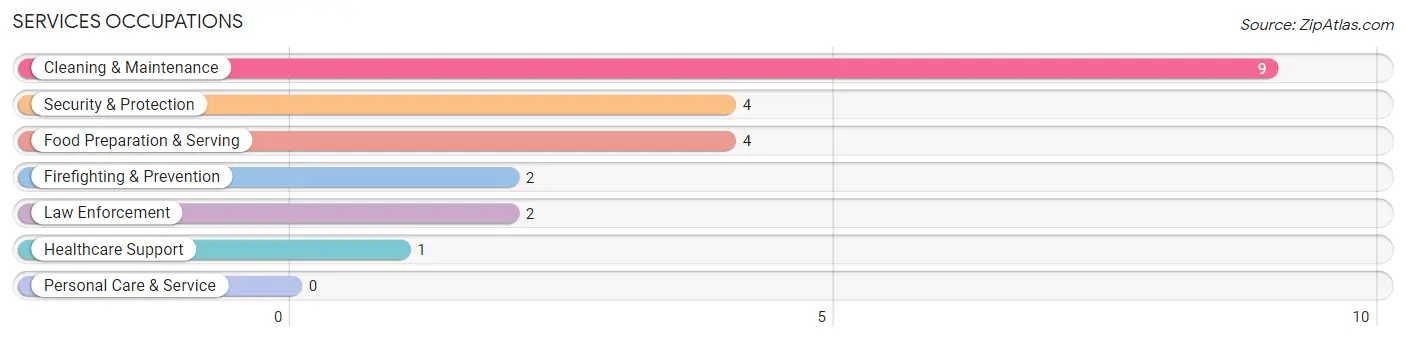
Services Occupations
The most common Services occupations in Gordon are Cleaning & Maintenance (9 | 7.4%), Security & Protection (4 | 3.3%), Food Preparation & Serving (4 | 3.3%), Firefighting & Prevention (2 | 1.7%), and Law Enforcement (2 | 1.7%).
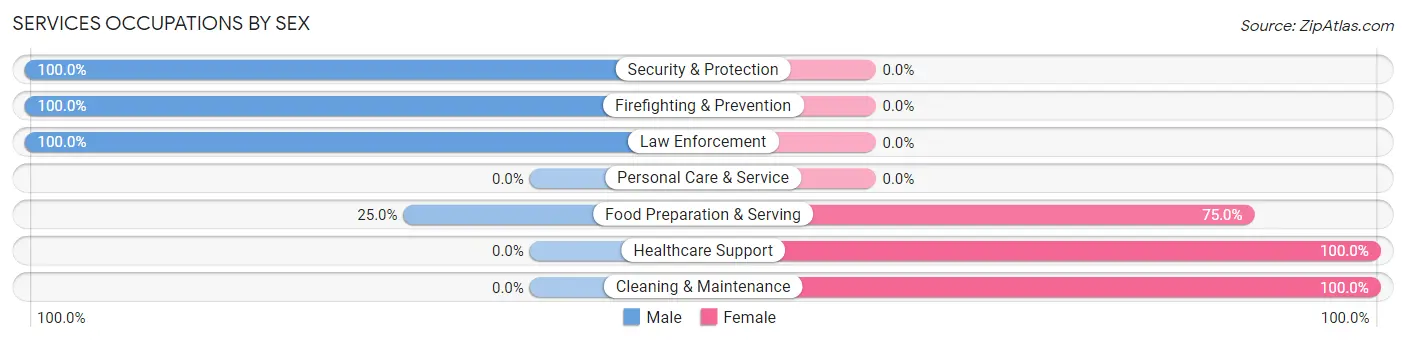
Services Occupations by Sex
Within the Services occupations in Gordon, the most male-oriented occupations are Security & Protection (100.0%), Firefighting & Prevention (100.0%), and Law Enforcement (100.0%), while the most female-oriented occupations are Healthcare Support (100.0%), Cleaning & Maintenance (100.0%), and Food Preparation & Serving (75.0%).
| Occupation | Male | Female |
| Healthcare Support | 0 (0.0%) | 1 (100.0%) |
| Security & Protection | 4 (100.0%) | 0 (0.0%) |
| Firefighting & Prevention | 2 (100.0%) | 0 (0.0%) |
| Law Enforcement | 2 (100.0%) | 0 (0.0%) |
| Food Preparation & Serving | 1 (25.0%) | 3 (75.0%) |
| Cleaning & Maintenance | 0 (0.0%) | 9 (100.0%) |
| Personal Care & Service | 0 (0.0%) | 0 (0.0%) |
| Total (Category) | 5 (27.8%) | 13 (72.2%) |
| Total (Overall) | 53 (43.8%) | 68 (56.2%) |
Sales and Office Occupations
The most common Sales and Office occupations in Gordon are Office & Administration (29 | 24.0%), and Sales & Related (17 | 14.1%).
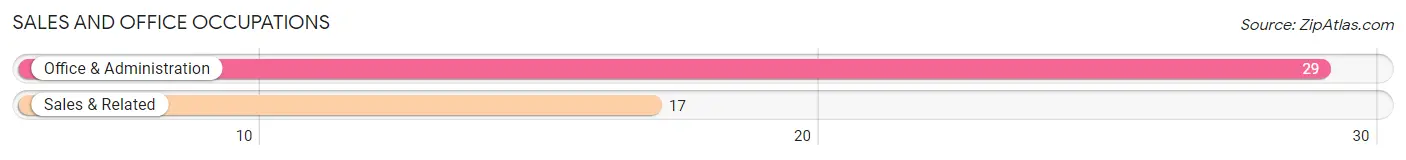
Sales and Office Occupations by Sex
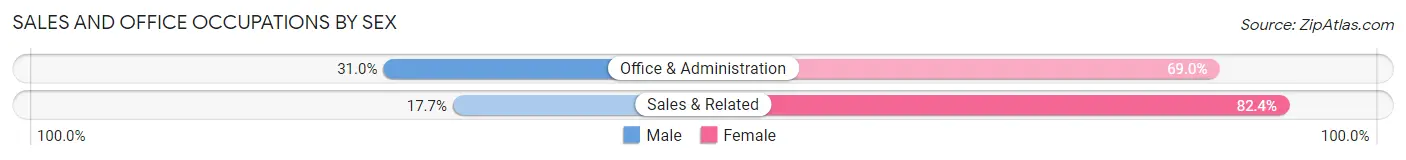
| Occupation | Male | Female |
| Sales & Related | 3 (17.6%) | 14 (82.4%) |
| Office & Administration | 9 (31.0%) | 20 (69.0%) |
| Total (Category) | 12 (26.1%) | 34 (73.9%) |
| Total (Overall) | 53 (43.8%) | 68 (56.2%) |
Natural Resources, Construction and Maintenance Occupations
The most common Natural Resources, Construction and Maintenance occupations in Gordon are Construction & Extraction (11 | 9.1%), and Installation, Maintenance & Repair (2 | 1.7%).
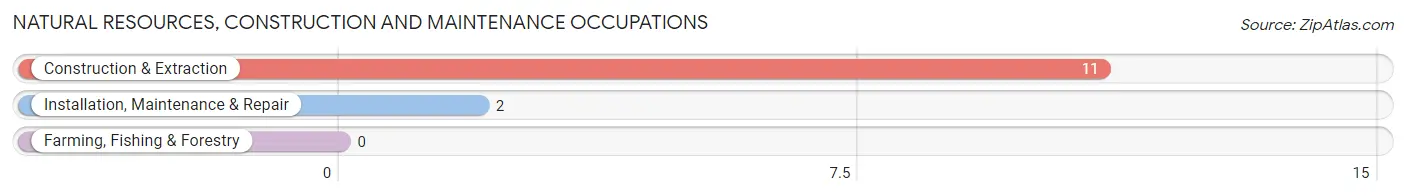
Natural Resources, Construction and Maintenance Occupations by Sex
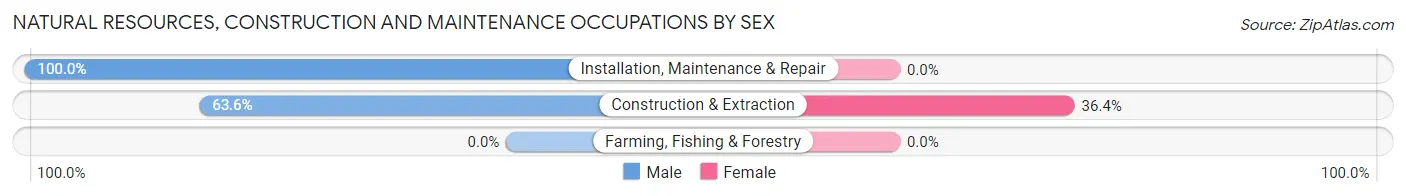
| Occupation | Male | Female |
| Farming, Fishing & Forestry | 0 (0.0%) | 0 (0.0%) |
| Construction & Extraction | 7 (63.6%) | 4 (36.4%) |
| Installation, Maintenance & Repair | 2 (100.0%) | 0 (0.0%) |
| Total (Category) | 9 (69.2%) | 4 (30.8%) |
| Total (Overall) | 53 (43.8%) | 68 (56.2%) |
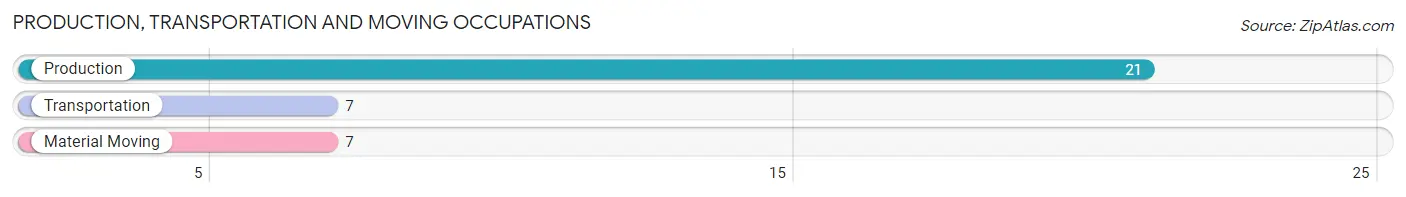
Production, Transportation and Moving Occupations
The most common Production, Transportation and Moving occupations in Gordon are Production (21 | 17.4%), Transportation (7 | 5.8%), and Material Moving (7 | 5.8%).
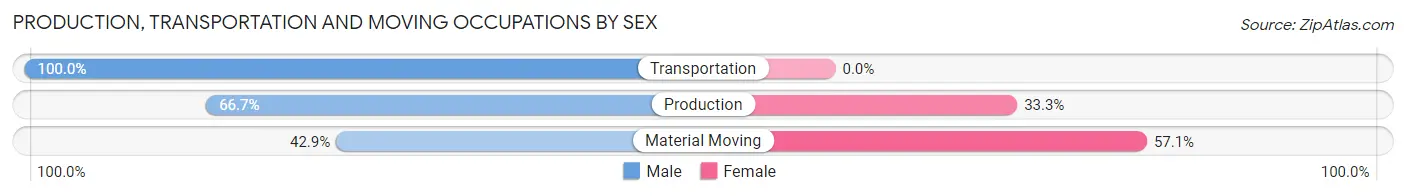
Production, Transportation and Moving Occupations by Sex
| Occupation | Male | Female |
| Production | 14 (66.7%) | 7 (33.3%) |
| Transportation | 7 (100.0%) | 0 (0.0%) |
| Material Moving | 3 (42.9%) | 4 (57.1%) |
| Total (Category) | 24 (68.6%) | 11 (31.4%) |
| Total (Overall) | 53 (43.8%) | 68 (56.2%) |
Employment Industries by Sex in Gordon
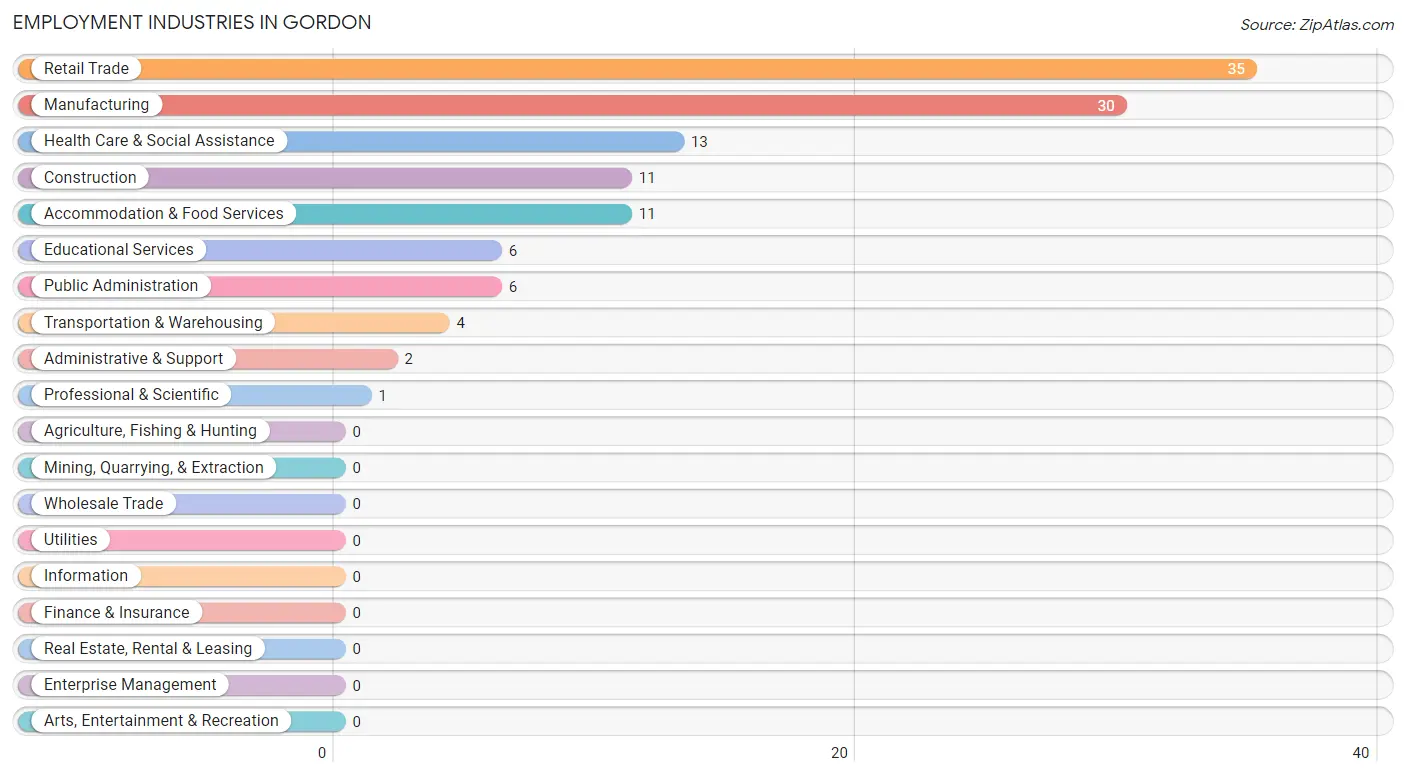
Employment Industries in Gordon
The major employment industries in Gordon include Retail Trade (35 | 28.9%), Manufacturing (30 | 24.8%), Health Care & Social Assistance (13 | 10.7%), Construction (11 | 9.1%), and Accommodation & Food Services (11 | 9.1%).
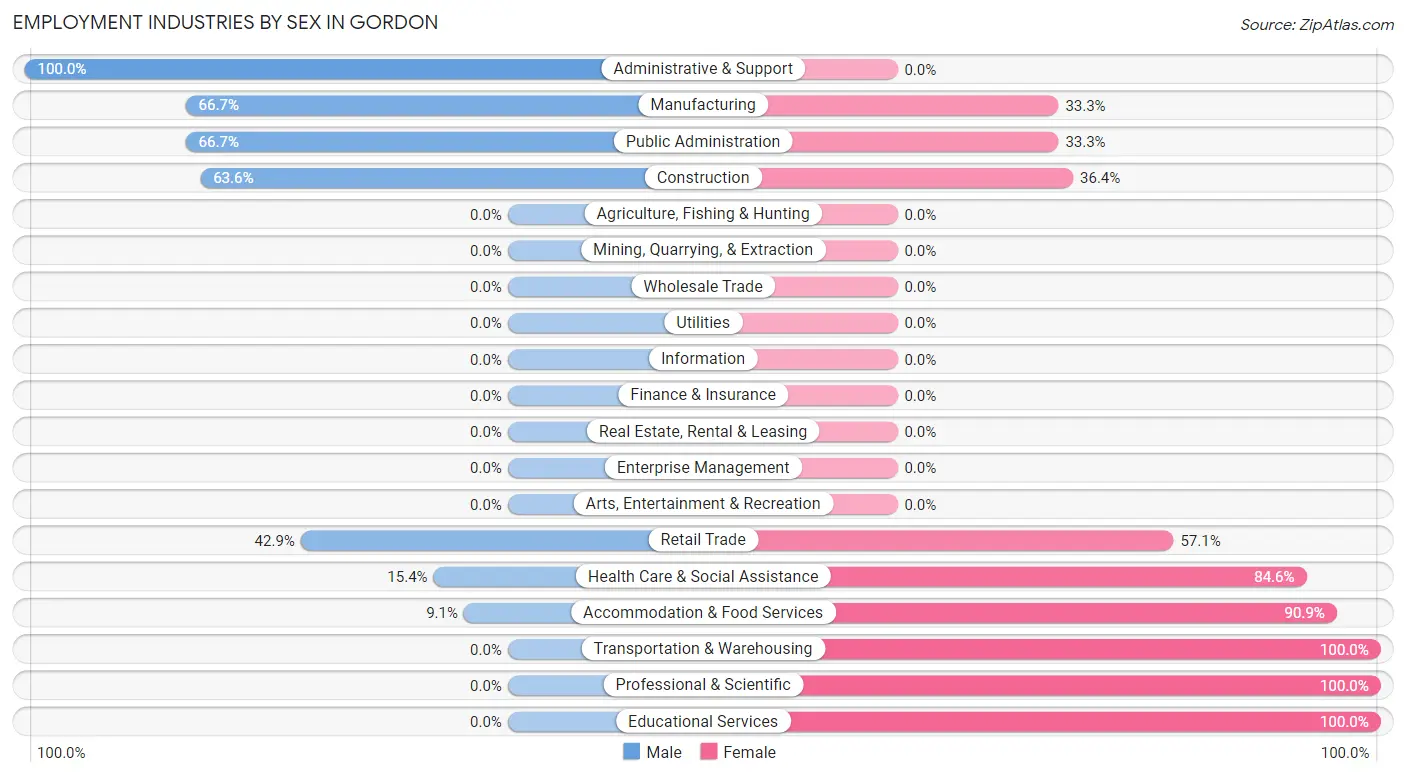
Employment Industries by Sex in Gordon
The Gordon industries that see more men than women are Administrative & Support (100.0%), Manufacturing (66.7%), and Public Administration (66.7%), whereas the industries that tend to have a higher number of women are Transportation & Warehousing (100.0%), Professional & Scientific (100.0%), and Educational Services (100.0%).
| Industry | Male | Female |
| Agriculture, Fishing & Hunting | 0 (0.0%) | 0 (0.0%) |
| Mining, Quarrying, & Extraction | 0 (0.0%) | 0 (0.0%) |
| Construction | 7 (63.6%) | 4 (36.4%) |
| Manufacturing | 20 (66.7%) | 10 (33.3%) |
| Wholesale Trade | 0 (0.0%) | 0 (0.0%) |
| Retail Trade | 15 (42.9%) | 20 (57.1%) |
| Transportation & Warehousing | 0 (0.0%) | 4 (100.0%) |
| Utilities | 0 (0.0%) | 0 (0.0%) |
| Information | 0 (0.0%) | 0 (0.0%) |
| Finance & Insurance | 0 (0.0%) | 0 (0.0%) |
| Real Estate, Rental & Leasing | 0 (0.0%) | 0 (0.0%) |
| Professional & Scientific | 0 (0.0%) | 1 (100.0%) |
| Enterprise Management | 0 (0.0%) | 0 (0.0%) |
| Administrative & Support | 2 (100.0%) | 0 (0.0%) |
| Educational Services | 0 (0.0%) | 6 (100.0%) |
| Health Care & Social Assistance | 2 (15.4%) | 11 (84.6%) |
| Arts, Entertainment & Recreation | 0 (0.0%) | 0 (0.0%) |
| Accommodation & Food Services | 1 (9.1%) | 10 (90.9%) |
| Public Administration | 4 (66.7%) | 2 (33.3%) |
| Total | 53 (43.8%) | 68 (56.2%) |
Education in Gordon
School Enrollment in Gordon
The most common levels of schooling among the 46 students in Gordon are college / undergraduate (33 | 71.7%), elementary school (6 | 13.0%), and middle school (4 | 8.7%).
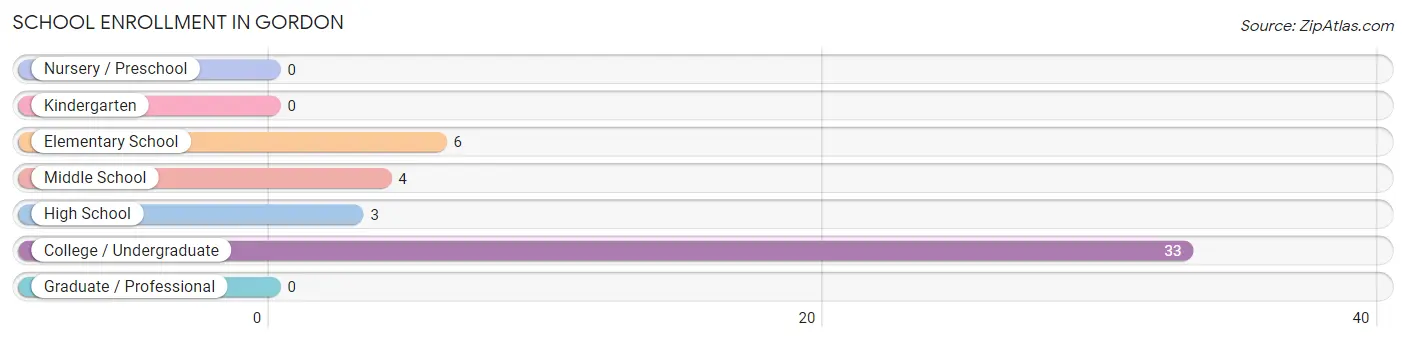
| School Level | # Students | % Students |
| Nursery / Preschool | 0 | 0.0% |
| Kindergarten | 0 | 0.0% |
| Elementary School | 6 | 13.0% |
| Middle School | 4 | 8.7% |
| High School | 3 | 6.5% |
| College / Undergraduate | 33 | 71.7% |
| Graduate / Professional | 0 | 0.0% |
| Total | 46 | 100.0% |
School Enrollment by Age by Funding Source in Gordon
Out of a total of 46 students who are enrolled in schools in Gordon, 1 (2.2%) attend a private institution, while the remaining 45 (97.8%) are enrolled in public schools. The age group of 10 to 14 year olds has the highest likelihood of being enrolled in private schools, with 1 (25.0% in the age bracket) enrolled. Conversely, the age group of 5 to 9 year old has the lowest likelihood of being enrolled in a private school, with 6 (100.0% in the age bracket) attending a public institution.
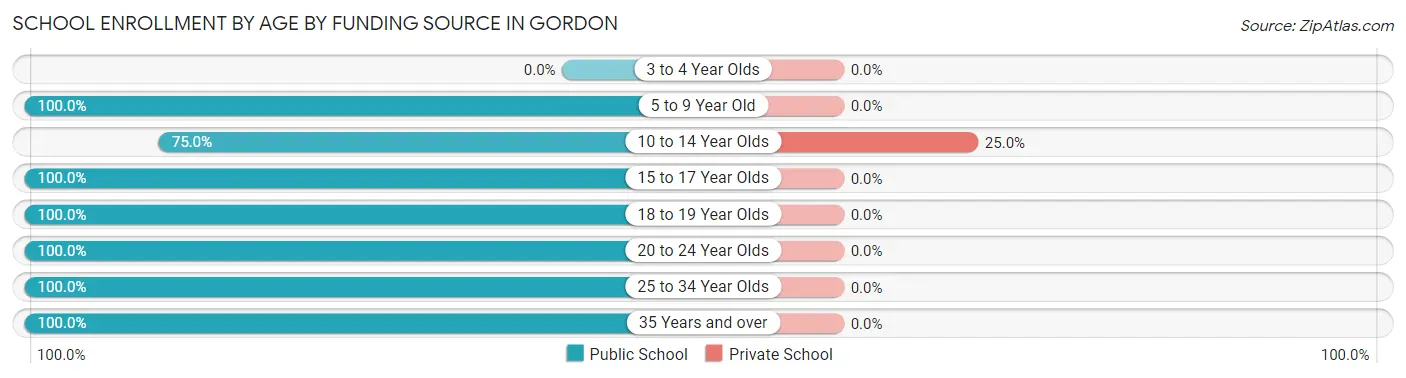
| Age Bracket | Public School | Private School |
| 3 to 4 Year Olds | 0 (0.0%) | 0 (0.0%) |
| 5 to 9 Year Old | 6 (100.0%) | 0 (0.0%) |
| 10 to 14 Year Olds | 3 (75.0%) | 1 (25.0%) |
| 15 to 17 Year Olds | 3 (100.0%) | 0 (0.0%) |
| 18 to 19 Year Olds | 8 (100.0%) | 0 (0.0%) |
| 20 to 24 Year Olds | 18 (100.0%) | 0 (0.0%) |
| 25 to 34 Year Olds | 3 (100.0%) | 0 (0.0%) |
| 35 Years and over | 4 (100.0%) | 0 (0.0%) |
| Total | 45 (97.8%) | 1 (2.2%) |
Educational Attainment by Field of Study in Gordon
Social sciences (2 | 25.0%), education (2 | 25.0%), communications (2 | 25.0%), and arts & humanities (2 | 25.0%) are the most common fields of study among 8 individuals in Gordon who have obtained a bachelor's degree or higher.
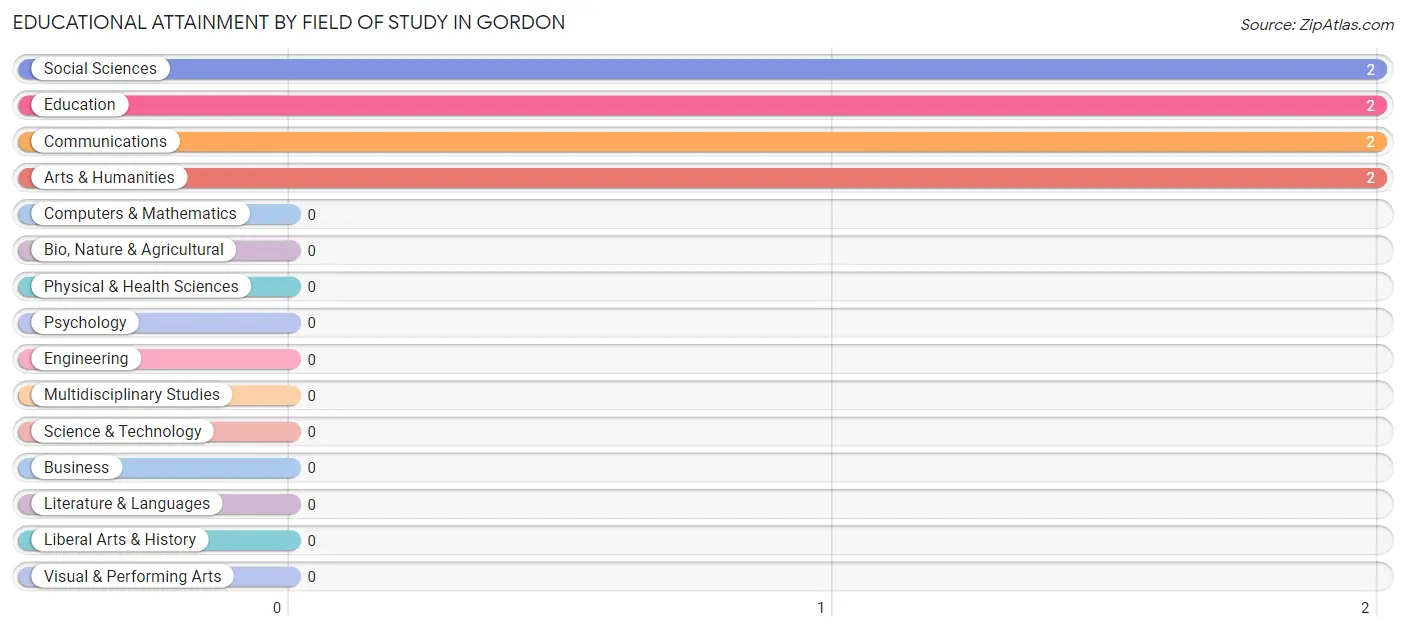
| Field of Study | # Graduates | % Graduates |
| Computers & Mathematics | 0 | 0.0% |
| Bio, Nature & Agricultural | 0 | 0.0% |
| Physical & Health Sciences | 0 | 0.0% |
| Psychology | 0 | 0.0% |
| Social Sciences | 2 | 25.0% |
| Engineering | 0 | 0.0% |
| Multidisciplinary Studies | 0 | 0.0% |
| Science & Technology | 0 | 0.0% |
| Business | 0 | 0.0% |
| Education | 2 | 25.0% |
| Literature & Languages | 0 | 0.0% |
| Liberal Arts & History | 0 | 0.0% |
| Visual & Performing Arts | 0 | 0.0% |
| Communications | 2 | 25.0% |
| Arts & Humanities | 2 | 25.0% |
| Total | 8 | 100.0% |
Transportation & Commute in Gordon
Vehicle Availability by Sex in Gordon
The most prevalent vehicle ownership categories in Gordon are males with 5 or more vehicles (22, accounting for 46.8%) and females with 5 or more vehicles (10, making up 32.4%).
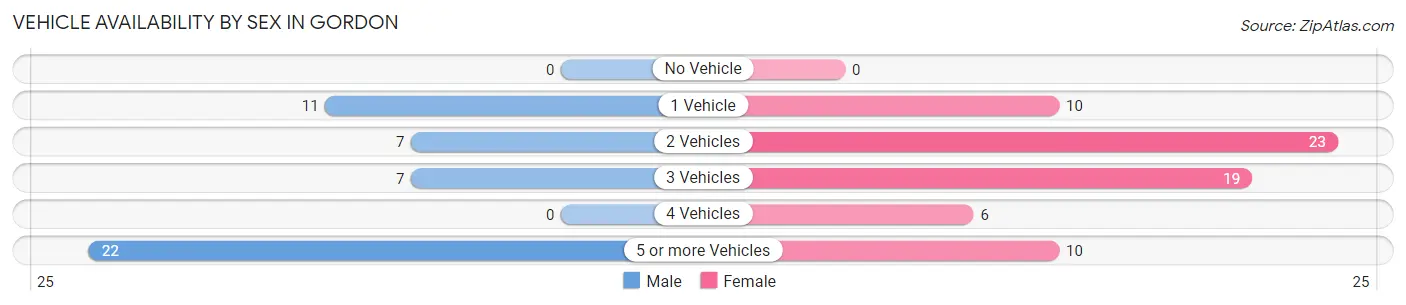
| Vehicles Available | Male | Female |
| No Vehicle | 0 (0.0%) | 0 (0.0%) |
| 1 Vehicle | 11 (23.4%) | 10 (14.7%) |
| 2 Vehicles | 7 (14.9%) | 23 (33.8%) |
| 3 Vehicles | 7 (14.9%) | 19 (27.9%) |
| 4 Vehicles | 0 (0.0%) | 6 (8.8%) |
| 5 or more Vehicles | 22 (46.8%) | 10 (14.7%) |
| Total | 47 (100.0%) | 68 (100.0%) |
Commute Time in Gordon
The most frequently occuring commute durations in Gordon are 30 to 34 minutes (46 commuters, 40.0%), 25 to 29 minutes (14 commuters, 12.2%), and 45 to 59 minutes (13 commuters, 11.3%).
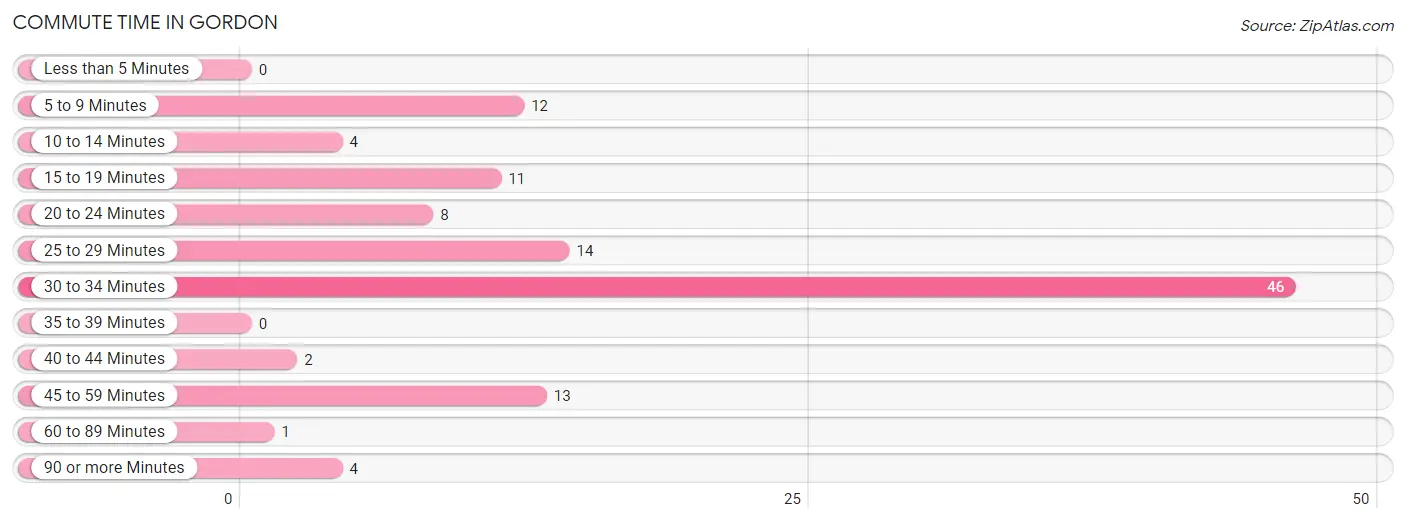
| Commute Time | # Commuters | % Commuters |
| Less than 5 Minutes | 0 | 0.0% |
| 5 to 9 Minutes | 12 | 10.4% |
| 10 to 14 Minutes | 4 | 3.5% |
| 15 to 19 Minutes | 11 | 9.6% |
| 20 to 24 Minutes | 8 | 7.0% |
| 25 to 29 Minutes | 14 | 12.2% |
| 30 to 34 Minutes | 46 | 40.0% |
| 35 to 39 Minutes | 0 | 0.0% |
| 40 to 44 Minutes | 2 | 1.7% |
| 45 to 59 Minutes | 13 | 11.3% |
| 60 to 89 Minutes | 1 | 0.9% |
| 90 or more Minutes | 4 | 3.5% |
Commute Time by Sex in Gordon
The most common commute times in Gordon are 45 to 59 minutes (13 commuters, 27.7%) for males and 30 to 34 minutes (37 commuters, 54.4%) for females.
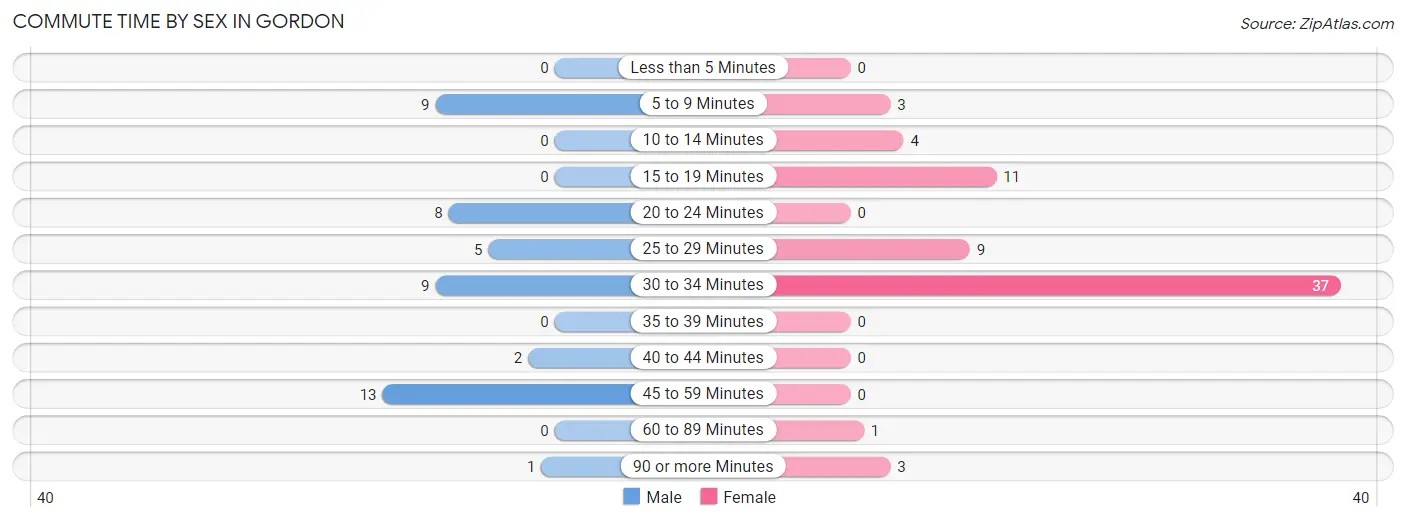
| Commute Time | Male | Female |
| Less than 5 Minutes | 0 (0.0%) | 0 (0.0%) |
| 5 to 9 Minutes | 9 (19.2%) | 3 (4.4%) |
| 10 to 14 Minutes | 0 (0.0%) | 4 (5.9%) |
| 15 to 19 Minutes | 0 (0.0%) | 11 (16.2%) |
| 20 to 24 Minutes | 8 (17.0%) | 0 (0.0%) |
| 25 to 29 Minutes | 5 (10.6%) | 9 (13.2%) |
| 30 to 34 Minutes | 9 (19.2%) | 37 (54.4%) |
| 35 to 39 Minutes | 0 (0.0%) | 0 (0.0%) |
| 40 to 44 Minutes | 2 (4.3%) | 0 (0.0%) |
| 45 to 59 Minutes | 13 (27.7%) | 0 (0.0%) |
| 60 to 89 Minutes | 0 (0.0%) | 1 (1.5%) |
| 90 or more Minutes | 1 (2.1%) | 3 (4.4%) |
Time of Departure to Work by Sex in Gordon
The most frequent times of departure to work in Gordon are 12:00 AM to 4:59 AM (18, 38.3%) for males and 5:00 AM to 5:29 AM (15, 22.1%) for females.
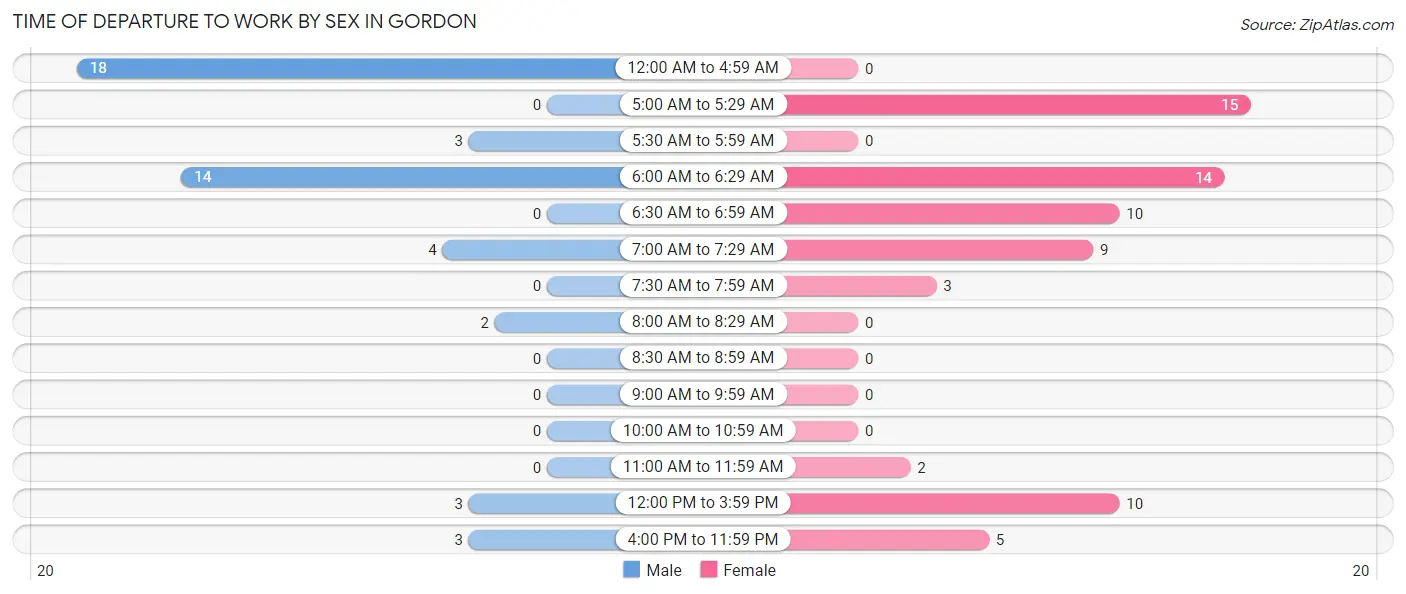
| Time of Departure | Male | Female |
| 12:00 AM to 4:59 AM | 18 (38.3%) | 0 (0.0%) |
| 5:00 AM to 5:29 AM | 0 (0.0%) | 15 (22.1%) |
| 5:30 AM to 5:59 AM | 3 (6.4%) | 0 (0.0%) |
| 6:00 AM to 6:29 AM | 14 (29.8%) | 14 (20.6%) |
| 6:30 AM to 6:59 AM | 0 (0.0%) | 10 (14.7%) |
| 7:00 AM to 7:29 AM | 4 (8.5%) | 9 (13.2%) |
| 7:30 AM to 7:59 AM | 0 (0.0%) | 3 (4.4%) |
| 8:00 AM to 8:29 AM | 2 (4.3%) | 0 (0.0%) |
| 8:30 AM to 8:59 AM | 0 (0.0%) | 0 (0.0%) |
| 9:00 AM to 9:59 AM | 0 (0.0%) | 0 (0.0%) |
| 10:00 AM to 10:59 AM | 0 (0.0%) | 0 (0.0%) |
| 11:00 AM to 11:59 AM | 0 (0.0%) | 2 (2.9%) |
| 12:00 PM to 3:59 PM | 3 (6.4%) | 10 (14.7%) |
| 4:00 PM to 11:59 PM | 3 (6.4%) | 5 (7.3%) |
| Total | 47 (100.0%) | 68 (100.0%) |
Housing Occupancy in Gordon
Occupancy by Ownership in Gordon
Of the total 158 dwellings in Gordon, owner-occupied units account for 84 (53.2%), while renter-occupied units make up 74 (46.8%).
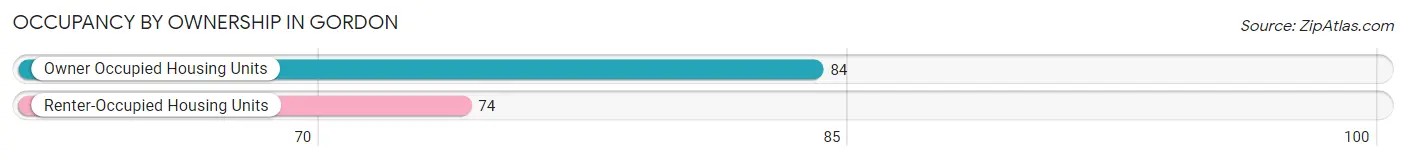
| Occupancy | # Housing Units | % Housing Units |
| Owner Occupied Housing Units | 84 | 53.2% |
| Renter-Occupied Housing Units | 74 | 46.8% |
| Total Occupied Housing Units | 158 | 100.0% |
Occupancy by Household Size in Gordon
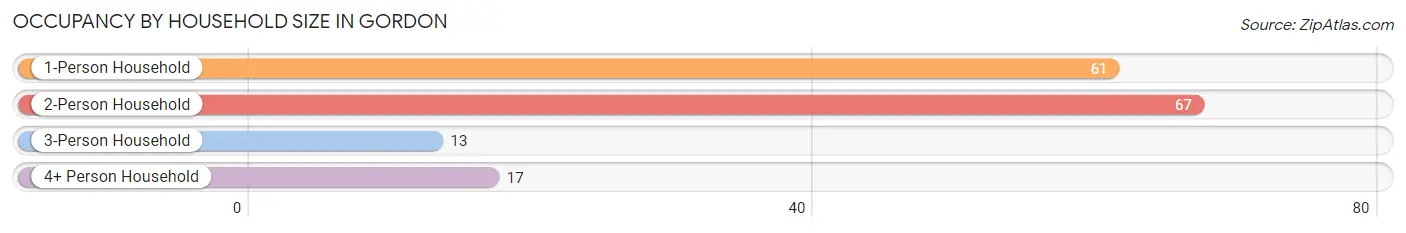
| Household Size | # Housing Units | % Housing Units |
| 1-Person Household | 61 | 38.6% |
| 2-Person Household | 67 | 42.4% |
| 3-Person Household | 13 | 8.2% |
| 4+ Person Household | 17 | 10.8% |
| Total Housing Units | 158 | 100.0% |
Occupancy by Ownership by Household Size in Gordon
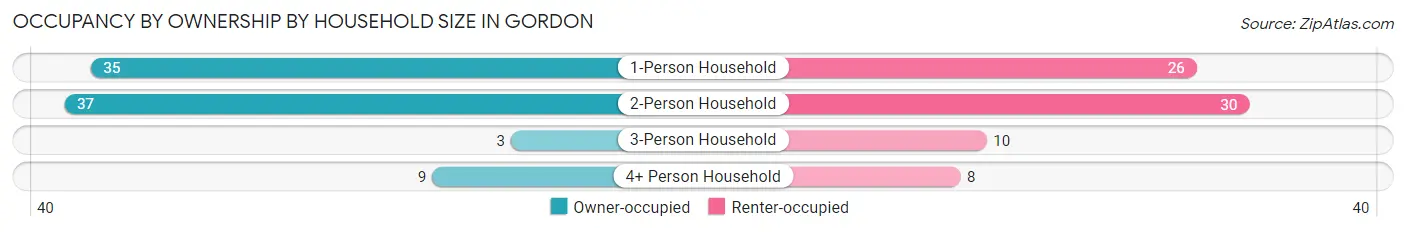
| Household Size | Owner-occupied | Renter-occupied |
| 1-Person Household | 35 (57.4%) | 26 (42.6%) |
| 2-Person Household | 37 (55.2%) | 30 (44.8%) |
| 3-Person Household | 3 (23.1%) | 10 (76.9%) |
| 4+ Person Household | 9 (52.9%) | 8 (47.1%) |
| Total Housing Units | 84 (53.2%) | 74 (46.8%) |
Occupancy by Educational Attainment in Gordon
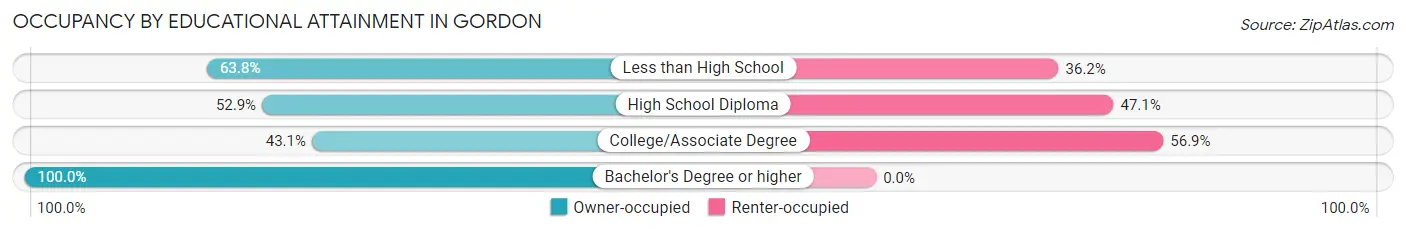
| Household Size | Owner-occupied | Renter-occupied |
| Less than High School | 30 (63.8%) | 17 (36.2%) |
| High School Diploma | 18 (52.9%) | 16 (47.1%) |
| College/Associate Degree | 31 (43.1%) | 41 (56.9%) |
| Bachelor's Degree or higher | 5 (100.0%) | 0 (0.0%) |
Occupancy by Age of Householder in Gordon

| Age Bracket | # Households | % Households |
| Under 35 Years | 15 | 9.5% |
| 35 to 44 Years | 4 | 2.5% |
| 45 to 54 Years | 35 | 22.2% |
| 55 to 64 Years | 59 | 37.3% |
| 65 to 74 Years | 29 | 18.3% |
| 75 to 84 Years | 9 | 5.7% |
| 85 Years and Over | 7 | 4.4% |
| Total | 158 | 100.0% |
Housing Finances in Gordon
Median Income by Occupancy in Gordon
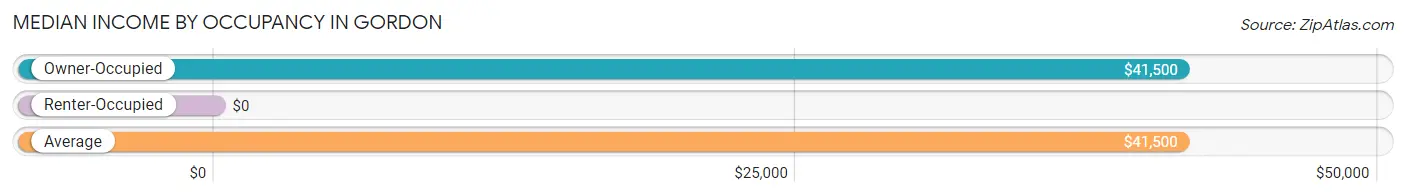
| Occupancy Type | # Households | Median Income |
| Owner-Occupied | 84 (53.2%) | $41,500 |
| Renter-Occupied | 74 (46.8%) | $0 |
| Average | 158 (100.0%) | $41,500 |
Occupancy by Householder Income Bracket in Gordon
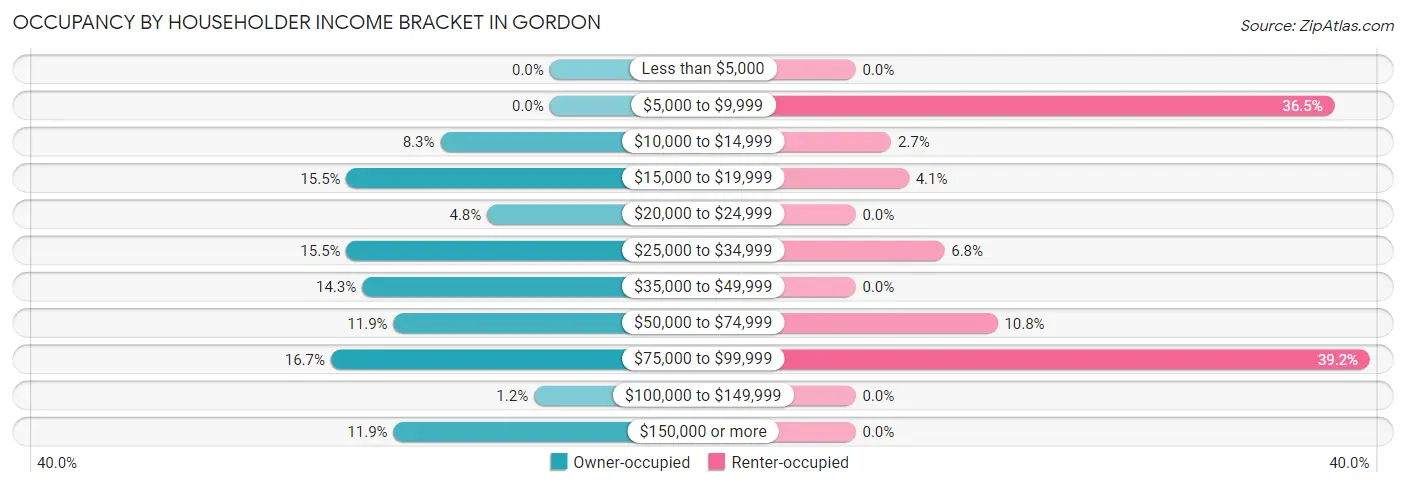
| Income Bracket | Owner-occupied | Renter-occupied |
| Less than $5,000 | 0 (0.0%) | 0 (0.0%) |
| $5,000 to $9,999 | 0 (0.0%) | 27 (36.5%) |
| $10,000 to $14,999 | 7 (8.3%) | 2 (2.7%) |
| $15,000 to $19,999 | 13 (15.5%) | 3 (4.1%) |
| $20,000 to $24,999 | 4 (4.8%) | 0 (0.0%) |
| $25,000 to $34,999 | 13 (15.5%) | 5 (6.8%) |
| $35,000 to $49,999 | 12 (14.3%) | 0 (0.0%) |
| $50,000 to $74,999 | 10 (11.9%) | 8 (10.8%) |
| $75,000 to $99,999 | 14 (16.7%) | 29 (39.2%) |
| $100,000 to $149,999 | 1 (1.2%) | 0 (0.0%) |
| $150,000 or more | 10 (11.9%) | 0 (0.0%) |
| Total | 84 (100.0%) | 74 (100.0%) |
Monthly Housing Cost Tiers in Gordon
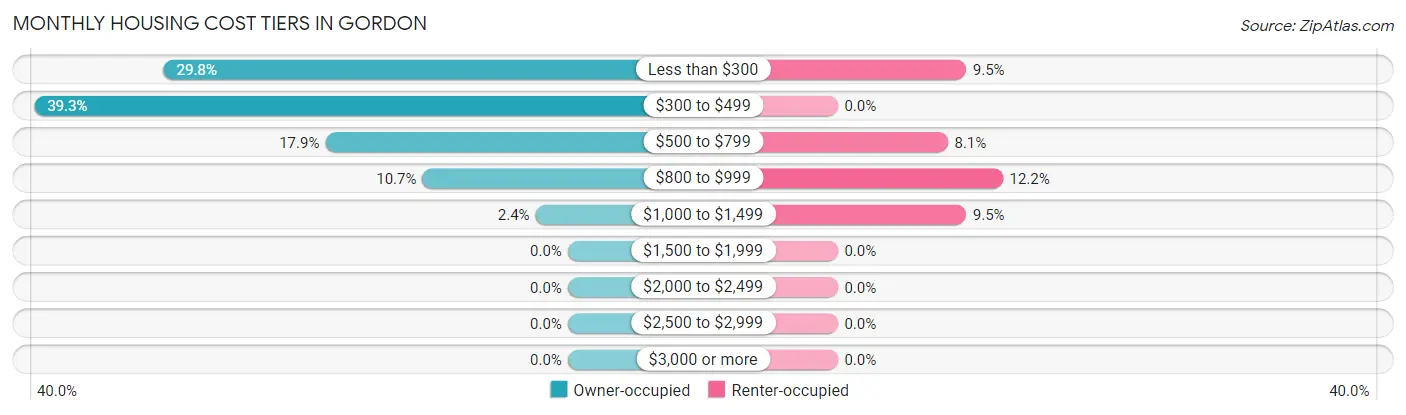
| Monthly Cost | Owner-occupied | Renter-occupied |
| Less than $300 | 25 (29.8%) | 7 (9.5%) |
| $300 to $499 | 33 (39.3%) | 0 (0.0%) |
| $500 to $799 | 15 (17.9%) | 6 (8.1%) |
| $800 to $999 | 9 (10.7%) | 9 (12.2%) |
| $1,000 to $1,499 | 2 (2.4%) | 7 (9.5%) |
| $1,500 to $1,999 | 0 (0.0%) | 0 (0.0%) |
| $2,000 to $2,499 | 0 (0.0%) | 0 (0.0%) |
| $2,500 to $2,999 | 0 (0.0%) | 0 (0.0%) |
| $3,000 or more | 0 (0.0%) | 0 (0.0%) |
| Total | 84 (100.0%) | 74 (100.0%) |
Physical Housing Characteristics in Gordon
Housing Structures in Gordon
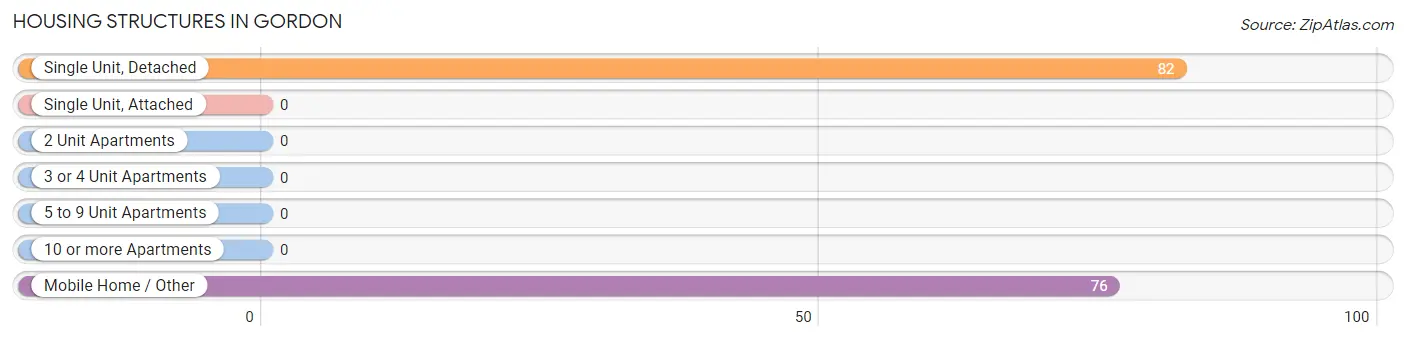
| Structure Type | # Housing Units | % Housing Units |
| Single Unit, Detached | 82 | 51.9% |
| Single Unit, Attached | 0 | 0.0% |
| 2 Unit Apartments | 0 | 0.0% |
| 3 or 4 Unit Apartments | 0 | 0.0% |
| 5 to 9 Unit Apartments | 0 | 0.0% |
| 10 or more Apartments | 0 | 0.0% |
| Mobile Home / Other | 76 | 48.1% |
| Total | 158 | 100.0% |
Housing Structures by Occupancy in Gordon
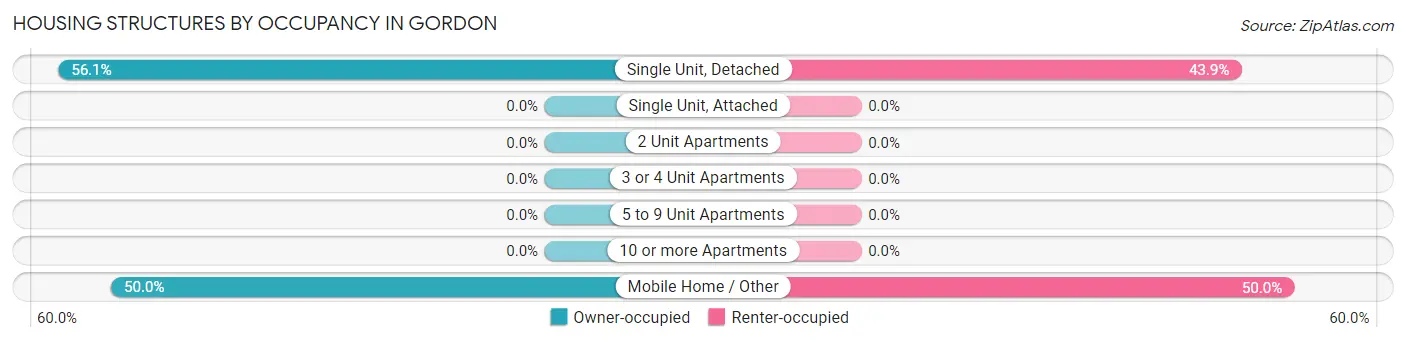
| Structure Type | Owner-occupied | Renter-occupied |
| Single Unit, Detached | 46 (56.1%) | 36 (43.9%) |
| Single Unit, Attached | 0 (0.0%) | 0 (0.0%) |
| 2 Unit Apartments | 0 (0.0%) | 0 (0.0%) |
| 3 or 4 Unit Apartments | 0 (0.0%) | 0 (0.0%) |
| 5 to 9 Unit Apartments | 0 (0.0%) | 0 (0.0%) |
| 10 or more Apartments | 0 (0.0%) | 0 (0.0%) |
| Mobile Home / Other | 38 (50.0%) | 38 (50.0%) |
| Total | 84 (53.2%) | 74 (46.8%) |
Housing Structures by Number of Rooms in Gordon
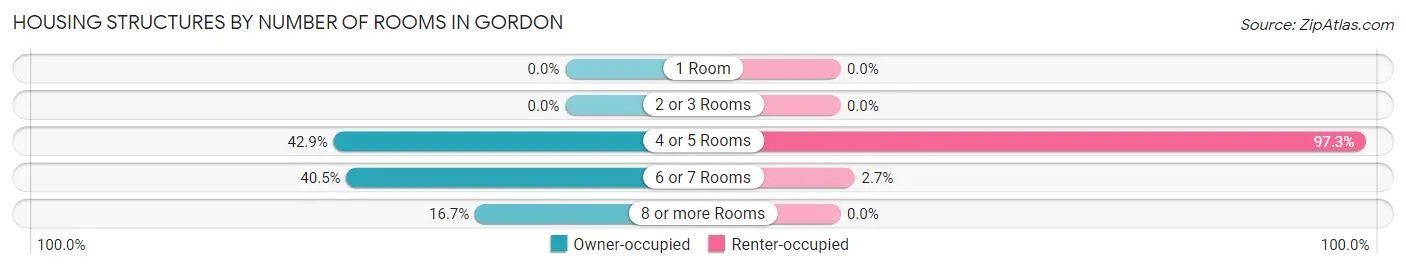
| Number of Rooms | Owner-occupied | Renter-occupied |
| 1 Room | 0 (0.0%) | 0 (0.0%) |
| 2 or 3 Rooms | 0 (0.0%) | 0 (0.0%) |
| 4 or 5 Rooms | 36 (42.9%) | 72 (97.3%) |
| 6 or 7 Rooms | 34 (40.5%) | 2 (2.7%) |
| 8 or more Rooms | 14 (16.7%) | 0 (0.0%) |
| Total | 84 (100.0%) | 74 (100.0%) |
Housing Structure by Heating Type in Gordon
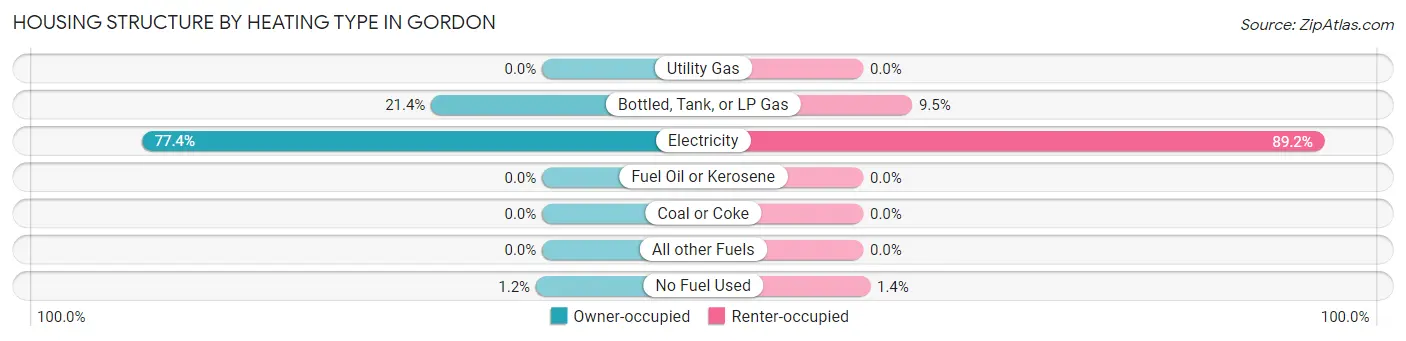
| Heating Type | Owner-occupied | Renter-occupied |
| Utility Gas | 0 (0.0%) | 0 (0.0%) |
| Bottled, Tank, or LP Gas | 18 (21.4%) | 7 (9.5%) |
| Electricity | 65 (77.4%) | 66 (89.2%) |
| Fuel Oil or Kerosene | 0 (0.0%) | 0 (0.0%) |
| Coal or Coke | 0 (0.0%) | 0 (0.0%) |
| All other Fuels | 0 (0.0%) | 0 (0.0%) |
| No Fuel Used | 1 (1.2%) | 1 (1.3%) |
| Total | 84 (100.0%) | 74 (100.0%) |
Household Vehicle Usage in Gordon
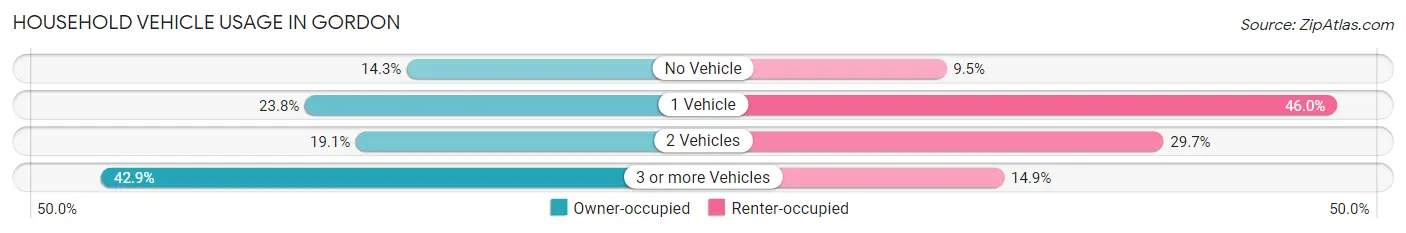
| Vehicles per Household | Owner-occupied | Renter-occupied |
| No Vehicle | 12 (14.3%) | 7 (9.5%) |
| 1 Vehicle | 20 (23.8%) | 34 (46.0%) |
| 2 Vehicles | 16 (19.1%) | 22 (29.7%) |
| 3 or more Vehicles | 36 (42.9%) | 11 (14.9%) |
| Total | 84 (100.0%) | 74 (100.0%) |
Real Estate & Mortgages in Gordon
Real Estate and Mortgage Overview in Gordon
| Characteristic | Without Mortgage | With Mortgage |
| Housing Units | 67 | 17 |
| Median Property Value | - | - |
| Median Household Income | $41,750 | $3 |
| Monthly Housing Costs | $370 | $0 |
| Real Estate Taxes | $199 | $2 |
Property Value by Mortgage Status in Gordon
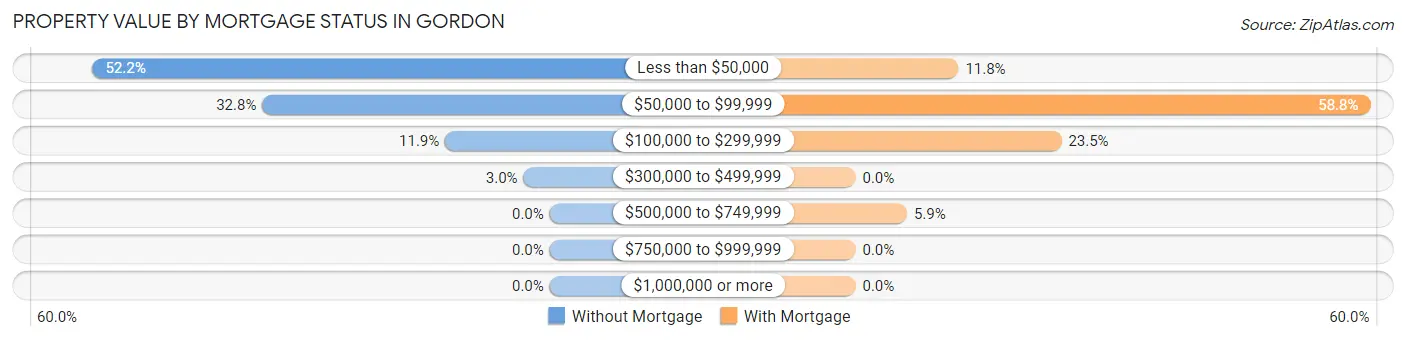
| Property Value | Without Mortgage | With Mortgage |
| Less than $50,000 | 35 (52.2%) | 2 (11.8%) |
| $50,000 to $99,999 | 22 (32.8%) | 10 (58.8%) |
| $100,000 to $299,999 | 8 (11.9%) | 4 (23.5%) |
| $300,000 to $499,999 | 2 (3.0%) | 0 (0.0%) |
| $500,000 to $749,999 | 0 (0.0%) | 1 (5.9%) |
| $750,000 to $999,999 | 0 (0.0%) | 0 (0.0%) |
| $1,000,000 or more | 0 (0.0%) | 0 (0.0%) |
| Total | 67 (100.0%) | 17 (100.0%) |
Household Income by Mortgage Status in Gordon
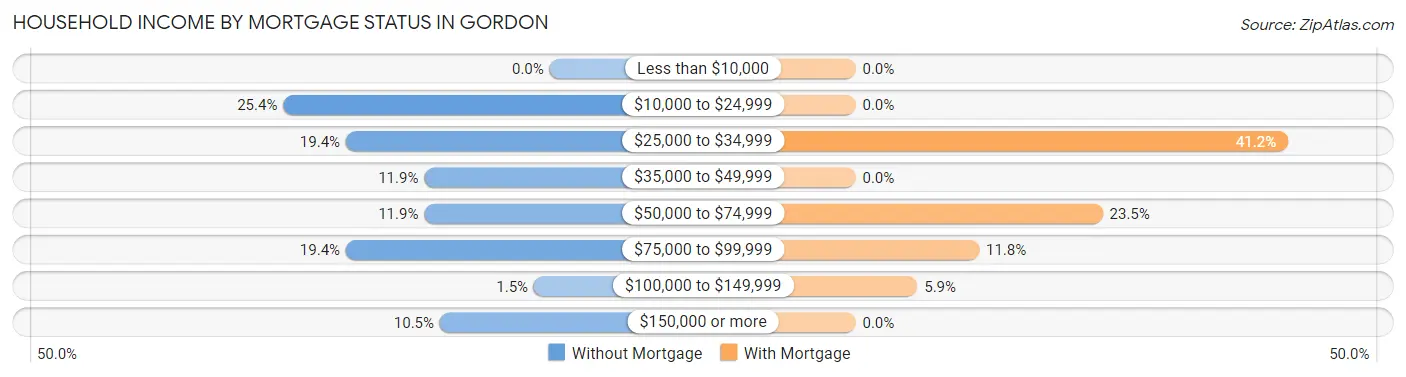
| Household Income | Without Mortgage | With Mortgage |
| Less than $10,000 | 0 (0.0%) | 0 (0.0%) |
| $10,000 to $24,999 | 17 (25.4%) | 0 (0.0%) |
| $25,000 to $34,999 | 13 (19.4%) | 7 (41.2%) |
| $35,000 to $49,999 | 8 (11.9%) | 0 (0.0%) |
| $50,000 to $74,999 | 8 (11.9%) | 4 (23.5%) |
| $75,000 to $99,999 | 13 (19.4%) | 2 (11.8%) |
| $100,000 to $149,999 | 1 (1.5%) | 1 (5.9%) |
| $150,000 or more | 7 (10.4%) | 0 (0.0%) |
| Total | 67 (100.0%) | 17 (100.0%) |
Property Value to Household Income Ratio in Gordon
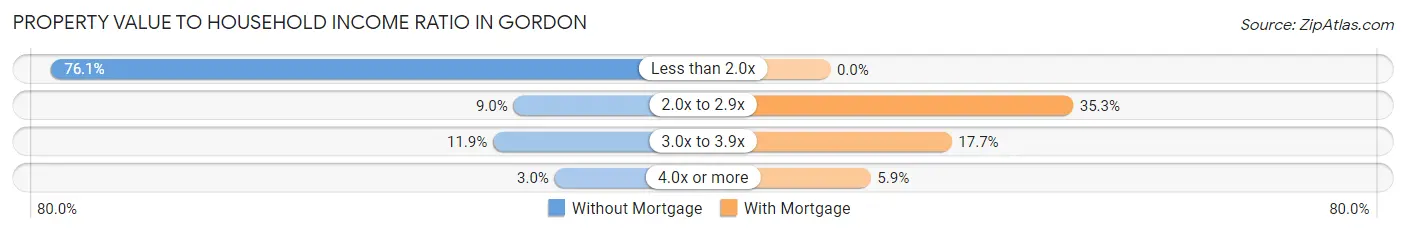
| Value-to-Income Ratio | Without Mortgage | With Mortgage |
| Less than 2.0x | 51 (76.1%) | 0 (0.0%) |
| 2.0x to 2.9x | 6 (9.0%) | 6 (35.3%) |
| 3.0x to 3.9x | 8 (11.9%) | 3 (17.6%) |
| 4.0x or more | 2 (3.0%) | 1 (5.9%) |
| Total | 67 (100.0%) | 17 (100.0%) |
Real Estate Taxes by Mortgage Status in Gordon
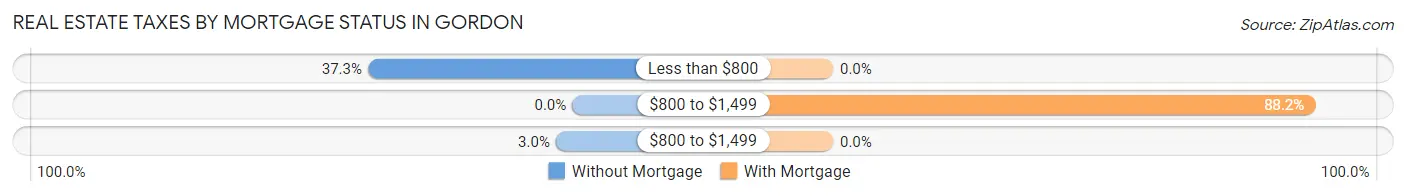
| Property Taxes | Without Mortgage | With Mortgage |
| Less than $800 | 25 (37.3%) | 0 (0.0%) |
| $800 to $1,499 | 0 (0.0%) | 15 (88.2%) |
| $800 to $1,499 | 2 (3.0%) | 0 (0.0%) |
| Total | 67 (100.0%) | 17 (100.0%) |
Health & Disability in Gordon
Health Insurance Coverage by Age in Gordon
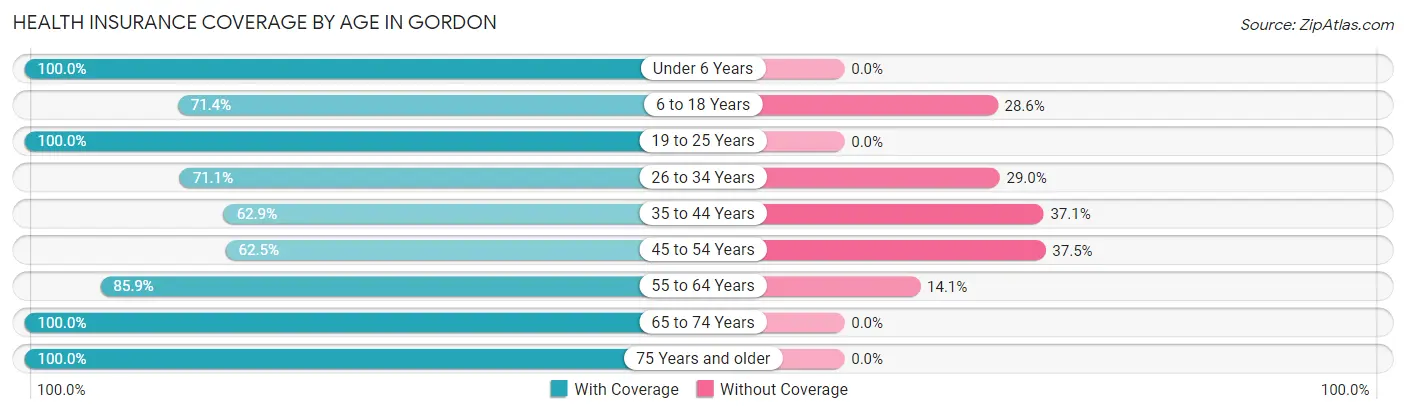
| Age Bracket | With Coverage | Without Coverage |
| Under 6 Years | 1 (100.0%) | 0 (0.0%) |
| 6 to 18 Years | 15 (71.4%) | 6 (28.6%) |
| 19 to 25 Years | 24 (100.0%) | 0 (0.0%) |
| 26 to 34 Years | 27 (71.1%) | 11 (28.9%) |
| 35 to 44 Years | 22 (62.9%) | 13 (37.1%) |
| 45 to 54 Years | 35 (62.5%) | 21 (37.5%) |
| 55 to 64 Years | 85 (85.9%) | 14 (14.1%) |
| 65 to 74 Years | 63 (100.0%) | 0 (0.0%) |
| 75 Years and older | 19 (100.0%) | 0 (0.0%) |
| Total | 291 (81.7%) | 65 (18.3%) |
Health Insurance Coverage by Citizenship Status in Gordon
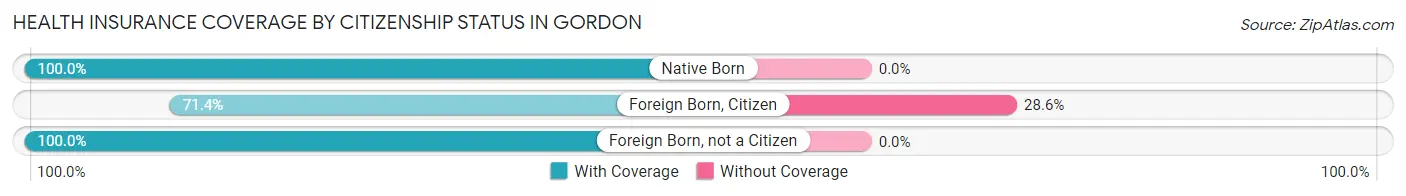
| Citizenship Status | With Coverage | Without Coverage |
| Native Born | 1 (100.0%) | 0 (0.0%) |
| Foreign Born, Citizen | 15 (71.4%) | 6 (28.6%) |
| Foreign Born, not a Citizen | 24 (100.0%) | 0 (0.0%) |
Health Insurance Coverage by Household Income in Gordon
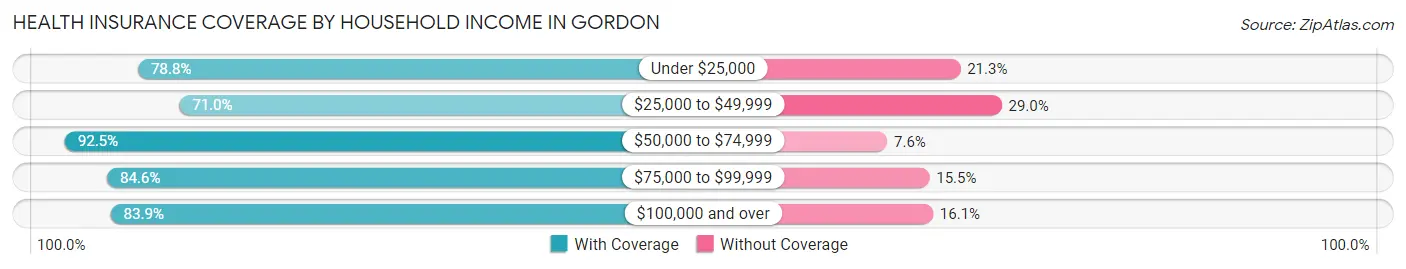
| Household Income | With Coverage | Without Coverage |
| Under $25,000 | 63 (78.7%) | 17 (21.2%) |
| $25,000 to $49,999 | 49 (71.0%) | 20 (29.0%) |
| $50,000 to $74,999 | 49 (92.4%) | 4 (7.5%) |
| $75,000 to $99,999 | 104 (84.6%) | 19 (15.4%) |
| $100,000 and over | 26 (83.9%) | 5 (16.1%) |
Public vs Private Health Insurance Coverage by Age in Gordon
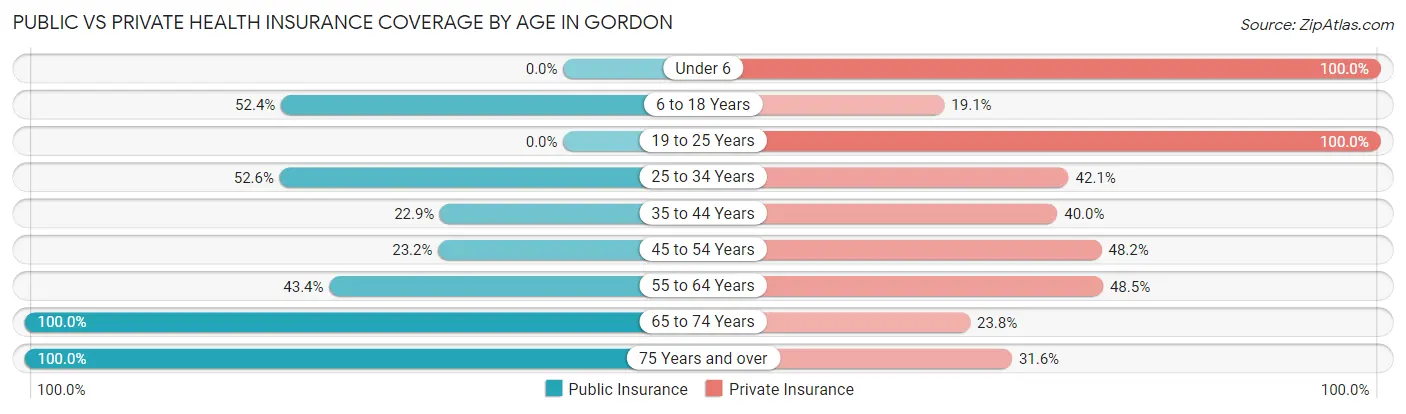
| Age Bracket | Public Insurance | Private Insurance |
| Under 6 | 0 (0.0%) | 1 (100.0%) |
| 6 to 18 Years | 11 (52.4%) | 4 (19.1%) |
| 19 to 25 Years | 0 (0.0%) | 24 (100.0%) |
| 25 to 34 Years | 20 (52.6%) | 16 (42.1%) |
| 35 to 44 Years | 8 (22.9%) | 14 (40.0%) |
| 45 to 54 Years | 13 (23.2%) | 27 (48.2%) |
| 55 to 64 Years | 43 (43.4%) | 48 (48.5%) |
| 65 to 74 Years | 63 (100.0%) | 15 (23.8%) |
| 75 Years and over | 19 (100.0%) | 6 (31.6%) |
| Total | 177 (49.7%) | 155 (43.5%) |
Disability Status by Sex by Age in Gordon
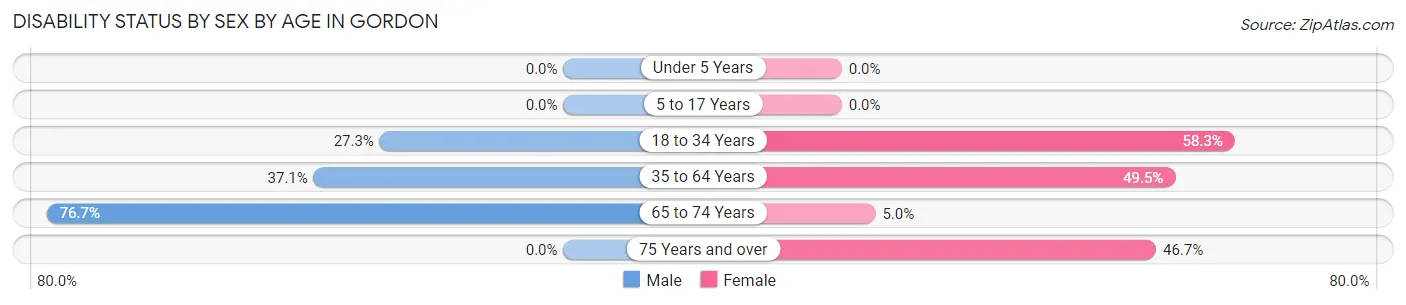
| Age Bracket | Male | Female |
| Under 5 Years | 0 (0.0%) | 0 (0.0%) |
| 5 to 17 Years | 0 (0.0%) | 0 (0.0%) |
| 18 to 34 Years | 6 (27.3%) | 28 (58.3%) |
| 35 to 64 Years | 33 (37.1%) | 50 (49.5%) |
| 65 to 74 Years | 33 (76.7%) | 1 (5.0%) |
| 75 Years and over | 0 (0.0%) | 7 (46.7%) |
Disability Class by Sex by Age in Gordon
Disability Class: Hearing Difficulty
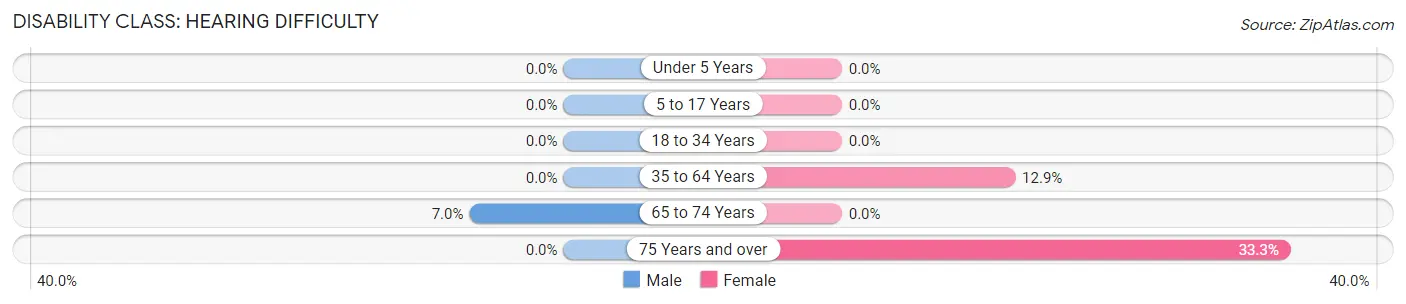
| Age Bracket | Male | Female |
| Under 5 Years | 0 (0.0%) | 0 (0.0%) |
| 5 to 17 Years | 0 (0.0%) | 0 (0.0%) |
| 18 to 34 Years | 0 (0.0%) | 0 (0.0%) |
| 35 to 64 Years | 0 (0.0%) | 13 (12.9%) |
| 65 to 74 Years | 3 (7.0%) | 0 (0.0%) |
| 75 Years and over | 0 (0.0%) | 5 (33.3%) |
Disability Class: Vision Difficulty
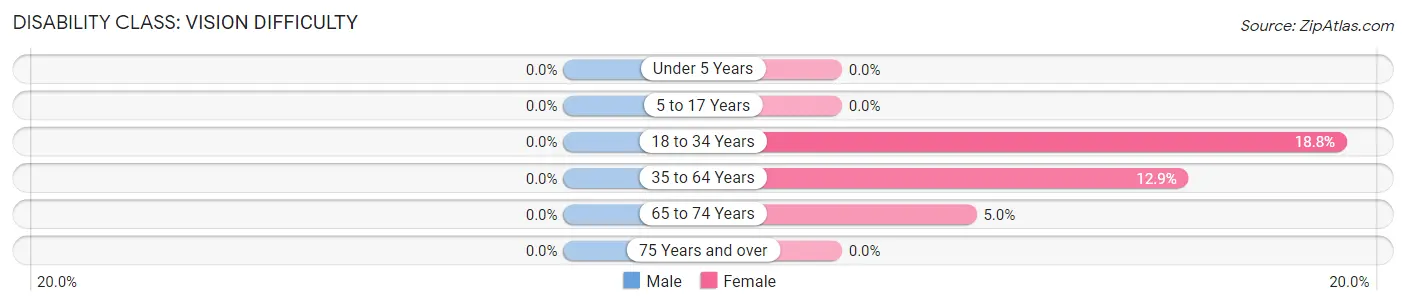
| Age Bracket | Male | Female |
| Under 5 Years | 0 (0.0%) | 0 (0.0%) |
| 5 to 17 Years | 0 (0.0%) | 0 (0.0%) |
| 18 to 34 Years | 0 (0.0%) | 9 (18.8%) |
| 35 to 64 Years | 0 (0.0%) | 13 (12.9%) |
| 65 to 74 Years | 0 (0.0%) | 1 (5.0%) |
| 75 Years and over | 0 (0.0%) | 0 (0.0%) |
Disability Class: Cognitive Difficulty
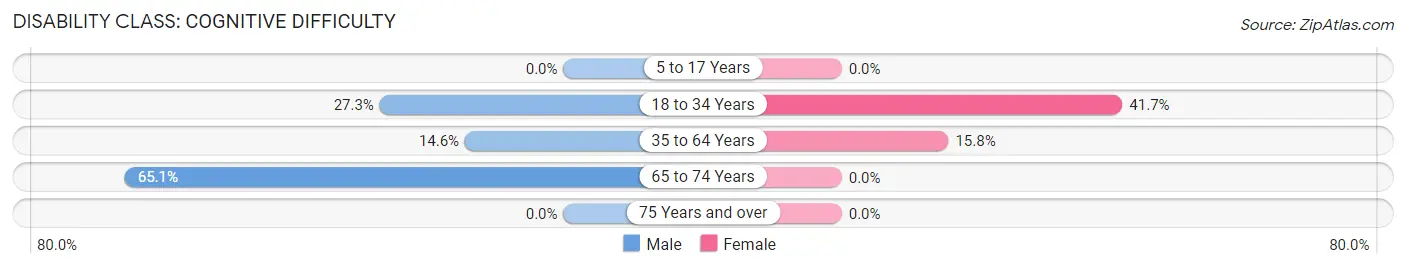
| Age Bracket | Male | Female |
| 5 to 17 Years | 0 (0.0%) | 0 (0.0%) |
| 18 to 34 Years | 6 (27.3%) | 20 (41.7%) |
| 35 to 64 Years | 13 (14.6%) | 16 (15.8%) |
| 65 to 74 Years | 28 (65.1%) | 0 (0.0%) |
| 75 Years and over | 0 (0.0%) | 0 (0.0%) |
Disability Class: Ambulatory Difficulty
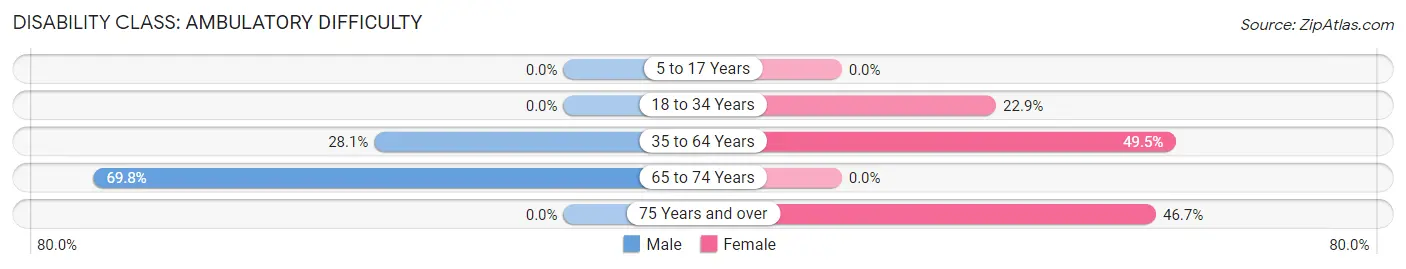
| Age Bracket | Male | Female |
| 5 to 17 Years | 0 (0.0%) | 0 (0.0%) |
| 18 to 34 Years | 0 (0.0%) | 11 (22.9%) |
| 35 to 64 Years | 25 (28.1%) | 50 (49.5%) |
| 65 to 74 Years | 30 (69.8%) | 0 (0.0%) |
| 75 Years and over | 0 (0.0%) | 7 (46.7%) |
Disability Class: Self-Care Difficulty
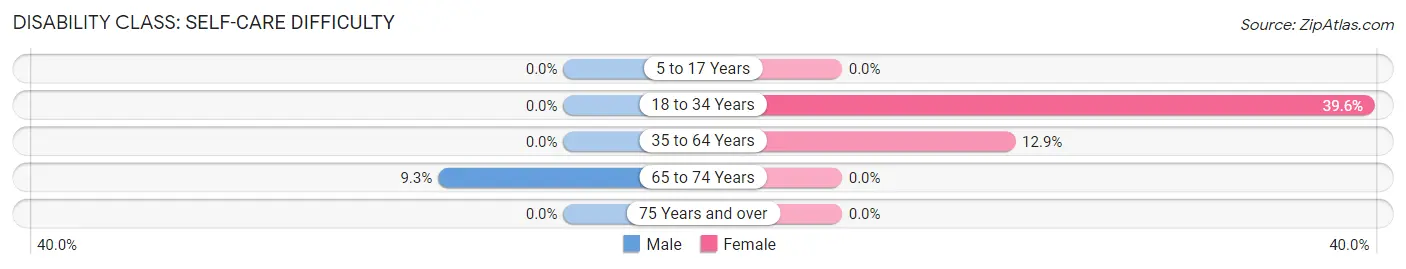
| Age Bracket | Male | Female |
| 5 to 17 Years | 0 (0.0%) | 0 (0.0%) |
| 18 to 34 Years | 0 (0.0%) | 19 (39.6%) |
| 35 to 64 Years | 0 (0.0%) | 13 (12.9%) |
| 65 to 74 Years | 4 (9.3%) | 0 (0.0%) |
| 75 Years and over | 0 (0.0%) | 0 (0.0%) |
Technology Access in Gordon
Computing Device Access in Gordon
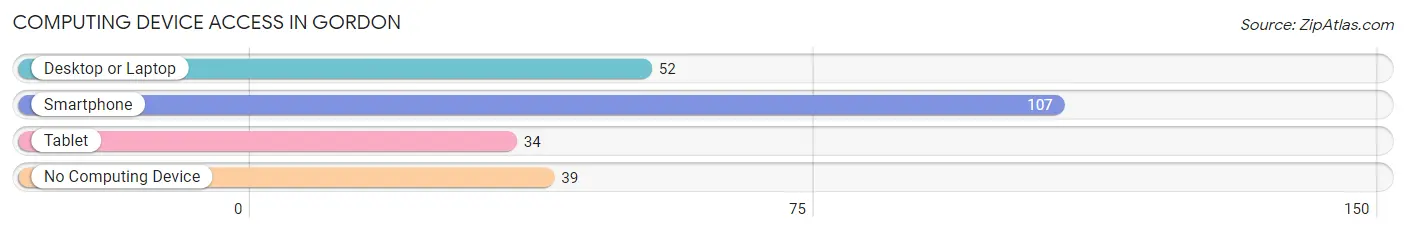
| Device Type | # Households | % Households |
| Desktop or Laptop | 52 | 32.9% |
| Smartphone | 107 | 67.7% |
| Tablet | 34 | 21.5% |
| No Computing Device | 39 | 24.7% |
| Total | 158 | 100.0% |
Internet Access in Gordon
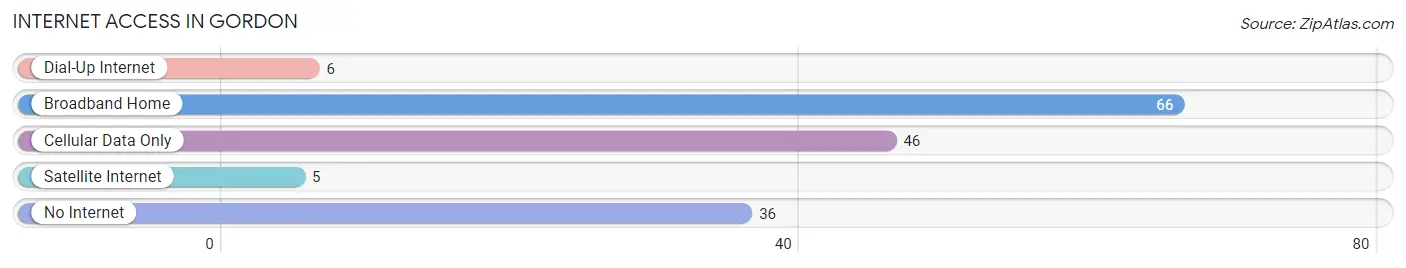
| Internet Type | # Households | % Households |
| Dial-Up Internet | 6 | 3.8% |
| Broadband Home | 66 | 41.8% |
| Cellular Data Only | 46 | 29.1% |
| Satellite Internet | 5 | 3.2% |
| No Internet | 36 | 22.8% |
| Total | 158 | 100.0% |
Gordon Summary
Gordon, Alabama is a small town located in Houston County, Alabama. It is situated in the southeastern corner of the state, near the Georgia border. The town was founded in 1854 and has a population of approximately 1,000 people.
Geography
Gordon is located in the southeastern corner of Houston County, Alabama. It is situated on the banks of the Choctawhatchee River, which is a tributary of the Chattahoochee River. The town is surrounded by rolling hills and is located in the foothills of the Appalachian Mountains. The town is located approximately 30 miles from the state capital of Montgomery and is approximately 90 miles from the state’s largest city, Birmingham.
Economy
The economy of Gordon is largely based on agriculture. The town is home to several farms, which produce a variety of crops, including cotton, corn, soybeans, and peanuts. The town also has a small manufacturing sector, which produces a variety of products, including furniture, clothing, and textiles.
Demographics
As of the 2010 census, the population of Gordon was 1,000 people. The racial makeup of the town was 97.2% White, 0.7% African American, 0.3% Native American, 0.2% Asian, and 1.6% from other races. The median household income was $30,000, and the median family income was $35,000.
The town is served by the Houston County School District, which includes two elementary schools, one middle school, and one high school. The town also has a public library and a post office.
History
Gordon was founded in 1854 by a group of settlers from Georgia. The town was named after General John B. Gordon, a Confederate general who served in the Civil War. The town was originally a farming community, but it soon developed into a small manufacturing center. In the late 19th century, the town was home to several cotton mills, which produced a variety of products, including clothing and textiles.
In the early 20th century, the town experienced a period of growth and prosperity. The town was home to several businesses, including a bank, a hotel, and a movie theater. However, the Great Depression of the 1930s caused the town to suffer economically. The town’s population declined, and many of the businesses closed.
In the late 20th century, the town experienced a period of revitalization. The town was home to several new businesses, including a grocery store, a hardware store, and a restaurant. The town also experienced an influx of new residents, and the population began to grow again.
Today, Gordon is a small, rural town with a population of approximately 1,000 people. The town is home to several businesses, including a grocery store, a hardware store, and a restaurant. The town is also home to several farms, which produce a variety of crops, including cotton, corn, soybeans, and peanuts. The town is served by the Houston County School District, which includes two elementary schools, one middle school, and one high school. The town also has a public library and a post office.
Common Questions
What is Per Capita Income in Gordon?
Per Capita income in Gordon is $26,431.
What is the Median Family Income in Gordon?
Median Family Income in Gordon is $58,000.
What is the Median Household income in Gordon?
Median Household Income in Gordon is $41,500.
What is Income or Wage Gap in Gordon?
Income or Wage Gap in Gordon is 85.4%.
Women in Gordon earn 14.6 cents for every dollar earned by a man.
What is Inequality or Gini Index in Gordon?
Inequality or Gini Index in Gordon is 0.42.
What is the Total Population of Gordon?
Total Population of Gordon is 356.
What is the Total Male Population of Gordon?
Total Male Population of Gordon is 164.
What is the Total Female Population of Gordon?
Total Female Population of Gordon is 192.
What is the Ratio of Males per 100 Females in Gordon?
There are 85.42 Males per 100 Females in Gordon.
What is the Ratio of Females per 100 Males in Gordon?
There are 117.07 Females per 100 Males in Gordon.
What is the Median Population Age in Gordon?
Median Population Age in Gordon is 55.1 Years.
What is the Average Family Size in Gordon
Average Family Size in Gordon is 3.5 People.
What is the Average Household Size in Gordon
Average Household Size in Gordon is 2.2 People.
How Large is the Labor Force in Gordon?
There are 157 People in the Labor Forcein in Gordon.
What is the Percentage of People in the Labor Force in Gordon?
45.8% of People are in the Labor Force in Gordon.
What is the Unemployment Rate in Gordon?
Unemployment Rate in Gordon is 22.9%.