West End Cobb Town, AL Map & Demographics
West End Cobb Town Map
West End Cobb Town Overview
$21,063
PER CAPITA INCOME
$55,833
AVG FAMILY INCOME
$39,792
AVG HOUSEHOLD INCOME
62.6%
WAGE / INCOME GAP [ % ]
37.4¢/ $1
WAGE / INCOME GAP [ $ ]
0.42
INEQUALITY / GINI INDEX
3,322
TOTAL POPULATION
1,685
MALE POPULATION
1,637
FEMALE POPULATION
102.93
MALES / 100 FEMALES
97.15
FEMALES / 100 MALES
36.6
MEDIAN AGE
3.2
AVG FAMILY SIZE
2.6
AVG HOUSEHOLD SIZE
1,541
LABOR FORCE [ PEOPLE ]
53.4%
PERCENT IN LABOR FORCE
16.6%
UNEMPLOYMENT RATE
Income in West End Cobb Town
Income Overview in West End Cobb Town
Per Capita Income in West End Cobb Town is $21,063, while median incomes of families and households are $55,833 and $39,792 respectively.
| Characteristic | Number | Measure |
| Per Capita Income | 3,322 | $21,063 |
| Median Family Income | 724 | $55,833 |
| Mean Family Income | 724 | $63,623 |
| Median Household Income | 1,262 | $39,792 |
| Mean Household Income | 1,262 | $52,597 |
| Income Deficit | 724 | $0 |
| Wage / Income Gap (%) | 3,322 | 62.55% |
| Wage / Income Gap ($) | 3,322 | 37.45¢ per $1 |
| Gini / Inequality Index | 3,322 | 0.42 |
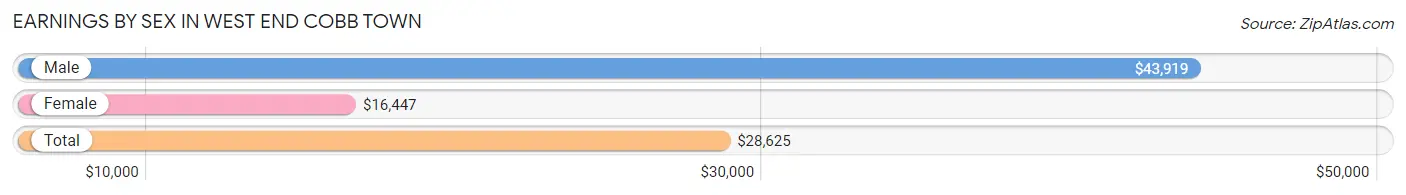
Earnings by Sex in West End Cobb Town
Average Earnings in West End Cobb Town are $28,625, $43,919 for men and $16,447 for women, a difference of 62.5%.
| Sex | Number | Average Earnings |
| Male | 852 (57.0%) | $43,919 |
| Female | 644 (43.0%) | $16,447 |
| Total | 1,496 (100.0%) | $28,625 |
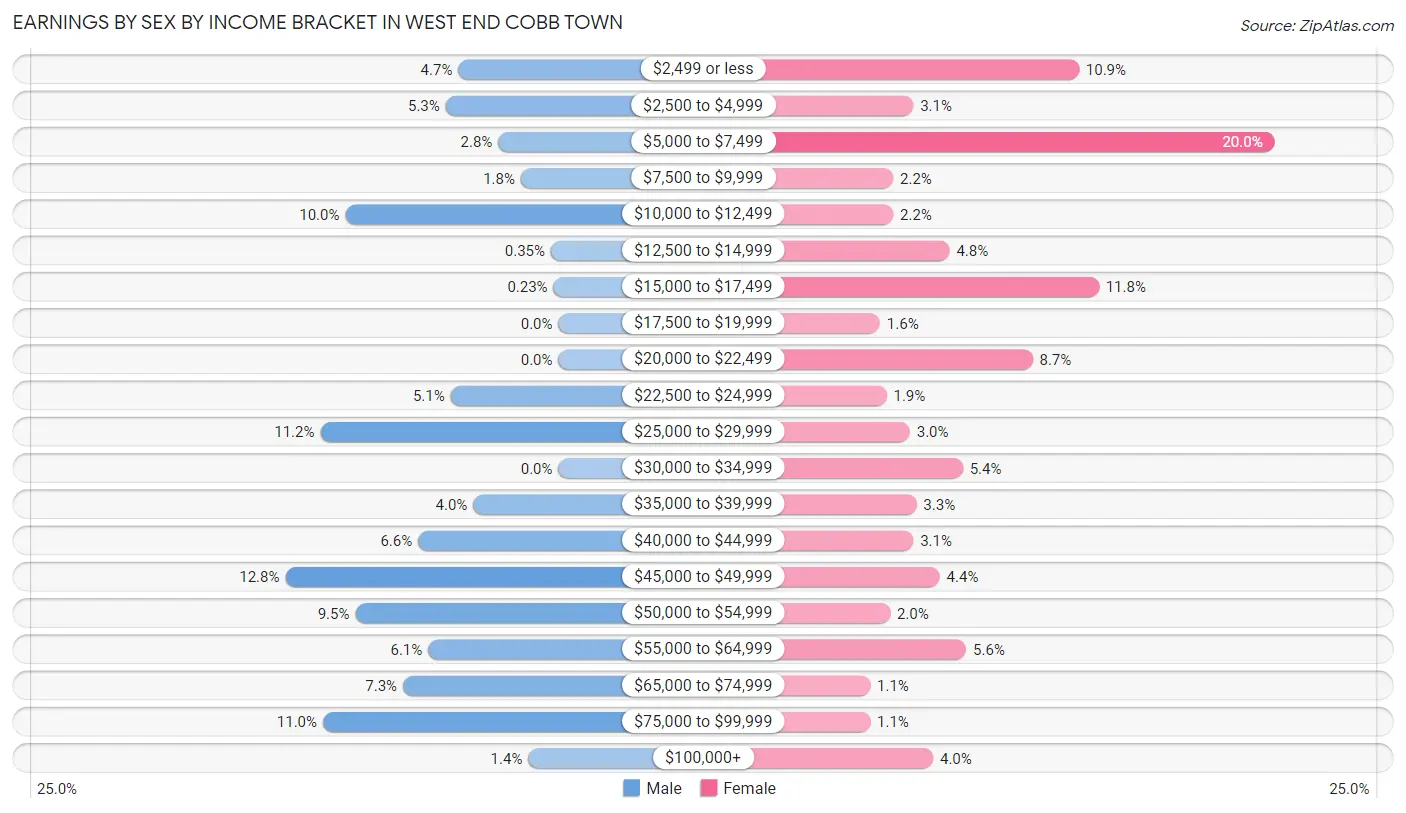
Earnings by Sex by Income Bracket in West End Cobb Town
The most common earnings brackets in West End Cobb Town are $45,000 to $49,999 for men (109 | 12.8%) and $5,000 to $7,499 for women (129 | 20.0%).
| Income | Male | Female |
| $2,499 or less | 40 (4.7%) | 70 (10.9%) |
| $2,500 to $4,999 | 45 (5.3%) | 20 (3.1%) |
| $5,000 to $7,499 | 24 (2.8%) | 129 (20.0%) |
| $7,500 to $9,999 | 15 (1.8%) | 14 (2.2%) |
| $10,000 to $12,499 | 85 (10.0%) | 14 (2.2%) |
| $12,500 to $14,999 | 3 (0.4%) | 31 (4.8%) |
| $15,000 to $17,499 | 2 (0.2%) | 76 (11.8%) |
| $17,500 to $19,999 | 0 (0.0%) | 10 (1.5%) |
| $20,000 to $22,499 | 0 (0.0%) | 56 (8.7%) |
| $22,500 to $24,999 | 43 (5.1%) | 12 (1.9%) |
| $25,000 to $29,999 | 95 (11.2%) | 19 (2.9%) |
| $30,000 to $34,999 | 0 (0.0%) | 35 (5.4%) |
| $35,000 to $39,999 | 34 (4.0%) | 21 (3.3%) |
| $40,000 to $44,999 | 56 (6.6%) | 20 (3.1%) |
| $45,000 to $49,999 | 109 (12.8%) | 28 (4.3%) |
| $50,000 to $54,999 | 81 (9.5%) | 13 (2.0%) |
| $55,000 to $64,999 | 52 (6.1%) | 36 (5.6%) |
| $65,000 to $74,999 | 62 (7.3%) | 7 (1.1%) |
| $75,000 to $99,999 | 94 (11.0%) | 7 (1.1%) |
| $100,000+ | 12 (1.4%) | 26 (4.0%) |
| Total | 852 (100.0%) | 644 (100.0%) |
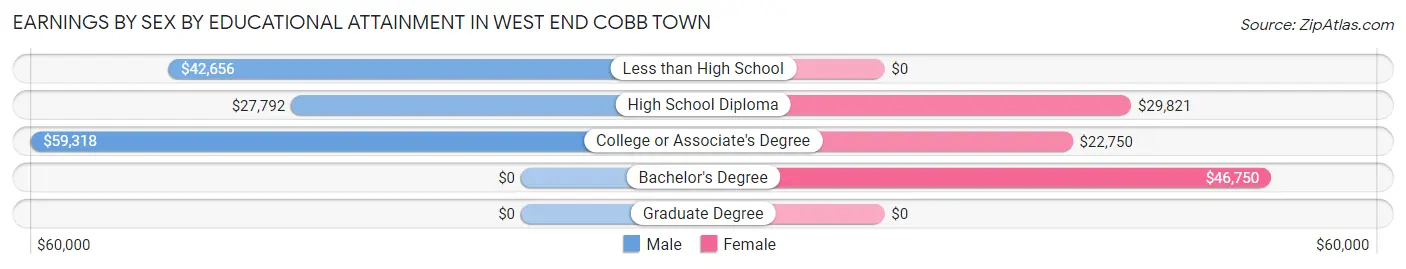
Earnings by Sex by Educational Attainment in West End Cobb Town
Average earnings in West End Cobb Town are $47,197 for men and $23,854 for women, a difference of 49.5%. Men with an educational attainment of college or associate's degree enjoy the highest average annual earnings of $59,318, while those with high school diploma education earn the least with $27,792. Women with an educational attainment of bachelor's degree earn the most with the average annual earnings of $46,750, while those with college or associate's degree education have the smallest earnings of $22,750.
| Educational Attainment | Male Income | Female Income |
| Less than High School | $42,656 | $0 |
| High School Diploma | $27,792 | $29,821 |
| College or Associate's Degree | $59,318 | $22,750 |
| Bachelor's Degree | - | - |
| Graduate Degree | - | - |
| Total | $47,197 | $23,854 |
Family Income in West End Cobb Town
Family Income Brackets in West End Cobb Town
According to the West End Cobb Town family income data, there are 182 families falling into the $50,000 to $74,999 income range, which is the most common income bracket and makes up 25.1% of all families. Conversely, the $200,000+ income bracket is the least frequent group with only 7 families (1.0%) belonging to this category.
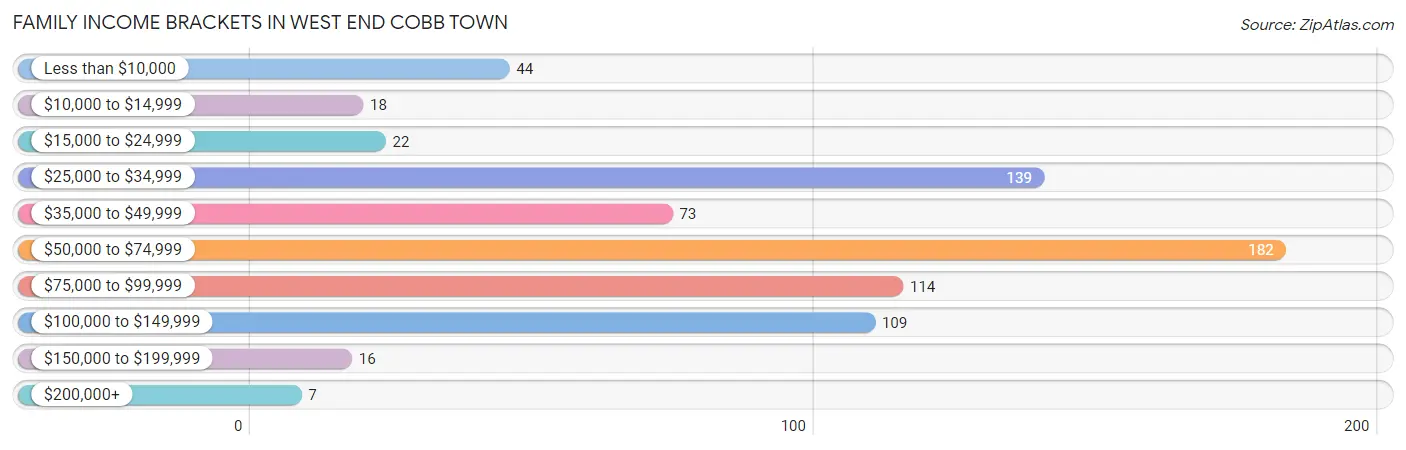
| Income Bracket | # Families | % Families |
| Less than $10,000 | 44 | 6.1% |
| $10,000 to $14,999 | 18 | 2.5% |
| $15,000 to $24,999 | 22 | 3.0% |
| $25,000 to $34,999 | 139 | 19.2% |
| $35,000 to $49,999 | 73 | 10.1% |
| $50,000 to $74,999 | 182 | 25.1% |
| $75,000 to $99,999 | 114 | 15.7% |
| $100,000 to $149,999 | 109 | 15.1% |
| $150,000 to $199,999 | 16 | 2.2% |
| $200,000+ | 7 | 1.0% |
Family Income by Famaliy Size in West End Cobb Town
5-person families (48 | 6.6%) account for the highest median family income in West End Cobb Town with $116,786 per family, while 2-person families (357 | 49.3%) have the highest median income of $26,780 per family member.
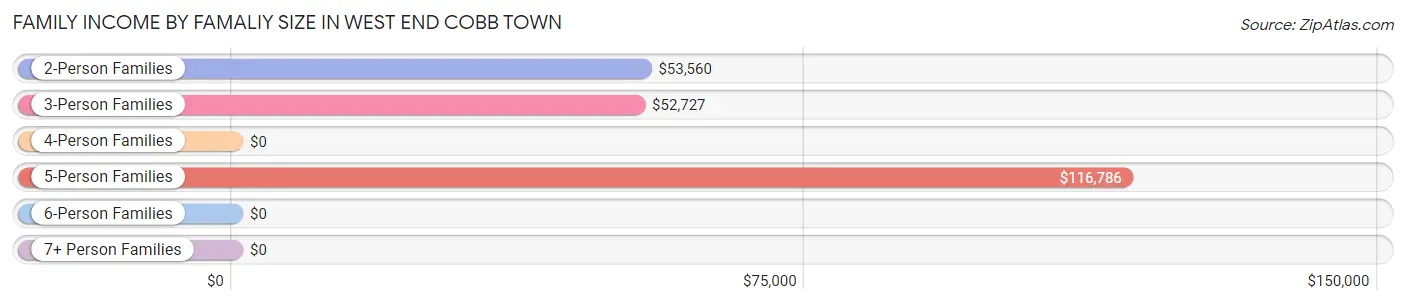
| Income Bracket | # Families | Median Income |
| 2-Person Families | 357 (49.3%) | $53,560 |
| 3-Person Families | 208 (28.7%) | $52,727 |
| 4-Person Families | 85 (11.7%) | $0 |
| 5-Person Families | 48 (6.6%) | $116,786 |
| 6-Person Families | 20 (2.8%) | $0 |
| 7+ Person Families | 6 (0.8%) | $0 |
| Total | 724 (100.0%) | $55,833 |
Family Income by Number of Earners in West End Cobb Town
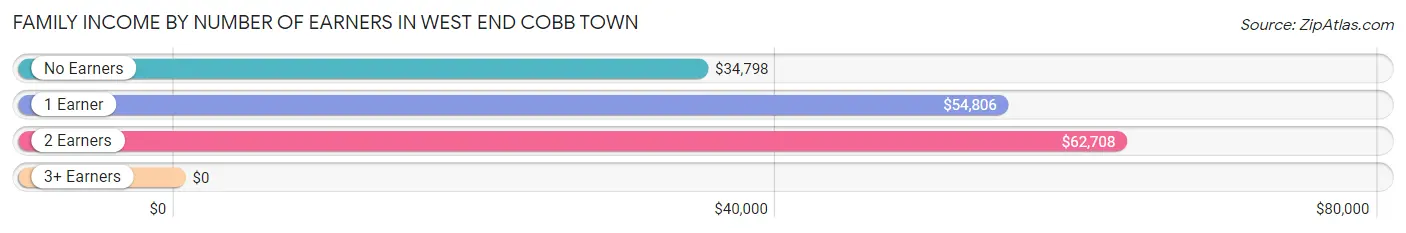
| Number of Earners | # Families | Median Income |
| No Earners | 147 (20.3%) | $34,798 |
| 1 Earner | 339 (46.8%) | $54,806 |
| 2 Earners | 221 (30.5%) | $62,708 |
| 3+ Earners | 17 (2.4%) | $0 |
| Total | 724 (100.0%) | $55,833 |
Household Income in West End Cobb Town
Household Income Brackets in West End Cobb Town
With 249 households falling in the category, the $25,000 to $34,999 income range is the most frequent in West End Cobb Town, accounting for 19.7% of all households. In contrast, only 14 households (1.1%) fall into the $200,000+ income bracket, making it the least populous group.
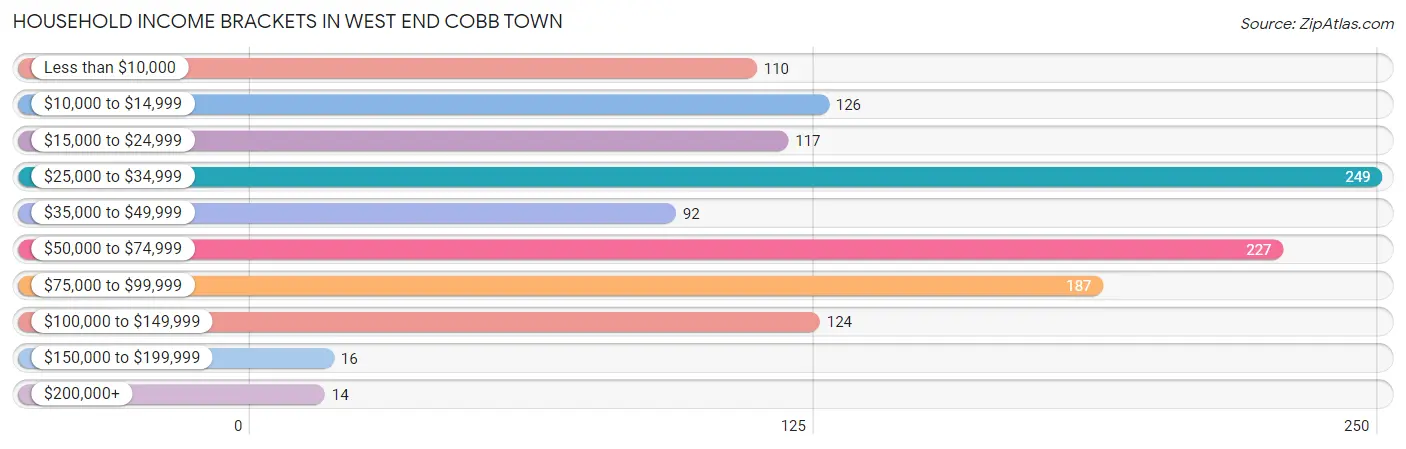
| Income Bracket | # Households | % Households |
| Less than $10,000 | 110 | 8.7% |
| $10,000 to $14,999 | 126 | 10.0% |
| $15,000 to $24,999 | 117 | 9.3% |
| $25,000 to $34,999 | 249 | 19.7% |
| $35,000 to $49,999 | 92 | 7.3% |
| $50,000 to $74,999 | 227 | 18.0% |
| $75,000 to $99,999 | 187 | 14.8% |
| $100,000 to $149,999 | 124 | 9.8% |
| $150,000 to $199,999 | 16 | 1.3% |
| $200,000+ | 14 | 1.1% |
Household Income by Householder Age in West End Cobb Town
The median household income in West End Cobb Town is $39,792, with the highest median household income of $73,068 found in the 25 to 44 years age bracket for the primary householder. A total of 197 households (15.6%) fall into this category. Meanwhile, the 15 to 24 years age bracket for the primary householder has the lowest median household income of $0, with 116 households (9.2%) in this group.
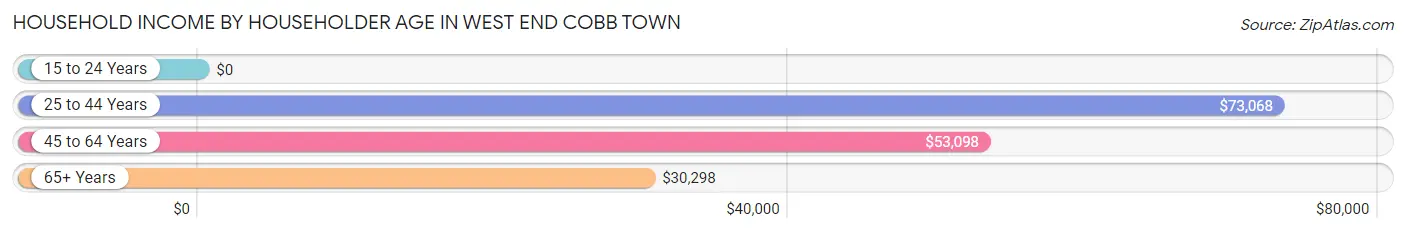
| Income Bracket | # Households | Median Income |
| 15 to 24 Years | 116 (9.2%) | $0 |
| 25 to 44 Years | 197 (15.6%) | $73,068 |
| 45 to 64 Years | 556 (44.1%) | $53,098 |
| 65+ Years | 393 (31.1%) | $30,298 |
| Total | 1,262 (100.0%) | $39,792 |
Poverty in West End Cobb Town
Income Below Poverty by Sex and Age in West End Cobb Town
With 16.5% poverty level for males and 26.3% for females among the residents of West End Cobb Town, 6 to 11 year old males and 15 year old females are the most vulnerable to poverty, with 40 males (60.6%) and 42 females (95.5%) in their respective age groups living below the poverty level.
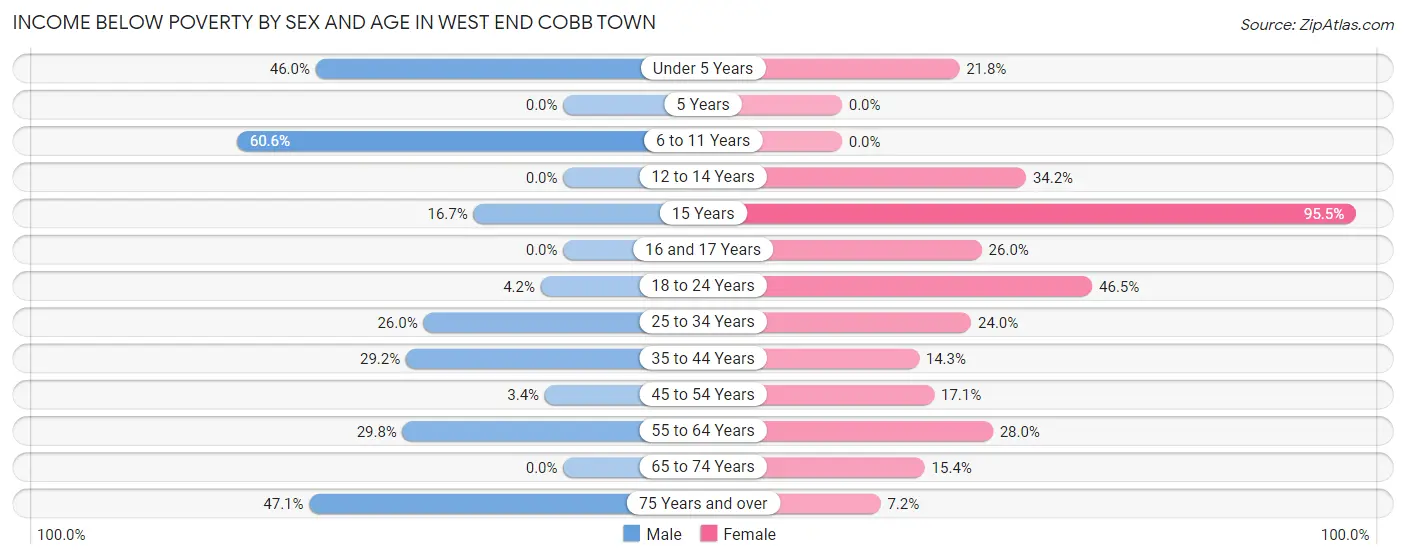
| Age Bracket | Male | Female |
| Under 5 Years | 17 (46.0%) | 17 (21.8%) |
| 5 Years | 0 (0.0%) | 0 (0.0%) |
| 6 to 11 Years | 40 (60.6%) | 0 (0.0%) |
| 12 to 14 Years | 0 (0.0%) | 27 (34.2%) |
| 15 Years | 6 (16.7%) | 42 (95.5%) |
| 16 and 17 Years | 0 (0.0%) | 27 (26.0%) |
| 18 to 24 Years | 18 (4.2%) | 105 (46.5%) |
| 25 to 34 Years | 54 (26.0%) | 48 (24.0%) |
| 35 to 44 Years | 33 (29.2%) | 6 (14.3%) |
| 45 to 54 Years | 9 (3.4%) | 25 (17.1%) |
| 55 to 64 Years | 68 (29.8%) | 93 (28.0%) |
| 65 to 74 Years | 0 (0.0%) | 28 (15.4%) |
| 75 Years and over | 33 (47.1%) | 13 (7.2%) |
| Total | 278 (16.5%) | 431 (26.3%) |
Income Above Poverty by Sex and Age in West End Cobb Town
According to the poverty statistics in West End Cobb Town, males aged 5 years and females aged 5 years are the age groups that are most secure financially, with 100.0% of males and 100.0% of females in these age groups living above the poverty line.
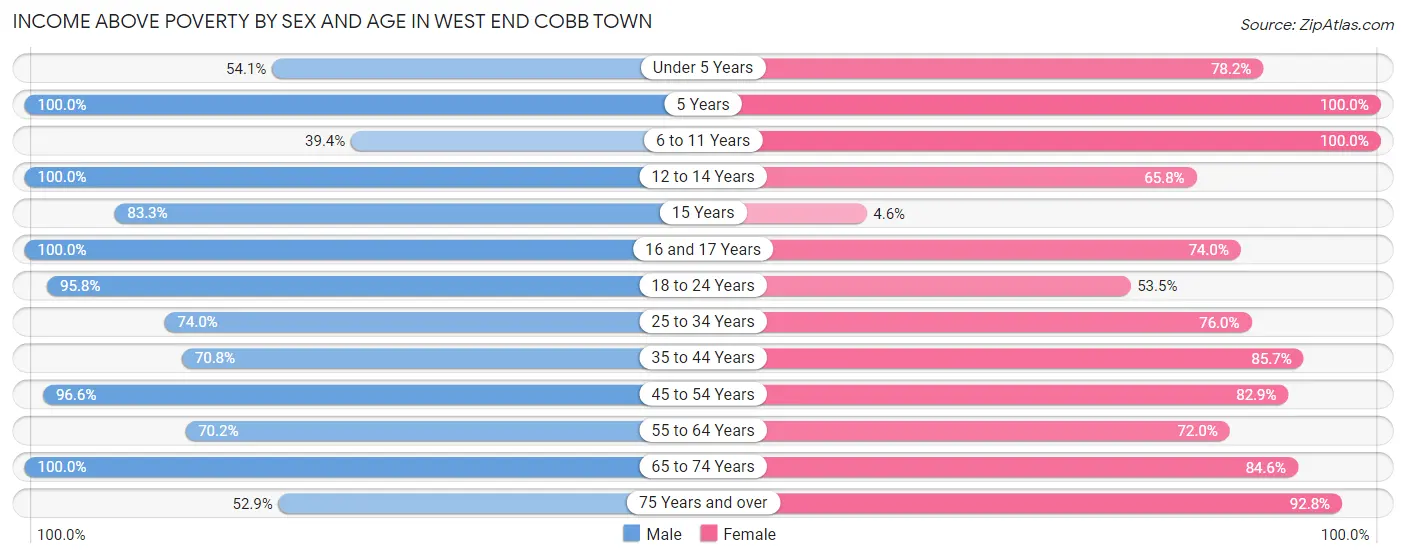
| Age Bracket | Male | Female |
| Under 5 Years | 20 (54.0%) | 61 (78.2%) |
| 5 Years | 5 (100.0%) | 4 (100.0%) |
| 6 to 11 Years | 26 (39.4%) | 19 (100.0%) |
| 12 to 14 Years | 68 (100.0%) | 52 (65.8%) |
| 15 Years | 30 (83.3%) | 2 (4.5%) |
| 16 and 17 Years | 28 (100.0%) | 77 (74.0%) |
| 18 to 24 Years | 412 (95.8%) | 121 (53.5%) |
| 25 to 34 Years | 154 (74.0%) | 152 (76.0%) |
| 35 to 44 Years | 80 (70.8%) | 36 (85.7%) |
| 45 to 54 Years | 254 (96.6%) | 121 (82.9%) |
| 55 to 64 Years | 160 (70.2%) | 239 (72.0%) |
| 65 to 74 Years | 133 (100.0%) | 154 (84.6%) |
| 75 Years and over | 37 (52.9%) | 168 (92.8%) |
| Total | 1,407 (83.5%) | 1,206 (73.7%) |
Income Below Poverty Among Married-Couple Families in West End Cobb Town
The poverty statistics for married-couple families in West End Cobb Town show that 2.6% or 11 of the total 420 families live below the poverty line. Families with no children have the highest poverty rate of 4.1%, comprising of 11 families. On the other hand, families with 1 or 2 children have the lowest poverty rate of 0.0%, which includes 0 families.
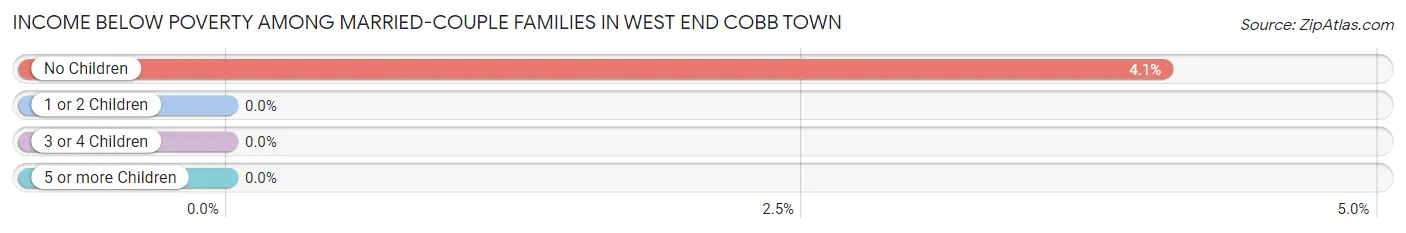
| Children | Above Poverty | Below Poverty |
| No Children | 259 (95.9%) | 11 (4.1%) |
| 1 or 2 Children | 137 (100.0%) | 0 (0.0%) |
| 3 or 4 Children | 13 (100.0%) | 0 (0.0%) |
| 5 or more Children | 0 (0.0%) | 0 (0.0%) |
| Total | 409 (97.4%) | 11 (2.6%) |
Income Below Poverty Among Single-Parent Households in West End Cobb Town
According to the poverty data in West End Cobb Town, 6.7% or 8 single-father households and 32.6% or 60 single-mother households are living below the poverty line. Among single-father households, those with no children have the highest poverty rate, with 8 households (13.6%) experiencing poverty. Likewise, among single-mother households, those with 5 or more children have the highest poverty rate, with 17 households (100.0%) falling below the poverty line.
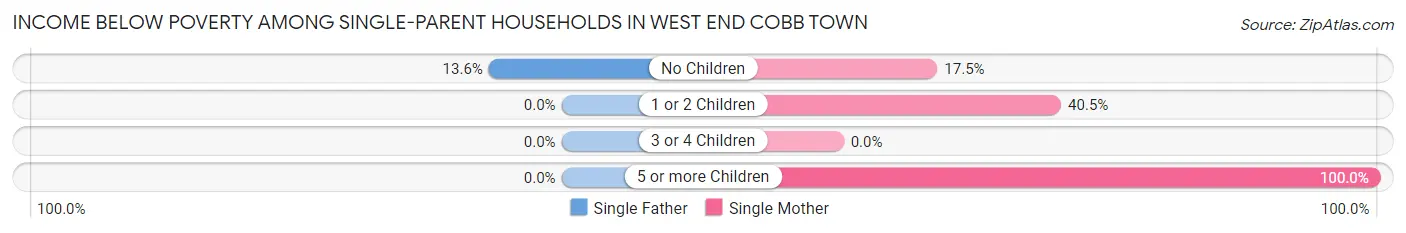
| Children | Single Father | Single Mother |
| No Children | 8 (13.6%) | 11 (17.5%) |
| 1 or 2 Children | 0 (0.0%) | 32 (40.5%) |
| 3 or 4 Children | 0 (0.0%) | 0 (0.0%) |
| 5 or more Children | 0 (0.0%) | 17 (100.0%) |
| Total | 8 (6.7%) | 60 (32.6%) |
Income Below Poverty Among Married-Couple vs Single-Parent Households in West End Cobb Town
The poverty data for West End Cobb Town shows that 11 of the married-couple family households (2.6%) and 68 of the single-parent households (22.4%) are living below the poverty level. Within the married-couple family households, those with no children have the highest poverty rate, with 11 households (4.1%) falling below the poverty line. Among the single-parent households, those with 5 or more children have the highest poverty rate, with 17 household (100.0%) living below poverty.
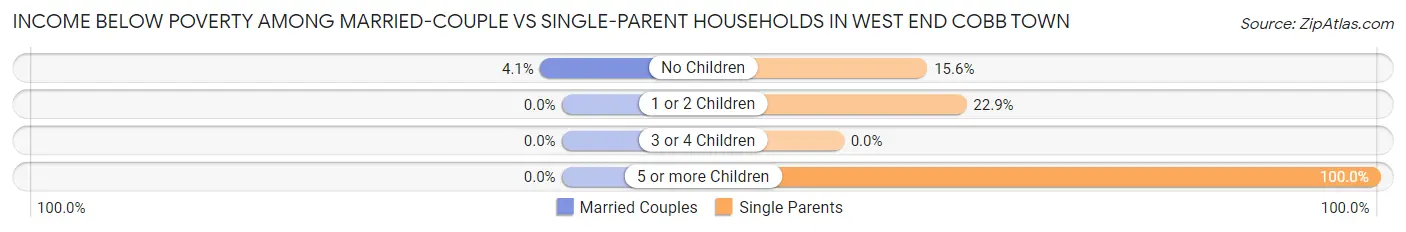
| Children | Married-Couple Families | Single-Parent Households |
| No Children | 11 (4.1%) | 19 (15.6%) |
| 1 or 2 Children | 0 (0.0%) | 32 (22.9%) |
| 3 or 4 Children | 0 (0.0%) | 0 (0.0%) |
| 5 or more Children | 0 (0.0%) | 17 (100.0%) |
| Total | 11 (2.6%) | 68 (22.4%) |
Race in West End Cobb Town
The most populous races in West End Cobb Town are White / Caucasian (2,368 | 71.3%), Black / African American (676 | 20.3%), and Two or more Races (261 | 7.9%).
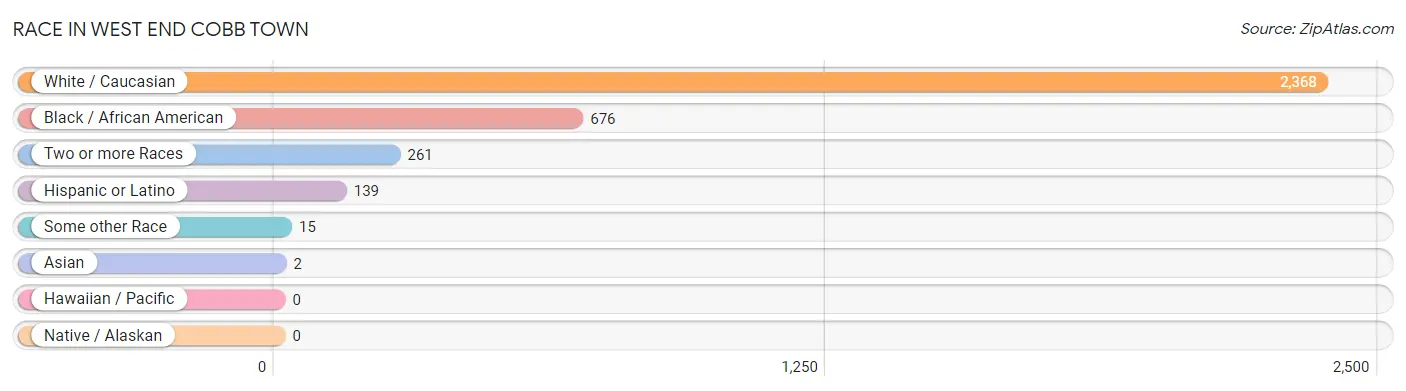
| Race | # Population | % Population |
| Asian | 2 | 0.1% |
| Black / African American | 676 | 20.3% |
| Hawaiian / Pacific | 0 | 0.0% |
| Hispanic or Latino | 139 | 4.2% |
| Native / Alaskan | 0 | 0.0% |
| White / Caucasian | 2,368 | 71.3% |
| Two or more Races | 261 | 7.9% |
| Some other Race | 15 | 0.4% |
| Total | 3,322 | 100.0% |
Ancestry in West End Cobb Town
The most populous ancestries reported in West End Cobb Town are American (343 | 10.3%), English (292 | 8.8%), Irish (290 | 8.7%), Subsaharan African (260 | 7.8%), and African (204 | 6.1%), together accounting for 41.8% of all West End Cobb Town residents.
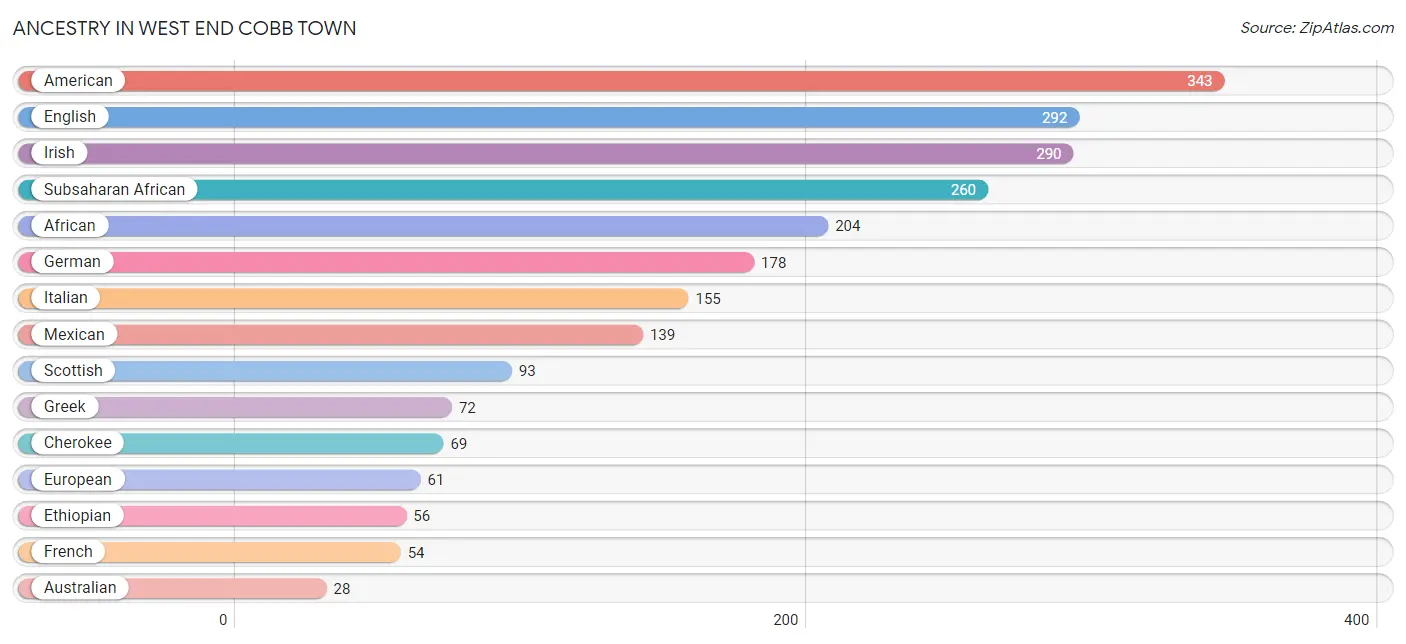
| Ancestry | # Population | % Population |
| African | 204 | 6.1% |
| American | 343 | 10.3% |
| Australian | 28 | 0.8% |
| Belgian | 5 | 0.2% |
| Burmese | 8 | 0.2% |
| Cherokee | 69 | 2.1% |
| Dutch West Indian | 3 | 0.1% |
| English | 292 | 8.8% |
| Ethiopian | 56 | 1.7% |
| European | 61 | 1.8% |
| French | 54 | 1.6% |
| German | 178 | 5.4% |
| Greek | 72 | 2.2% |
| Irish | 290 | 8.7% |
| Italian | 155 | 4.7% |
| Korean | 2 | 0.1% |
| Mexican | 139 | 4.2% |
| Native Hawaiian | 2 | 0.1% |
| Polish | 10 | 0.3% |
| Russian | 4 | 0.1% |
| Scandinavian | 13 | 0.4% |
| Scottish | 93 | 2.8% |
| Subsaharan African | 260 | 7.8% | View All 23 Rows |
Immigrants in West End Cobb Town
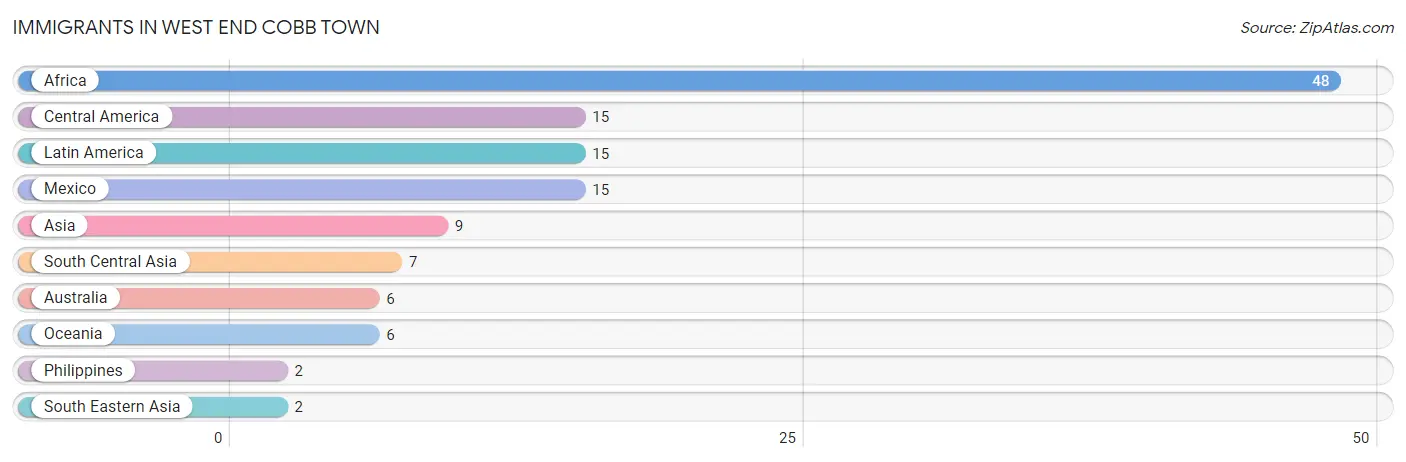
The most numerous immigrant groups reported in West End Cobb Town came from Africa (48 | 1.4%), Central America (15 | 0.4%), Latin America (15 | 0.4%), Mexico (15 | 0.4%), and Asia (9 | 0.3%), together accounting for 3.1% of all West End Cobb Town residents.
| Immigration Origin | # Population | % Population |
| Africa | 48 | 1.4% |
| Asia | 9 | 0.3% |
| Australia | 6 | 0.2% |
| Central America | 15 | 0.4% |
| Latin America | 15 | 0.4% |
| Mexico | 15 | 0.4% |
| Oceania | 6 | 0.2% |
| Philippines | 2 | 0.1% |
| South Central Asia | 7 | 0.2% |
| South Eastern Asia | 2 | 0.1% | View All 10 Rows |
Sex and Age in West End Cobb Town
Sex and Age in West End Cobb Town
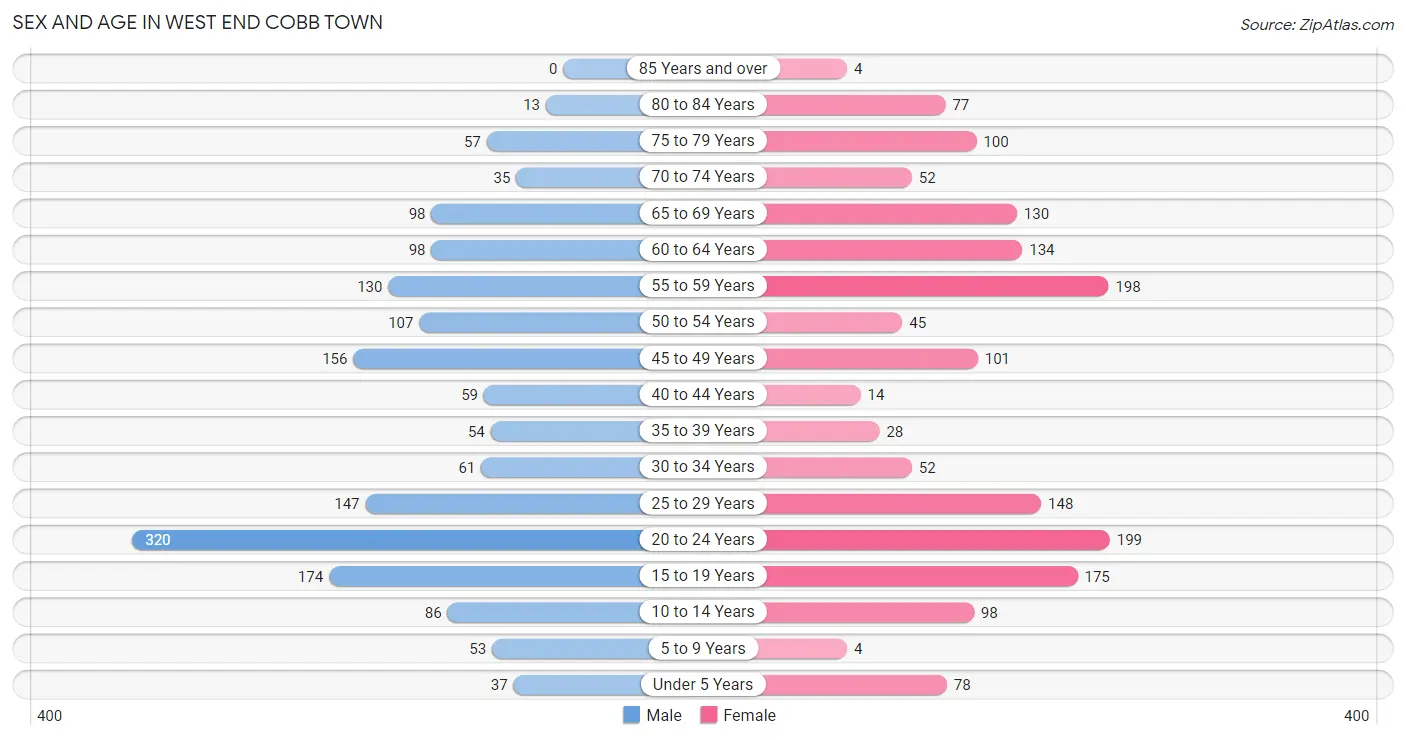
The most populous age groups in West End Cobb Town are 20 to 24 Years (320 | 19.0%) for men and 20 to 24 Years (199 | 12.2%) for women.
| Age Bracket | Male | Female |
| Under 5 Years | 37 (2.2%) | 78 (4.8%) |
| 5 to 9 Years | 53 (3.2%) | 4 (0.2%) |
| 10 to 14 Years | 86 (5.1%) | 98 (6.0%) |
| 15 to 19 Years | 174 (10.3%) | 175 (10.7%) |
| 20 to 24 Years | 320 (19.0%) | 199 (12.2%) |
| 25 to 29 Years | 147 (8.7%) | 148 (9.0%) |
| 30 to 34 Years | 61 (3.6%) | 52 (3.2%) |
| 35 to 39 Years | 54 (3.2%) | 28 (1.7%) |
| 40 to 44 Years | 59 (3.5%) | 14 (0.9%) |
| 45 to 49 Years | 156 (9.3%) | 101 (6.2%) |
| 50 to 54 Years | 107 (6.4%) | 45 (2.8%) |
| 55 to 59 Years | 130 (7.7%) | 198 (12.1%) |
| 60 to 64 Years | 98 (5.8%) | 134 (8.2%) |
| 65 to 69 Years | 98 (5.8%) | 130 (7.9%) |
| 70 to 74 Years | 35 (2.1%) | 52 (3.2%) |
| 75 to 79 Years | 57 (3.4%) | 100 (6.1%) |
| 80 to 84 Years | 13 (0.8%) | 77 (4.7%) |
| 85 Years and over | 0 (0.0%) | 4 (0.2%) |
| Total | 1,685 (100.0%) | 1,637 (100.0%) |
Families and Households in West End Cobb Town
Median Family Size in West End Cobb Town
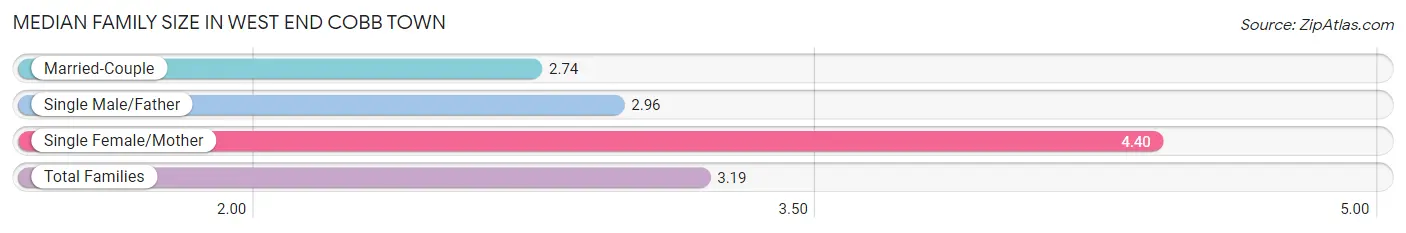
The median family size in West End Cobb Town is 3.19 persons per family, with single female/mother families (184 | 25.4%) accounting for the largest median family size of 4.4 persons per family. On the other hand, married-couple families (420 | 58.0%) represent the smallest median family size with 2.74 persons per family.
| Family Type | # Families | Family Size |
| Married-Couple | 420 (58.0%) | 2.74 |
| Single Male/Father | 120 (16.6%) | 2.96 |
| Single Female/Mother | 184 (25.4%) | 4.40 |
| Total Families | 724 (100.0%) | 3.19 |
Median Household Size in West End Cobb Town
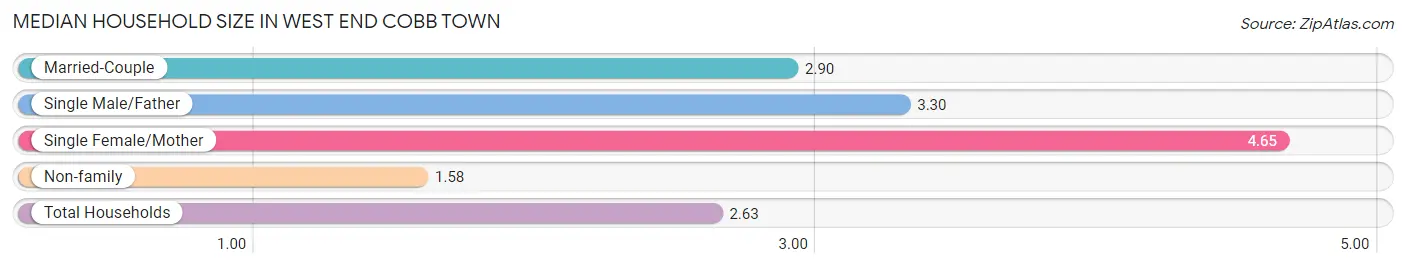
The median household size in West End Cobb Town is 2.63 persons per household, with single female/mother households (184 | 14.6%) accounting for the largest median household size of 4.65 persons per household. non-family households (538 | 42.6%) represent the smallest median household size with 1.58 persons per household.
| Household Type | # Households | Household Size |
| Married-Couple | 420 (33.3%) | 2.90 |
| Single Male/Father | 120 (9.5%) | 3.30 |
| Single Female/Mother | 184 (14.6%) | 4.65 |
| Non-family | 538 (42.6%) | 1.58 |
| Total Households | 1,262 (100.0%) | 2.63 |
Household Size by Marriage Status in West End Cobb Town
Out of a total of 1,262 households in West End Cobb Town, 724 (57.4%) are family households, while 538 (42.6%) are nonfamily households. The most numerous type of family households are 3-person households, comprising 296, and the most common type of nonfamily households are 1-person households, comprising 443.
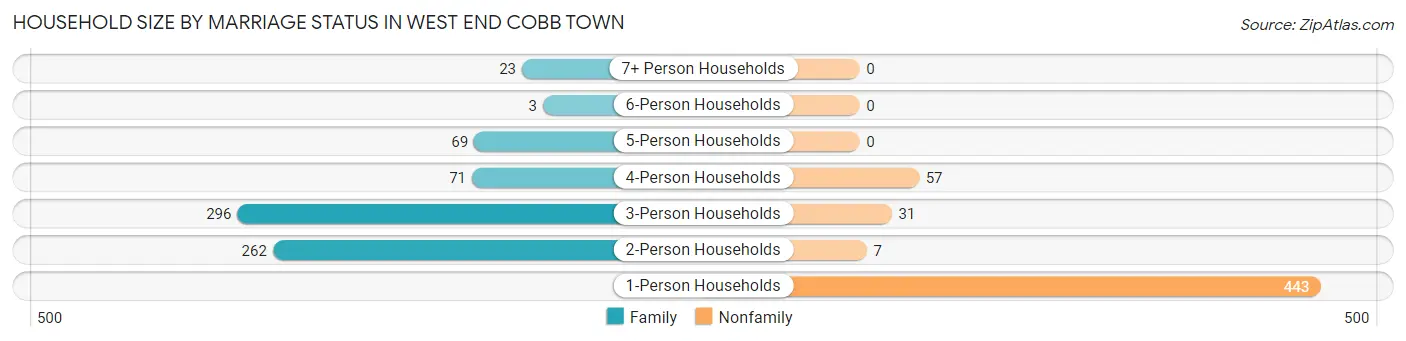
| Household Size | Family Households | Nonfamily Households |
| 1-Person Households | - | 443 (35.1%) |
| 2-Person Households | 262 (20.8%) | 7 (0.5%) |
| 3-Person Households | 296 (23.4%) | 31 (2.5%) |
| 4-Person Households | 71 (5.6%) | 57 (4.5%) |
| 5-Person Households | 69 (5.5%) | 0 (0.0%) |
| 6-Person Households | 3 (0.2%) | 0 (0.0%) |
| 7+ Person Households | 23 (1.8%) | 0 (0.0%) |
| Total | 724 (57.4%) | 538 (42.6%) |
Female Fertility in West End Cobb Town
Fertility by Age in West End Cobb Town
Average fertility rate in West End Cobb Town is 111.0 births per 1,000 women. Women in the age bracket of 20 to 34 years have the highest fertility rate with 195.0 births per 1,000 women. Women in the age bracket of 20 to 34 years acount for 97.5% of all women with births.
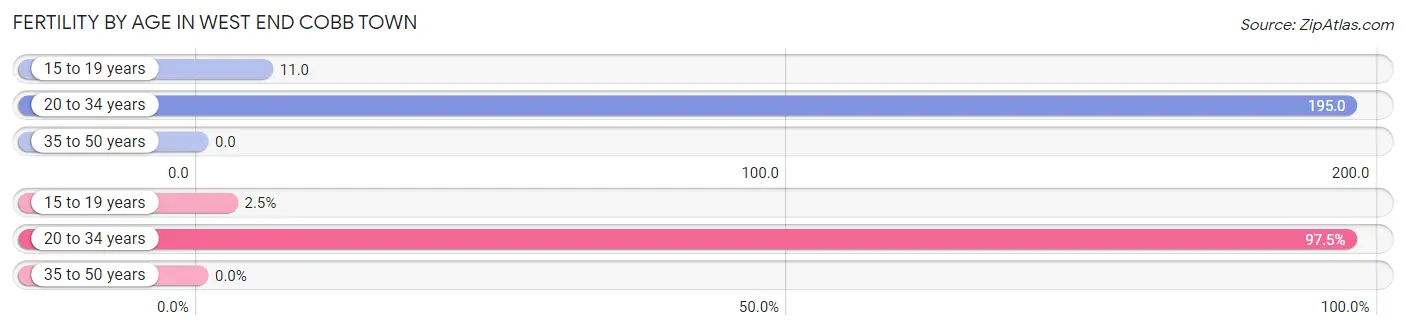
| Age Bracket | Women with Births | Births / 1,000 Women |
| 15 to 19 years | 2 (2.5%) | 11.0 |
| 20 to 34 years | 78 (97.5%) | 195.0 |
| 35 to 50 years | 0 (0.0%) | 0.0 |
| Total | 80 (100.0%) | 111.0 |
Fertility by Age by Marriage Status in West End Cobb Town
78.7% of women with births (80) in West End Cobb Town are married. The highest percentage of unmarried women with births falls into 15 to 19 years age bracket with 100.0% of them unmarried at the time of birth, while the lowest percentage of unmarried women with births belong to 20 to 34 years age bracket with 19.2% of them unmarried.
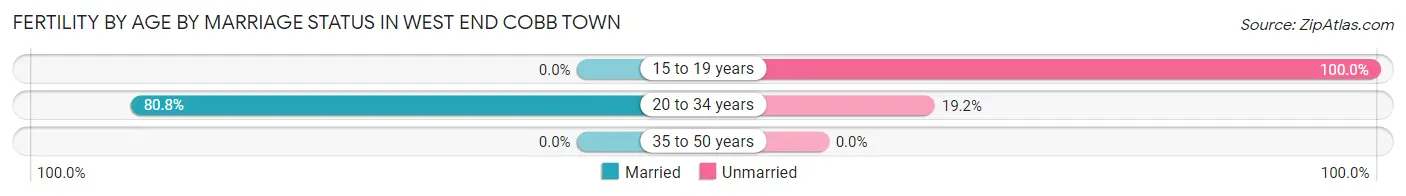
| Age Bracket | Married | Unmarried |
| 15 to 19 years | 0 (0.0%) | 2 (100.0%) |
| 20 to 34 years | 63 (80.8%) | 15 (19.2%) |
| 35 to 50 years | 0 (0.0%) | 0 (0.0%) |
| Total | 63 (78.7%) | 17 (21.2%) |
Fertility by Education in West End Cobb Town
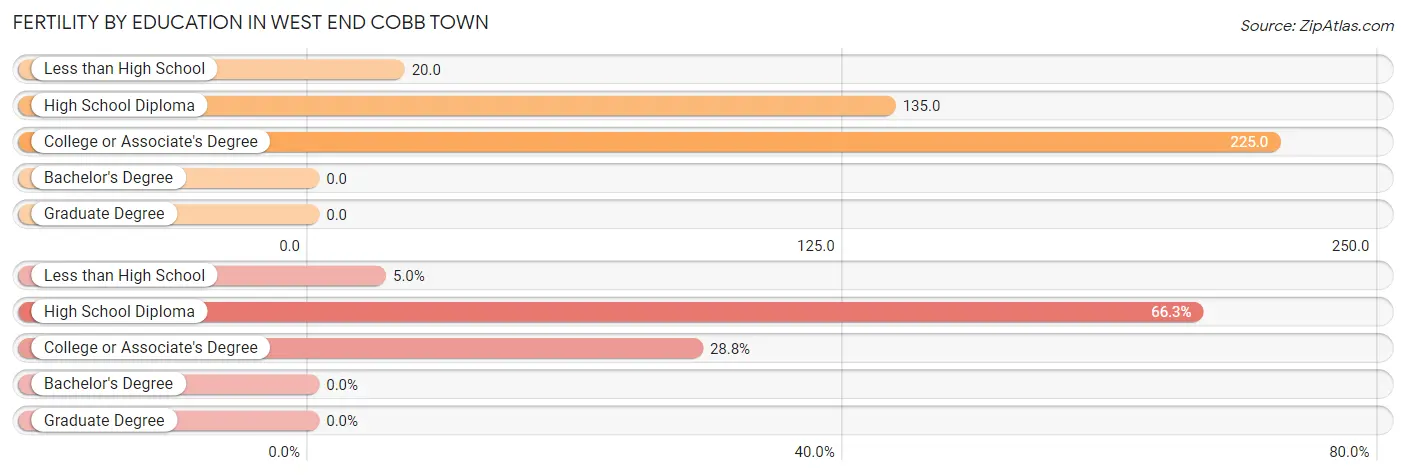
| Educational Attainment | Women with Births | Births / 1,000 Women |
| Less than High School | 4 (5.0%) | 20.0 |
| High School Diploma | 53 (66.2%) | 135.0 |
| College or Associate's Degree | 23 (28.7%) | 225.0 |
| Bachelor's Degree | 0 (0.0%) | 0.0 |
| Graduate Degree | 0 (0.0%) | 0.0 |
| Total | 80 (100.0%) | 111.0 |
Fertility by Education by Marriage Status in West End Cobb Town
21.2% of women with births in West End Cobb Town are unmarried. Women with the educational attainment of high school diploma are most likely to be married with 100.0% of them married at childbirth, while women with the educational attainment of less than high school are least likely to be married with 100.0% of them unmarried at childbirth.
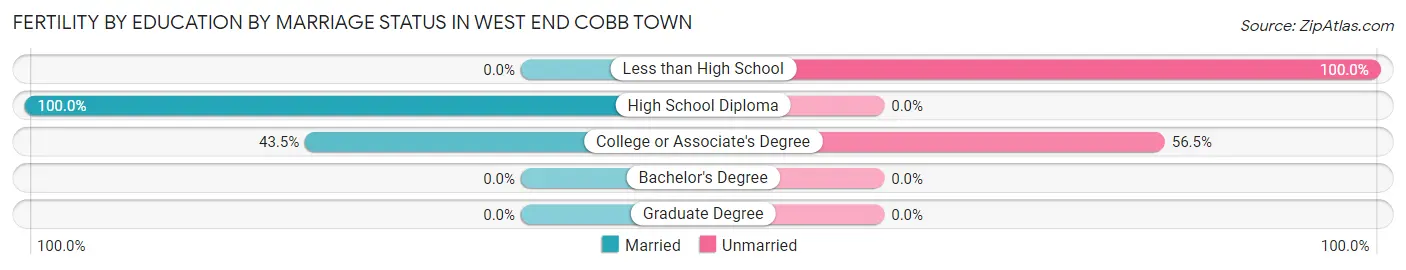
| Educational Attainment | Married | Unmarried |
| Less than High School | 0 (0.0%) | 4 (100.0%) |
| High School Diploma | 53 (100.0%) | 0 (0.0%) |
| College or Associate's Degree | 10 (43.5%) | 13 (56.5%) |
| Bachelor's Degree | 0 (0.0%) | 0 (0.0%) |
| Graduate Degree | 0 (0.0%) | 0 (0.0%) |
| Total | 63 (78.7%) | 17 (21.2%) |
Employment Characteristics in West End Cobb Town
Employment by Class of Employer in West End Cobb Town
Among the 1,271 employed individuals in West End Cobb Town, private company employees (865 | 68.1%), local government employees (102 | 8.0%), and not-for-profit organizations (96 | 7.5%) make up the most common classes of employment.
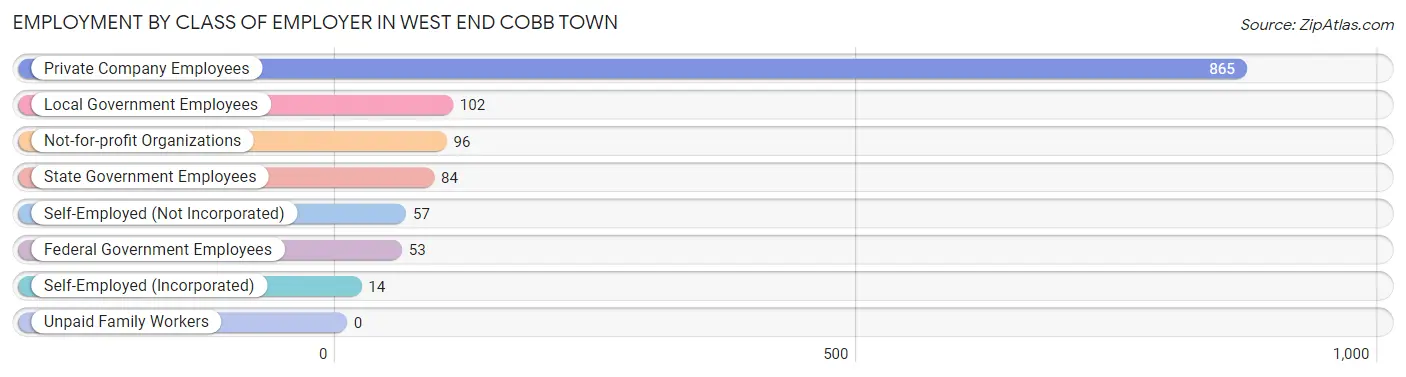
| Employer Class | # Employees | % Employees |
| Private Company Employees | 865 | 68.1% |
| Self-Employed (Incorporated) | 14 | 1.1% |
| Self-Employed (Not Incorporated) | 57 | 4.5% |
| Not-for-profit Organizations | 96 | 7.5% |
| Local Government Employees | 102 | 8.0% |
| State Government Employees | 84 | 6.6% |
| Federal Government Employees | 53 | 4.2% |
| Unpaid Family Workers | 0 | 0.0% |
| Total | 1,271 | 100.0% |
Employment Status by Age in West End Cobb Town
According to the labor force statistics for West End Cobb Town, out of the total population over 16 years of age (2,886), 53.4% or 1,541 individuals are in the labor force, with 16.6% or 256 of them unemployed. The age group with the highest labor force participation rate is 30 to 34 years, with 94.7% or 107 individuals in the labor force. Within the labor force, the 20 to 24 years age range has the highest percentage of unemployed individuals, with 39.8% or 156 of them being unemployed.
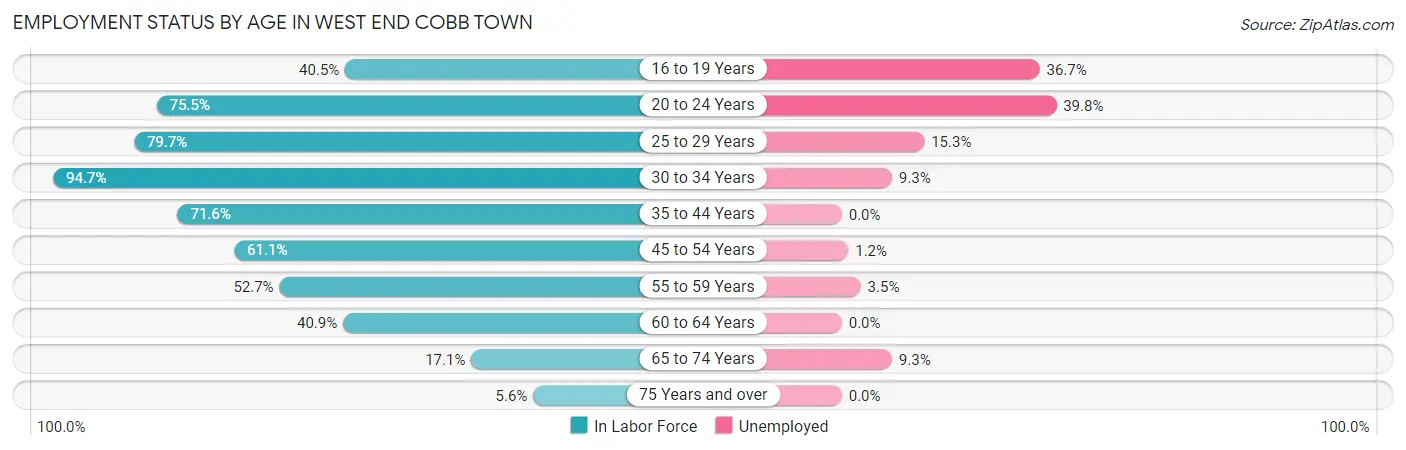
| Age Bracket | In Labor Force | Unemployed |
| 16 to 19 Years | 109 (40.5%) | 40 (36.7%) |
| 20 to 24 Years | 392 (75.5%) | 156 (39.8%) |
| 25 to 29 Years | 235 (79.7%) | 36 (15.3%) |
| 30 to 34 Years | 107 (94.7%) | 10 (9.3%) |
| 35 to 44 Years | 111 (71.6%) | 0 (0.0%) |
| 45 to 54 Years | 250 (61.1%) | 3 (1.2%) |
| 55 to 59 Years | 173 (52.7%) | 6 (3.5%) |
| 60 to 64 Years | 95 (40.9%) | 0 (0.0%) |
| 65 to 74 Years | 54 (17.1%) | 5 (9.3%) |
| 75 Years and over | 14 (5.6%) | 0 (0.0%) |
| Total | 1,541 (53.4%) | 256 (16.6%) |
Employment Status by Educational Attainment in West End Cobb Town
According to labor force statistics for West End Cobb Town, 63.4% of individuals (971) out of the total population between 25 and 64 years of age (1,532) are in the labor force, with 5.7% or 55 of them being unemployed. The group with the highest labor force participation rate are those with the educational attainment of bachelor's degree or higher, with 90.8% or 69 individuals in the labor force. Within the labor force, individuals with college / associate degree education have the highest percentage of unemployment, with 9.8% or 36 of them being unemployed.
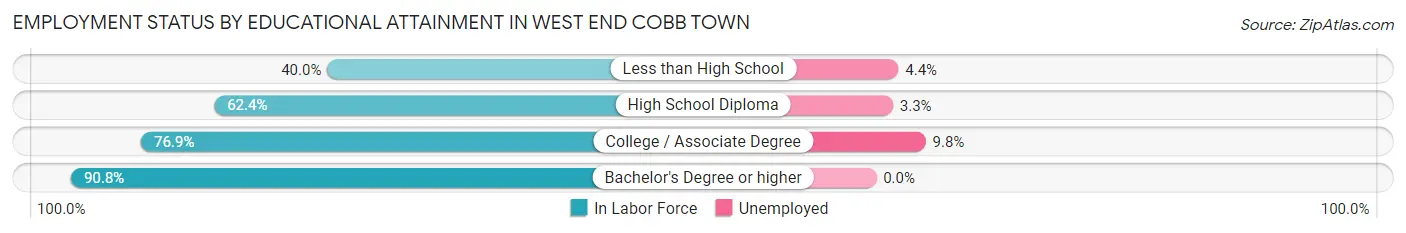
| Educational Attainment | In Labor Force | Unemployed |
| Less than High School | 136 (40.0%) | 15 (4.4%) |
| High School Diploma | 399 (62.4%) | 21 (3.3%) |
| College / Associate Degree | 367 (76.9%) | 47 (9.8%) |
| Bachelor's Degree or higher | 69 (90.8%) | 0 (0.0%) |
| Total | 971 (63.4%) | 87 (5.7%) |
Employment Occupations by Sex in West End Cobb Town
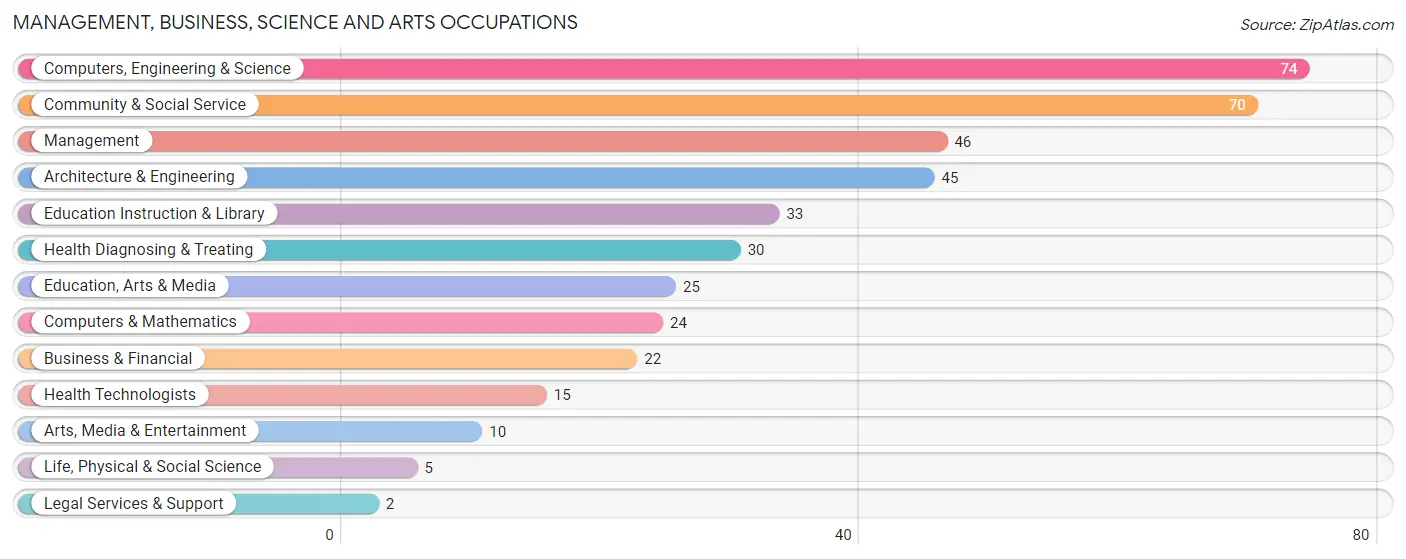
Management, Business, Science and Arts Occupations
The most common Management, Business, Science and Arts occupations in West End Cobb Town are Computers, Engineering & Science (74 | 5.8%), Community & Social Service (70 | 5.4%), Management (46 | 3.6%), Architecture & Engineering (45 | 3.5%), and Education Instruction & Library (33 | 2.6%).
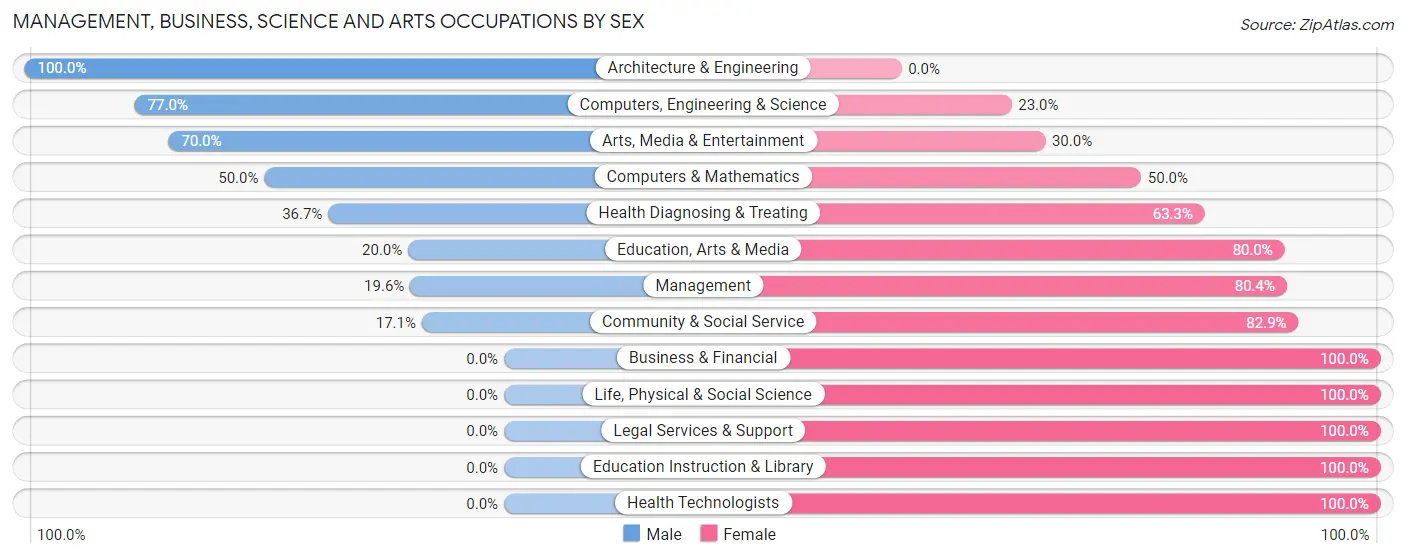
Management, Business, Science and Arts Occupations by Sex
Within the Management, Business, Science and Arts occupations in West End Cobb Town, the most male-oriented occupations are Architecture & Engineering (100.0%), Computers, Engineering & Science (77.0%), and Arts, Media & Entertainment (70.0%), while the most female-oriented occupations are Business & Financial (100.0%), Life, Physical & Social Science (100.0%), and Legal Services & Support (100.0%).
| Occupation | Male | Female |
| Management | 9 (19.6%) | 37 (80.4%) |
| Business & Financial | 0 (0.0%) | 22 (100.0%) |
| Computers, Engineering & Science | 57 (77.0%) | 17 (23.0%) |
| Computers & Mathematics | 12 (50.0%) | 12 (50.0%) |
| Architecture & Engineering | 45 (100.0%) | 0 (0.0%) |
| Life, Physical & Social Science | 0 (0.0%) | 5 (100.0%) |
| Community & Social Service | 12 (17.1%) | 58 (82.9%) |
| Education, Arts & Media | 5 (20.0%) | 20 (80.0%) |
| Legal Services & Support | 0 (0.0%) | 2 (100.0%) |
| Education Instruction & Library | 0 (0.0%) | 33 (100.0%) |
| Arts, Media & Entertainment | 7 (70.0%) | 3 (30.0%) |
| Health Diagnosing & Treating | 11 (36.7%) | 19 (63.3%) |
| Health Technologists | 0 (0.0%) | 15 (100.0%) |
| Total (Category) | 89 (36.8%) | 153 (63.2%) |
| Total (Overall) | 842 (65.6%) | 442 (34.4%) |
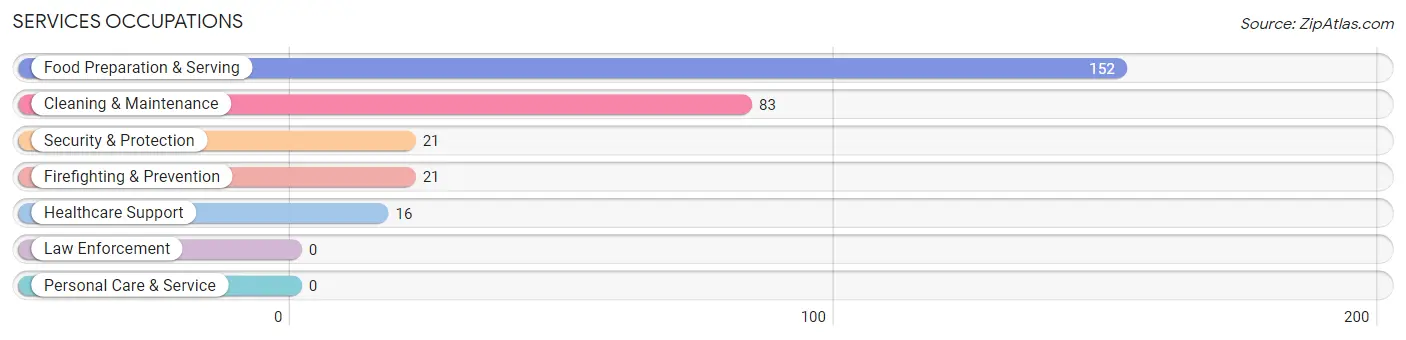
Services Occupations
The most common Services occupations in West End Cobb Town are Food Preparation & Serving (152 | 11.8%), Cleaning & Maintenance (83 | 6.5%), Security & Protection (21 | 1.6%), Firefighting & Prevention (21 | 1.6%), and Healthcare Support (16 | 1.3%).
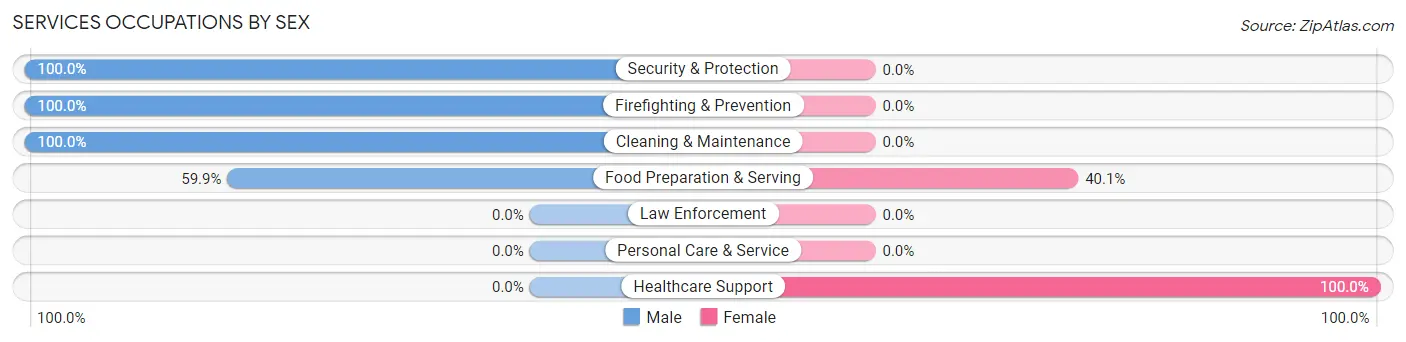
Services Occupations by Sex
Within the Services occupations in West End Cobb Town, the most male-oriented occupations are Security & Protection (100.0%), Firefighting & Prevention (100.0%), and Cleaning & Maintenance (100.0%), while the most female-oriented occupations are Healthcare Support (100.0%), and Food Preparation & Serving (40.1%).
| Occupation | Male | Female |
| Healthcare Support | 0 (0.0%) | 16 (100.0%) |
| Security & Protection | 21 (100.0%) | 0 (0.0%) |
| Firefighting & Prevention | 21 (100.0%) | 0 (0.0%) |
| Law Enforcement | 0 (0.0%) | 0 (0.0%) |
| Food Preparation & Serving | 91 (59.9%) | 61 (40.1%) |
| Cleaning & Maintenance | 83 (100.0%) | 0 (0.0%) |
| Personal Care & Service | 0 (0.0%) | 0 (0.0%) |
| Total (Category) | 195 (71.7%) | 77 (28.3%) |
| Total (Overall) | 842 (65.6%) | 442 (34.4%) |
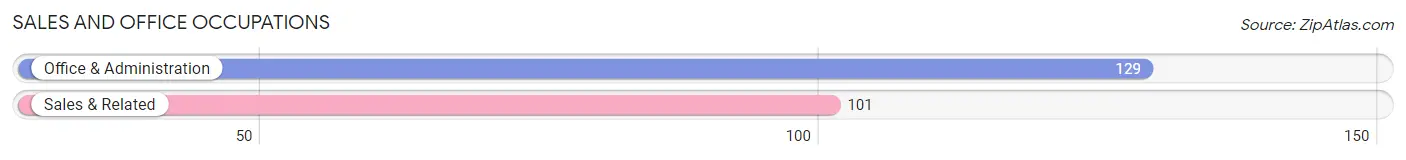
Sales and Office Occupations
The most common Sales and Office occupations in West End Cobb Town are Office & Administration (129 | 10.1%), and Sales & Related (101 | 7.9%).
Sales and Office Occupations by Sex
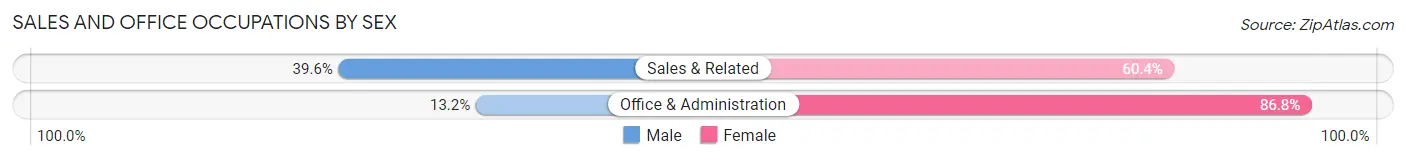
| Occupation | Male | Female |
| Sales & Related | 40 (39.6%) | 61 (60.4%) |
| Office & Administration | 17 (13.2%) | 112 (86.8%) |
| Total (Category) | 57 (24.8%) | 173 (75.2%) |
| Total (Overall) | 842 (65.6%) | 442 (34.4%) |
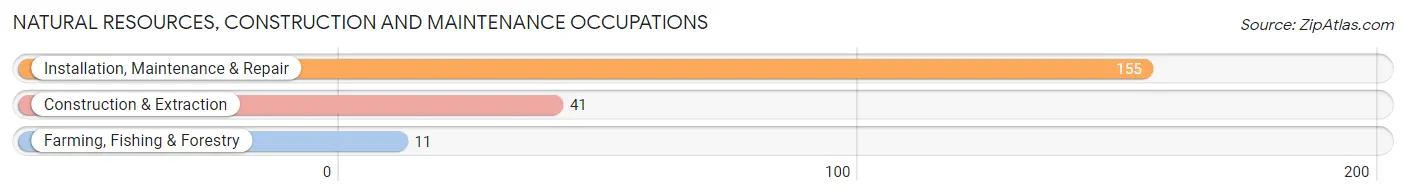
Natural Resources, Construction and Maintenance Occupations
The most common Natural Resources, Construction and Maintenance occupations in West End Cobb Town are Installation, Maintenance & Repair (155 | 12.1%), Construction & Extraction (41 | 3.2%), and Farming, Fishing & Forestry (11 | 0.9%).
Natural Resources, Construction and Maintenance Occupations by Sex
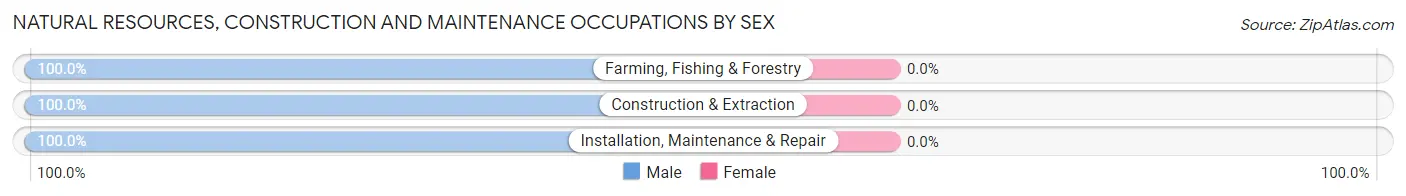
| Occupation | Male | Female |
| Farming, Fishing & Forestry | 11 (100.0%) | 0 (0.0%) |
| Construction & Extraction | 41 (100.0%) | 0 (0.0%) |
| Installation, Maintenance & Repair | 155 (100.0%) | 0 (0.0%) |
| Total (Category) | 207 (100.0%) | 0 (0.0%) |
| Total (Overall) | 842 (65.6%) | 442 (34.4%) |
Production, Transportation and Moving Occupations
The most common Production, Transportation and Moving occupations in West End Cobb Town are Material Moving (154 | 12.0%), Transportation (93 | 7.2%), and Production (86 | 6.7%).
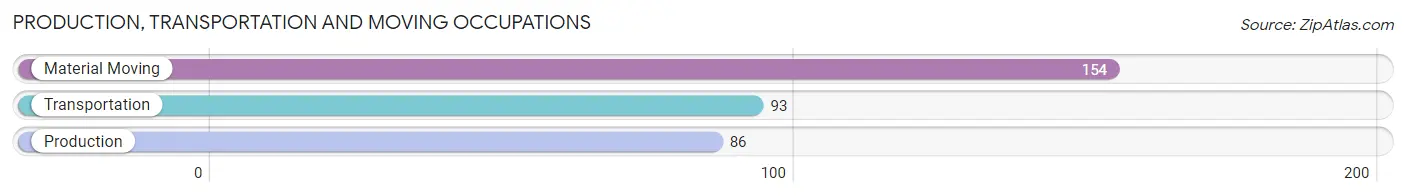
Production, Transportation and Moving Occupations by Sex
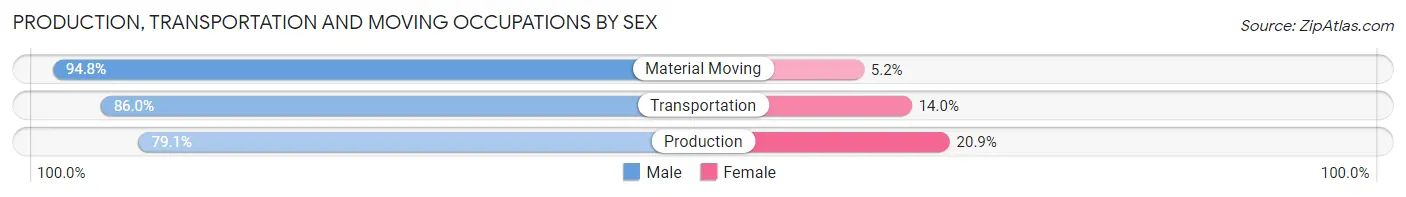
| Occupation | Male | Female |
| Production | 68 (79.1%) | 18 (20.9%) |
| Transportation | 80 (86.0%) | 13 (14.0%) |
| Material Moving | 146 (94.8%) | 8 (5.2%) |
| Total (Category) | 294 (88.3%) | 39 (11.7%) |
| Total (Overall) | 842 (65.6%) | 442 (34.4%) |
Employment Industries by Sex in West End Cobb Town
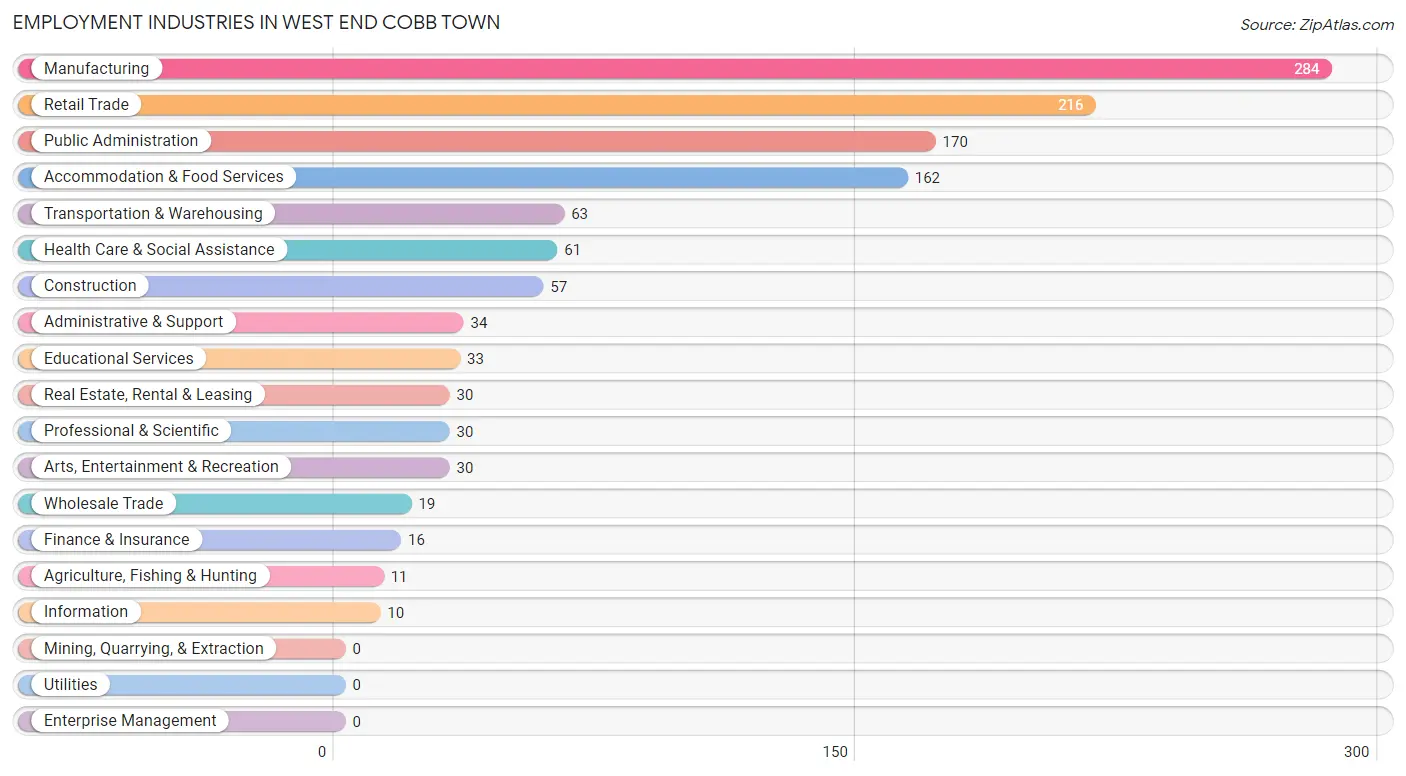
Employment Industries in West End Cobb Town
The major employment industries in West End Cobb Town include Manufacturing (284 | 22.1%), Retail Trade (216 | 16.8%), Public Administration (170 | 13.2%), Accommodation & Food Services (162 | 12.6%), and Transportation & Warehousing (63 | 4.9%).
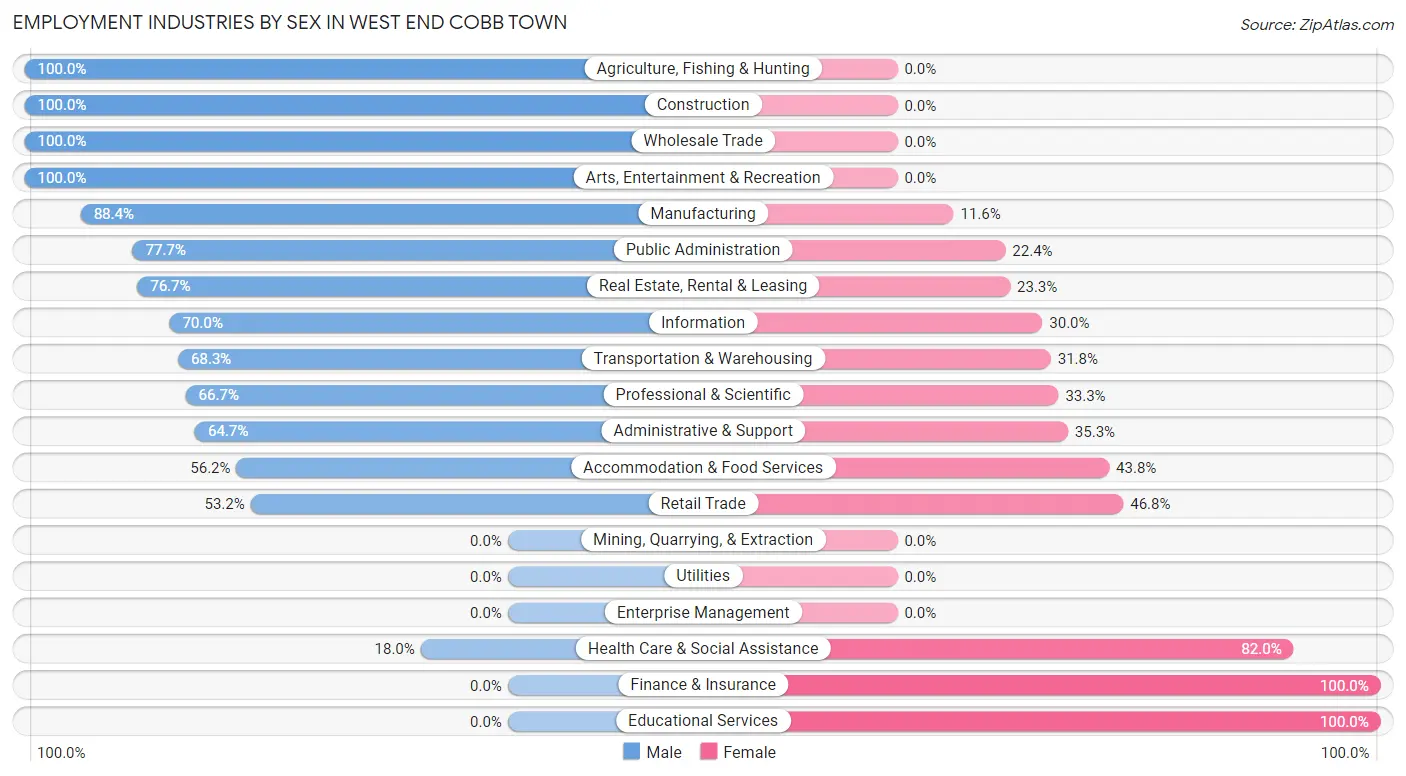
Employment Industries by Sex in West End Cobb Town
The West End Cobb Town industries that see more men than women are Agriculture, Fishing & Hunting (100.0%), Construction (100.0%), and Wholesale Trade (100.0%), whereas the industries that tend to have a higher number of women are Finance & Insurance (100.0%), Educational Services (100.0%), and Health Care & Social Assistance (82.0%).
| Industry | Male | Female |
| Agriculture, Fishing & Hunting | 11 (100.0%) | 0 (0.0%) |
| Mining, Quarrying, & Extraction | 0 (0.0%) | 0 (0.0%) |
| Construction | 57 (100.0%) | 0 (0.0%) |
| Manufacturing | 251 (88.4%) | 33 (11.6%) |
| Wholesale Trade | 19 (100.0%) | 0 (0.0%) |
| Retail Trade | 115 (53.2%) | 101 (46.8%) |
| Transportation & Warehousing | 43 (68.2%) | 20 (31.8%) |
| Utilities | 0 (0.0%) | 0 (0.0%) |
| Information | 7 (70.0%) | 3 (30.0%) |
| Finance & Insurance | 0 (0.0%) | 16 (100.0%) |
| Real Estate, Rental & Leasing | 23 (76.7%) | 7 (23.3%) |
| Professional & Scientific | 20 (66.7%) | 10 (33.3%) |
| Enterprise Management | 0 (0.0%) | 0 (0.0%) |
| Administrative & Support | 22 (64.7%) | 12 (35.3%) |
| Educational Services | 0 (0.0%) | 33 (100.0%) |
| Health Care & Social Assistance | 11 (18.0%) | 50 (82.0%) |
| Arts, Entertainment & Recreation | 30 (100.0%) | 0 (0.0%) |
| Accommodation & Food Services | 91 (56.2%) | 71 (43.8%) |
| Public Administration | 132 (77.6%) | 38 (22.4%) |
| Total | 842 (65.6%) | 442 (34.4%) |
Education in West End Cobb Town
School Enrollment in West End Cobb Town
The most common levels of schooling among the 576 students in West End Cobb Town are high school (295 | 51.2%), middle school (140 | 24.3%), and elementary school (80 | 13.9%).
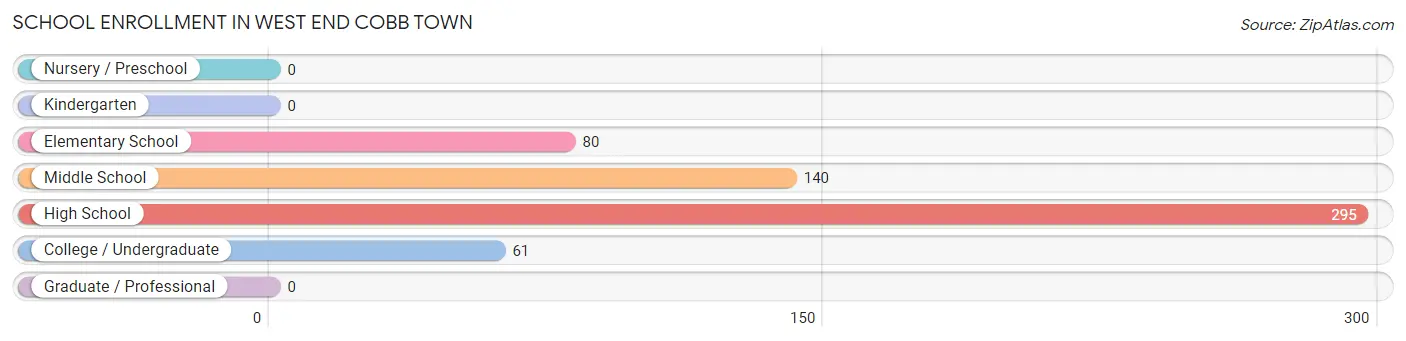
| School Level | # Students | % Students |
| Nursery / Preschool | 0 | 0.0% |
| Kindergarten | 0 | 0.0% |
| Elementary School | 80 | 13.9% |
| Middle School | 140 | 24.3% |
| High School | 295 | 51.2% |
| College / Undergraduate | 61 | 10.6% |
| Graduate / Professional | 0 | 0.0% |
| Total | 576 | 100.0% |
School Enrollment by Age by Funding Source in West End Cobb Town
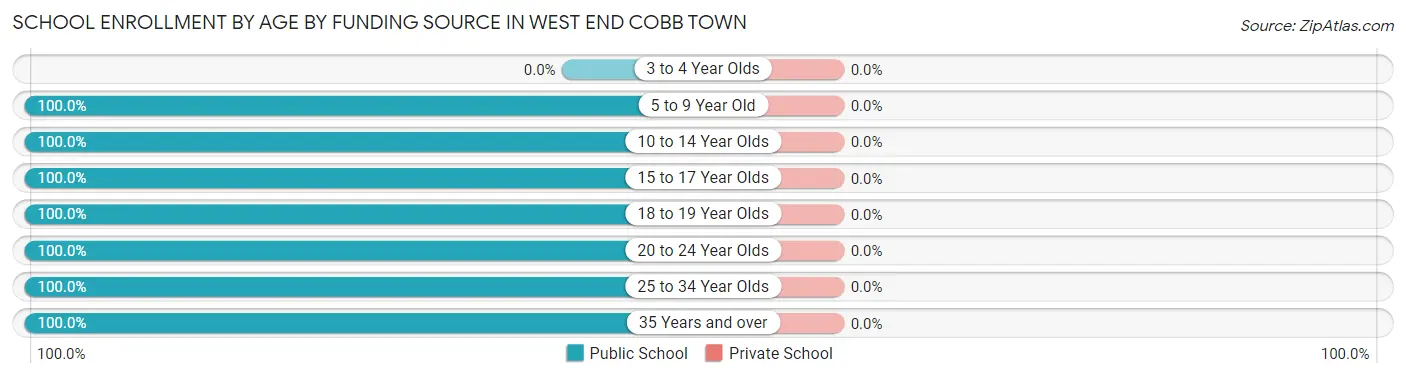
| Age Bracket | Public School | Private School |
| 3 to 4 Year Olds | 0 (0.0%) | 0 (0.0%) |
| 5 to 9 Year Old | 48 (100.0%) | 0 (0.0%) |
| 10 to 14 Year Olds | 184 (100.0%) | 0 (0.0%) |
| 15 to 17 Year Olds | 212 (100.0%) | 0 (0.0%) |
| 18 to 19 Year Olds | 88 (100.0%) | 0 (0.0%) |
| 20 to 24 Year Olds | 9 (100.0%) | 0 (0.0%) |
| 25 to 34 Year Olds | 30 (100.0%) | 0 (0.0%) |
| 35 Years and over | 5 (100.0%) | 0 (0.0%) |
| Total | 576 (100.0%) | 0 (0.0%) |
Educational Attainment by Field of Study in West End Cobb Town
Business (58 | 42.0%), science & technology (30 | 21.7%), liberal arts & history (18 | 13.0%), education (12 | 8.7%), and arts & humanities (8 | 5.8%) are the most common fields of study among 138 individuals in West End Cobb Town who have obtained a bachelor's degree or higher.
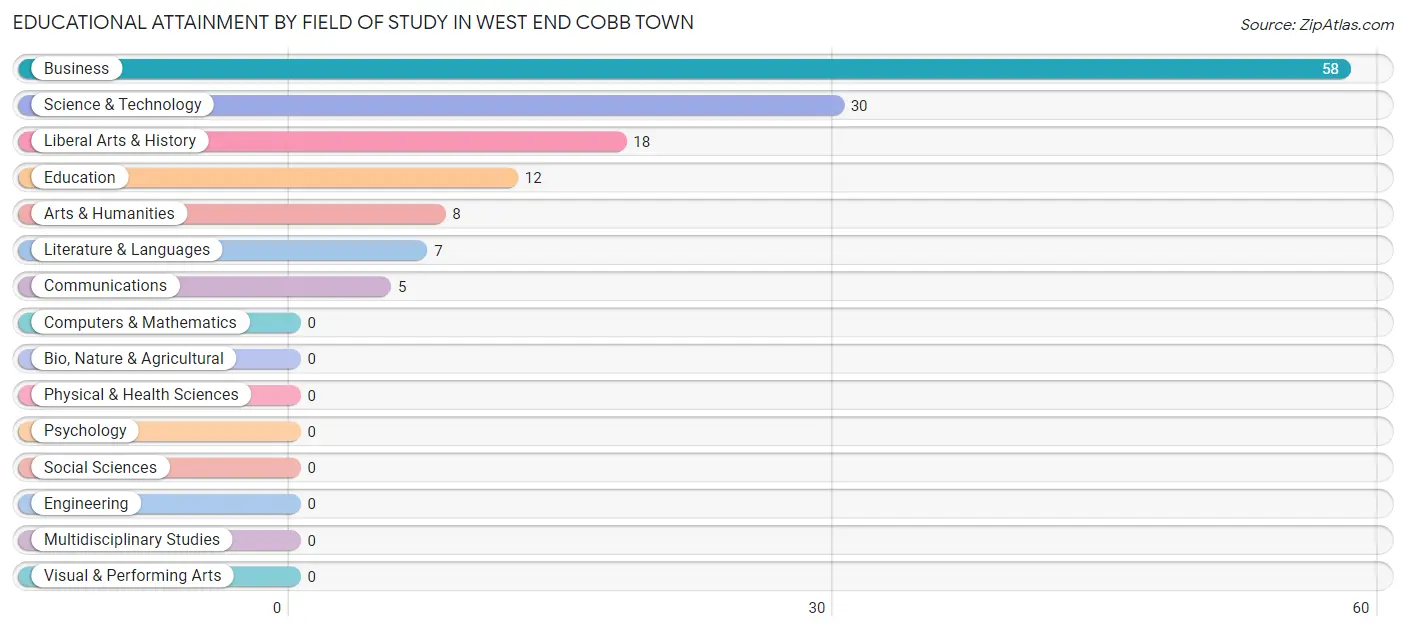
| Field of Study | # Graduates | % Graduates |
| Computers & Mathematics | 0 | 0.0% |
| Bio, Nature & Agricultural | 0 | 0.0% |
| Physical & Health Sciences | 0 | 0.0% |
| Psychology | 0 | 0.0% |
| Social Sciences | 0 | 0.0% |
| Engineering | 0 | 0.0% |
| Multidisciplinary Studies | 0 | 0.0% |
| Science & Technology | 30 | 21.7% |
| Business | 58 | 42.0% |
| Education | 12 | 8.7% |
| Literature & Languages | 7 | 5.1% |
| Liberal Arts & History | 18 | 13.0% |
| Visual & Performing Arts | 0 | 0.0% |
| Communications | 5 | 3.6% |
| Arts & Humanities | 8 | 5.8% |
| Total | 138 | 100.0% |
Transportation & Commute in West End Cobb Town
Vehicle Availability by Sex in West End Cobb Town
The most prevalent vehicle ownership categories in West End Cobb Town are males with 2 vehicles (288, accounting for 34.7%) and females with 2 vehicles (126, making up 65.4%).
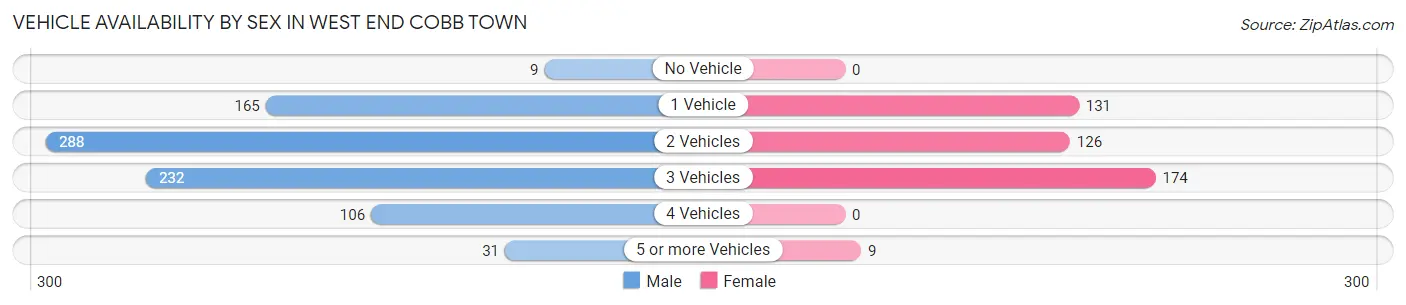
| Vehicles Available | Male | Female |
| No Vehicle | 9 (1.1%) | 0 (0.0%) |
| 1 Vehicle | 165 (19.9%) | 131 (29.8%) |
| 2 Vehicles | 288 (34.7%) | 126 (28.6%) |
| 3 Vehicles | 232 (27.9%) | 174 (39.6%) |
| 4 Vehicles | 106 (12.8%) | 0 (0.0%) |
| 5 or more Vehicles | 31 (3.7%) | 9 (2.1%) |
| Total | 831 (100.0%) | 440 (100.0%) |
Commute Time in West End Cobb Town
The most frequently occuring commute durations in West End Cobb Town are 15 to 19 minutes (359 commuters, 29.1%), 20 to 24 minutes (212 commuters, 17.2%), and 10 to 14 minutes (209 commuters, 17.0%).
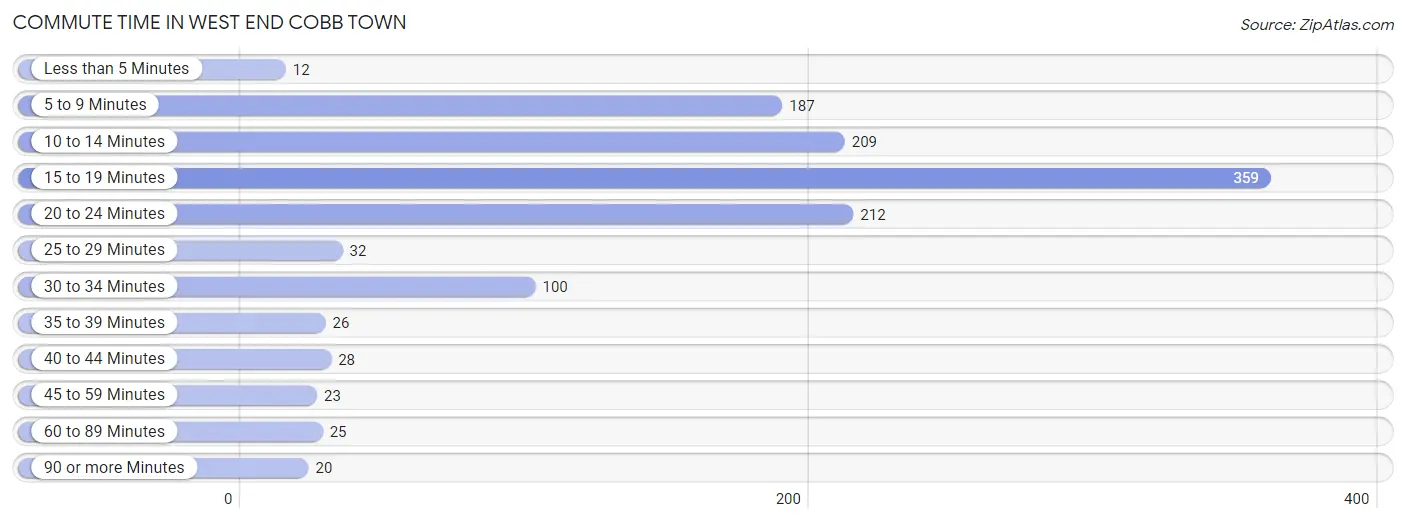
| Commute Time | # Commuters | % Commuters |
| Less than 5 Minutes | 12 | 1.0% |
| 5 to 9 Minutes | 187 | 15.2% |
| 10 to 14 Minutes | 209 | 17.0% |
| 15 to 19 Minutes | 359 | 29.1% |
| 20 to 24 Minutes | 212 | 17.2% |
| 25 to 29 Minutes | 32 | 2.6% |
| 30 to 34 Minutes | 100 | 8.1% |
| 35 to 39 Minutes | 26 | 2.1% |
| 40 to 44 Minutes | 28 | 2.3% |
| 45 to 59 Minutes | 23 | 1.9% |
| 60 to 89 Minutes | 25 | 2.0% |
| 90 or more Minutes | 20 | 1.6% |
Commute Time by Sex in West End Cobb Town
The most common commute times in West End Cobb Town are 15 to 19 minutes (238 commuters, 28.7%) for males and 15 to 19 minutes (121 commuters, 29.9%) for females.
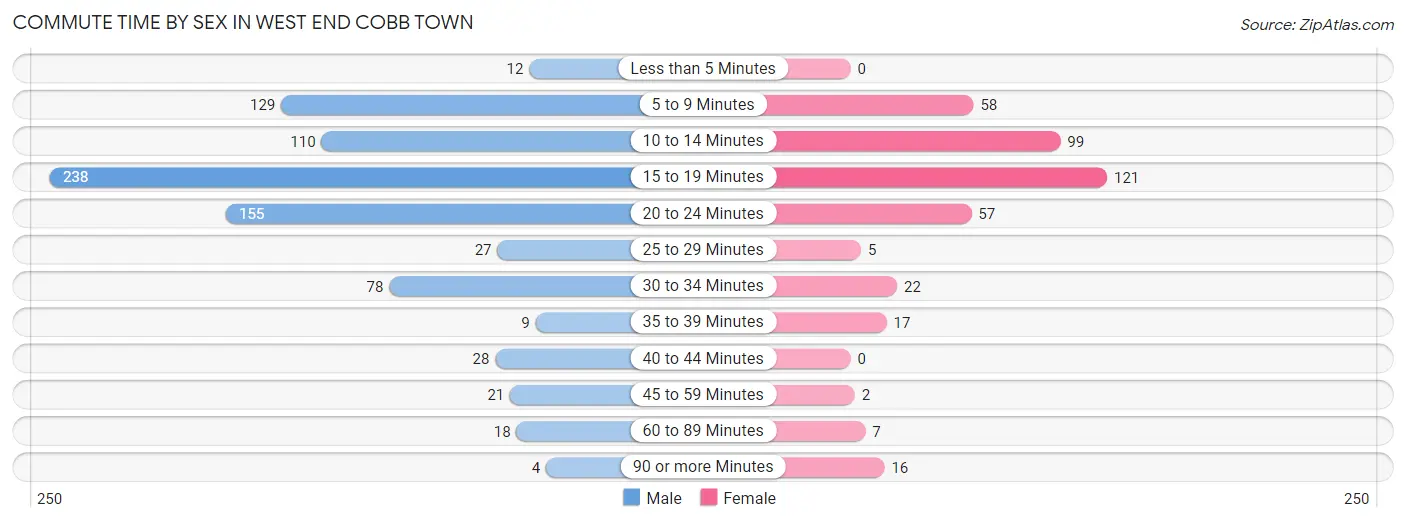
| Commute Time | Male | Female |
| Less than 5 Minutes | 12 (1.5%) | 0 (0.0%) |
| 5 to 9 Minutes | 129 (15.6%) | 58 (14.4%) |
| 10 to 14 Minutes | 110 (13.3%) | 99 (24.5%) |
| 15 to 19 Minutes | 238 (28.7%) | 121 (29.9%) |
| 20 to 24 Minutes | 155 (18.7%) | 57 (14.1%) |
| 25 to 29 Minutes | 27 (3.3%) | 5 (1.2%) |
| 30 to 34 Minutes | 78 (9.4%) | 22 (5.4%) |
| 35 to 39 Minutes | 9 (1.1%) | 17 (4.2%) |
| 40 to 44 Minutes | 28 (3.4%) | 0 (0.0%) |
| 45 to 59 Minutes | 21 (2.5%) | 2 (0.5%) |
| 60 to 89 Minutes | 18 (2.2%) | 7 (1.7%) |
| 90 or more Minutes | 4 (0.5%) | 16 (4.0%) |
Time of Departure to Work by Sex in West End Cobb Town
The most frequent times of departure to work in West End Cobb Town are 12:00 PM to 3:59 PM (154, 18.6%) for males and 7:00 AM to 7:29 AM (102, 25.3%) for females.
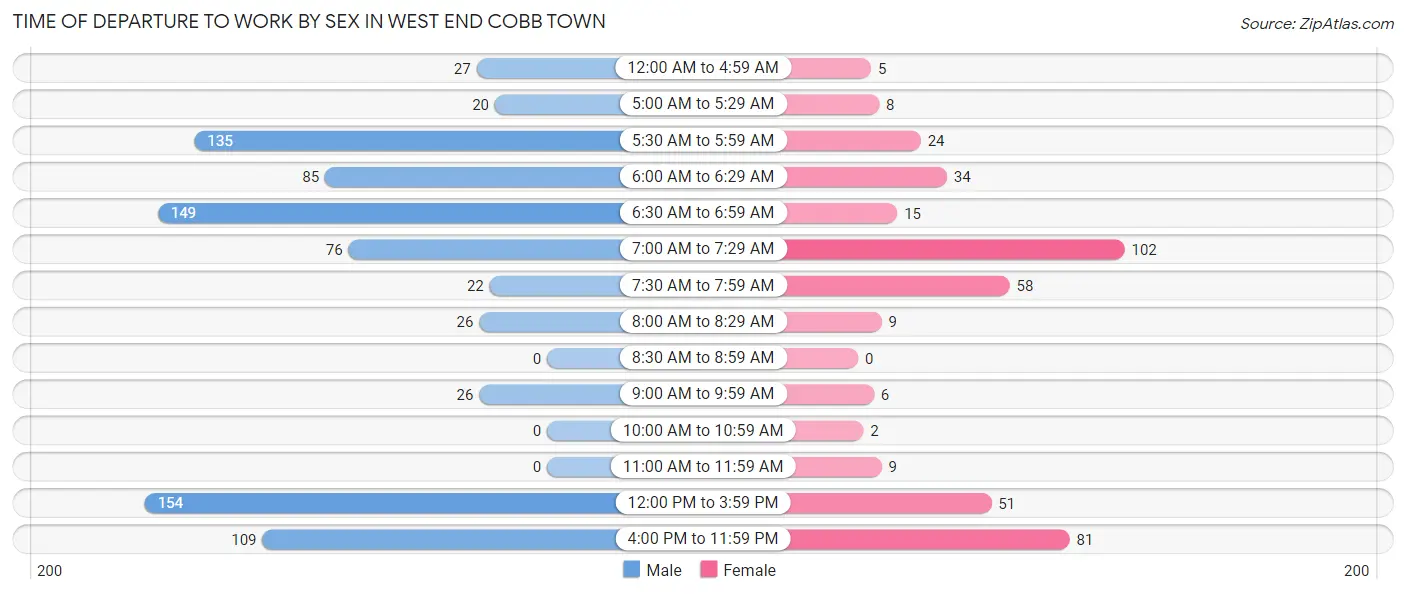
| Time of Departure | Male | Female |
| 12:00 AM to 4:59 AM | 27 (3.3%) | 5 (1.2%) |
| 5:00 AM to 5:29 AM | 20 (2.4%) | 8 (2.0%) |
| 5:30 AM to 5:59 AM | 135 (16.3%) | 24 (5.9%) |
| 6:00 AM to 6:29 AM | 85 (10.2%) | 34 (8.4%) |
| 6:30 AM to 6:59 AM | 149 (18.0%) | 15 (3.7%) |
| 7:00 AM to 7:29 AM | 76 (9.2%) | 102 (25.3%) |
| 7:30 AM to 7:59 AM | 22 (2.6%) | 58 (14.4%) |
| 8:00 AM to 8:29 AM | 26 (3.1%) | 9 (2.2%) |
| 8:30 AM to 8:59 AM | 0 (0.0%) | 0 (0.0%) |
| 9:00 AM to 9:59 AM | 26 (3.1%) | 6 (1.5%) |
| 10:00 AM to 10:59 AM | 0 (0.0%) | 2 (0.5%) |
| 11:00 AM to 11:59 AM | 0 (0.0%) | 9 (2.2%) |
| 12:00 PM to 3:59 PM | 154 (18.6%) | 51 (12.6%) |
| 4:00 PM to 11:59 PM | 109 (13.2%) | 81 (20.1%) |
| Total | 829 (100.0%) | 404 (100.0%) |
Housing Occupancy in West End Cobb Town
Occupancy by Ownership in West End Cobb Town
Of the total 1,262 dwellings in West End Cobb Town, owner-occupied units account for 848 (67.2%), while renter-occupied units make up 414 (32.8%).
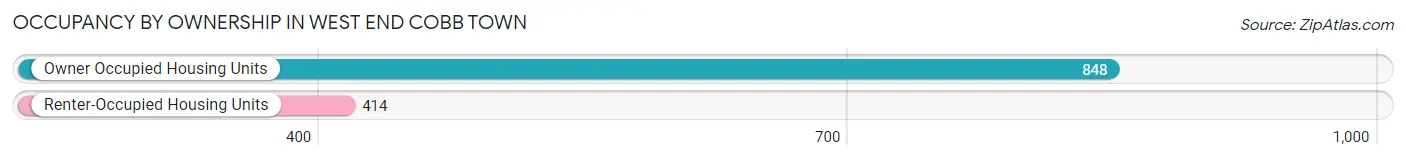
| Occupancy | # Housing Units | % Housing Units |
| Owner Occupied Housing Units | 848 | 67.2% |
| Renter-Occupied Housing Units | 414 | 32.8% |
| Total Occupied Housing Units | 1,262 | 100.0% |
Occupancy by Household Size in West End Cobb Town
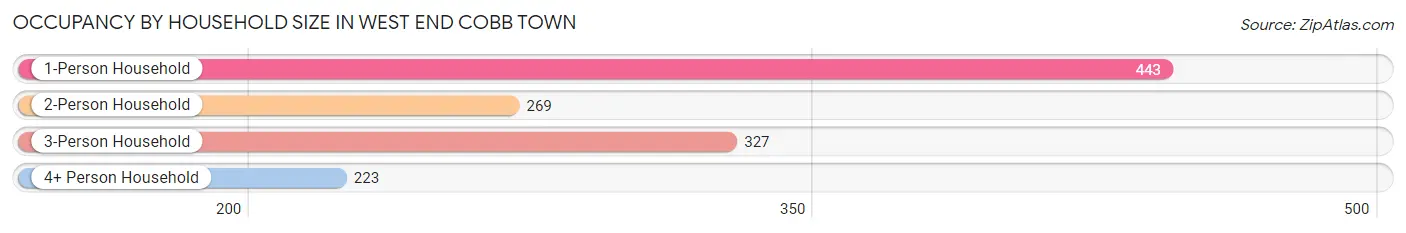
| Household Size | # Housing Units | % Housing Units |
| 1-Person Household | 443 | 35.1% |
| 2-Person Household | 269 | 21.3% |
| 3-Person Household | 327 | 25.9% |
| 4+ Person Household | 223 | 17.7% |
| Total Housing Units | 1,262 | 100.0% |
Occupancy by Ownership by Household Size in West End Cobb Town
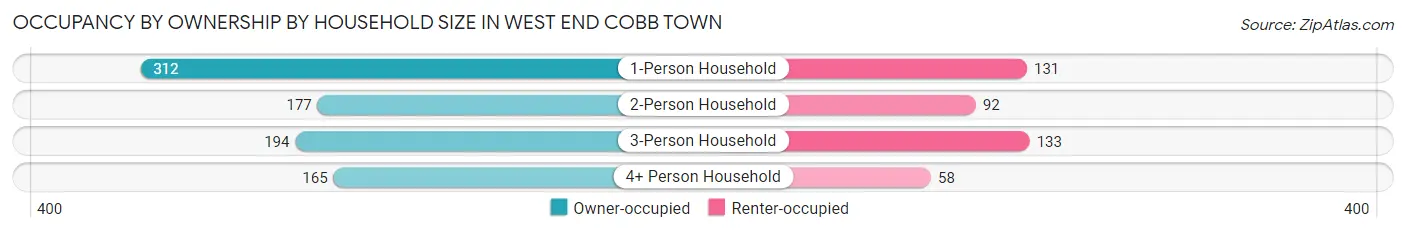
| Household Size | Owner-occupied | Renter-occupied |
| 1-Person Household | 312 (70.4%) | 131 (29.6%) |
| 2-Person Household | 177 (65.8%) | 92 (34.2%) |
| 3-Person Household | 194 (59.3%) | 133 (40.7%) |
| 4+ Person Household | 165 (74.0%) | 58 (26.0%) |
| Total Housing Units | 848 (67.2%) | 414 (32.8%) |
Occupancy by Educational Attainment in West End Cobb Town
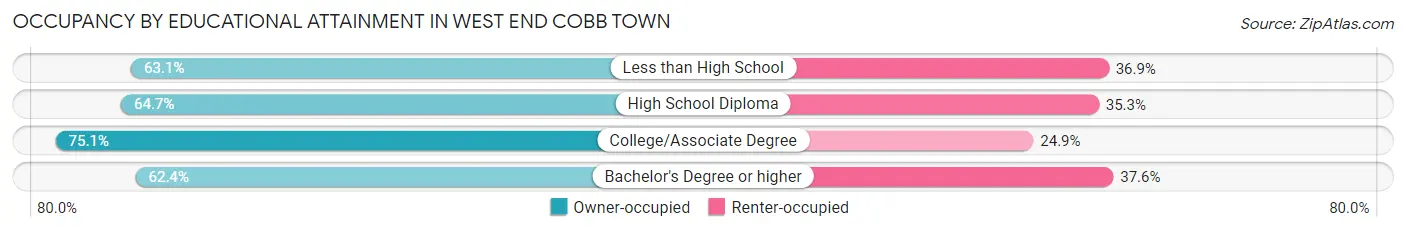
| Household Size | Owner-occupied | Renter-occupied |
| Less than High School | 178 (63.1%) | 104 (36.9%) |
| High School Diploma | 317 (64.7%) | 173 (35.3%) |
| College/Associate Degree | 280 (75.1%) | 93 (24.9%) |
| Bachelor's Degree or higher | 73 (62.4%) | 44 (37.6%) |
Occupancy by Age of Householder in West End Cobb Town
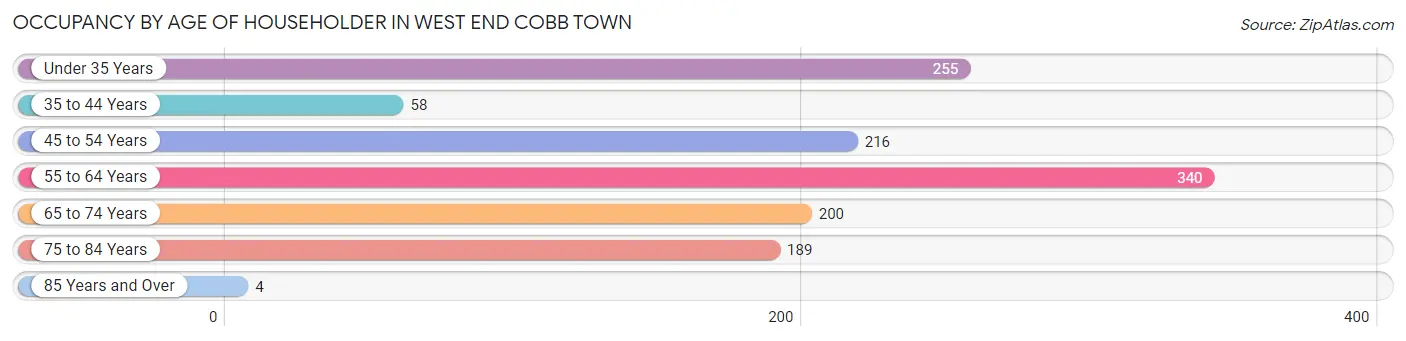
| Age Bracket | # Households | % Households |
| Under 35 Years | 255 | 20.2% |
| 35 to 44 Years | 58 | 4.6% |
| 45 to 54 Years | 216 | 17.1% |
| 55 to 64 Years | 340 | 26.9% |
| 65 to 74 Years | 200 | 15.9% |
| 75 to 84 Years | 189 | 15.0% |
| 85 Years and Over | 4 | 0.3% |
| Total | 1,262 | 100.0% |
Housing Finances in West End Cobb Town
Median Income by Occupancy in West End Cobb Town
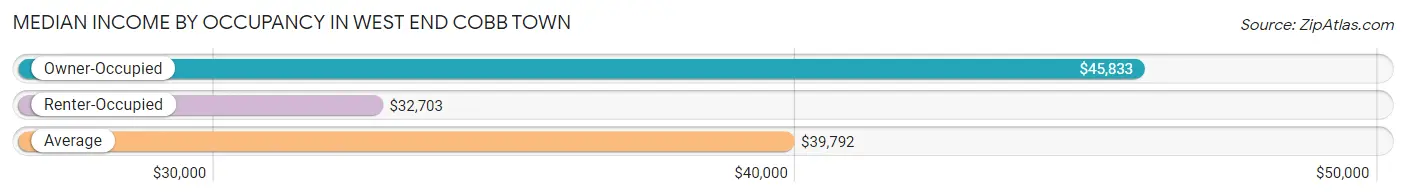
| Occupancy Type | # Households | Median Income |
| Owner-Occupied | 848 (67.2%) | $45,833 |
| Renter-Occupied | 414 (32.8%) | $32,703 |
| Average | 1,262 (100.0%) | $39,792 |
Occupancy by Householder Income Bracket in West End Cobb Town
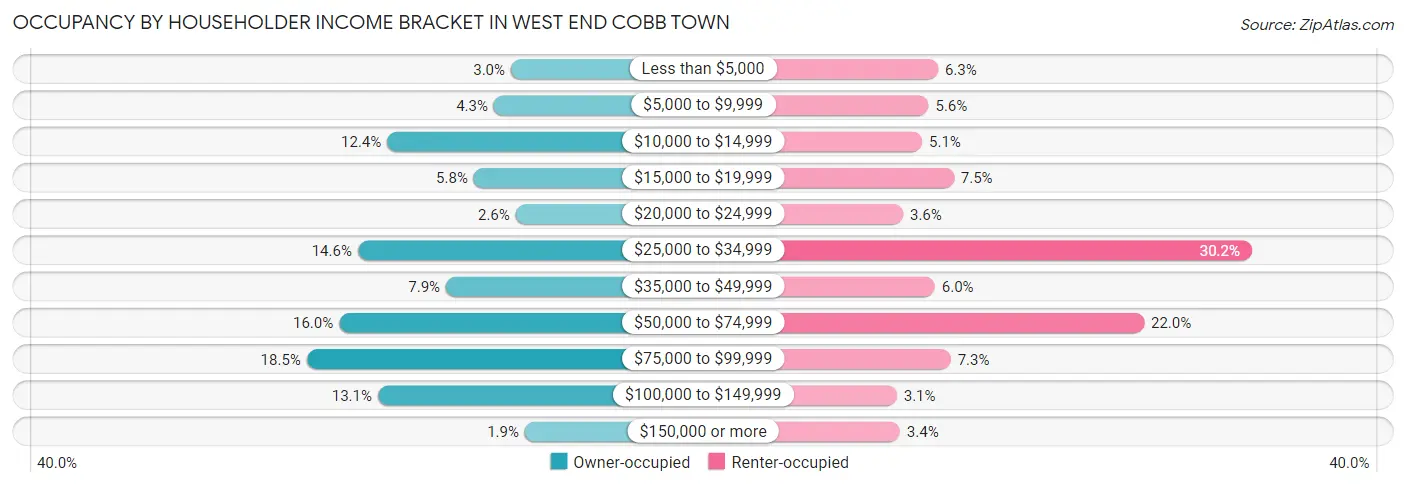
| Income Bracket | Owner-occupied | Renter-occupied |
| Less than $5,000 | 25 (2.9%) | 26 (6.3%) |
| $5,000 to $9,999 | 36 (4.3%) | 23 (5.6%) |
| $10,000 to $14,999 | 105 (12.4%) | 21 (5.1%) |
| $15,000 to $19,999 | 49 (5.8%) | 31 (7.5%) |
| $20,000 to $24,999 | 22 (2.6%) | 15 (3.6%) |
| $25,000 to $34,999 | 124 (14.6%) | 125 (30.2%) |
| $35,000 to $49,999 | 67 (7.9%) | 25 (6.0%) |
| $50,000 to $74,999 | 136 (16.0%) | 91 (22.0%) |
| $75,000 to $99,999 | 157 (18.5%) | 30 (7.2%) |
| $100,000 to $149,999 | 111 (13.1%) | 13 (3.1%) |
| $150,000 or more | 16 (1.9%) | 14 (3.4%) |
| Total | 848 (100.0%) | 414 (100.0%) |
Monthly Housing Cost Tiers in West End Cobb Town
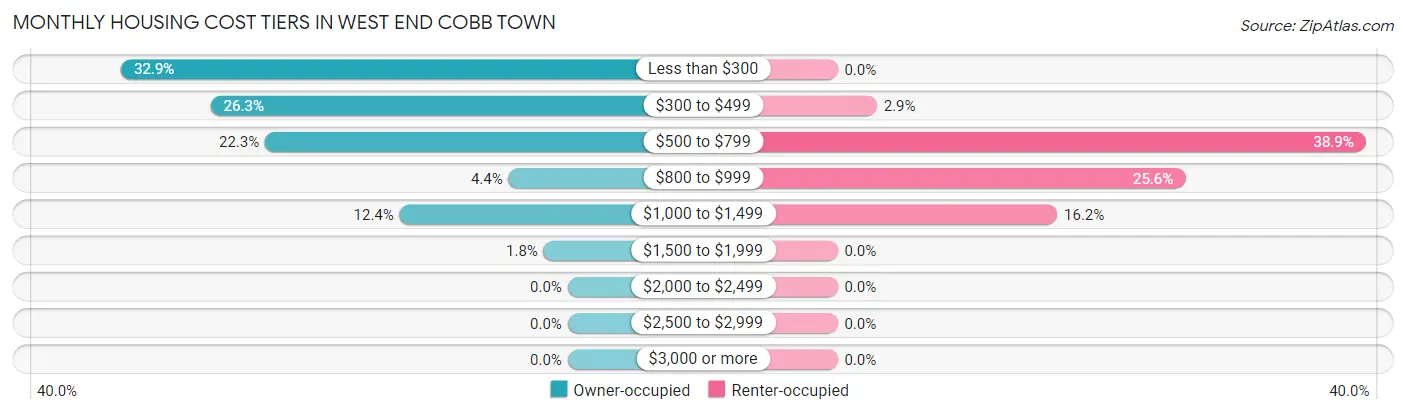
| Monthly Cost | Owner-occupied | Renter-occupied |
| Less than $300 | 279 (32.9%) | 0 (0.0%) |
| $300 to $499 | 223 (26.3%) | 12 (2.9%) |
| $500 to $799 | 189 (22.3%) | 161 (38.9%) |
| $800 to $999 | 37 (4.4%) | 106 (25.6%) |
| $1,000 to $1,499 | 105 (12.4%) | 67 (16.2%) |
| $1,500 to $1,999 | 15 (1.8%) | 0 (0.0%) |
| $2,000 to $2,499 | 0 (0.0%) | 0 (0.0%) |
| $2,500 to $2,999 | 0 (0.0%) | 0 (0.0%) |
| $3,000 or more | 0 (0.0%) | 0 (0.0%) |
| Total | 848 (100.0%) | 414 (100.0%) |
Physical Housing Characteristics in West End Cobb Town
Housing Structures in West End Cobb Town
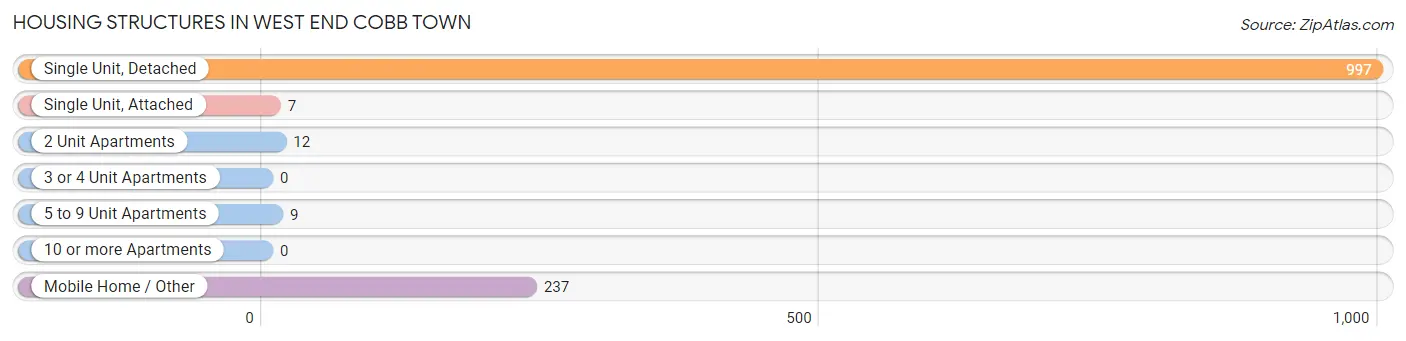
| Structure Type | # Housing Units | % Housing Units |
| Single Unit, Detached | 997 | 79.0% |
| Single Unit, Attached | 7 | 0.5% |
| 2 Unit Apartments | 12 | 0.9% |
| 3 or 4 Unit Apartments | 0 | 0.0% |
| 5 to 9 Unit Apartments | 9 | 0.7% |
| 10 or more Apartments | 0 | 0.0% |
| Mobile Home / Other | 237 | 18.8% |
| Total | 1,262 | 100.0% |
Housing Structures by Occupancy in West End Cobb Town
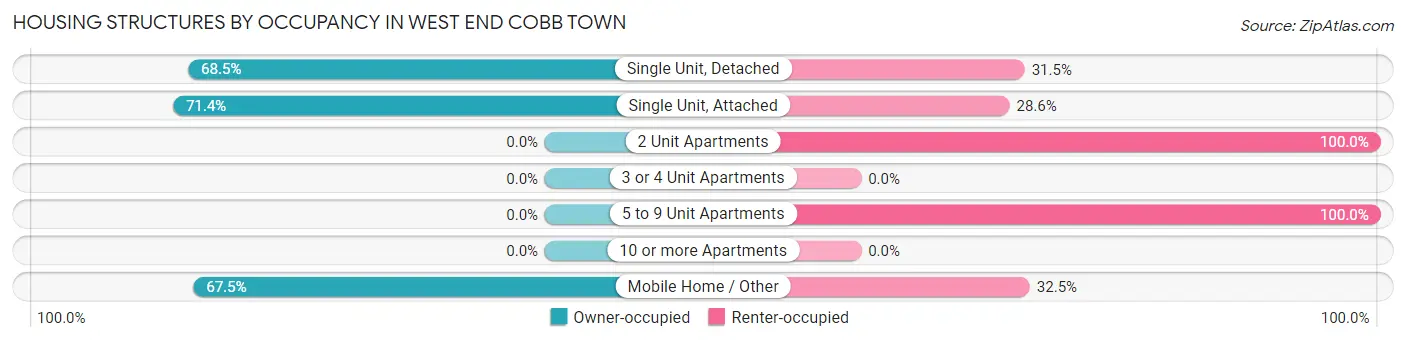
| Structure Type | Owner-occupied | Renter-occupied |
| Single Unit, Detached | 683 (68.5%) | 314 (31.5%) |
| Single Unit, Attached | 5 (71.4%) | 2 (28.6%) |
| 2 Unit Apartments | 0 (0.0%) | 12 (100.0%) |
| 3 or 4 Unit Apartments | 0 (0.0%) | 0 (0.0%) |
| 5 to 9 Unit Apartments | 0 (0.0%) | 9 (100.0%) |
| 10 or more Apartments | 0 (0.0%) | 0 (0.0%) |
| Mobile Home / Other | 160 (67.5%) | 77 (32.5%) |
| Total | 848 (67.2%) | 414 (32.8%) |
Housing Structures by Number of Rooms in West End Cobb Town
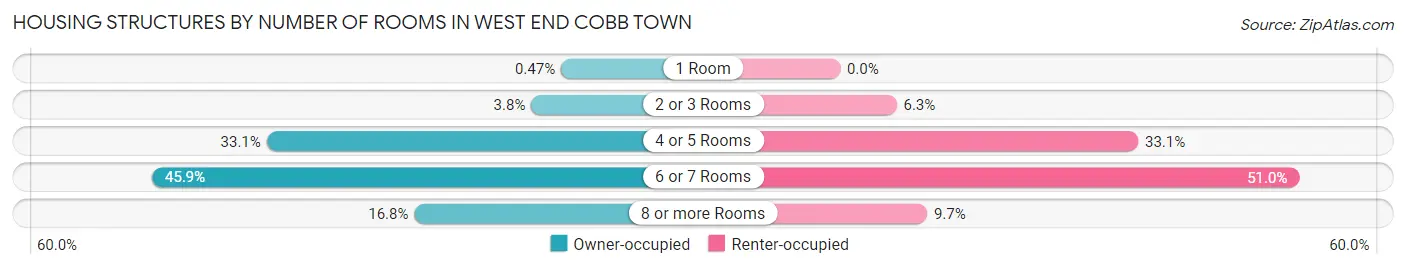
| Number of Rooms | Owner-occupied | Renter-occupied |
| 1 Room | 4 (0.5%) | 0 (0.0%) |
| 2 or 3 Rooms | 32 (3.8%) | 26 (6.3%) |
| 4 or 5 Rooms | 281 (33.1%) | 137 (33.1%) |
| 6 or 7 Rooms | 389 (45.9%) | 211 (51.0%) |
| 8 or more Rooms | 142 (16.8%) | 40 (9.7%) |
| Total | 848 (100.0%) | 414 (100.0%) |
Housing Structure by Heating Type in West End Cobb Town
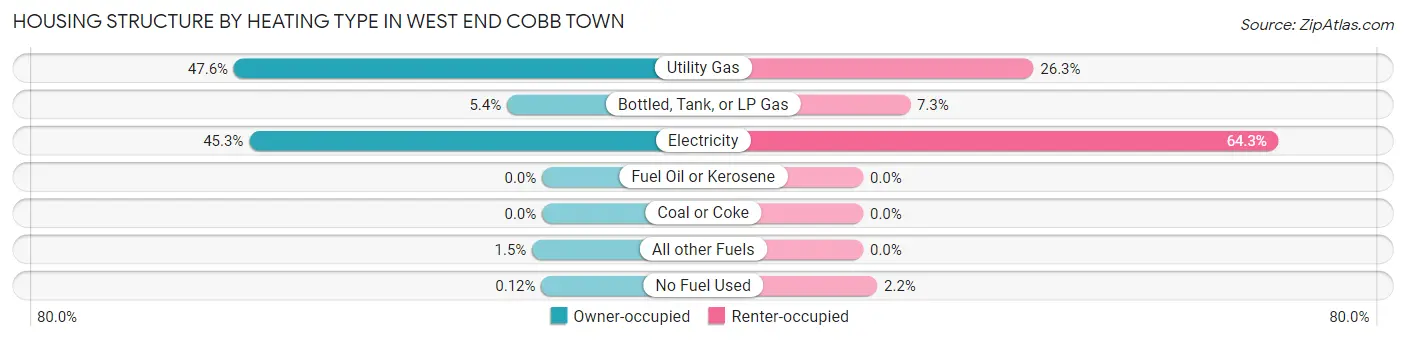
| Heating Type | Owner-occupied | Renter-occupied |
| Utility Gas | 404 (47.6%) | 109 (26.3%) |
| Bottled, Tank, or LP Gas | 46 (5.4%) | 30 (7.2%) |
| Electricity | 384 (45.3%) | 266 (64.2%) |
| Fuel Oil or Kerosene | 0 (0.0%) | 0 (0.0%) |
| Coal or Coke | 0 (0.0%) | 0 (0.0%) |
| All other Fuels | 13 (1.5%) | 0 (0.0%) |
| No Fuel Used | 1 (0.1%) | 9 (2.2%) |
| Total | 848 (100.0%) | 414 (100.0%) |
Household Vehicle Usage in West End Cobb Town
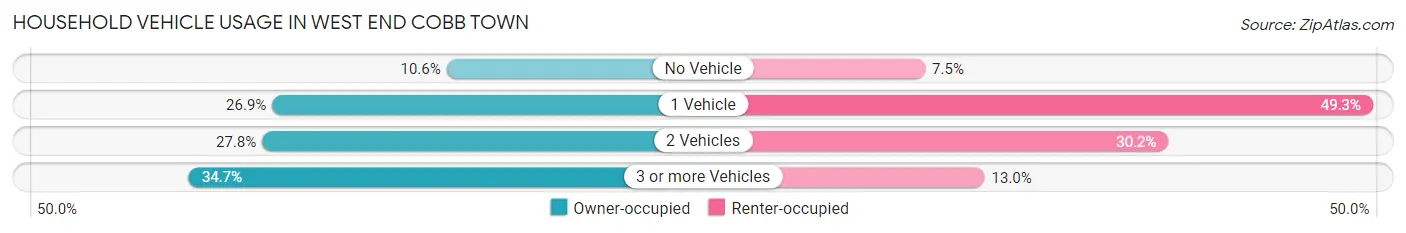
| Vehicles per Household | Owner-occupied | Renter-occupied |
| No Vehicle | 90 (10.6%) | 31 (7.5%) |
| 1 Vehicle | 228 (26.9%) | 204 (49.3%) |
| 2 Vehicles | 236 (27.8%) | 125 (30.2%) |
| 3 or more Vehicles | 294 (34.7%) | 54 (13.0%) |
| Total | 848 (100.0%) | 414 (100.0%) |
Real Estate & Mortgages in West End Cobb Town
Real Estate and Mortgage Overview in West End Cobb Town
| Characteristic | Without Mortgage | With Mortgage |
| Housing Units | 570 | 278 |
| Median Property Value | $61,300 | $102,900 |
| Median Household Income | - | - |
| Monthly Housing Costs | $305 | $0 |
| Real Estate Taxes | $233 | $85 |
Property Value by Mortgage Status in West End Cobb Town
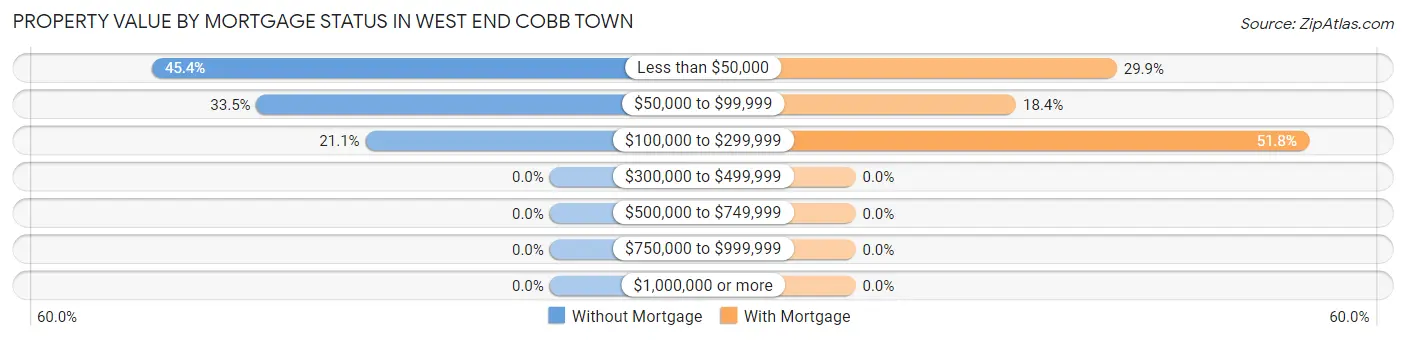
| Property Value | Without Mortgage | With Mortgage |
| Less than $50,000 | 259 (45.4%) | 83 (29.9%) |
| $50,000 to $99,999 | 191 (33.5%) | 51 (18.3%) |
| $100,000 to $299,999 | 120 (21.0%) | 144 (51.8%) |
| $300,000 to $499,999 | 0 (0.0%) | 0 (0.0%) |
| $500,000 to $749,999 | 0 (0.0%) | 0 (0.0%) |
| $750,000 to $999,999 | 0 (0.0%) | 0 (0.0%) |
| $1,000,000 or more | 0 (0.0%) | 0 (0.0%) |
| Total | 570 (100.0%) | 278 (100.0%) |
Household Income by Mortgage Status in West End Cobb Town
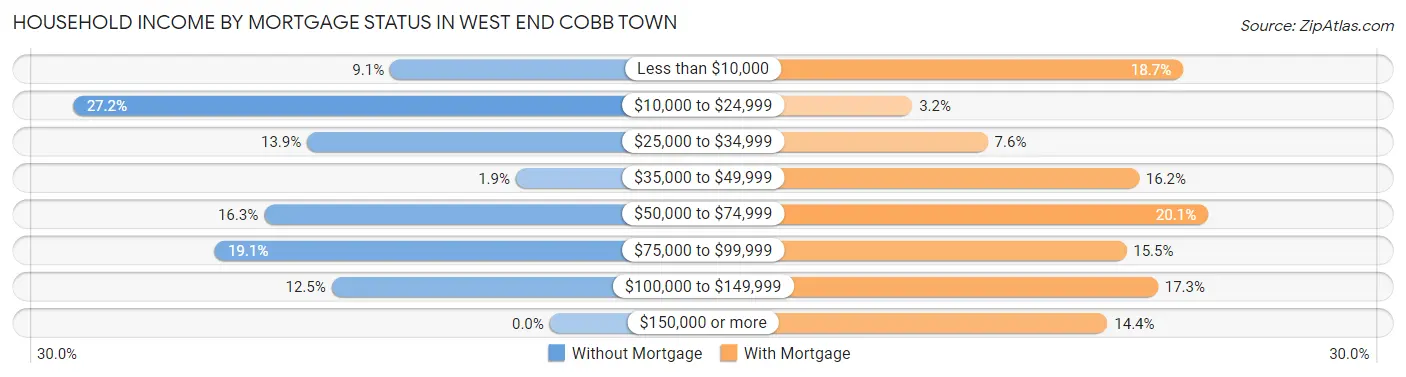
| Household Income | Without Mortgage | With Mortgage |
| Less than $10,000 | 52 (9.1%) | 52 (18.7%) |
| $10,000 to $24,999 | 155 (27.2%) | 9 (3.2%) |
| $25,000 to $34,999 | 79 (13.9%) | 21 (7.5%) |
| $35,000 to $49,999 | 11 (1.9%) | 45 (16.2%) |
| $50,000 to $74,999 | 93 (16.3%) | 56 (20.1%) |
| $75,000 to $99,999 | 109 (19.1%) | 43 (15.5%) |
| $100,000 to $149,999 | 71 (12.5%) | 48 (17.3%) |
| $150,000 or more | 0 (0.0%) | 40 (14.4%) |
| Total | 570 (100.0%) | 278 (100.0%) |
Property Value to Household Income Ratio in West End Cobb Town
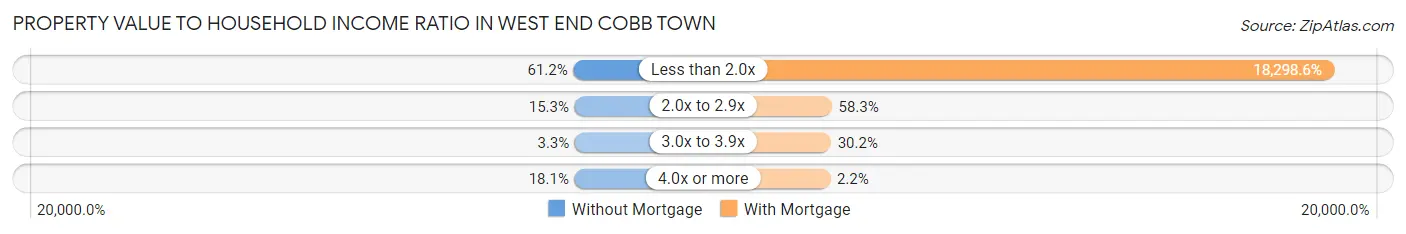
| Value-to-Income Ratio | Without Mortgage | With Mortgage |
| Less than 2.0x | 349 (61.2%) | 50,870 (18,298.6%) |
| 2.0x to 2.9x | 87 (15.3%) | 162 (58.3%) |
| 3.0x to 3.9x | 19 (3.3%) | 84 (30.2%) |
| 4.0x or more | 103 (18.1%) | 6 (2.2%) |
| Total | 570 (100.0%) | 278 (100.0%) |
Real Estate Taxes by Mortgage Status in West End Cobb Town
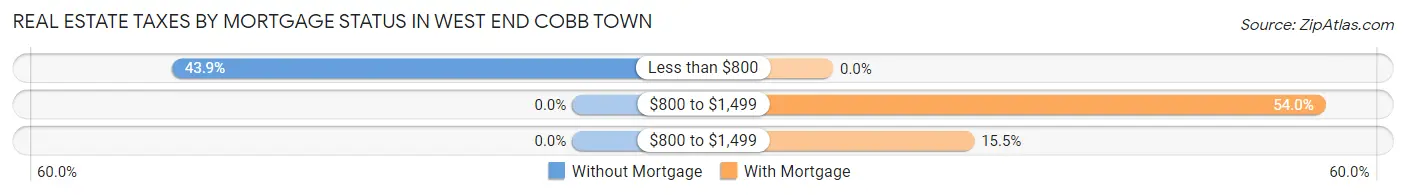
| Property Taxes | Without Mortgage | With Mortgage |
| Less than $800 | 250 (43.9%) | 0 (0.0%) |
| $800 to $1,499 | 0 (0.0%) | 150 (54.0%) |
| $800 to $1,499 | 0 (0.0%) | 43 (15.5%) |
| Total | 570 (100.0%) | 278 (100.0%) |
Health & Disability in West End Cobb Town
Health Insurance Coverage by Age in West End Cobb Town
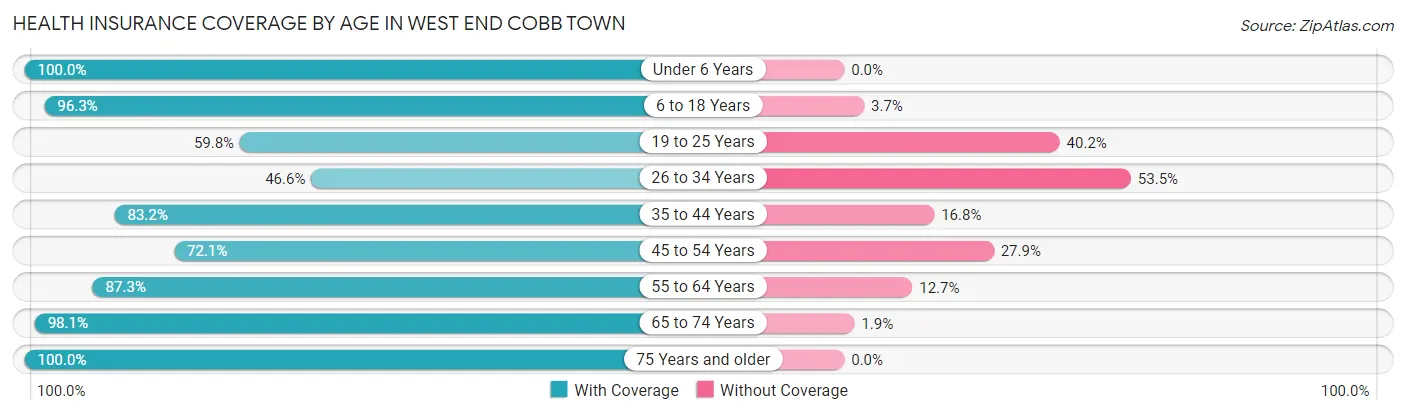
| Age Bracket | With Coverage | Without Coverage |
| Under 6 Years | 124 (100.0%) | 0 (0.0%) |
| 6 to 18 Years | 520 (96.3%) | 20 (3.7%) |
| 19 to 25 Years | 371 (59.8%) | 249 (40.2%) |
| 26 to 34 Years | 162 (46.6%) | 186 (53.4%) |
| 35 to 44 Years | 129 (83.2%) | 26 (16.8%) |
| 45 to 54 Years | 295 (72.1%) | 114 (27.9%) |
| 55 to 64 Years | 489 (87.3%) | 71 (12.7%) |
| 65 to 74 Years | 309 (98.1%) | 6 (1.9%) |
| 75 Years and older | 251 (100.0%) | 0 (0.0%) |
| Total | 2,650 (79.8%) | 672 (20.2%) |
Health Insurance Coverage by Citizenship Status in West End Cobb Town
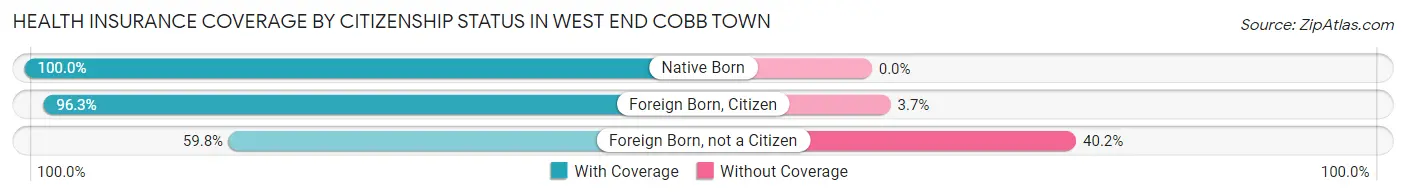
| Citizenship Status | With Coverage | Without Coverage |
| Native Born | 124 (100.0%) | 0 (0.0%) |
| Foreign Born, Citizen | 520 (96.3%) | 20 (3.7%) |
| Foreign Born, not a Citizen | 371 (59.8%) | 249 (40.2%) |
Health Insurance Coverage by Household Income in West End Cobb Town
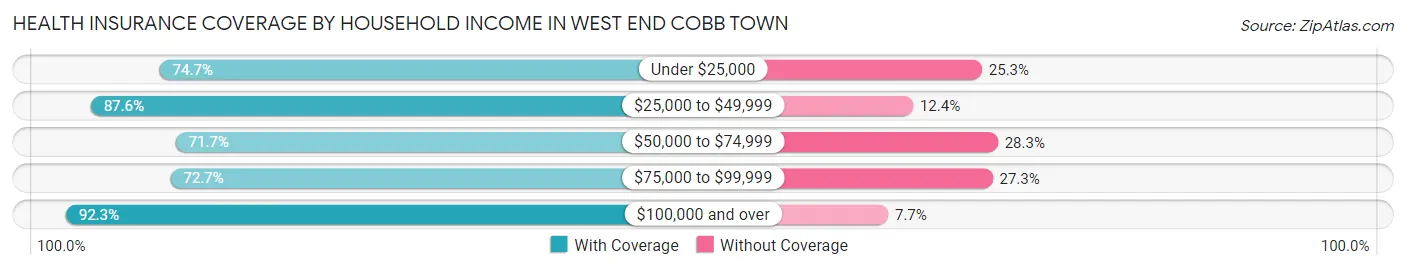
| Household Income | With Coverage | Without Coverage |
| Under $25,000 | 487 (74.7%) | 165 (25.3%) |
| $25,000 to $49,999 | 657 (87.6%) | 93 (12.4%) |
| $50,000 to $74,999 | 454 (71.7%) | 179 (28.3%) |
| $75,000 to $99,999 | 503 (72.7%) | 189 (27.3%) |
| $100,000 and over | 549 (92.3%) | 46 (7.7%) |
Public vs Private Health Insurance Coverage by Age in West End Cobb Town
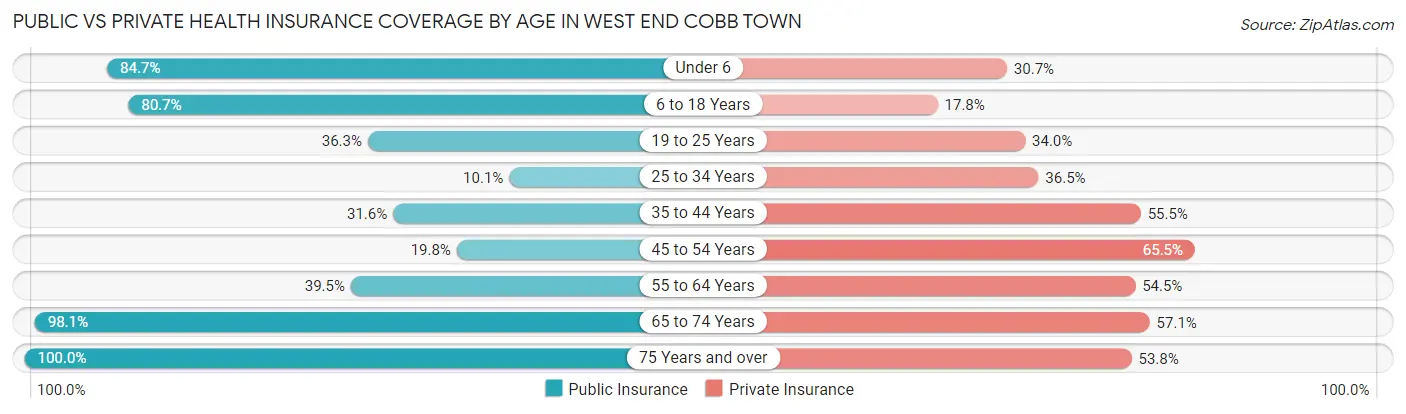
| Age Bracket | Public Insurance | Private Insurance |
| Under 6 | 105 (84.7%) | 38 (30.6%) |
| 6 to 18 Years | 436 (80.7%) | 96 (17.8%) |
| 19 to 25 Years | 225 (36.3%) | 211 (34.0%) |
| 25 to 34 Years | 35 (10.1%) | 127 (36.5%) |
| 35 to 44 Years | 49 (31.6%) | 86 (55.5%) |
| 45 to 54 Years | 81 (19.8%) | 268 (65.5%) |
| 55 to 64 Years | 221 (39.5%) | 305 (54.5%) |
| 65 to 74 Years | 309 (98.1%) | 180 (57.1%) |
| 75 Years and over | 251 (100.0%) | 135 (53.8%) |
| Total | 1,712 (51.5%) | 1,446 (43.5%) |
Disability Status by Sex by Age in West End Cobb Town
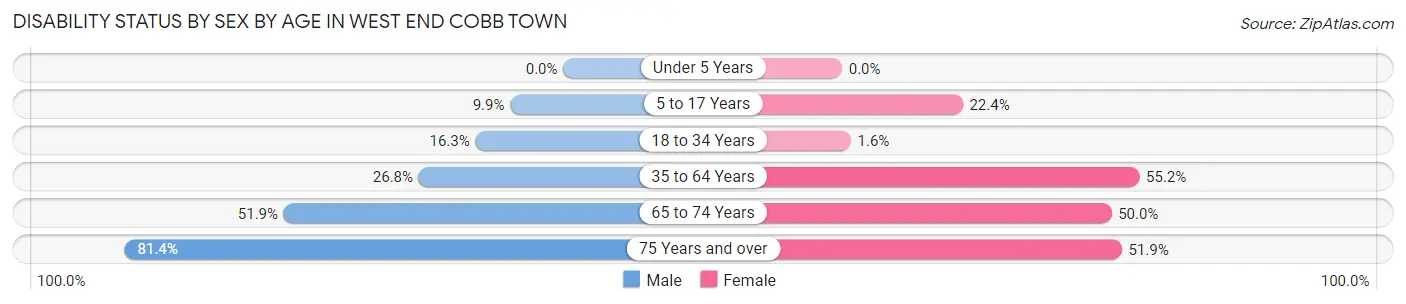
| Age Bracket | Male | Female |
| Under 5 Years | 0 (0.0%) | 0 (0.0%) |
| 5 to 17 Years | 20 (9.9%) | 56 (22.4%) |
| 18 to 34 Years | 104 (16.3%) | 7 (1.6%) |
| 35 to 64 Years | 162 (26.8%) | 287 (55.2%) |
| 65 to 74 Years | 69 (51.9%) | 91 (50.0%) |
| 75 Years and over | 57 (81.4%) | 94 (51.9%) |
Disability Class by Sex by Age in West End Cobb Town
Disability Class: Hearing Difficulty
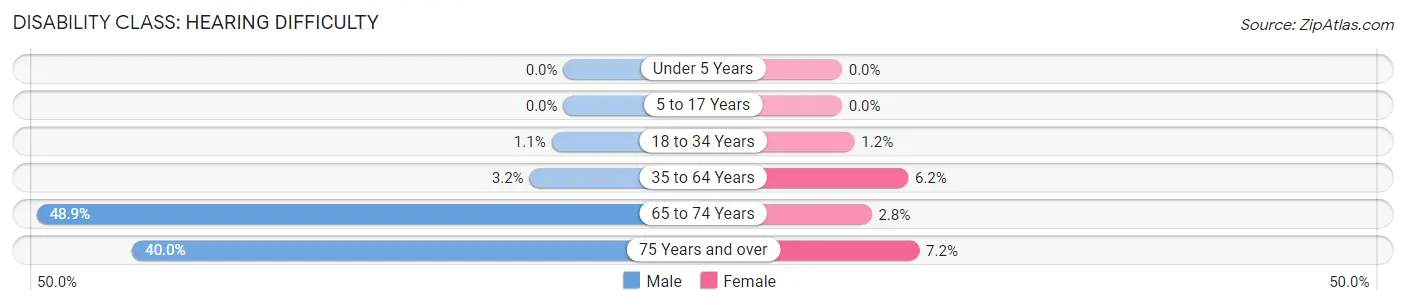
| Age Bracket | Male | Female |
| Under 5 Years | 0 (0.0%) | 0 (0.0%) |
| 5 to 17 Years | 0 (0.0%) | 0 (0.0%) |
| 18 to 34 Years | 7 (1.1%) | 5 (1.2%) |
| 35 to 64 Years | 19 (3.2%) | 32 (6.1%) |
| 65 to 74 Years | 65 (48.9%) | 5 (2.8%) |
| 75 Years and over | 28 (40.0%) | 13 (7.2%) |
Disability Class: Vision Difficulty
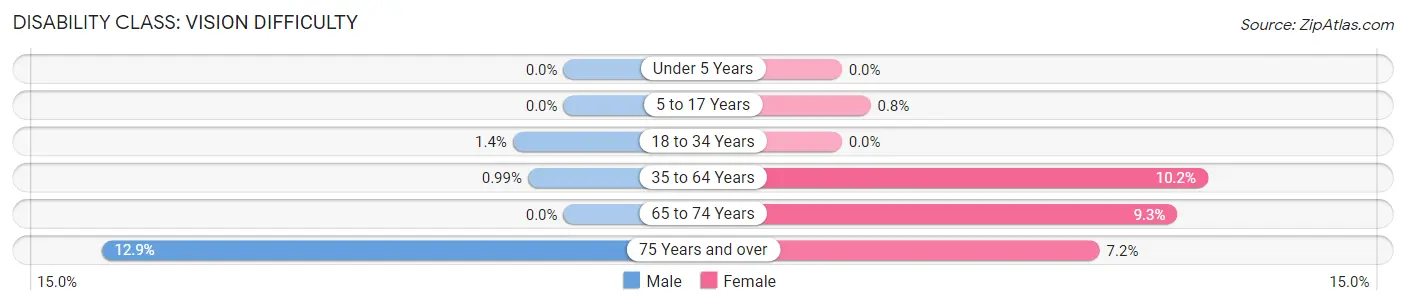
| Age Bracket | Male | Female |
| Under 5 Years | 0 (0.0%) | 0 (0.0%) |
| 5 to 17 Years | 0 (0.0%) | 2 (0.8%) |
| 18 to 34 Years | 9 (1.4%) | 0 (0.0%) |
| 35 to 64 Years | 6 (1.0%) | 53 (10.2%) |
| 65 to 74 Years | 0 (0.0%) | 17 (9.3%) |
| 75 Years and over | 9 (12.9%) | 13 (7.2%) |
Disability Class: Cognitive Difficulty
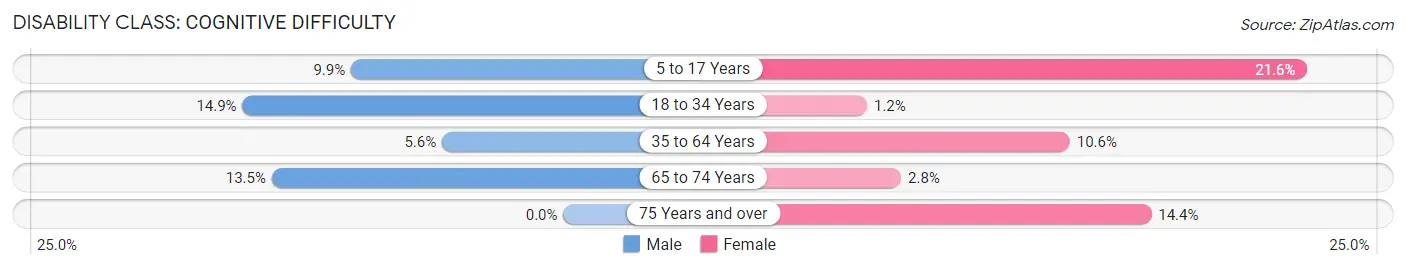
| Age Bracket | Male | Female |
| 5 to 17 Years | 20 (9.9%) | 54 (21.6%) |
| 18 to 34 Years | 95 (14.9%) | 5 (1.2%) |
| 35 to 64 Years | 34 (5.6%) | 55 (10.6%) |
| 65 to 74 Years | 18 (13.5%) | 5 (2.8%) |
| 75 Years and over | 0 (0.0%) | 26 (14.4%) |
Disability Class: Ambulatory Difficulty
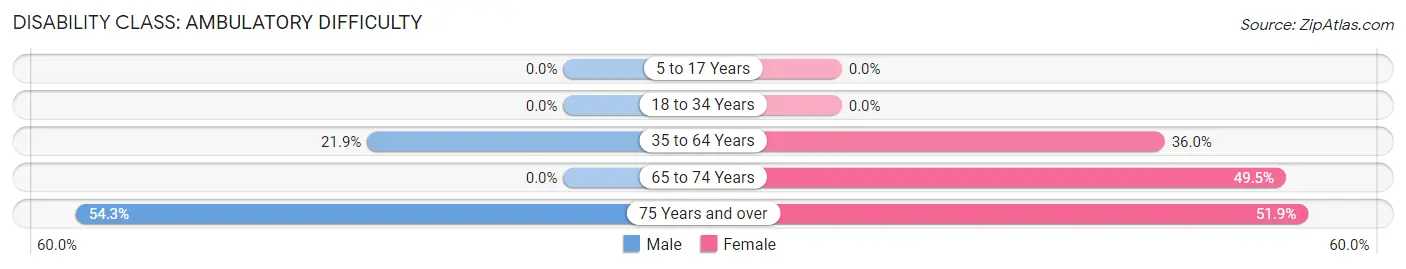
| Age Bracket | Male | Female |
| 5 to 17 Years | 0 (0.0%) | 0 (0.0%) |
| 18 to 34 Years | 0 (0.0%) | 0 (0.0%) |
| 35 to 64 Years | 132 (21.8%) | 187 (36.0%) |
| 65 to 74 Years | 0 (0.0%) | 90 (49.4%) |
| 75 Years and over | 38 (54.3%) | 94 (51.9%) |
Disability Class: Self-Care Difficulty
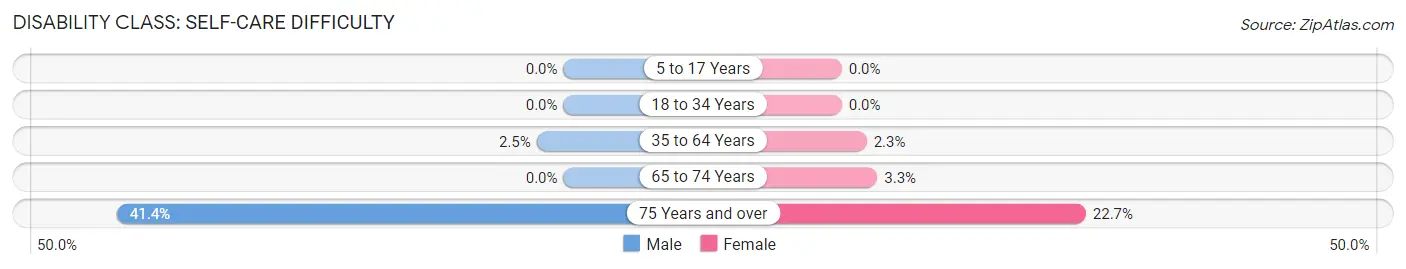
| Age Bracket | Male | Female |
| 5 to 17 Years | 0 (0.0%) | 0 (0.0%) |
| 18 to 34 Years | 0 (0.0%) | 0 (0.0%) |
| 35 to 64 Years | 15 (2.5%) | 12 (2.3%) |
| 65 to 74 Years | 0 (0.0%) | 6 (3.3%) |
| 75 Years and over | 29 (41.4%) | 41 (22.7%) |
Technology Access in West End Cobb Town
Computing Device Access in West End Cobb Town
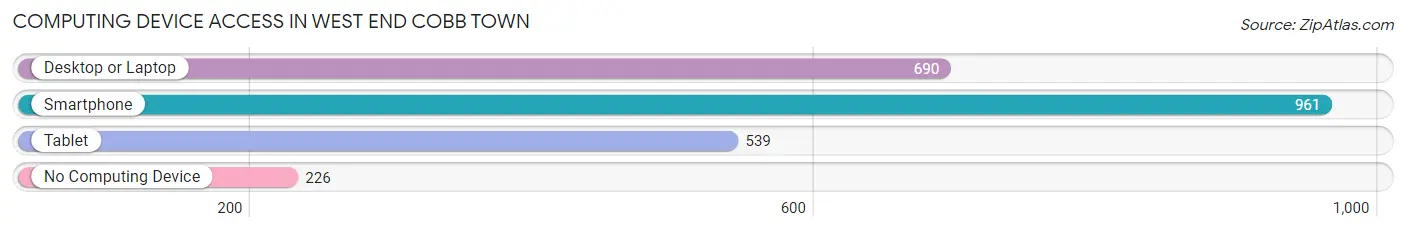
| Device Type | # Households | % Households |
| Desktop or Laptop | 690 | 54.7% |
| Smartphone | 961 | 76.1% |
| Tablet | 539 | 42.7% |
| No Computing Device | 226 | 17.9% |
| Total | 1,262 | 100.0% |
Internet Access in West End Cobb Town
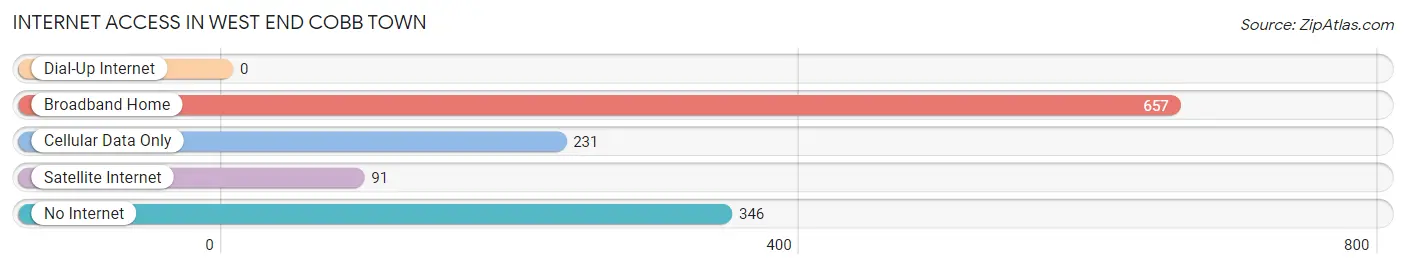
| Internet Type | # Households | % Households |
| Dial-Up Internet | 0 | 0.0% |
| Broadband Home | 657 | 52.1% |
| Cellular Data Only | 231 | 18.3% |
| Satellite Internet | 91 | 7.2% |
| No Internet | 346 | 27.4% |
| Total | 1,262 | 100.0% |
West End Cobb Town Summary
West End Cobb Town is a small town located in the state of Alabama. It is situated in the northwest corner of the state, near the border with Mississippi. The town has a population of approximately 1,000 people and is part of the larger Cobb County. The town is known for its rural charm and its close proximity to the larger cities of Birmingham and Huntsville.
History
West End Cobb Town was founded in 1820 by a group of settlers from Georgia. The town was originally known as West End, but the name was changed to Cobb Town in 1845 in honor of the Cobb family, who had settled in the area. The town was a small farming community until the late 19th century, when the railroad was built through the area. This allowed the town to become a hub for the surrounding agricultural communities, and it soon became a popular destination for travelers.
In the early 20th century, the town began to experience a period of growth and development. The population increased, and new businesses began to open. The town also became a popular destination for tourists, who were drawn to the area's natural beauty and its proximity to larger cities.
Geography
West End Cobb Town is located in the northwest corner of Alabama, near the border with Mississippi. The town is situated in a rural area, surrounded by rolling hills and forests. The town is located on the banks of the Tombigbee River, which provides a scenic backdrop for the town. The town is also located near the larger cities of Birmingham and Huntsville, which are both within a two-hour drive.
Economy
West End Cobb Town is a small, rural town, and its economy is largely based on agriculture. The town is home to several farms, which produce a variety of crops, including corn, soybeans, and cotton. The town also has a few small businesses, including a grocery store, a hardware store, and a few restaurants.
Demographics
As of the 2010 census, the population of West End Cobb Town was 1,000 people. The town is predominantly white, with a small African American population. The median household income is $35,000, and the median home value is $90,000. The town has a low unemployment rate, and most of the residents are employed in the agricultural sector.
Conclusion
West End Cobb Town is a small, rural town located in the northwest corner of Alabama. The town has a population of 1,000 people and is known for its rural charm and its close proximity to larger cities. The town's economy is largely based on agriculture, and the town is home to several farms. The town also has a few small businesses, and the median household income is $35,000. West End Cobb Town is a peaceful and picturesque town, and it is a popular destination for tourists and travelers.
Common Questions
What is Per Capita Income in West End Cobb Town?
Per Capita income in West End Cobb Town is $21,063.
What is the Median Family Income in West End Cobb Town?
Median Family Income in West End Cobb Town is $55,833.
What is the Median Household income in West End Cobb Town?
Median Household Income in West End Cobb Town is $39,792.
What is Income or Wage Gap in West End Cobb Town?
Income or Wage Gap in West End Cobb Town is 62.6%.
Women in West End Cobb Town earn 37.4 cents for every dollar earned by a man.
What is Inequality or Gini Index in West End Cobb Town?
Inequality or Gini Index in West End Cobb Town is 0.42.
What is the Total Population of West End Cobb Town?
Total Population of West End Cobb Town is 3,322.
What is the Total Male Population of West End Cobb Town?
Total Male Population of West End Cobb Town is 1,685.
What is the Total Female Population of West End Cobb Town?
Total Female Population of West End Cobb Town is 1,637.
What is the Ratio of Males per 100 Females in West End Cobb Town?
There are 102.93 Males per 100 Females in West End Cobb Town.
What is the Ratio of Females per 100 Males in West End Cobb Town?
There are 97.15 Females per 100 Males in West End Cobb Town.
What is the Median Population Age in West End Cobb Town?
Median Population Age in West End Cobb Town is 36.6 Years.
What is the Average Family Size in West End Cobb Town
Average Family Size in West End Cobb Town is 3.2 People.
What is the Average Household Size in West End Cobb Town
Average Household Size in West End Cobb Town is 2.6 People.
How Large is the Labor Force in West End Cobb Town?
There are 1,541 People in the Labor Forcein in West End Cobb Town.
What is the Percentage of People in the Labor Force in West End Cobb Town?
53.4% of People are in the Labor Force in West End Cobb Town.
What is the Unemployment Rate in West End Cobb Town?
Unemployment Rate in West End Cobb Town is 16.6%.