Yellow Bluff, AL Map & Demographics
Yellow Bluff Map
Yellow Bluff Overview
$13,330
PER CAPITA INCOME
$12,348
AVG HOUSEHOLD INCOME
92.3%
WAGE / INCOME GAP [ % ]
7.7¢/ $1
WAGE / INCOME GAP [ $ ]
0.33
INEQUALITY / GINI INDEX
140
TOTAL POPULATION
50
MALE POPULATION
90
FEMALE POPULATION
55.56
MALES / 100 FEMALES
180.00
FEMALES / 100 MALES
61.3
MEDIAN AGE
4.6
AVG FAMILY SIZE
1.7
AVG HOUSEHOLD SIZE
42
LABOR FORCE [ PEOPLE ]
32.1%
PERCENT IN LABOR FORCE
54.8%
UNEMPLOYMENT RATE
Yellow Bluff Area Codes
Income in Yellow Bluff
Income Overview in Yellow Bluff
| Characteristic | Number | Measure |
| Per Capita Income | 140 | $13,330 |
| Median Family Income | 14 | $0 |
| Mean Family Income | 14 | $36,700 |
| Median Household Income | 83 | $12,348 |
| Mean Household Income | 83 | $19,719 |
| Income Deficit | 14 | $0 |
| Wage / Income Gap (%) | 140 | 92.26% |
| Wage / Income Gap ($) | 140 | 7.74¢ per $1 |
| Gini / Inequality Index | 140 | 0.33 |
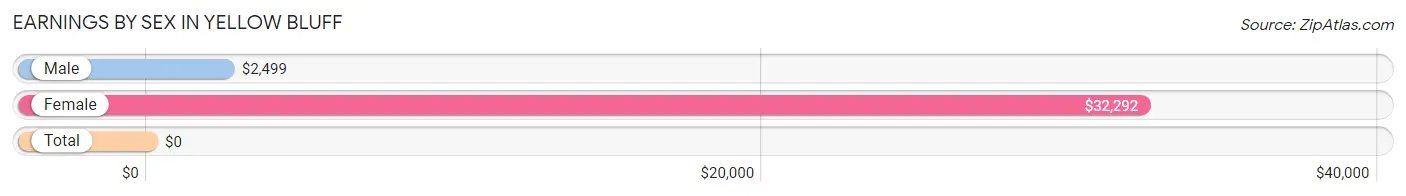
Earnings by Sex in Yellow Bluff
| Sex | Number | Average Earnings |
| Male | 19 (59.4%) | $2,499 |
| Female | 13 (40.6%) | $32,292 |
| Total | 32 (100.0%) | $0 |
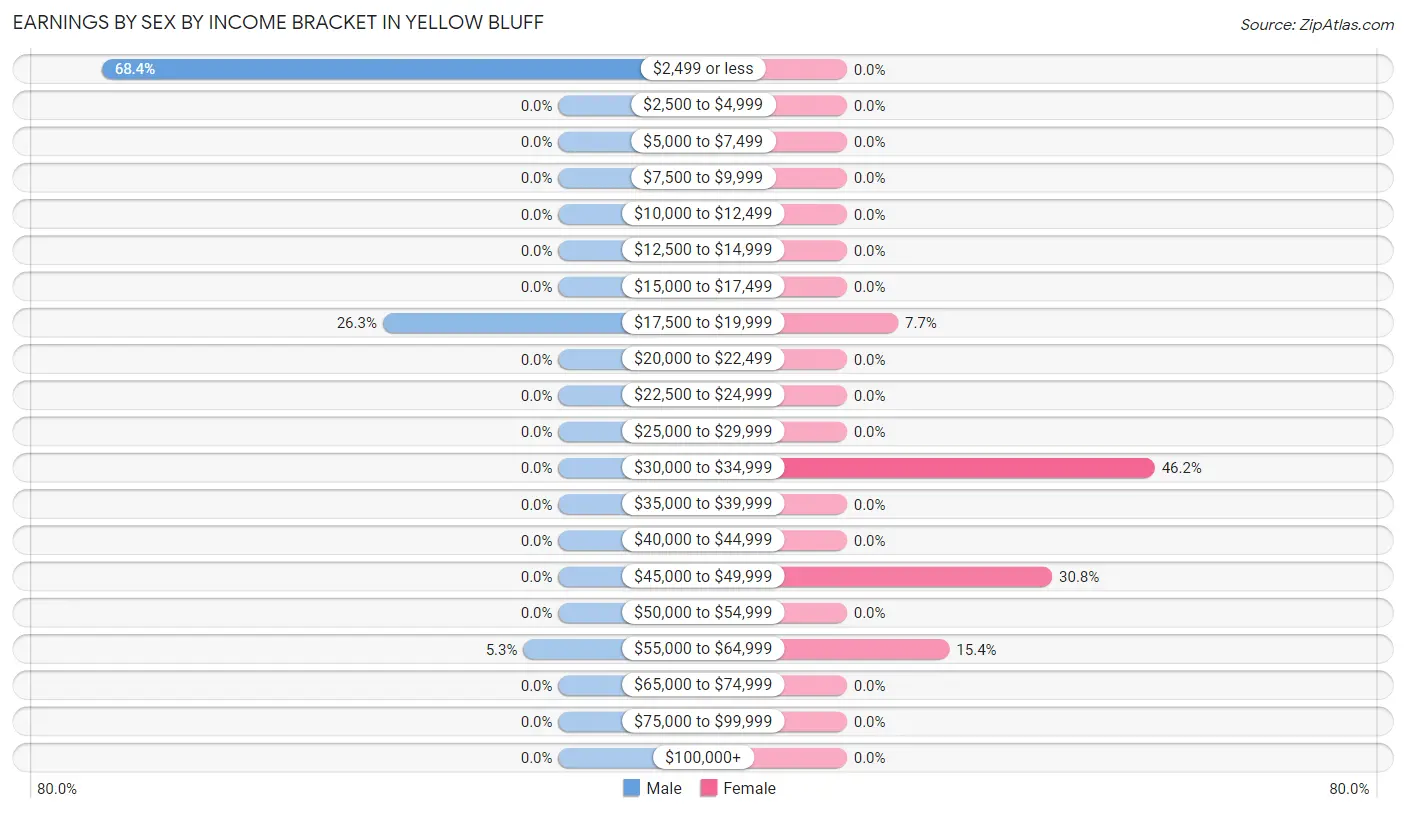
Earnings by Sex by Income Bracket in Yellow Bluff
The most common earnings brackets in Yellow Bluff are $2,499 or less for men (13 | 68.4%) and $30,000 to $34,999 for women (6 | 46.2%).
| Income | Male | Female |
| $2,499 or less | 13 (68.4%) | 0 (0.0%) |
| $2,500 to $4,999 | 0 (0.0%) | 0 (0.0%) |
| $5,000 to $7,499 | 0 (0.0%) | 0 (0.0%) |
| $7,500 to $9,999 | 0 (0.0%) | 0 (0.0%) |
| $10,000 to $12,499 | 0 (0.0%) | 0 (0.0%) |
| $12,500 to $14,999 | 0 (0.0%) | 0 (0.0%) |
| $15,000 to $17,499 | 0 (0.0%) | 0 (0.0%) |
| $17,500 to $19,999 | 5 (26.3%) | 1 (7.7%) |
| $20,000 to $22,499 | 0 (0.0%) | 0 (0.0%) |
| $22,500 to $24,999 | 0 (0.0%) | 0 (0.0%) |
| $25,000 to $29,999 | 0 (0.0%) | 0 (0.0%) |
| $30,000 to $34,999 | 0 (0.0%) | 6 (46.2%) |
| $35,000 to $39,999 | 0 (0.0%) | 0 (0.0%) |
| $40,000 to $44,999 | 0 (0.0%) | 0 (0.0%) |
| $45,000 to $49,999 | 0 (0.0%) | 4 (30.8%) |
| $50,000 to $54,999 | 0 (0.0%) | 0 (0.0%) |
| $55,000 to $64,999 | 1 (5.3%) | 2 (15.4%) |
| $65,000 to $74,999 | 0 (0.0%) | 0 (0.0%) |
| $75,000 to $99,999 | 0 (0.0%) | 0 (0.0%) |
| $100,000+ | 0 (0.0%) | 0 (0.0%) |
| Total | 19 (100.0%) | 13 (100.0%) |
Earnings by Sex by Educational Attainment in Yellow Bluff
| Educational Attainment | Male Income | Female Income |
| Less than High School | - | - |
| High School Diploma | - | - |
| College or Associate's Degree | - | - |
| Bachelor's Degree | - | - |
| Graduate Degree | - | - |
| Total | - | - |
Family Income in Yellow Bluff
Family Income Brackets in Yellow Bluff
According to the Yellow Bluff family income data, there are 7 families falling into the $15,000 to $24,999 income range, which is the most common income bracket and makes up 50.0% of all families.
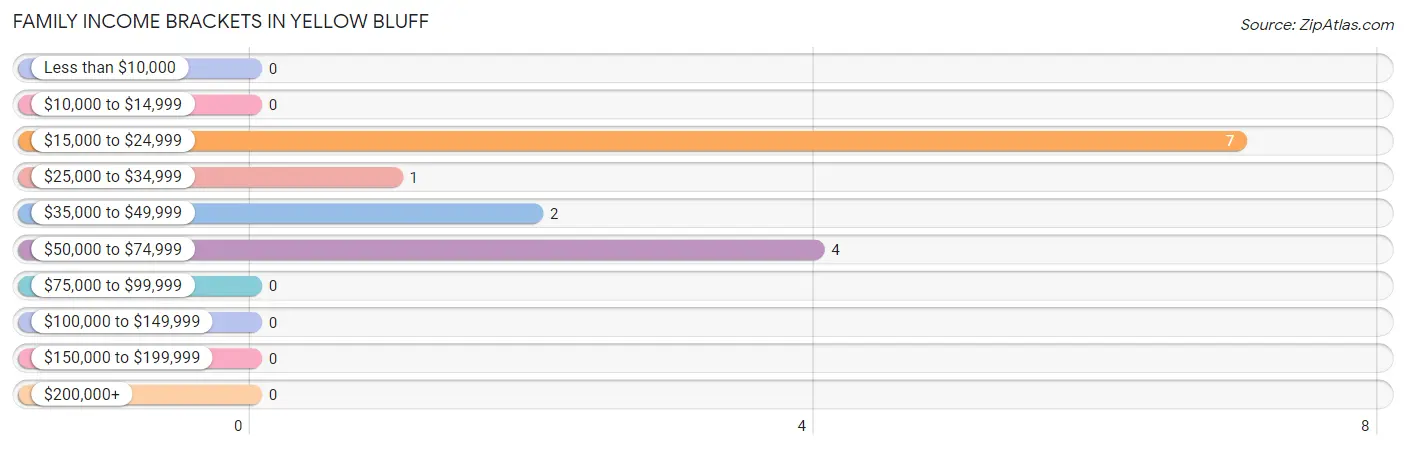
| Income Bracket | # Families | % Families |
| Less than $10,000 | 0 | 0.0% |
| $10,000 to $14,999 | 0 | 0.0% |
| $15,000 to $24,999 | 7 | 50.0% |
| $25,000 to $34,999 | 1 | 7.1% |
| $35,000 to $49,999 | 2 | 14.3% |
| $50,000 to $74,999 | 4 | 28.6% |
| $75,000 to $99,999 | 0 | 0.0% |
| $100,000 to $149,999 | 0 | 0.0% |
| $150,000 to $199,999 | 0 | 0.0% |
| $200,000+ | 0 | 0.0% |
Family Income by Famaliy Size in Yellow Bluff
2-person families (5 | 35.7%) account for the highest median family income in Yellow Bluff with $41,875 per family, while 2-person families (5 | 35.7%) have the highest median income of $20,938 per family member.
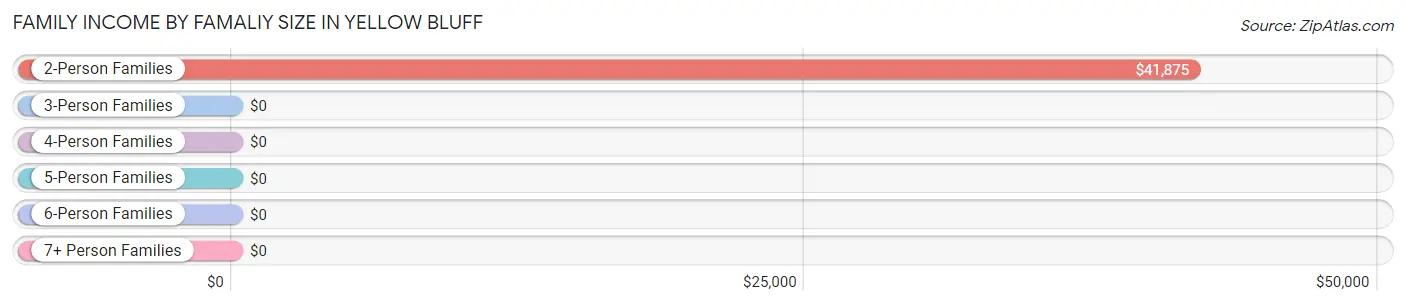
| Income Bracket | # Families | Median Income |
| 2-Person Families | 5 (35.7%) | $41,875 |
| 3-Person Families | 2 (14.3%) | $0 |
| 4-Person Families | 0 (0.0%) | $0 |
| 5-Person Families | 7 (50.0%) | $0 |
| 6-Person Families | 0 (0.0%) | $0 |
| 7+ Person Families | 0 (0.0%) | $0 |
| Total | 14 (100.0%) | $0 |
Family Income by Number of Earners in Yellow Bluff
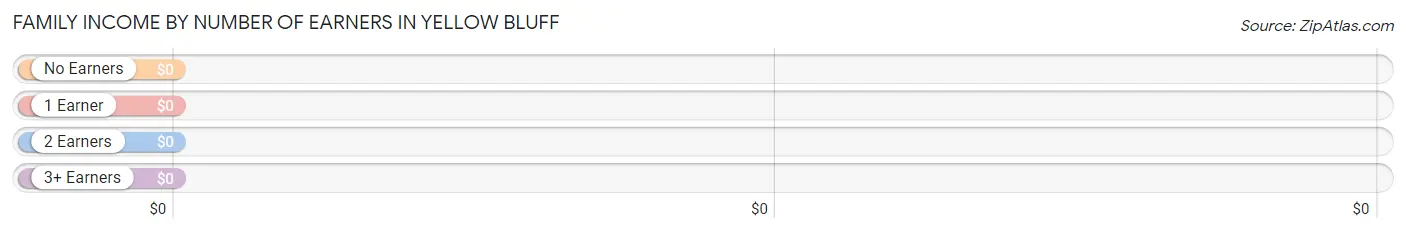
| Number of Earners | # Families | Median Income |
| No Earners | 2 (14.3%) | $0 |
| 1 Earner | 12 (85.7%) | $0 |
| 2 Earners | 0 (0.0%) | $0 |
| 3+ Earners | 0 (0.0%) | $0 |
| Total | 14 (100.0%) | $0 |
Household Income in Yellow Bluff
Household Income Brackets in Yellow Bluff
With 44 households falling in the category, the $10,000 to $14,999 income range is the most frequent in Yellow Bluff, accounting for 53.0% of all households.
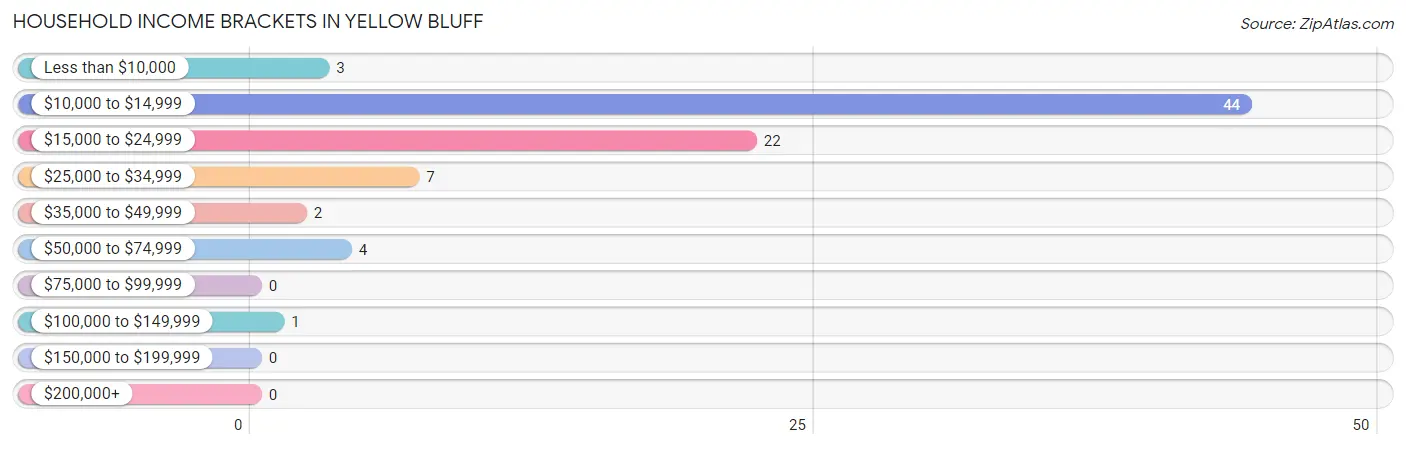
| Income Bracket | # Households | % Households |
| Less than $10,000 | 3 | 3.6% |
| $10,000 to $14,999 | 44 | 53.0% |
| $15,000 to $24,999 | 22 | 26.5% |
| $25,000 to $34,999 | 7 | 8.4% |
| $35,000 to $49,999 | 2 | 2.4% |
| $50,000 to $74,999 | 4 | 4.8% |
| $75,000 to $99,999 | 0 | 0.0% |
| $100,000 to $149,999 | 1 | 1.2% |
| $150,000 to $199,999 | 0 | 0.0% |
| $200,000+ | 0 | 0.0% |
Household Income by Householder Age in Yellow Bluff
The median household income in Yellow Bluff is $12,348, with the highest median household income of $13,750 found in the 45 to 64 years age bracket for the primary householder. A total of 31 households (37.3%) fall into this category.
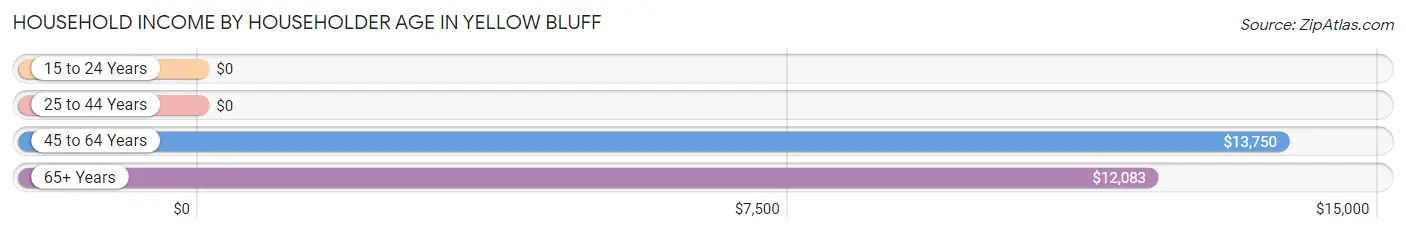
| Income Bracket | # Households | Median Income |
| 15 to 24 Years | 0 (0.0%) | $0 |
| 25 to 44 Years | 1 (1.2%) | $0 |
| 45 to 64 Years | 31 (37.3%) | $13,750 |
| 65+ Years | 51 (61.5%) | $12,083 |
| Total | 83 (100.0%) | $12,348 |
Poverty in Yellow Bluff
Income Below Poverty by Sex and Age in Yellow Bluff
With 37.5% poverty level for males and 77.8% for females among the residents of Yellow Bluff, 18 to 24 year old males and 12 to 14 year old females are the most vulnerable to poverty, with 13 males (72.2%) and 7 females (100.0%) in their respective age groups living below the poverty level.
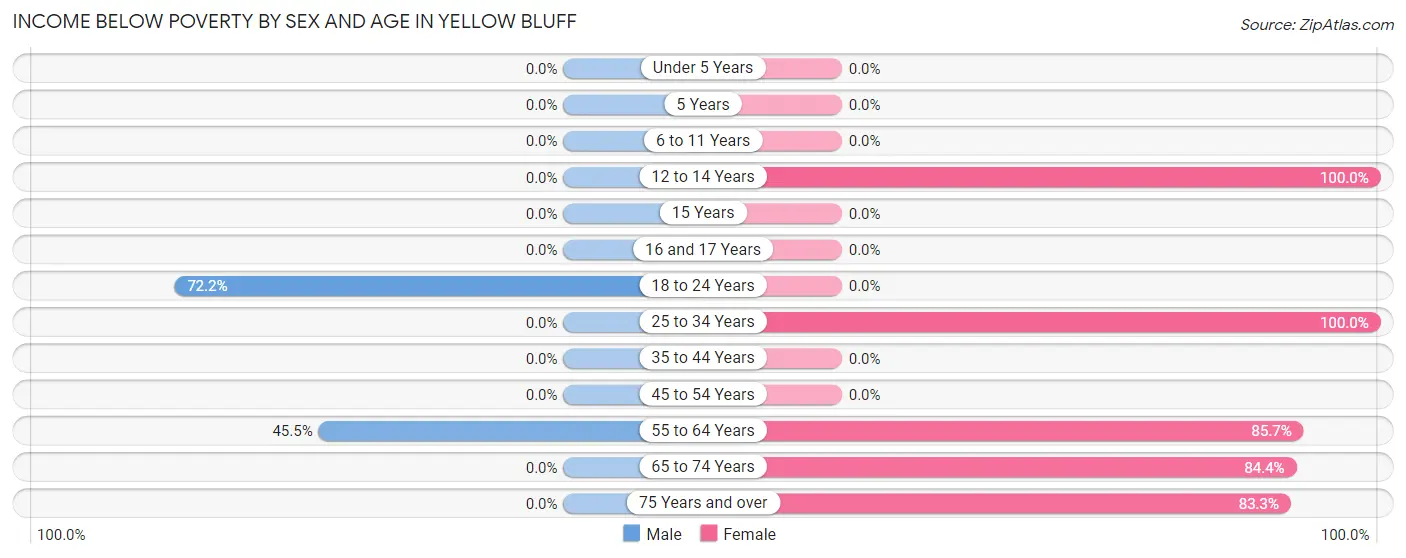
| Age Bracket | Male | Female |
| Under 5 Years | 0 (0.0%) | 0 (0.0%) |
| 5 Years | 0 (0.0%) | 0 (0.0%) |
| 6 to 11 Years | 0 (0.0%) | 0 (0.0%) |
| 12 to 14 Years | 0 (0.0%) | 7 (100.0%) |
| 15 Years | 0 (0.0%) | 0 (0.0%) |
| 16 and 17 Years | 0 (0.0%) | 0 (0.0%) |
| 18 to 24 Years | 13 (72.2%) | 0 (0.0%) |
| 25 to 34 Years | 0 (0.0%) | 8 (100.0%) |
| 35 to 44 Years | 0 (0.0%) | 0 (0.0%) |
| 45 to 54 Years | 0 (0.0%) | 0 (0.0%) |
| 55 to 64 Years | 5 (45.5%) | 18 (85.7%) |
| 65 to 74 Years | 0 (0.0%) | 27 (84.4%) |
| 75 Years and over | 0 (0.0%) | 10 (83.3%) |
| Total | 18 (37.5%) | 70 (77.8%) |
Income Above Poverty by Sex and Age in Yellow Bluff
According to the poverty statistics in Yellow Bluff, males aged 35 to 44 years and females aged 35 to 44 years are the age groups that are most secure financially, with 100.0% of males and 100.0% of females in these age groups living above the poverty line.
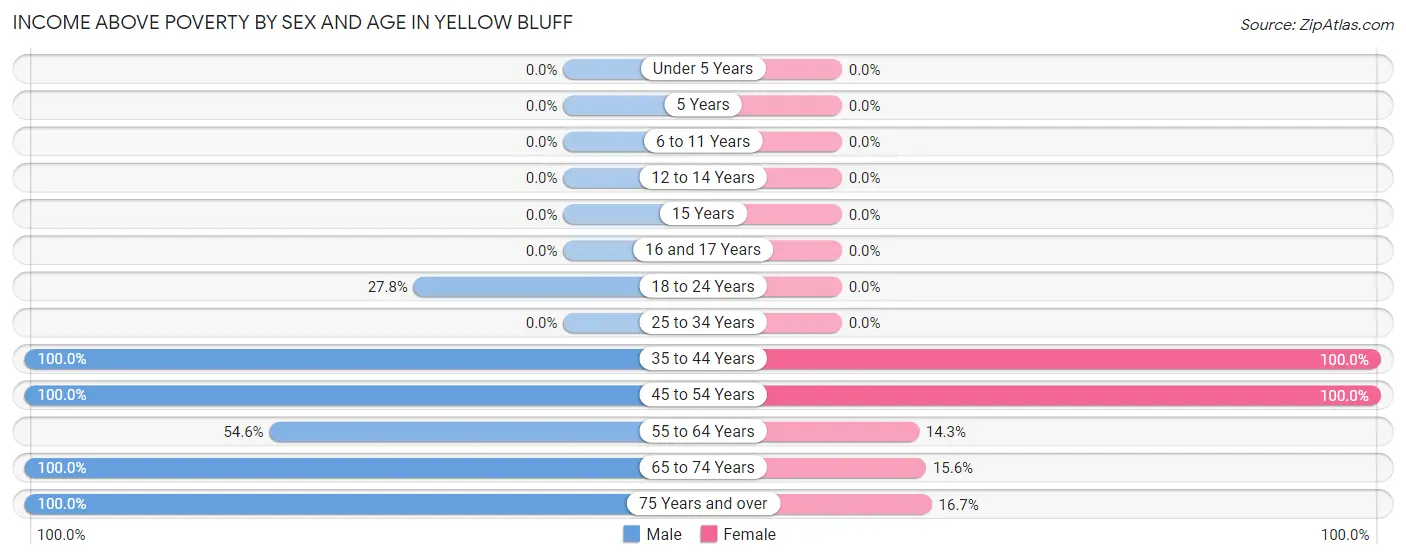
| Age Bracket | Male | Female |
| Under 5 Years | 0 (0.0%) | 0 (0.0%) |
| 5 Years | 0 (0.0%) | 0 (0.0%) |
| 6 to 11 Years | 0 (0.0%) | 0 (0.0%) |
| 12 to 14 Years | 0 (0.0%) | 0 (0.0%) |
| 15 Years | 0 (0.0%) | 0 (0.0%) |
| 16 and 17 Years | 0 (0.0%) | 0 (0.0%) |
| 18 to 24 Years | 5 (27.8%) | 0 (0.0%) |
| 25 to 34 Years | 0 (0.0%) | 0 (0.0%) |
| 35 to 44 Years | 3 (100.0%) | 4 (100.0%) |
| 45 to 54 Years | 5 (100.0%) | 6 (100.0%) |
| 55 to 64 Years | 6 (54.5%) | 3 (14.3%) |
| 65 to 74 Years | 7 (100.0%) | 5 (15.6%) |
| 75 Years and over | 4 (100.0%) | 2 (16.7%) |
| Total | 30 (62.5%) | 20 (22.2%) |
Income Below Poverty Among Married-Couple Families in Yellow Bluff
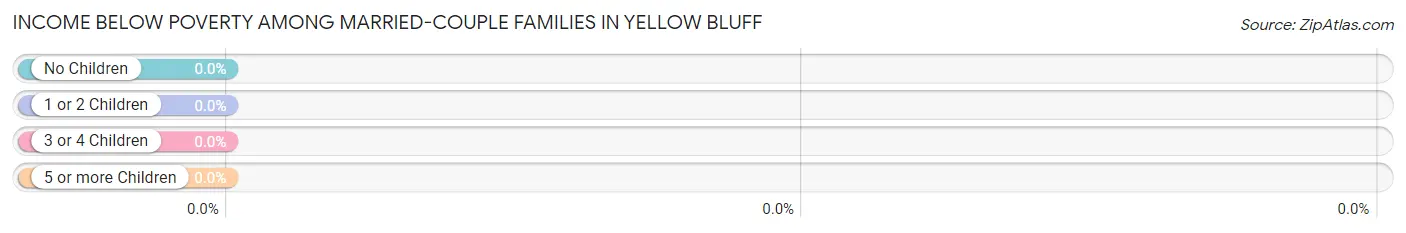
| Children | Above Poverty | Below Poverty |
| No Children | 2 (100.0%) | 0 (0.0%) |
| 1 or 2 Children | 0 (0.0%) | 0 (0.0%) |
| 3 or 4 Children | 0 (0.0%) | 0 (0.0%) |
| 5 or more Children | 0 (0.0%) | 0 (0.0%) |
| Total | 2 (100.0%) | 0 (0.0%) |
Income Below Poverty Among Single-Parent Households in Yellow Bluff
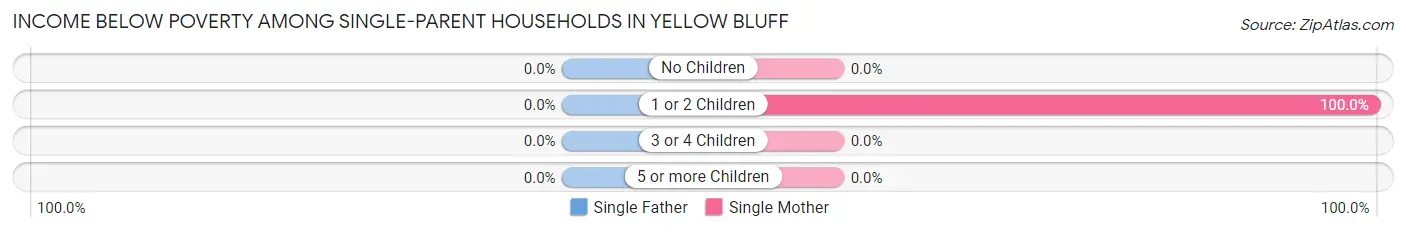
| Children | Single Father | Single Mother |
| No Children | 0 (0.0%) | 0 (0.0%) |
| 1 or 2 Children | 0 (0.0%) | 7 (100.0%) |
| 3 or 4 Children | 0 (0.0%) | 0 (0.0%) |
| 5 or more Children | 0 (0.0%) | 0 (0.0%) |
| Total | 0 (0.0%) | 7 (63.6%) |
Income Below Poverty Among Married-Couple vs Single-Parent Households in Yellow Bluff
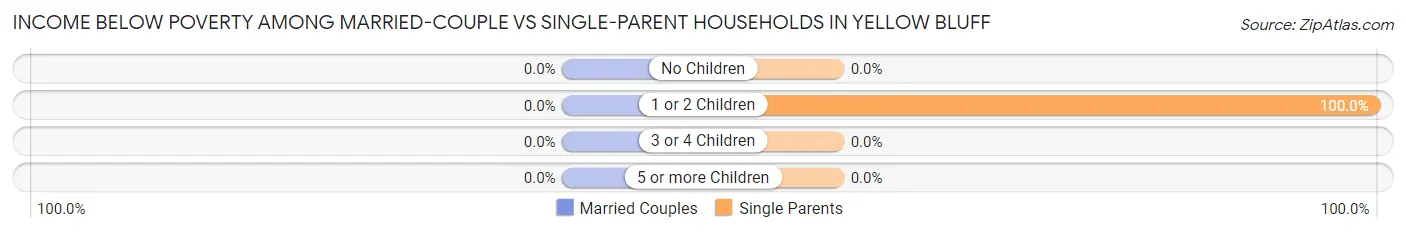
| Children | Married-Couple Families | Single-Parent Households |
| No Children | 0 (0.0%) | 0 (0.0%) |
| 1 or 2 Children | 0 (0.0%) | 7 (100.0%) |
| 3 or 4 Children | 0 (0.0%) | 0 (0.0%) |
| 5 or more Children | 0 (0.0%) | 0 (0.0%) |
| Total | 0 (0.0%) | 7 (58.3%) |
Race in Yellow Bluff
The most populous races in Yellow Bluff are Black / African American (132 | 94.3%), Native / Alaskan (5 | 3.6%), and White / Caucasian (3 | 2.1%).
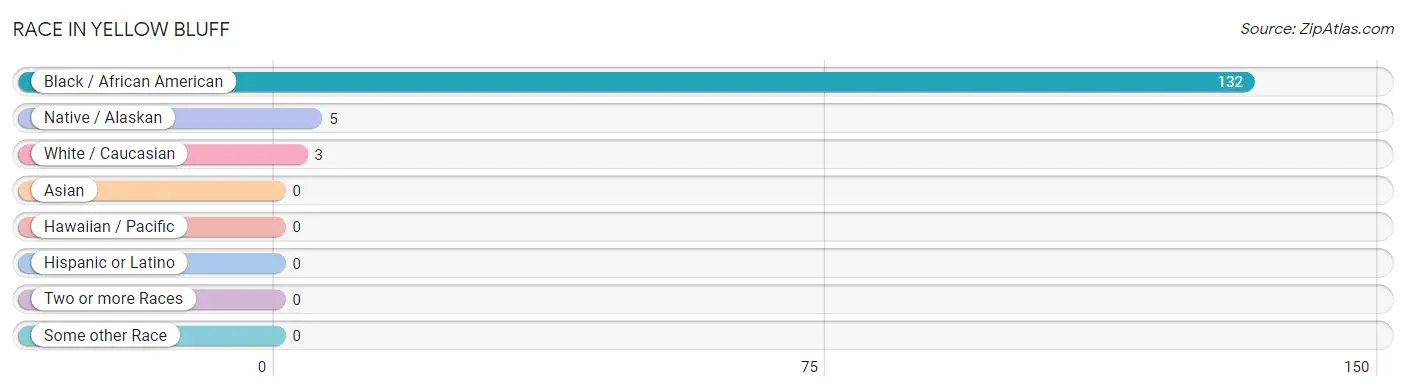
| Race | # Population | % Population |
| Asian | 0 | 0.0% |
| Black / African American | 132 | 94.3% |
| Hawaiian / Pacific | 0 | 0.0% |
| Hispanic or Latino | 0 | 0.0% |
| Native / Alaskan | 5 | 3.6% |
| White / Caucasian | 3 | 2.1% |
| Two or more Races | 0 | 0.0% |
| Some other Race | 0 | 0.0% |
| Total | 140 | 100.0% |
Ancestry in Yellow Bluff
The most populous ancestries reported in Yellow Bluff are American (10 | 7.1%), Alaska Native (5 | 3.6%), and English (2 | 1.4%), together accounting for 12.1% of all Yellow Bluff residents.
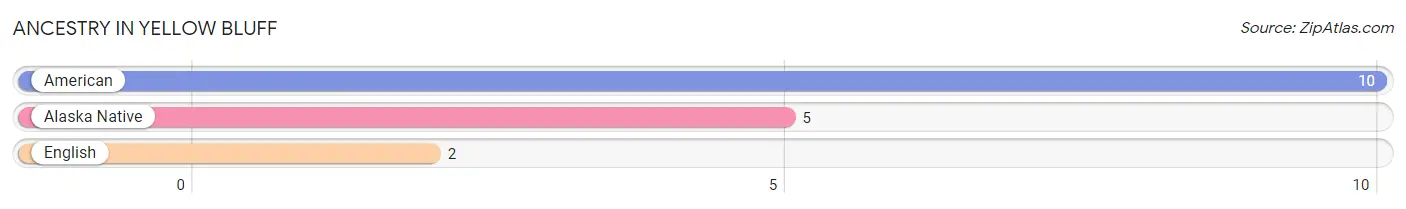
| Ancestry | # Population | % Population |
| Alaska Native | 5 | 3.6% |
| American | 10 | 7.1% |
| English | 2 | 1.4% | View All 3 Rows |
Immigrants in Yellow Bluff

| Immigration Origin | # Population | % Population | View All 0 Rows |
Sex and Age in Yellow Bluff
Sex and Age in Yellow Bluff
The most populous age groups in Yellow Bluff are 20 to 24 Years (18 | 36.0%) for men and 65 to 69 Years (31 | 34.4%) for women.
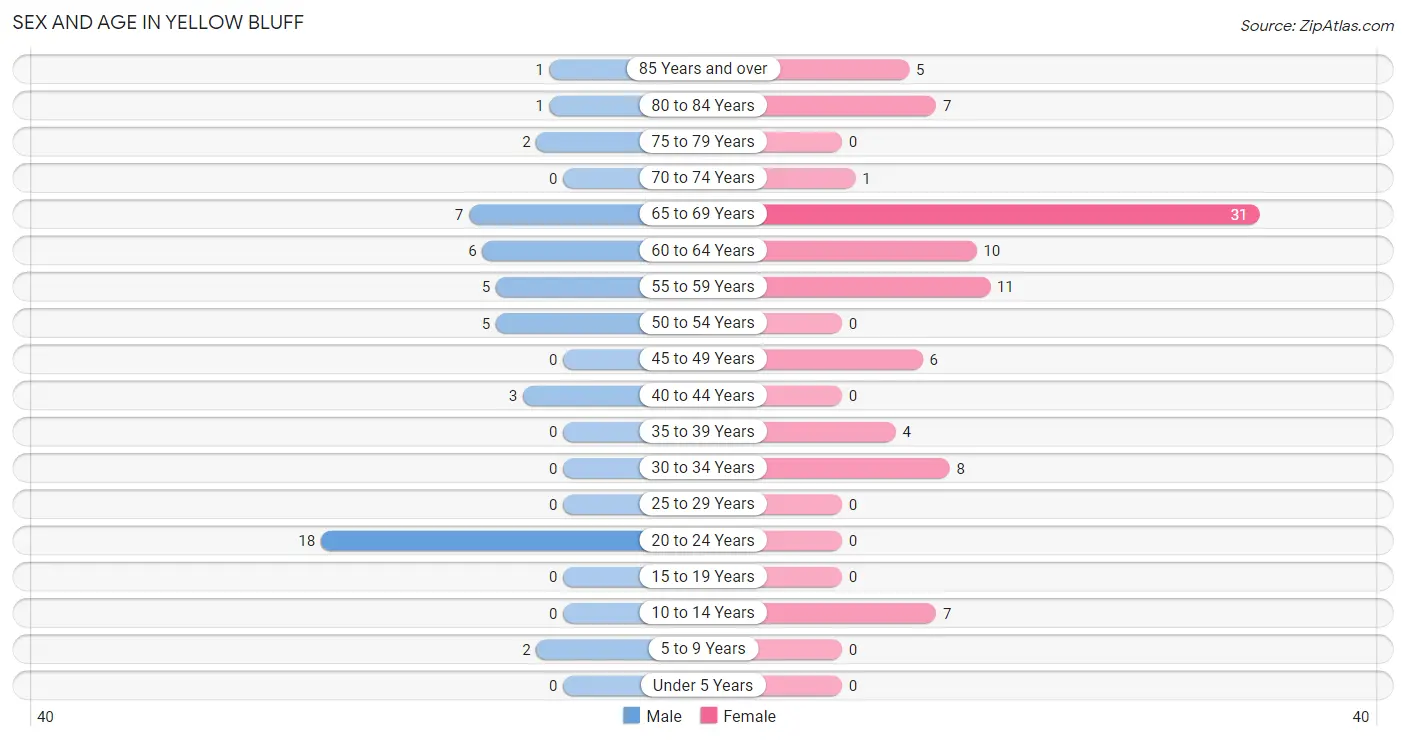
| Age Bracket | Male | Female |
| Under 5 Years | 0 (0.0%) | 0 (0.0%) |
| 5 to 9 Years | 2 (4.0%) | 0 (0.0%) |
| 10 to 14 Years | 0 (0.0%) | 7 (7.8%) |
| 15 to 19 Years | 0 (0.0%) | 0 (0.0%) |
| 20 to 24 Years | 18 (36.0%) | 0 (0.0%) |
| 25 to 29 Years | 0 (0.0%) | 0 (0.0%) |
| 30 to 34 Years | 0 (0.0%) | 8 (8.9%) |
| 35 to 39 Years | 0 (0.0%) | 4 (4.4%) |
| 40 to 44 Years | 3 (6.0%) | 0 (0.0%) |
| 45 to 49 Years | 0 (0.0%) | 6 (6.7%) |
| 50 to 54 Years | 5 (10.0%) | 0 (0.0%) |
| 55 to 59 Years | 5 (10.0%) | 11 (12.2%) |
| 60 to 64 Years | 6 (12.0%) | 10 (11.1%) |
| 65 to 69 Years | 7 (14.0%) | 31 (34.4%) |
| 70 to 74 Years | 0 (0.0%) | 1 (1.1%) |
| 75 to 79 Years | 2 (4.0%) | 0 (0.0%) |
| 80 to 84 Years | 1 (2.0%) | 7 (7.8%) |
| 85 Years and over | 1 (2.0%) | 5 (5.6%) |
| Total | 50 (100.0%) | 90 (100.0%) |
Families and Households in Yellow Bluff
Median Family Size in Yellow Bluff
The median family size in Yellow Bluff is 4.64 persons per family, with single male/father families (1 | 7.1%) accounting for the largest median family size of 6 persons per family. On the other hand, married-couple families (2 | 14.3%) represent the smallest median family size with 1.50 persons per family.
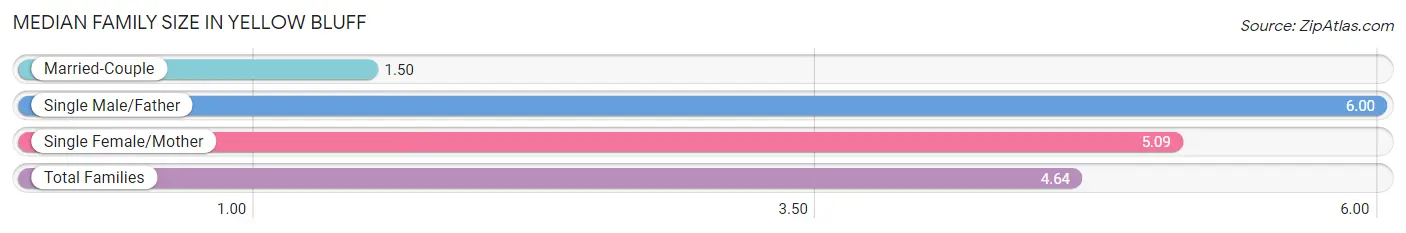
| Family Type | # Families | Family Size |
| Married-Couple | 2 (14.3%) | 1.50 |
| Single Male/Father | 1 (7.1%) | 6.00 |
| Single Female/Mother | 11 (78.6%) | 5.09 |
| Total Families | 14 (100.0%) | 4.64 |
Median Household Size in Yellow Bluff
The median household size in Yellow Bluff is 1.69 persons per household, with single male/father households (1 | 1.2%) accounting for the largest median household size of 6 persons per household. non-family households (69 | 83.1%) represent the smallest median household size with 1.09 persons per household.
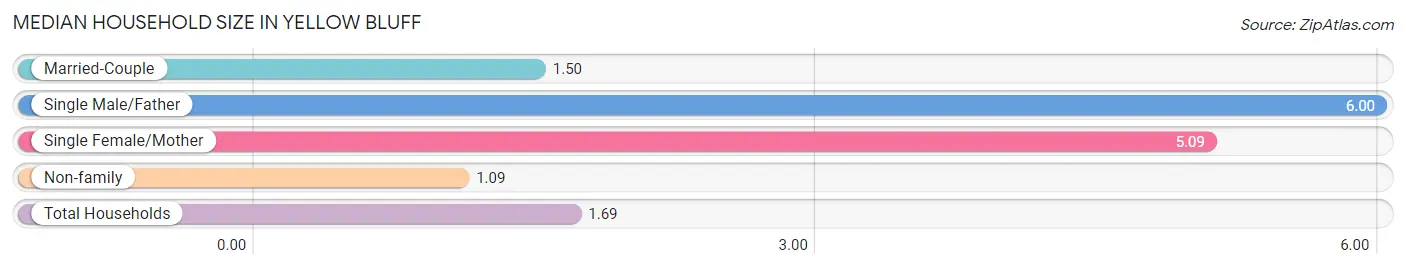
| Household Type | # Households | Household Size |
| Married-Couple | 2 (2.4%) | 1.50 |
| Single Male/Father | 1 (1.2%) | 6.00 |
| Single Female/Mother | 11 (13.3%) | 5.09 |
| Non-family | 69 (83.1%) | 1.09 |
| Total Households | 83 (100.0%) | 1.69 |
Household Size by Marriage Status in Yellow Bluff
Out of a total of 83 households in Yellow Bluff, 14 (16.9%) are family households, while 69 (83.1%) are nonfamily households. The most numerous type of family households are 5-person households, comprising 7, and the most common type of nonfamily households are 1-person households, comprising 68.
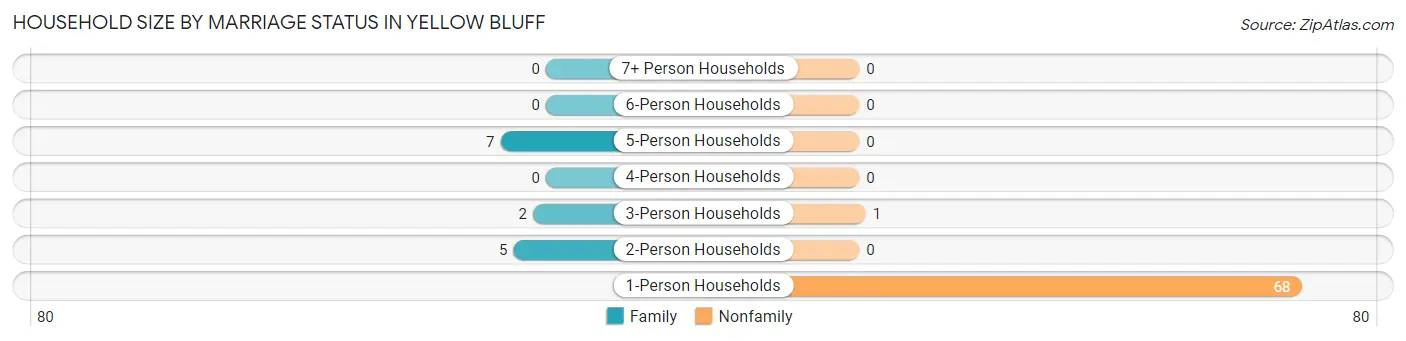
| Household Size | Family Households | Nonfamily Households |
| 1-Person Households | - | 68 (81.9%) |
| 2-Person Households | 5 (6.0%) | 0 (0.0%) |
| 3-Person Households | 2 (2.4%) | 1 (1.2%) |
| 4-Person Households | 0 (0.0%) | 0 (0.0%) |
| 5-Person Households | 7 (8.4%) | 0 (0.0%) |
| 6-Person Households | 0 (0.0%) | 0 (0.0%) |
| 7+ Person Households | 0 (0.0%) | 0 (0.0%) |
| Total | 14 (16.9%) | 69 (83.1%) |
Female Fertility in Yellow Bluff
Fertility by Age in Yellow Bluff
| Age Bracket | Women with Births | Births / 1,000 Women |
| 15 to 19 years | 0 (0.0%) | 0.0 |
| 20 to 34 years | 0 (0.0%) | 0.0 |
| 35 to 50 years | 0 (0.0%) | 0.0 |
| Total | 0 (0.0%) | 0.0 |
Fertility by Age by Marriage Status in Yellow Bluff
| Age Bracket | Married | Unmarried |
| 15 to 19 years | 0 (0.0%) | 0 (0.0%) |
| 20 to 34 years | 0 (0.0%) | 0 (0.0%) |
| 35 to 50 years | 0 (0.0%) | 0 (0.0%) |
| Total | 0 (0.0%) | 0 (0.0%) |
Fertility by Education in Yellow Bluff
| Educational Attainment | Women with Births | Births / 1,000 Women |
| Less than High School | 0 (0.0%) | 0.0 |
| High School Diploma | 0 (0.0%) | 0.0 |
| College or Associate's Degree | 0 (0.0%) | 0.0 |
| Bachelor's Degree | 0 (0.0%) | 0.0 |
| Graduate Degree | 0 (0.0%) | 0.0 |
| Total | 0 (0.0%) | 0.0 |
Fertility by Education by Marriage Status in Yellow Bluff
| Educational Attainment | Married | Unmarried |
| Less than High School | 0 (0.0%) | 0 (0.0%) |
| High School Diploma | 0 (0.0%) | 0 (0.0%) |
| College or Associate's Degree | 0 (0.0%) | 0 (0.0%) |
| Bachelor's Degree | 0 (0.0%) | 0 (0.0%) |
| Graduate Degree | 0 (0.0%) | 0 (0.0%) |
| Total | 0 (0.0%) | 0 (0.0%) |
Employment Characteristics in Yellow Bluff
Employment by Class of Employer in Yellow Bluff
Among the 19 employed individuals in Yellow Bluff, private company employees (9 | 47.4%), local government employees (7 | 36.8%), and federal government employees (2 | 10.5%) make up the most common classes of employment.
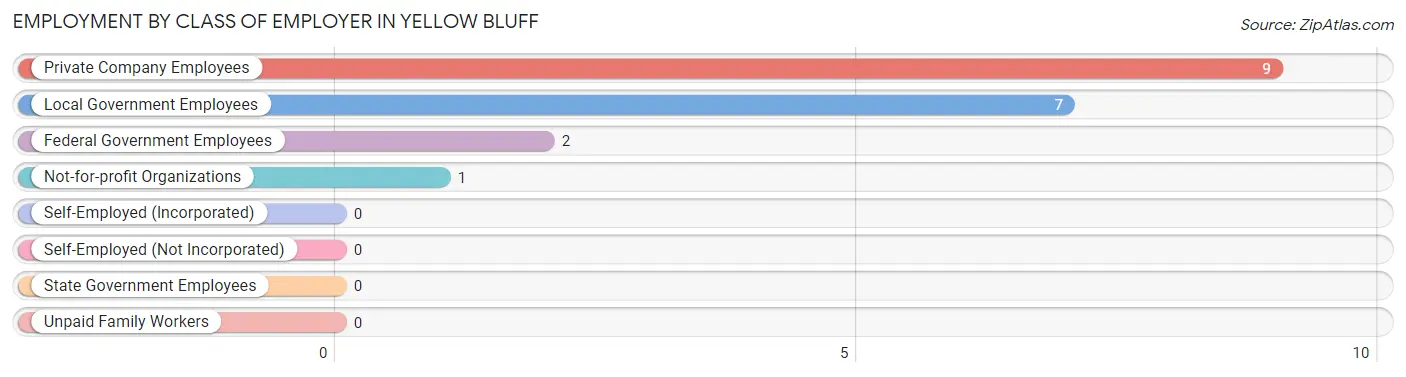
| Employer Class | # Employees | % Employees |
| Private Company Employees | 9 | 47.4% |
| Self-Employed (Incorporated) | 0 | 0.0% |
| Self-Employed (Not Incorporated) | 0 | 0.0% |
| Not-for-profit Organizations | 1 | 5.3% |
| Local Government Employees | 7 | 36.8% |
| State Government Employees | 0 | 0.0% |
| Federal Government Employees | 2 | 10.5% |
| Unpaid Family Workers | 0 | 0.0% |
| Total | 19 | 100.0% |
Employment Status by Age in Yellow Bluff
According to the labor force statistics for Yellow Bluff, out of the total population over 16 years of age (131), 32.1% or 42 individuals are in the labor force, with 54.8% or 23 of them unemployed. The age group with the highest labor force participation rate is 20 to 24 years, with 100.0% or 18 individuals in the labor force. Within the labor force, the 30 to 34 years age range has the highest percentage of unemployed individuals, with 100.0% or 8 of them being unemployed.
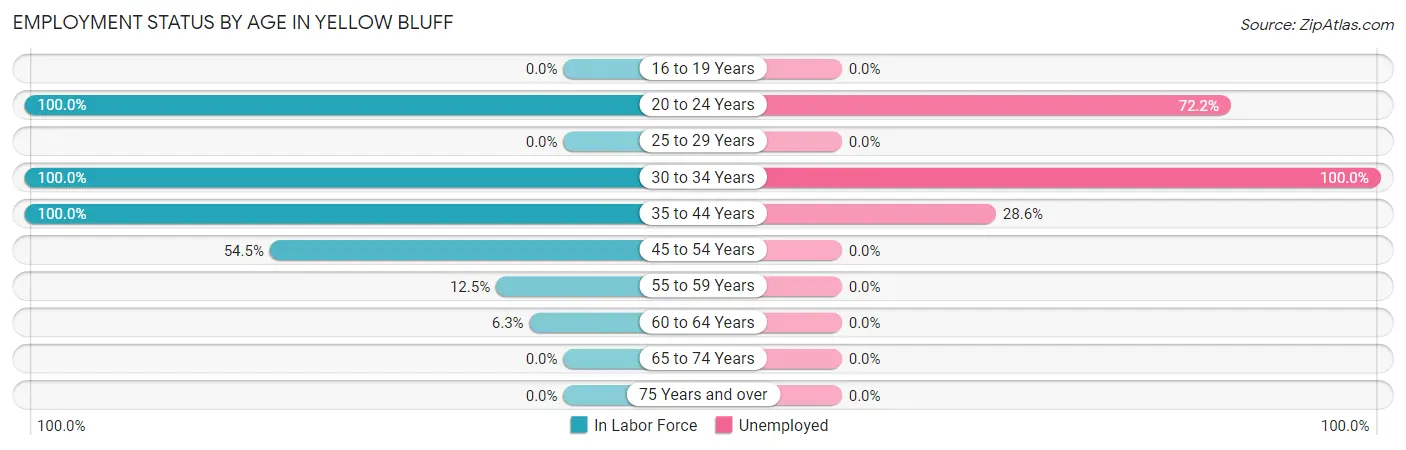
| Age Bracket | In Labor Force | Unemployed |
| 16 to 19 Years | 0 (0.0%) | 0 (0.0%) |
| 20 to 24 Years | 18 (100.0%) | 13 (72.2%) |
| 25 to 29 Years | 0 (0.0%) | 0 (0.0%) |
| 30 to 34 Years | 8 (100.0%) | 8 (100.0%) |
| 35 to 44 Years | 7 (100.0%) | 2 (28.6%) |
| 45 to 54 Years | 6 (54.5%) | 0 (0.0%) |
| 55 to 59 Years | 2 (12.5%) | 0 (0.0%) |
| 60 to 64 Years | 1 (6.3%) | 0 (0.0%) |
| 65 to 74 Years | 0 (0.0%) | 0 (0.0%) |
| 75 Years and over | 0 (0.0%) | 0 (0.0%) |
| Total | 42 (32.1%) | 23 (54.8%) |
Employment Status by Educational Attainment in Yellow Bluff
According to labor force statistics for Yellow Bluff, 41.4% of individuals (24) out of the total population between 25 and 64 years of age (58) are in the labor force, with 41.7% or 10 of them being unemployed. The group with the highest labor force participation rate are those with the educational attainment of college / associate degree, with 100.0% or 1 individuals in the labor force. Within the labor force, individuals with high school diploma education have the highest percentage of unemployment, with 100.0% or 10 of them being unemployed.
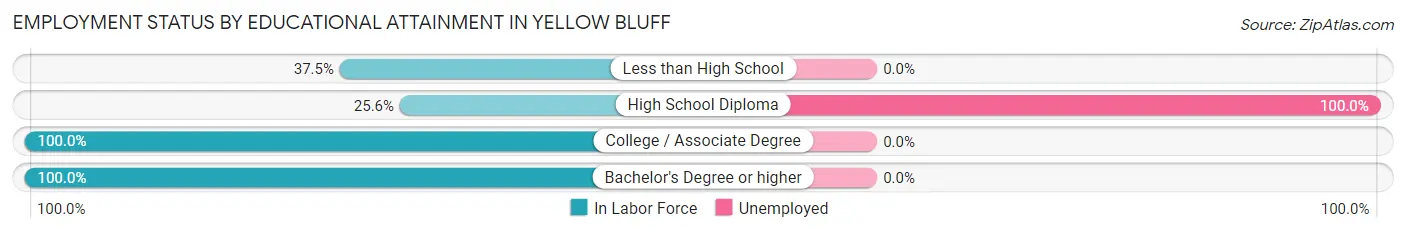
| Educational Attainment | In Labor Force | Unemployed |
| Less than High School | 3 (37.5%) | 0 (0.0%) |
| High School Diploma | 10 (25.6%) | 39 (100.0%) |
| College / Associate Degree | 1 (100.0%) | 0 (0.0%) |
| Bachelor's Degree or higher | 10 (100.0%) | 0 (0.0%) |
| Total | 24 (41.4%) | 24 (41.7%) |
Employment Occupations by Sex in Yellow Bluff
Management, Business, Science and Arts Occupations
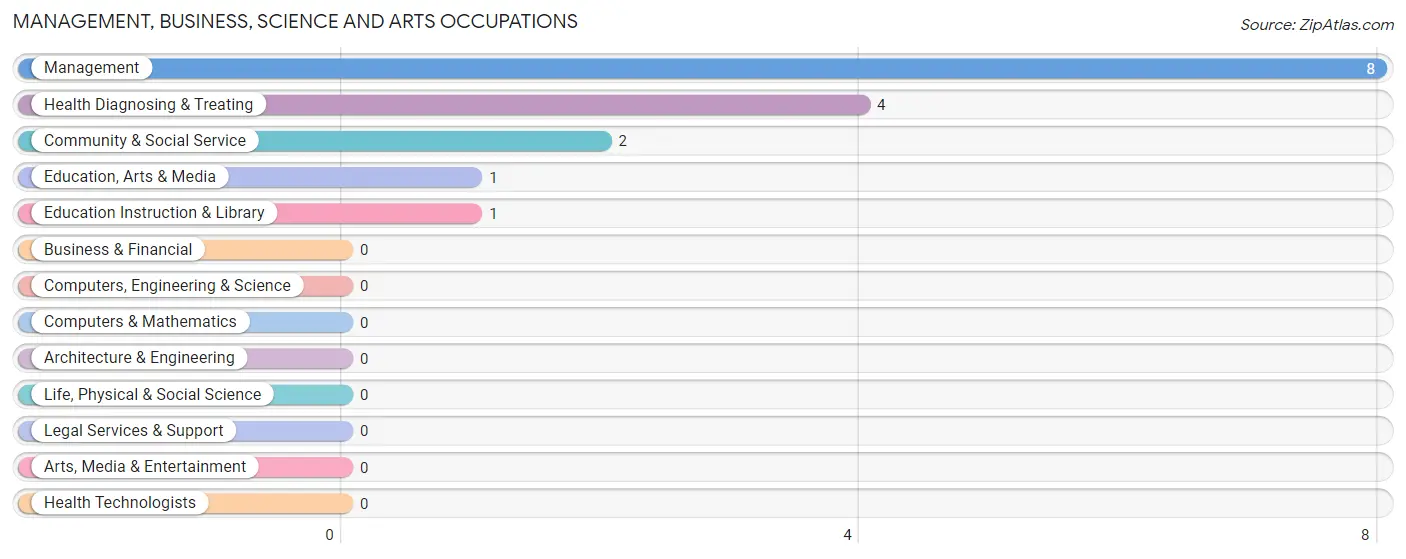
The most common Management, Business, Science and Arts occupations in Yellow Bluff are Management (8 | 42.1%), Health Diagnosing & Treating (4 | 21.0%), Community & Social Service (2 | 10.5%), Education, Arts & Media (1 | 5.3%), and Education Instruction & Library (1 | 5.3%).
Management, Business, Science and Arts Occupations by Sex
Within the Management, Business, Science and Arts occupations in Yellow Bluff, the most male-oriented occupations are Education, Arts & Media (100.0%), and Community & Social Service (50.0%), while the most female-oriented occupations are Management (100.0%), Education Instruction & Library (100.0%), and Health Diagnosing & Treating (100.0%).
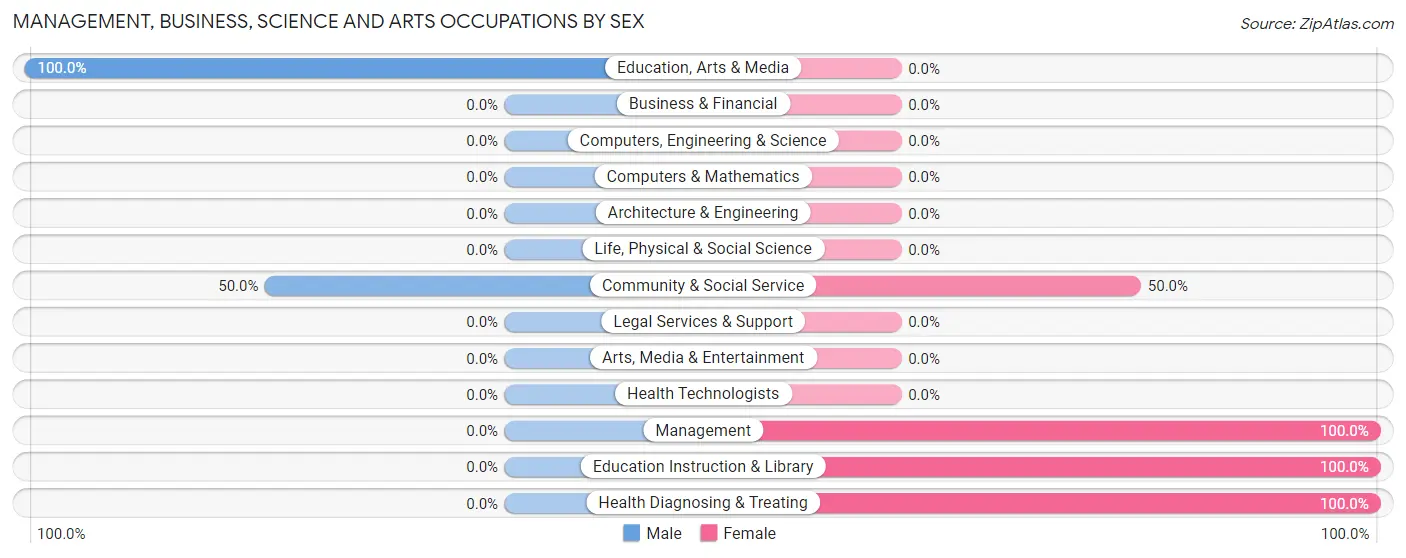
| Occupation | Male | Female |
| Management | 0 (0.0%) | 8 (100.0%) |
| Business & Financial | 0 (0.0%) | 0 (0.0%) |
| Computers, Engineering & Science | 0 (0.0%) | 0 (0.0%) |
| Computers & Mathematics | 0 (0.0%) | 0 (0.0%) |
| Architecture & Engineering | 0 (0.0%) | 0 (0.0%) |
| Life, Physical & Social Science | 0 (0.0%) | 0 (0.0%) |
| Community & Social Service | 1 (50.0%) | 1 (50.0%) |
| Education, Arts & Media | 1 (100.0%) | 0 (0.0%) |
| Legal Services & Support | 0 (0.0%) | 0 (0.0%) |
| Education Instruction & Library | 0 (0.0%) | 1 (100.0%) |
| Arts, Media & Entertainment | 0 (0.0%) | 0 (0.0%) |
| Health Diagnosing & Treating | 0 (0.0%) | 4 (100.0%) |
| Health Technologists | 0 (0.0%) | 0 (0.0%) |
| Total (Category) | 1 (7.1%) | 13 (92.9%) |
| Total (Overall) | 6 (31.6%) | 13 (68.4%) |
Services Occupations
The most common Services occupations in Yellow Bluff are , and Food Preparation & Serving (5 | 26.3%).
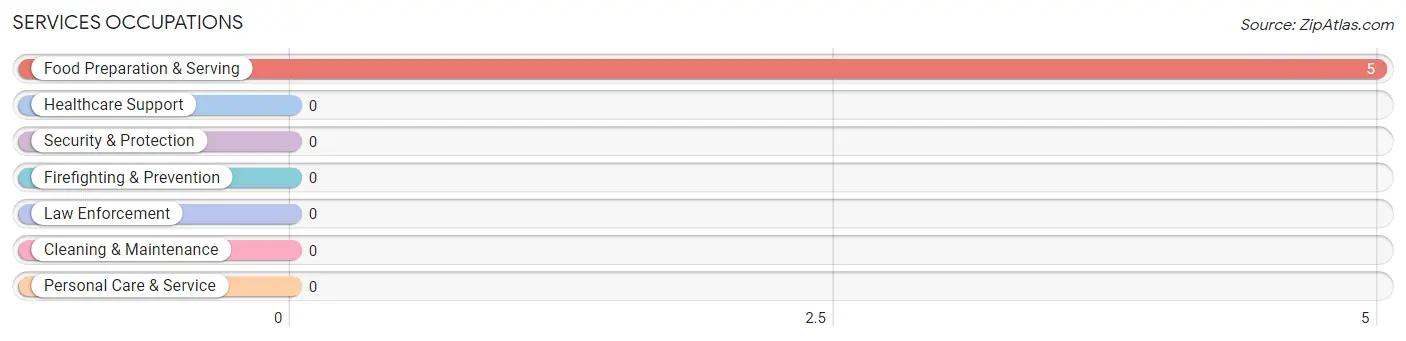
Services Occupations by Sex
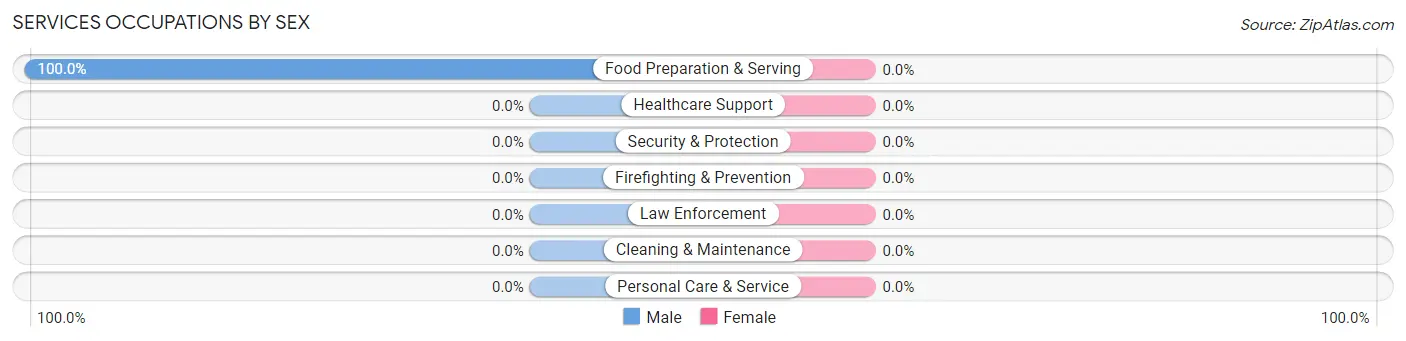
| Occupation | Male | Female |
| Healthcare Support | 0 (0.0%) | 0 (0.0%) |
| Security & Protection | 0 (0.0%) | 0 (0.0%) |
| Firefighting & Prevention | 0 (0.0%) | 0 (0.0%) |
| Law Enforcement | 0 (0.0%) | 0 (0.0%) |
| Food Preparation & Serving | 5 (100.0%) | 0 (0.0%) |
| Cleaning & Maintenance | 0 (0.0%) | 0 (0.0%) |
| Personal Care & Service | 0 (0.0%) | 0 (0.0%) |
| Total (Category) | 5 (100.0%) | 0 (0.0%) |
| Total (Overall) | 6 (31.6%) | 13 (68.4%) |
Sales and Office Occupations
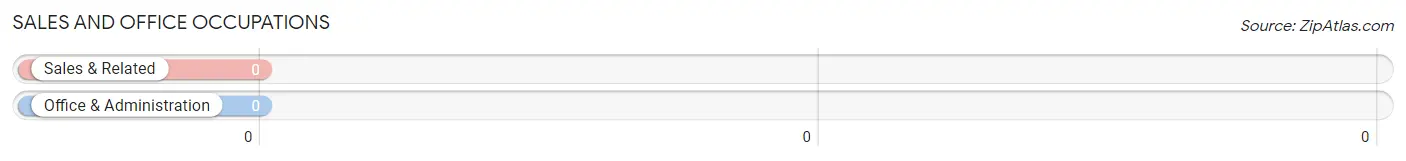
Sales and Office Occupations by Sex
| Occupation | Male | Female |
| Sales & Related | 0 (0.0%) | 0 (0.0%) |
| Office & Administration | 0 (0.0%) | 0 (0.0%) |
| Total (Category) | 0 (0.0%) | 0 (0.0%) |
| Total (Overall) | 6 (31.6%) | 13 (68.4%) |
Natural Resources, Construction and Maintenance Occupations
Natural Resources, Construction and Maintenance Occupations by Sex
| Occupation | Male | Female |
| Farming, Fishing & Forestry | 0 (0.0%) | 0 (0.0%) |
| Construction & Extraction | 0 (0.0%) | 0 (0.0%) |
| Installation, Maintenance & Repair | 0 (0.0%) | 0 (0.0%) |
| Total (Category) | 0 (0.0%) | 0 (0.0%) |
| Total (Overall) | 6 (31.6%) | 13 (68.4%) |
Production, Transportation and Moving Occupations
Production, Transportation and Moving Occupations by Sex
| Occupation | Male | Female |
| Production | 0 (0.0%) | 0 (0.0%) |
| Transportation | 0 (0.0%) | 0 (0.0%) |
| Material Moving | 0 (0.0%) | 0 (0.0%) |
| Total (Category) | 0 (0.0%) | 0 (0.0%) |
| Total (Overall) | 6 (31.6%) | 13 (68.4%) |
Employment Industries by Sex in Yellow Bluff
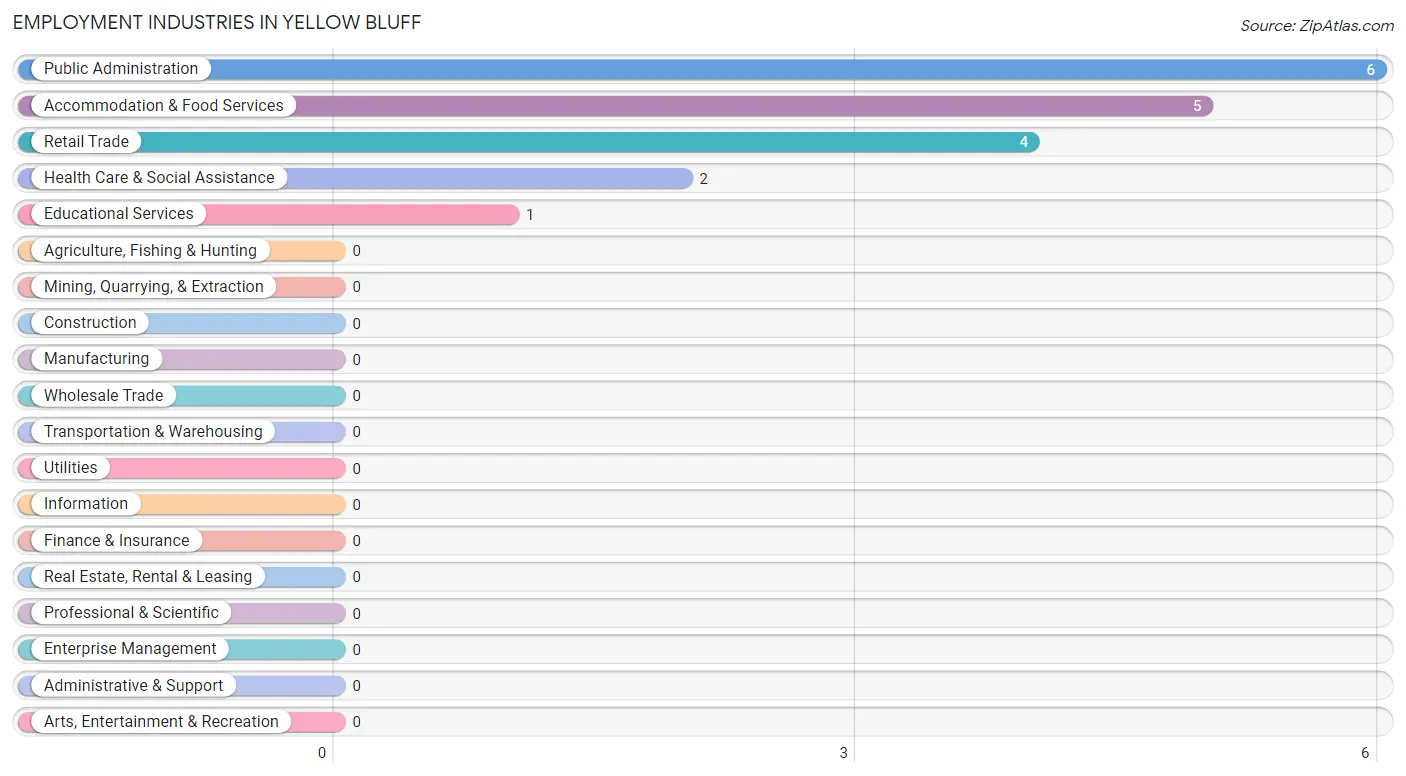
Employment Industries in Yellow Bluff
The major employment industries in Yellow Bluff include Public Administration (6 | 31.6%), Accommodation & Food Services (5 | 26.3%), Retail Trade (4 | 21.0%), Health Care & Social Assistance (2 | 10.5%), and Educational Services (1 | 5.3%).
Employment Industries by Sex in Yellow Bluff
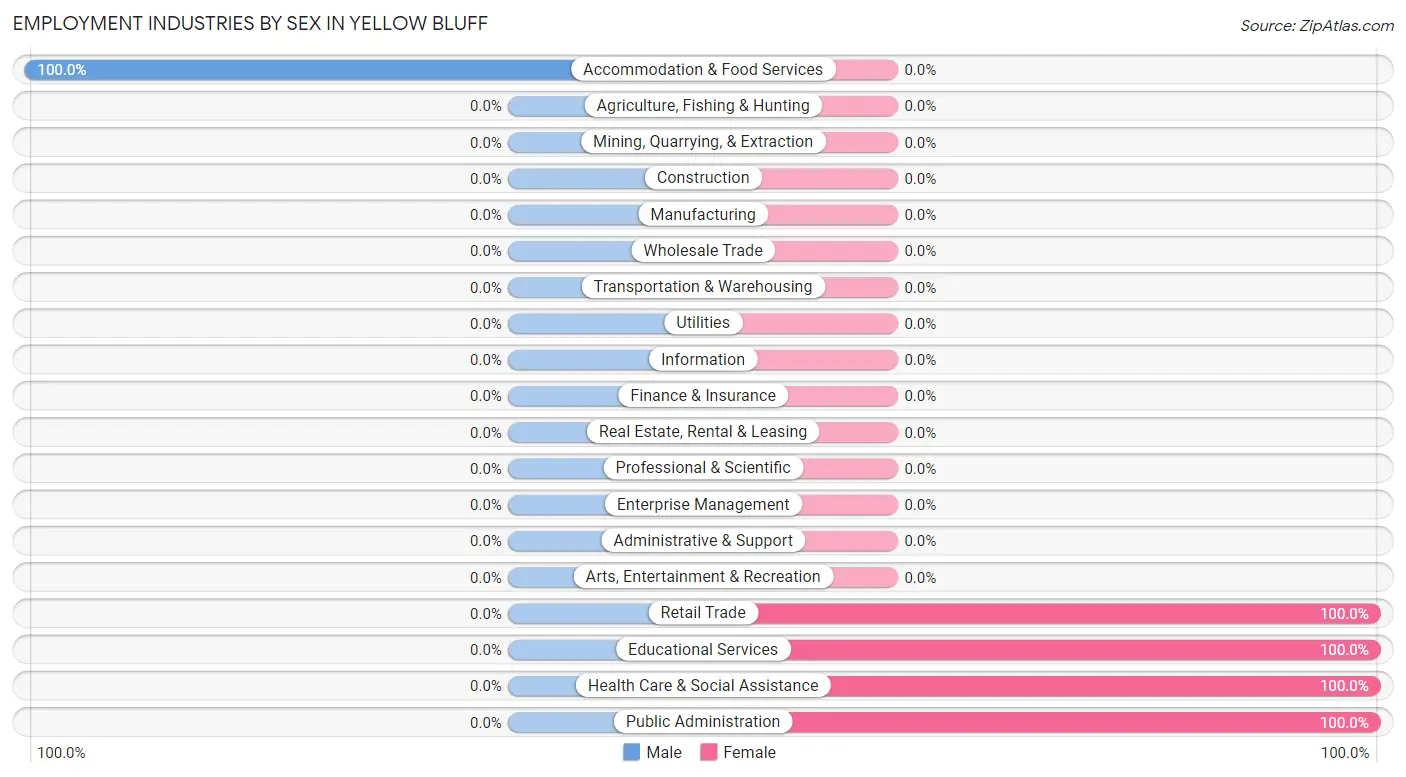
| Industry | Male | Female |
| Agriculture, Fishing & Hunting | 0 (0.0%) | 0 (0.0%) |
| Mining, Quarrying, & Extraction | 0 (0.0%) | 0 (0.0%) |
| Construction | 0 (0.0%) | 0 (0.0%) |
| Manufacturing | 0 (0.0%) | 0 (0.0%) |
| Wholesale Trade | 0 (0.0%) | 0 (0.0%) |
| Retail Trade | 0 (0.0%) | 4 (100.0%) |
| Transportation & Warehousing | 0 (0.0%) | 0 (0.0%) |
| Utilities | 0 (0.0%) | 0 (0.0%) |
| Information | 0 (0.0%) | 0 (0.0%) |
| Finance & Insurance | 0 (0.0%) | 0 (0.0%) |
| Real Estate, Rental & Leasing | 0 (0.0%) | 0 (0.0%) |
| Professional & Scientific | 0 (0.0%) | 0 (0.0%) |
| Enterprise Management | 0 (0.0%) | 0 (0.0%) |
| Administrative & Support | 0 (0.0%) | 0 (0.0%) |
| Educational Services | 0 (0.0%) | 1 (100.0%) |
| Health Care & Social Assistance | 0 (0.0%) | 2 (100.0%) |
| Arts, Entertainment & Recreation | 0 (0.0%) | 0 (0.0%) |
| Accommodation & Food Services | 5 (100.0%) | 0 (0.0%) |
| Public Administration | 0 (0.0%) | 6 (100.0%) |
| Total | 6 (31.6%) | 13 (68.4%) |
Education in Yellow Bluff
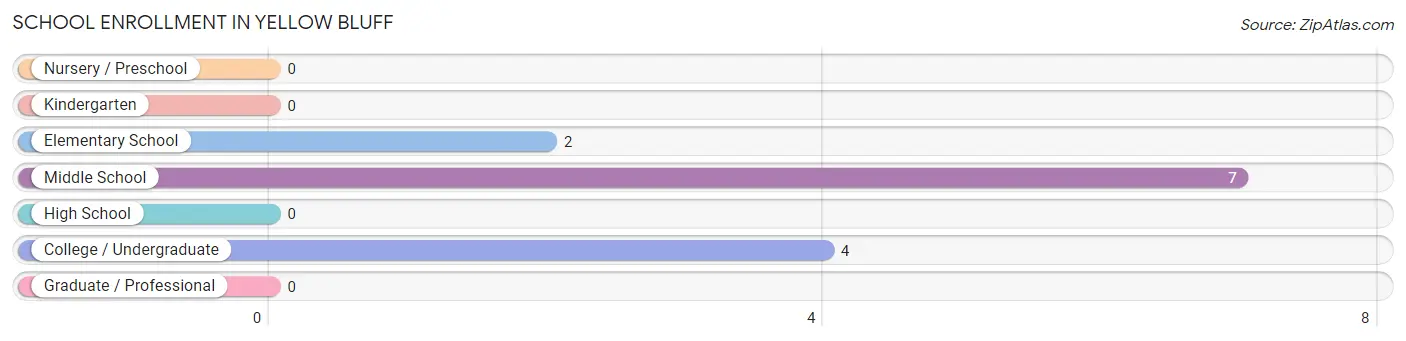
School Enrollment in Yellow Bluff
The most common levels of schooling among the 13 students in Yellow Bluff are middle school (7 | 53.8%), college / undergraduate (4 | 30.8%), and elementary school (2 | 15.4%).
| School Level | # Students | % Students |
| Nursery / Preschool | 0 | 0.0% |
| Kindergarten | 0 | 0.0% |
| Elementary School | 2 | 15.4% |
| Middle School | 7 | 53.8% |
| High School | 0 | 0.0% |
| College / Undergraduate | 4 | 30.8% |
| Graduate / Professional | 0 | 0.0% |
| Total | 13 | 100.0% |
School Enrollment by Age by Funding Source in Yellow Bluff
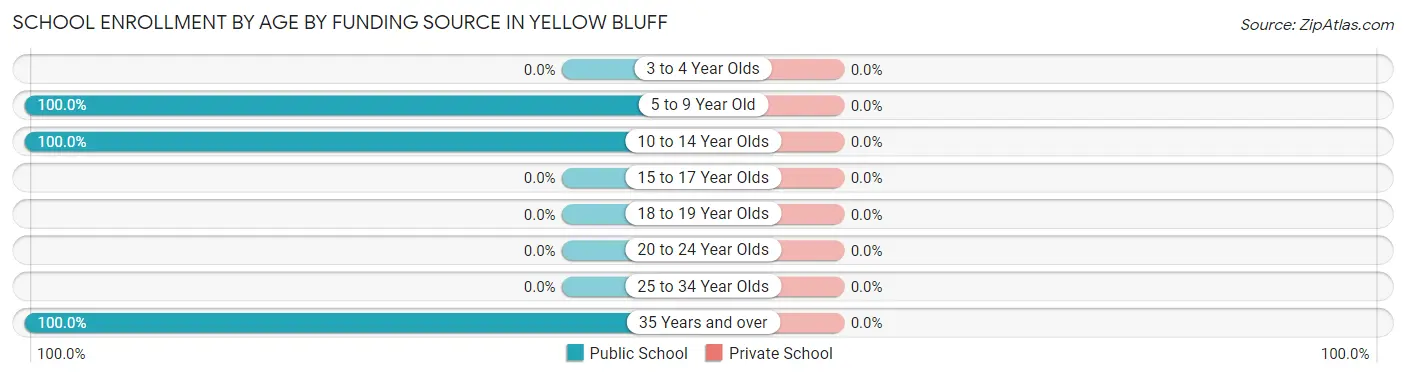
| Age Bracket | Public School | Private School |
| 3 to 4 Year Olds | 0 (0.0%) | 0 (0.0%) |
| 5 to 9 Year Old | 2 (100.0%) | 0 (0.0%) |
| 10 to 14 Year Olds | 7 (100.0%) | 0 (0.0%) |
| 15 to 17 Year Olds | 0 (0.0%) | 0 (0.0%) |
| 18 to 19 Year Olds | 0 (0.0%) | 0 (0.0%) |
| 20 to 24 Year Olds | 0 (0.0%) | 0 (0.0%) |
| 25 to 34 Year Olds | 0 (0.0%) | 0 (0.0%) |
| 35 Years and over | 4 (100.0%) | 0 (0.0%) |
| Total | 13 (100.0%) | 0 (0.0%) |
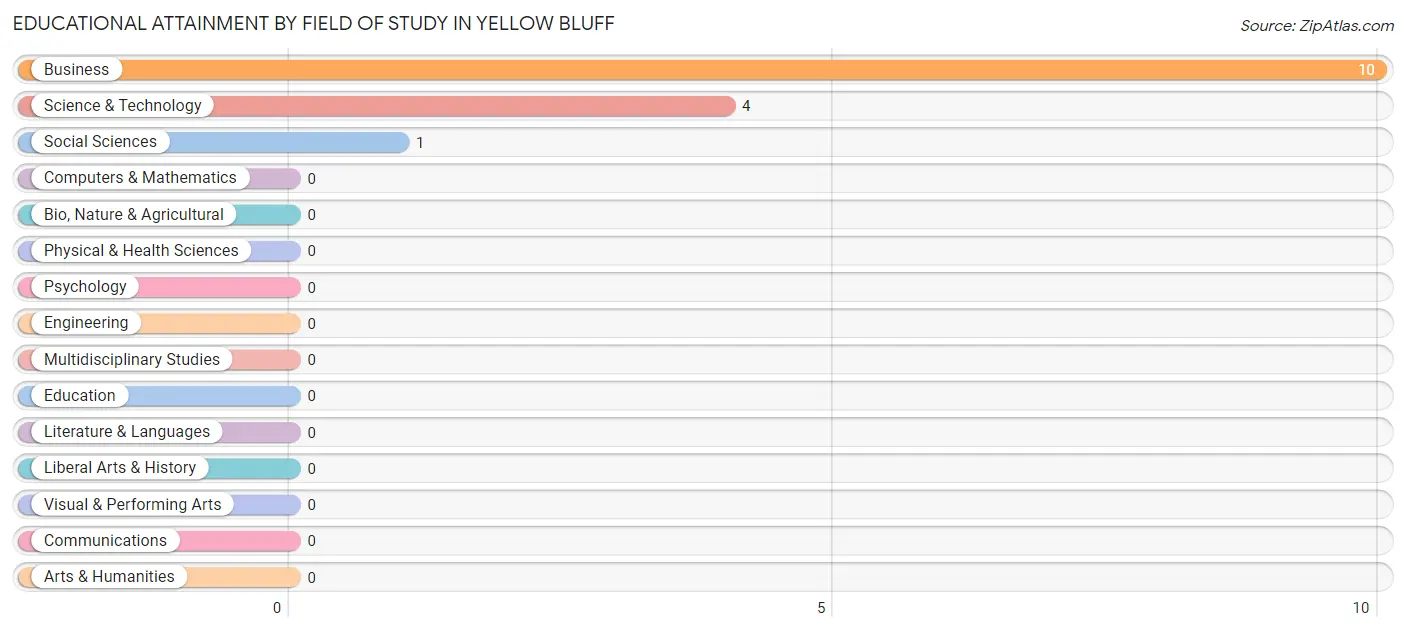
Educational Attainment by Field of Study in Yellow Bluff
Business (10 | 66.7%), science & technology (4 | 26.7%), and social sciences (1 | 6.7%) are the most common fields of study among 15 individuals in Yellow Bluff who have obtained a bachelor's degree or higher.
| Field of Study | # Graduates | % Graduates |
| Computers & Mathematics | 0 | 0.0% |
| Bio, Nature & Agricultural | 0 | 0.0% |
| Physical & Health Sciences | 0 | 0.0% |
| Psychology | 0 | 0.0% |
| Social Sciences | 1 | 6.7% |
| Engineering | 0 | 0.0% |
| Multidisciplinary Studies | 0 | 0.0% |
| Science & Technology | 4 | 26.7% |
| Business | 10 | 66.7% |
| Education | 0 | 0.0% |
| Literature & Languages | 0 | 0.0% |
| Liberal Arts & History | 0 | 0.0% |
| Visual & Performing Arts | 0 | 0.0% |
| Communications | 0 | 0.0% |
| Arts & Humanities | 0 | 0.0% |
| Total | 15 | 100.0% |
Transportation & Commute in Yellow Bluff
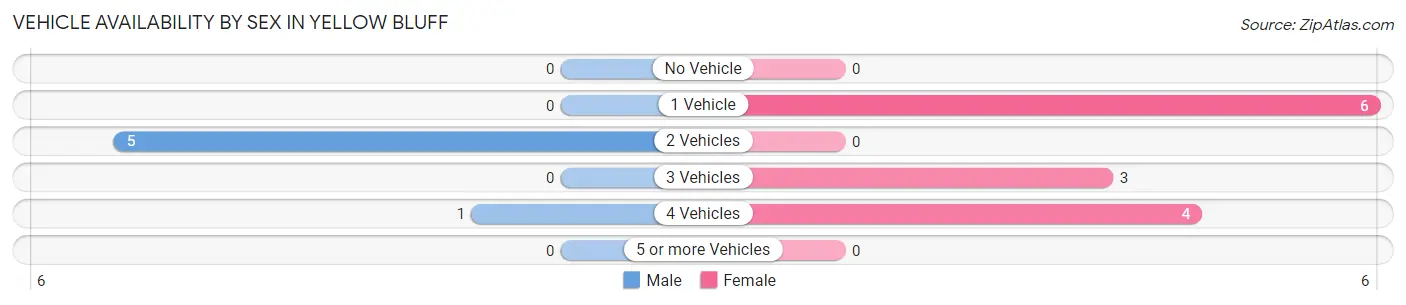
Vehicle Availability by Sex in Yellow Bluff
The most prevalent vehicle ownership categories in Yellow Bluff are males with 2 vehicles (5, accounting for 83.3%) and females with 2 vehicles (0, making up 38.5%).
| Vehicles Available | Male | Female |
| No Vehicle | 0 (0.0%) | 0 (0.0%) |
| 1 Vehicle | 0 (0.0%) | 6 (46.2%) |
| 2 Vehicles | 5 (83.3%) | 0 (0.0%) |
| 3 Vehicles | 0 (0.0%) | 3 (23.1%) |
| 4 Vehicles | 1 (16.7%) | 4 (30.8%) |
| 5 or more Vehicles | 0 (0.0%) | 0 (0.0%) |
| Total | 6 (100.0%) | 13 (100.0%) |
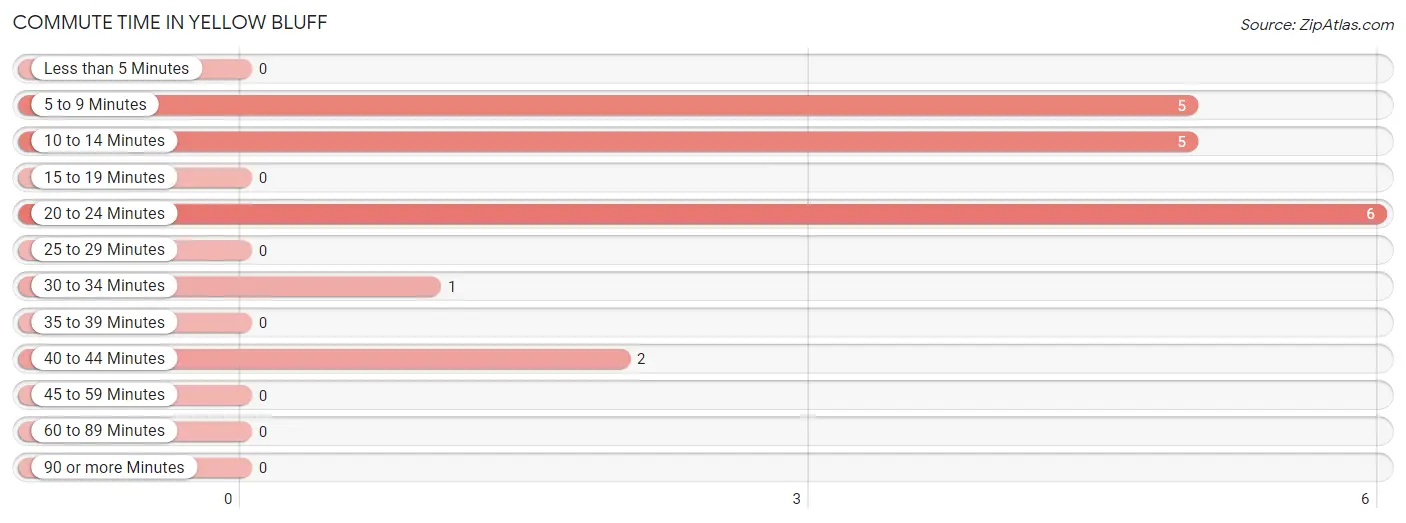
Commute Time in Yellow Bluff
The most frequently occuring commute durations in Yellow Bluff are 20 to 24 minutes (6 commuters, 31.6%), 5 to 9 minutes (5 commuters, 26.3%), and 10 to 14 minutes (5 commuters, 26.3%).
| Commute Time | # Commuters | % Commuters |
| Less than 5 Minutes | 0 | 0.0% |
| 5 to 9 Minutes | 5 | 26.3% |
| 10 to 14 Minutes | 5 | 26.3% |
| 15 to 19 Minutes | 0 | 0.0% |
| 20 to 24 Minutes | 6 | 31.6% |
| 25 to 29 Minutes | 0 | 0.0% |
| 30 to 34 Minutes | 1 | 5.3% |
| 35 to 39 Minutes | 0 | 0.0% |
| 40 to 44 Minutes | 2 | 10.5% |
| 45 to 59 Minutes | 0 | 0.0% |
| 60 to 89 Minutes | 0 | 0.0% |
| 90 or more Minutes | 0 | 0.0% |
Commute Time by Sex in Yellow Bluff
The most common commute times in Yellow Bluff are 10 to 14 minutes (5 commuters, 83.3%) for males and 20 to 24 minutes (6 commuters, 46.2%) for females.
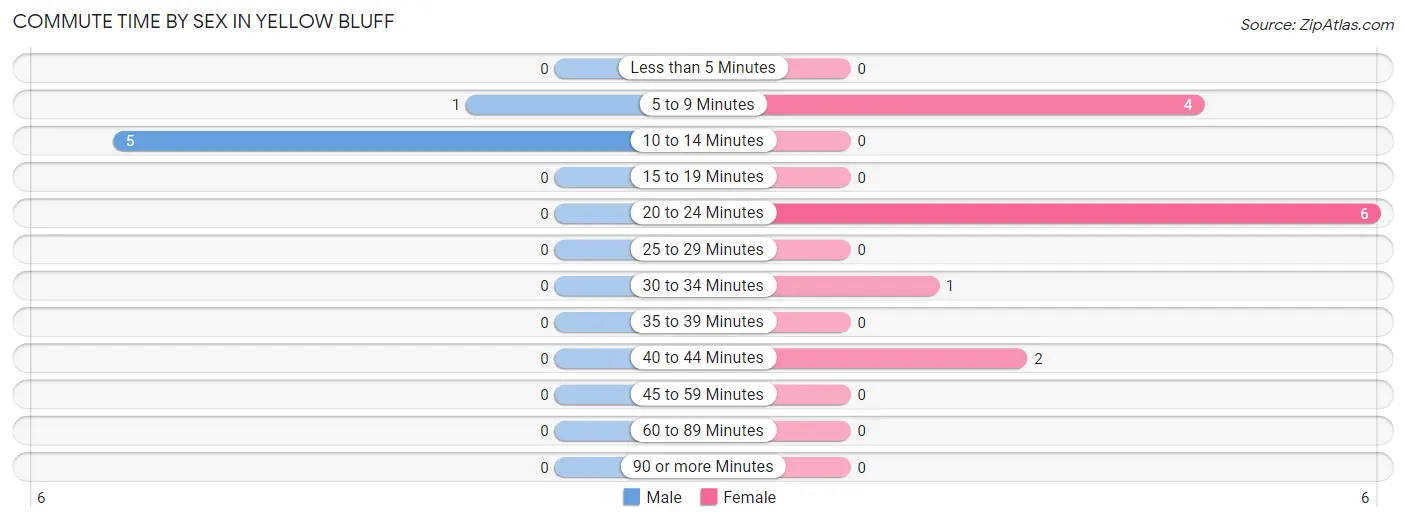
| Commute Time | Male | Female |
| Less than 5 Minutes | 0 (0.0%) | 0 (0.0%) |
| 5 to 9 Minutes | 1 (16.7%) | 4 (30.8%) |
| 10 to 14 Minutes | 5 (83.3%) | 0 (0.0%) |
| 15 to 19 Minutes | 0 (0.0%) | 0 (0.0%) |
| 20 to 24 Minutes | 0 (0.0%) | 6 (46.2%) |
| 25 to 29 Minutes | 0 (0.0%) | 0 (0.0%) |
| 30 to 34 Minutes | 0 (0.0%) | 1 (7.7%) |
| 35 to 39 Minutes | 0 (0.0%) | 0 (0.0%) |
| 40 to 44 Minutes | 0 (0.0%) | 2 (15.4%) |
| 45 to 59 Minutes | 0 (0.0%) | 0 (0.0%) |
| 60 to 89 Minutes | 0 (0.0%) | 0 (0.0%) |
| 90 or more Minutes | 0 (0.0%) | 0 (0.0%) |
Time of Departure to Work by Sex in Yellow Bluff
The most frequent times of departure to work in Yellow Bluff are 12:00 AM to 4:59 AM (5, 83.3%) for males and 8:00 AM to 8:29 AM (6, 46.2%) for females.
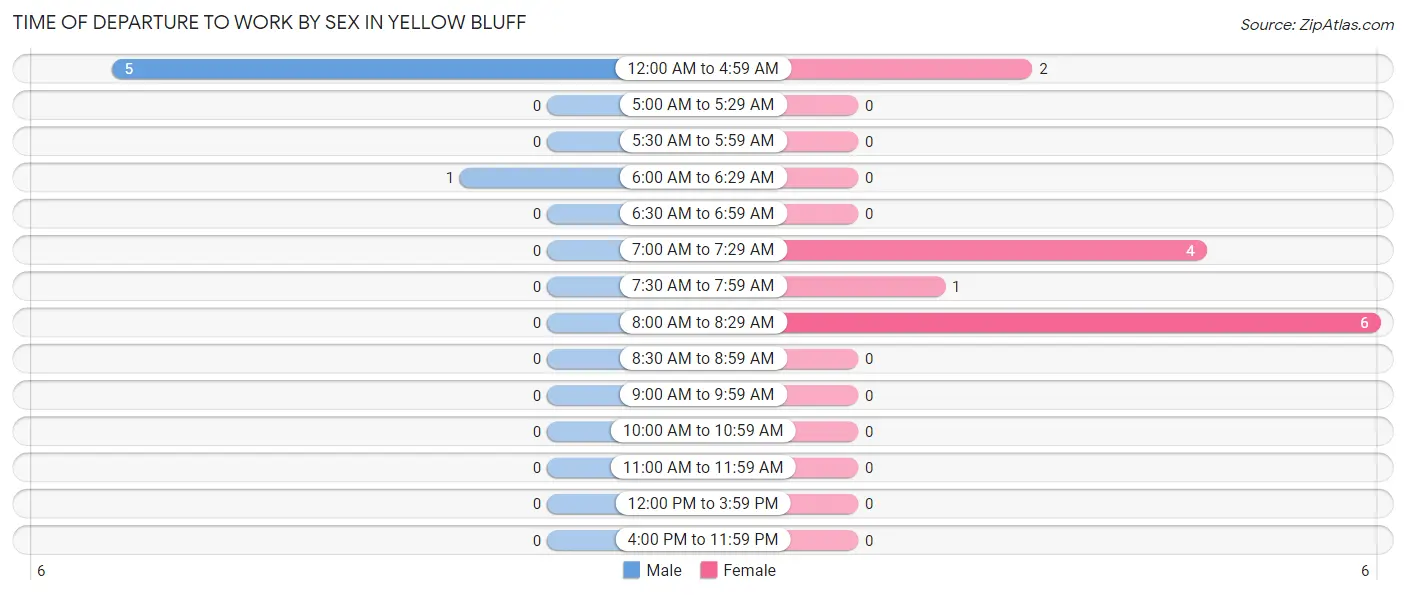
| Time of Departure | Male | Female |
| 12:00 AM to 4:59 AM | 5 (83.3%) | 2 (15.4%) |
| 5:00 AM to 5:29 AM | 0 (0.0%) | 0 (0.0%) |
| 5:30 AM to 5:59 AM | 0 (0.0%) | 0 (0.0%) |
| 6:00 AM to 6:29 AM | 1 (16.7%) | 0 (0.0%) |
| 6:30 AM to 6:59 AM | 0 (0.0%) | 0 (0.0%) |
| 7:00 AM to 7:29 AM | 0 (0.0%) | 4 (30.8%) |
| 7:30 AM to 7:59 AM | 0 (0.0%) | 1 (7.7%) |
| 8:00 AM to 8:29 AM | 0 (0.0%) | 6 (46.2%) |
| 8:30 AM to 8:59 AM | 0 (0.0%) | 0 (0.0%) |
| 9:00 AM to 9:59 AM | 0 (0.0%) | 0 (0.0%) |
| 10:00 AM to 10:59 AM | 0 (0.0%) | 0 (0.0%) |
| 11:00 AM to 11:59 AM | 0 (0.0%) | 0 (0.0%) |
| 12:00 PM to 3:59 PM | 0 (0.0%) | 0 (0.0%) |
| 4:00 PM to 11:59 PM | 0 (0.0%) | 0 (0.0%) |
| Total | 6 (100.0%) | 13 (100.0%) |
Housing Occupancy in Yellow Bluff
Occupancy by Ownership in Yellow Bluff
Of the total 83 dwellings in Yellow Bluff, owner-occupied units account for 72 (86.8%), while renter-occupied units make up 11 (13.3%).
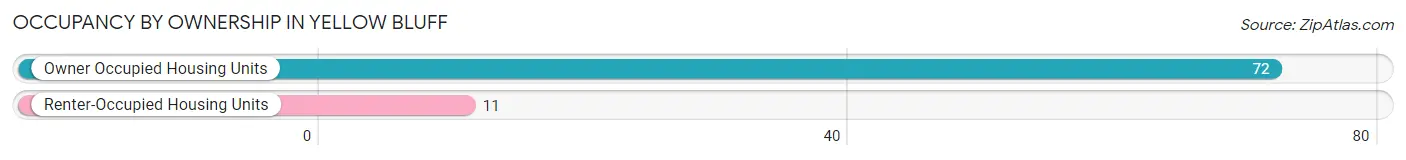
| Occupancy | # Housing Units | % Housing Units |
| Owner Occupied Housing Units | 72 | 86.8% |
| Renter-Occupied Housing Units | 11 | 13.3% |
| Total Occupied Housing Units | 83 | 100.0% |
Occupancy by Household Size in Yellow Bluff
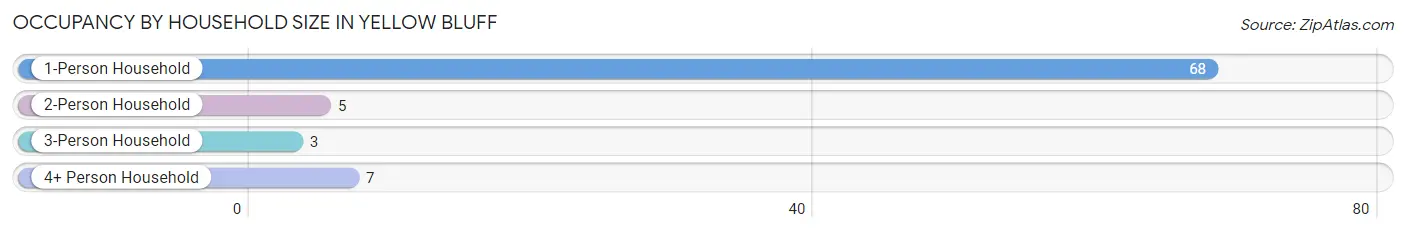
| Household Size | # Housing Units | % Housing Units |
| 1-Person Household | 68 | 81.9% |
| 2-Person Household | 5 | 6.0% |
| 3-Person Household | 3 | 3.6% |
| 4+ Person Household | 7 | 8.4% |
| Total Housing Units | 83 | 100.0% |
Occupancy by Ownership by Household Size in Yellow Bluff
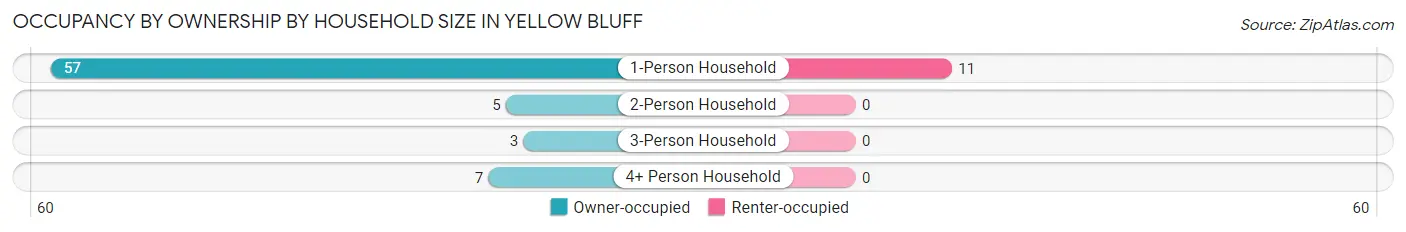
| Household Size | Owner-occupied | Renter-occupied |
| 1-Person Household | 57 (83.8%) | 11 (16.2%) |
| 2-Person Household | 5 (100.0%) | 0 (0.0%) |
| 3-Person Household | 3 (100.0%) | 0 (0.0%) |
| 4+ Person Household | 7 (100.0%) | 0 (0.0%) |
| Total Housing Units | 72 (86.8%) | 11 (13.3%) |
Occupancy by Educational Attainment in Yellow Bluff
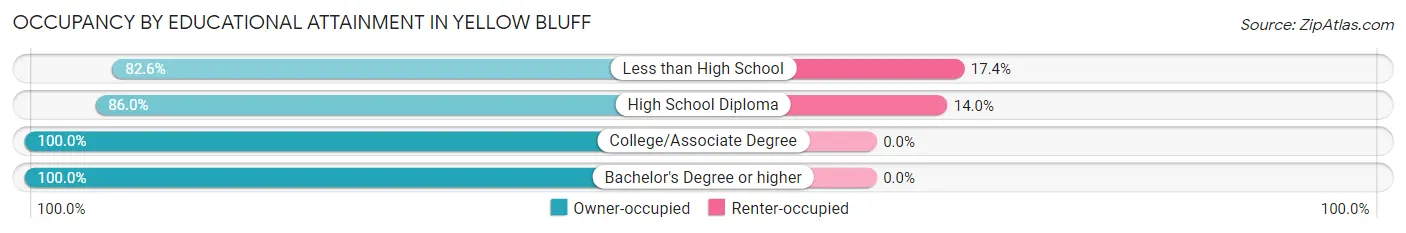
| Household Size | Owner-occupied | Renter-occupied |
| Less than High School | 19 (82.6%) | 4 (17.4%) |
| High School Diploma | 43 (86.0%) | 7 (14.0%) |
| College/Associate Degree | 3 (100.0%) | 0 (0.0%) |
| Bachelor's Degree or higher | 7 (100.0%) | 0 (0.0%) |
Occupancy by Age of Householder in Yellow Bluff
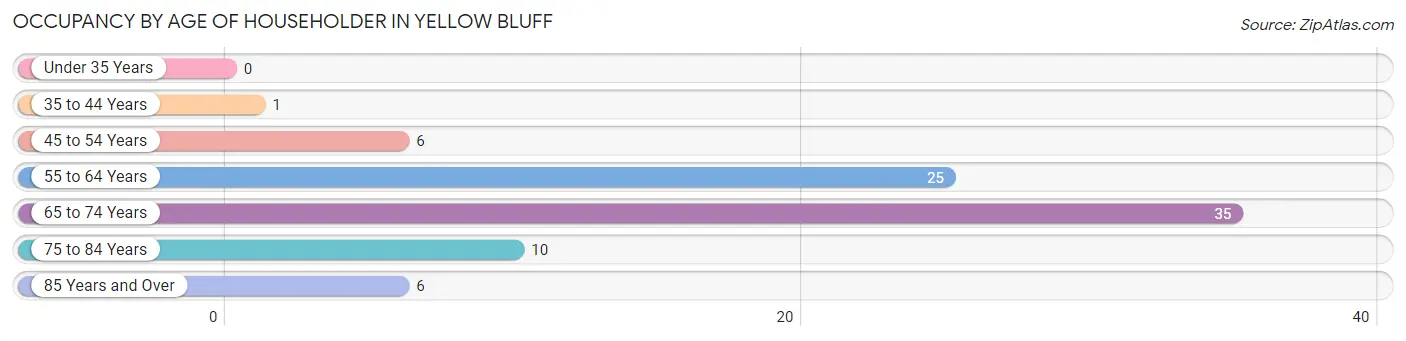
| Age Bracket | # Households | % Households |
| Under 35 Years | 0 | 0.0% |
| 35 to 44 Years | 1 | 1.2% |
| 45 to 54 Years | 6 | 7.2% |
| 55 to 64 Years | 25 | 30.1% |
| 65 to 74 Years | 35 | 42.2% |
| 75 to 84 Years | 10 | 12.0% |
| 85 Years and Over | 6 | 7.2% |
| Total | 83 | 100.0% |
Housing Finances in Yellow Bluff
Median Income by Occupancy in Yellow Bluff
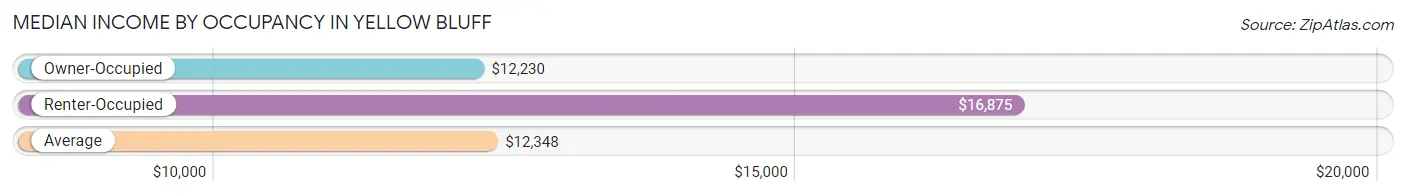
| Occupancy Type | # Households | Median Income |
| Owner-Occupied | 72 (86.8%) | $12,230 |
| Renter-Occupied | 11 (13.3%) | $16,875 |
| Average | 83 (100.0%) | $12,348 |
Occupancy by Householder Income Bracket in Yellow Bluff
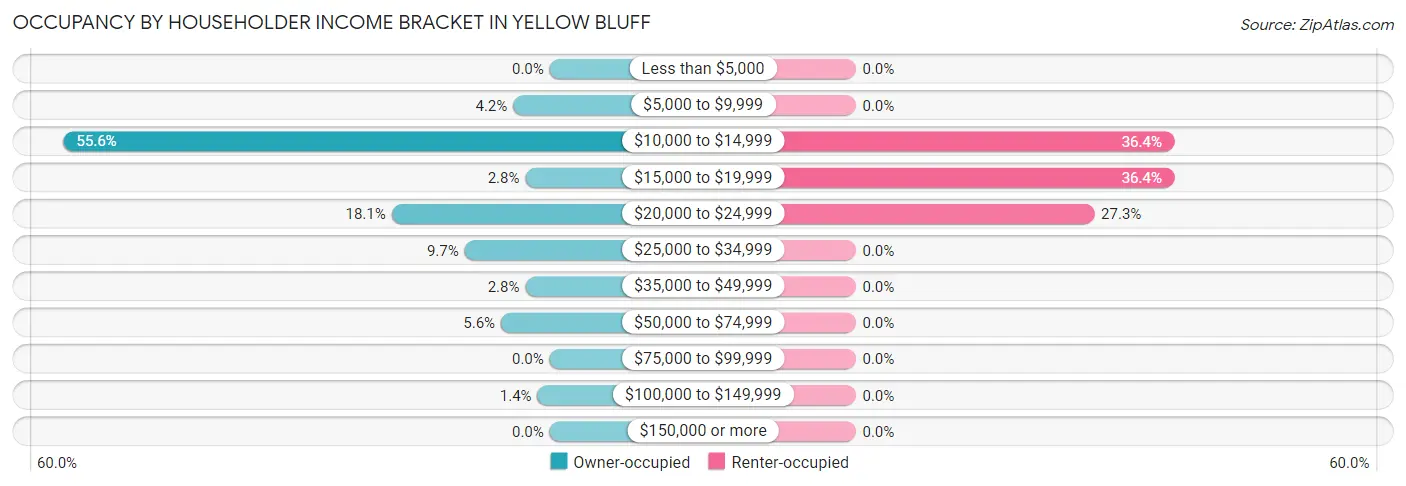
| Income Bracket | Owner-occupied | Renter-occupied |
| Less than $5,000 | 0 (0.0%) | 0 (0.0%) |
| $5,000 to $9,999 | 3 (4.2%) | 0 (0.0%) |
| $10,000 to $14,999 | 40 (55.6%) | 4 (36.4%) |
| $15,000 to $19,999 | 2 (2.8%) | 4 (36.4%) |
| $20,000 to $24,999 | 13 (18.1%) | 3 (27.3%) |
| $25,000 to $34,999 | 7 (9.7%) | 0 (0.0%) |
| $35,000 to $49,999 | 2 (2.8%) | 0 (0.0%) |
| $50,000 to $74,999 | 4 (5.6%) | 0 (0.0%) |
| $75,000 to $99,999 | 0 (0.0%) | 0 (0.0%) |
| $100,000 to $149,999 | 1 (1.4%) | 0 (0.0%) |
| $150,000 or more | 0 (0.0%) | 0 (0.0%) |
| Total | 72 (100.0%) | 11 (100.0%) |
Monthly Housing Cost Tiers in Yellow Bluff
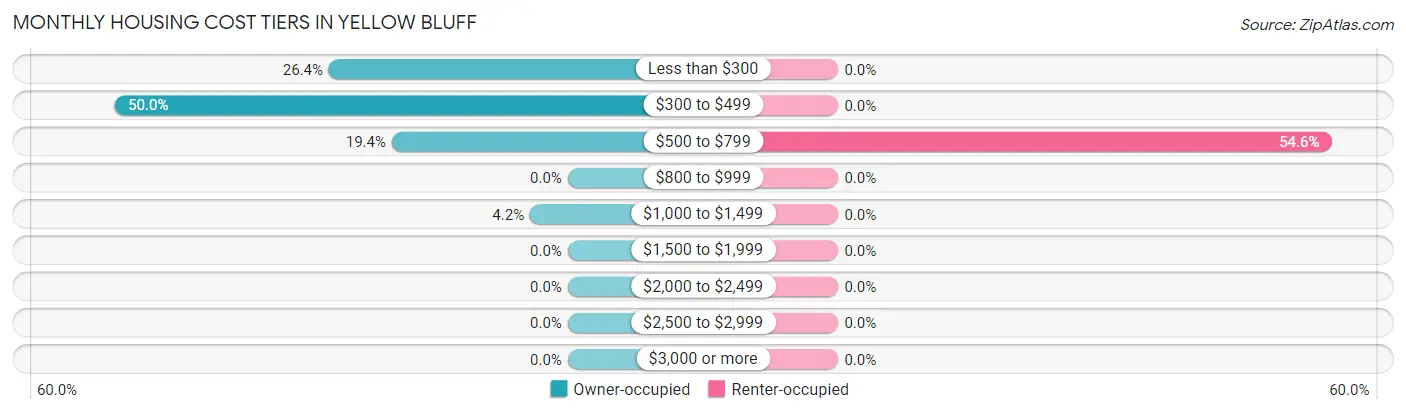
| Monthly Cost | Owner-occupied | Renter-occupied |
| Less than $300 | 19 (26.4%) | 0 (0.0%) |
| $300 to $499 | 36 (50.0%) | 0 (0.0%) |
| $500 to $799 | 14 (19.4%) | 6 (54.5%) |
| $800 to $999 | 0 (0.0%) | 0 (0.0%) |
| $1,000 to $1,499 | 3 (4.2%) | 0 (0.0%) |
| $1,500 to $1,999 | 0 (0.0%) | 0 (0.0%) |
| $2,000 to $2,499 | 0 (0.0%) | 0 (0.0%) |
| $2,500 to $2,999 | 0 (0.0%) | 0 (0.0%) |
| $3,000 or more | 0 (0.0%) | 0 (0.0%) |
| Total | 72 (100.0%) | 11 (100.0%) |
Physical Housing Characteristics in Yellow Bluff
Housing Structures in Yellow Bluff
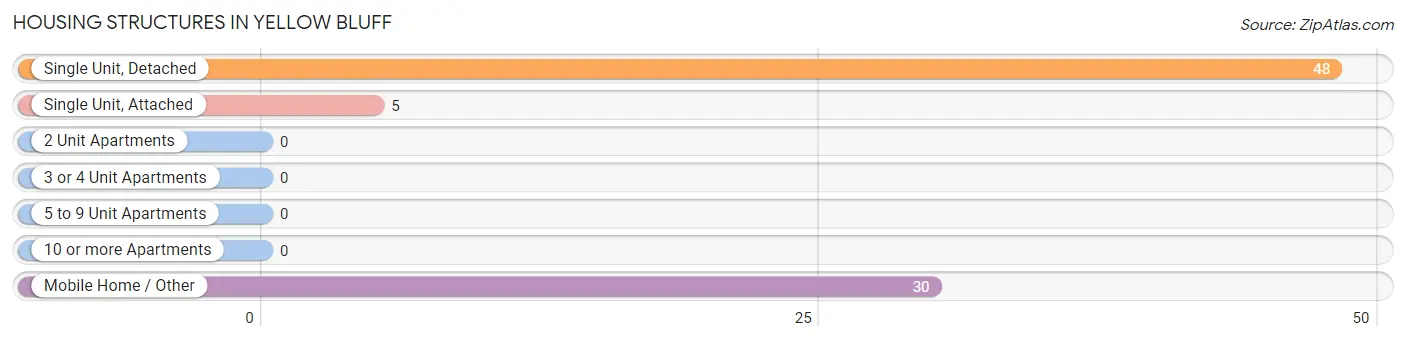
| Structure Type | # Housing Units | % Housing Units |
| Single Unit, Detached | 48 | 57.8% |
| Single Unit, Attached | 5 | 6.0% |
| 2 Unit Apartments | 0 | 0.0% |
| 3 or 4 Unit Apartments | 0 | 0.0% |
| 5 to 9 Unit Apartments | 0 | 0.0% |
| 10 or more Apartments | 0 | 0.0% |
| Mobile Home / Other | 30 | 36.1% |
| Total | 83 | 100.0% |
Housing Structures by Occupancy in Yellow Bluff
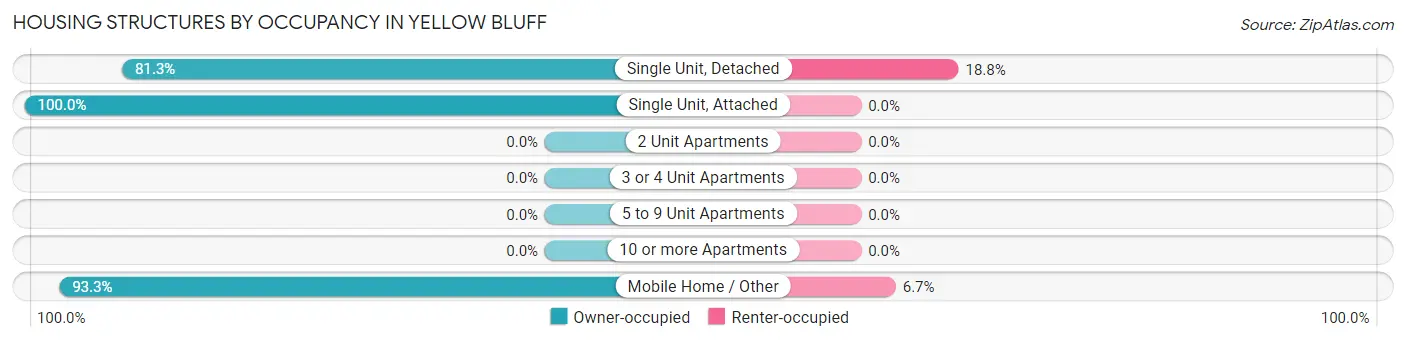
| Structure Type | Owner-occupied | Renter-occupied |
| Single Unit, Detached | 39 (81.2%) | 9 (18.8%) |
| Single Unit, Attached | 5 (100.0%) | 0 (0.0%) |
| 2 Unit Apartments | 0 (0.0%) | 0 (0.0%) |
| 3 or 4 Unit Apartments | 0 (0.0%) | 0 (0.0%) |
| 5 to 9 Unit Apartments | 0 (0.0%) | 0 (0.0%) |
| 10 or more Apartments | 0 (0.0%) | 0 (0.0%) |
| Mobile Home / Other | 28 (93.3%) | 2 (6.7%) |
| Total | 72 (86.8%) | 11 (13.3%) |
Housing Structures by Number of Rooms in Yellow Bluff
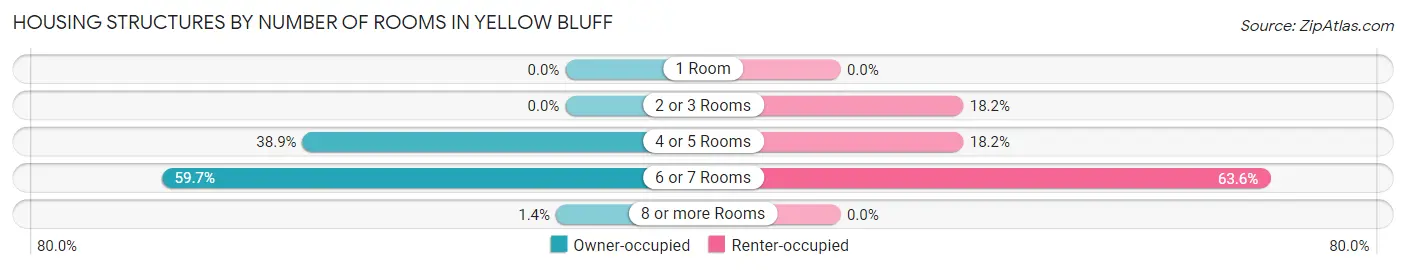
| Number of Rooms | Owner-occupied | Renter-occupied |
| 1 Room | 0 (0.0%) | 0 (0.0%) |
| 2 or 3 Rooms | 0 (0.0%) | 2 (18.2%) |
| 4 or 5 Rooms | 28 (38.9%) | 2 (18.2%) |
| 6 or 7 Rooms | 43 (59.7%) | 7 (63.6%) |
| 8 or more Rooms | 1 (1.4%) | 0 (0.0%) |
| Total | 72 (100.0%) | 11 (100.0%) |
Housing Structure by Heating Type in Yellow Bluff
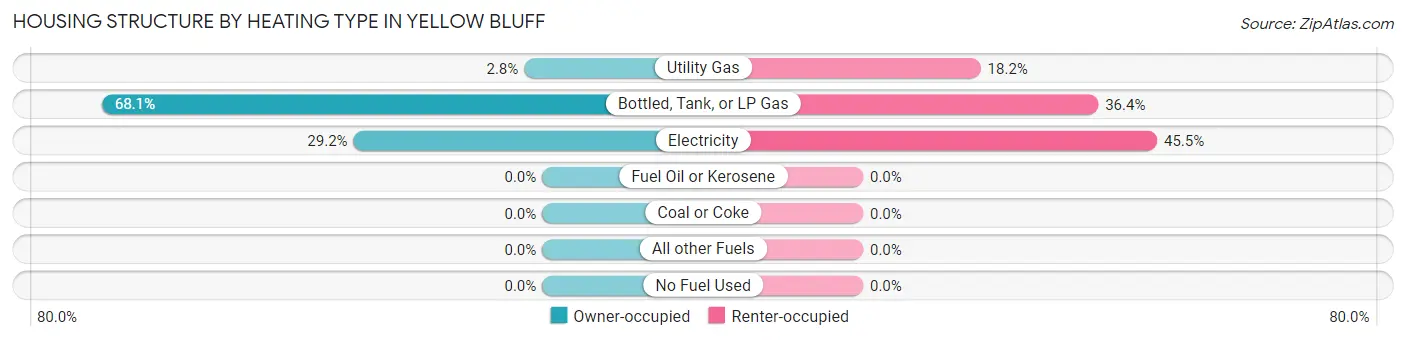
| Heating Type | Owner-occupied | Renter-occupied |
| Utility Gas | 2 (2.8%) | 2 (18.2%) |
| Bottled, Tank, or LP Gas | 49 (68.1%) | 4 (36.4%) |
| Electricity | 21 (29.2%) | 5 (45.5%) |
| Fuel Oil or Kerosene | 0 (0.0%) | 0 (0.0%) |
| Coal or Coke | 0 (0.0%) | 0 (0.0%) |
| All other Fuels | 0 (0.0%) | 0 (0.0%) |
| No Fuel Used | 0 (0.0%) | 0 (0.0%) |
| Total | 72 (100.0%) | 11 (100.0%) |
Household Vehicle Usage in Yellow Bluff
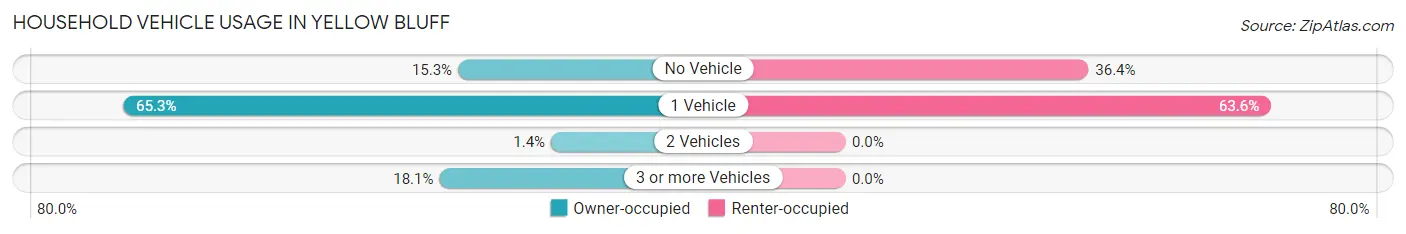
| Vehicles per Household | Owner-occupied | Renter-occupied |
| No Vehicle | 11 (15.3%) | 4 (36.4%) |
| 1 Vehicle | 47 (65.3%) | 7 (63.6%) |
| 2 Vehicles | 1 (1.4%) | 0 (0.0%) |
| 3 or more Vehicles | 13 (18.1%) | 0 (0.0%) |
| Total | 72 (100.0%) | 11 (100.0%) |
Real Estate & Mortgages in Yellow Bluff
Real Estate and Mortgage Overview in Yellow Bluff
| Characteristic | Without Mortgage | With Mortgage |
| Housing Units | 69 | 3 |
| Median Property Value | $71,300 | $0 |
| Median Household Income | $12,128 | $0 |
| Monthly Housing Costs | $424 | $0 |
| Real Estate Taxes | $208 | $2 |
Property Value by Mortgage Status in Yellow Bluff
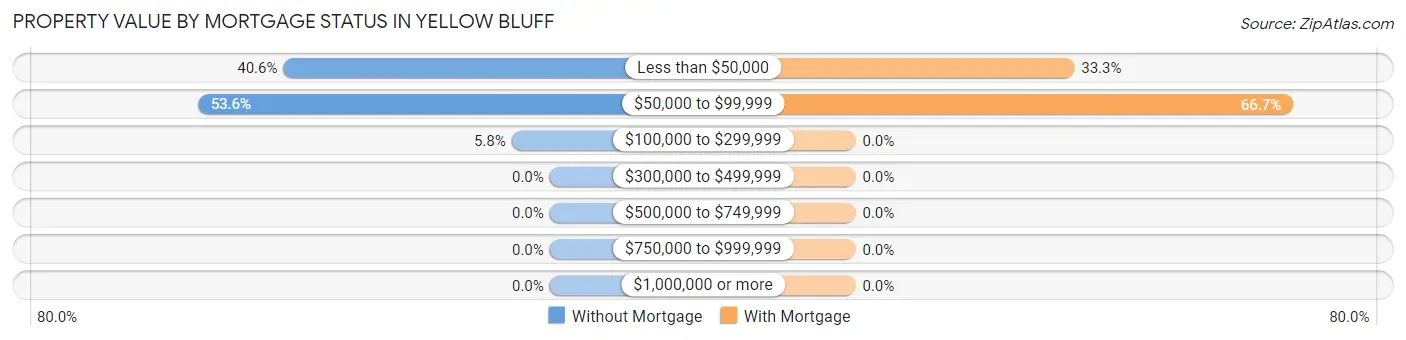
| Property Value | Without Mortgage | With Mortgage |
| Less than $50,000 | 28 (40.6%) | 1 (33.3%) |
| $50,000 to $99,999 | 37 (53.6%) | 2 (66.7%) |
| $100,000 to $299,999 | 4 (5.8%) | 0 (0.0%) |
| $300,000 to $499,999 | 0 (0.0%) | 0 (0.0%) |
| $500,000 to $749,999 | 0 (0.0%) | 0 (0.0%) |
| $750,000 to $999,999 | 0 (0.0%) | 0 (0.0%) |
| $1,000,000 or more | 0 (0.0%) | 0 (0.0%) |
| Total | 69 (100.0%) | 3 (100.0%) |
Household Income by Mortgage Status in Yellow Bluff
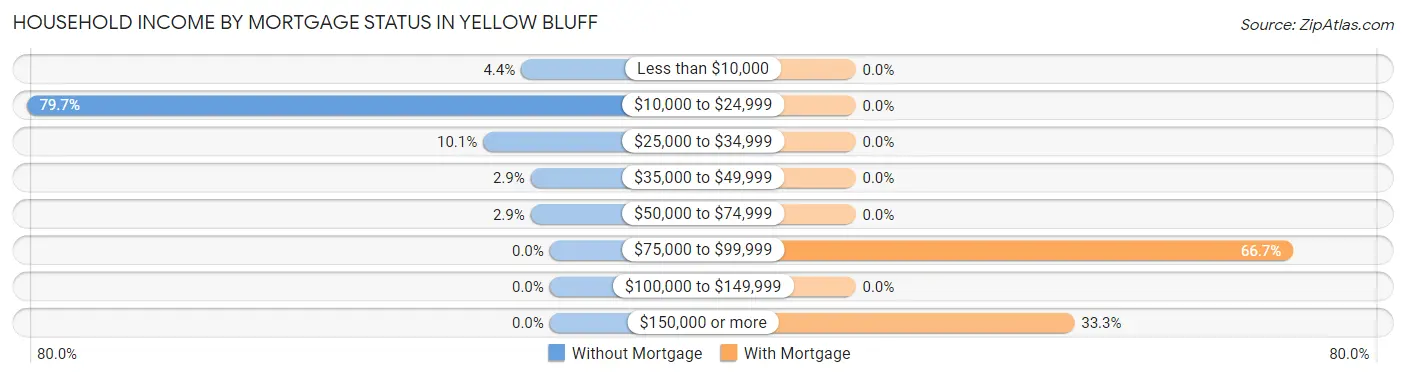
| Household Income | Without Mortgage | With Mortgage |
| Less than $10,000 | 3 (4.3%) | 0 (0.0%) |
| $10,000 to $24,999 | 55 (79.7%) | 0 (0.0%) |
| $25,000 to $34,999 | 7 (10.1%) | 0 (0.0%) |
| $35,000 to $49,999 | 2 (2.9%) | 0 (0.0%) |
| $50,000 to $74,999 | 2 (2.9%) | 0 (0.0%) |
| $75,000 to $99,999 | 0 (0.0%) | 2 (66.7%) |
| $100,000 to $149,999 | 0 (0.0%) | 0 (0.0%) |
| $150,000 or more | 0 (0.0%) | 1 (33.3%) |
| Total | 69 (100.0%) | 3 (100.0%) |
Property Value to Household Income Ratio in Yellow Bluff
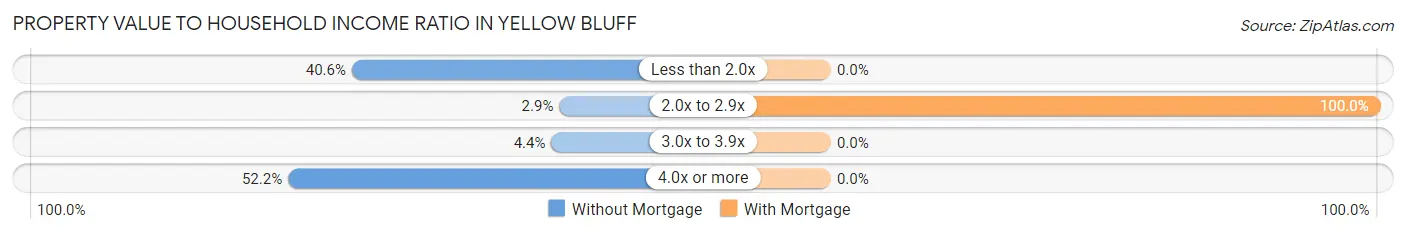
| Value-to-Income Ratio | Without Mortgage | With Mortgage |
| Less than 2.0x | 28 (40.6%) | 0 (0.0%) |
| 2.0x to 2.9x | 2 (2.9%) | 3 (100.0%) |
| 3.0x to 3.9x | 3 (4.3%) | 0 (0.0%) |
| 4.0x or more | 36 (52.2%) | 0 (0.0%) |
| Total | 69 (100.0%) | 3 (100.0%) |
Real Estate Taxes by Mortgage Status in Yellow Bluff
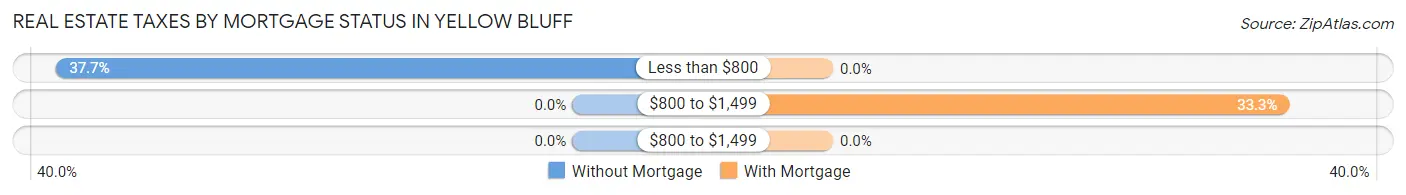
| Property Taxes | Without Mortgage | With Mortgage |
| Less than $800 | 26 (37.7%) | 0 (0.0%) |
| $800 to $1,499 | 0 (0.0%) | 1 (33.3%) |
| $800 to $1,499 | 0 (0.0%) | 0 (0.0%) |
| Total | 69 (100.0%) | 3 (100.0%) |
Health & Disability in Yellow Bluff
Health Insurance Coverage by Age in Yellow Bluff
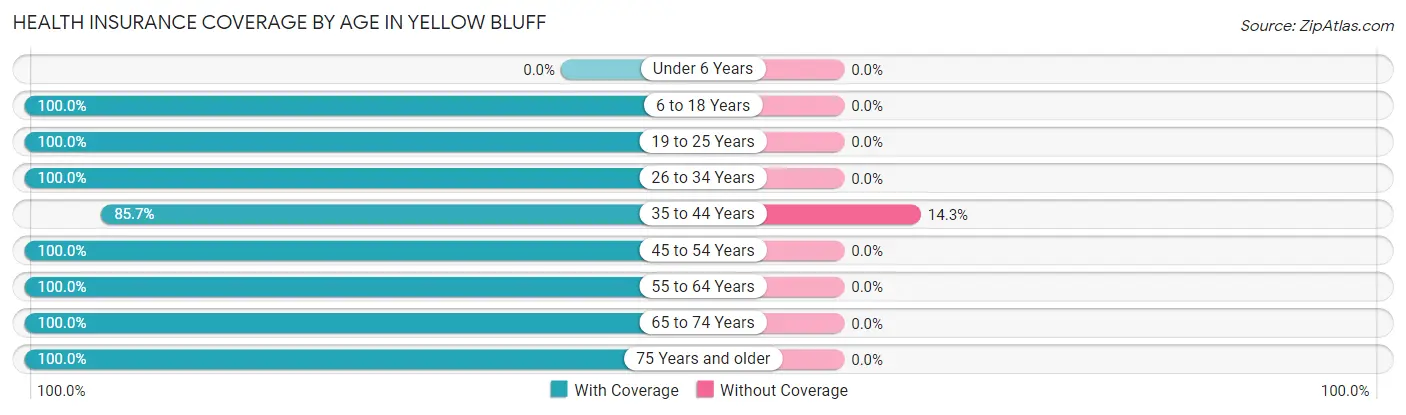
| Age Bracket | With Coverage | Without Coverage |
| Under 6 Years | 0 (0.0%) | 0 (0.0%) |
| 6 to 18 Years | 9 (100.0%) | 0 (0.0%) |
| 19 to 25 Years | 18 (100.0%) | 0 (0.0%) |
| 26 to 34 Years | 8 (100.0%) | 0 (0.0%) |
| 35 to 44 Years | 6 (85.7%) | 1 (14.3%) |
| 45 to 54 Years | 11 (100.0%) | 0 (0.0%) |
| 55 to 64 Years | 32 (100.0%) | 0 (0.0%) |
| 65 to 74 Years | 39 (100.0%) | 0 (0.0%) |
| 75 Years and older | 16 (100.0%) | 0 (0.0%) |
| Total | 139 (99.3%) | 1 (0.7%) |
Health Insurance Coverage by Citizenship Status in Yellow Bluff
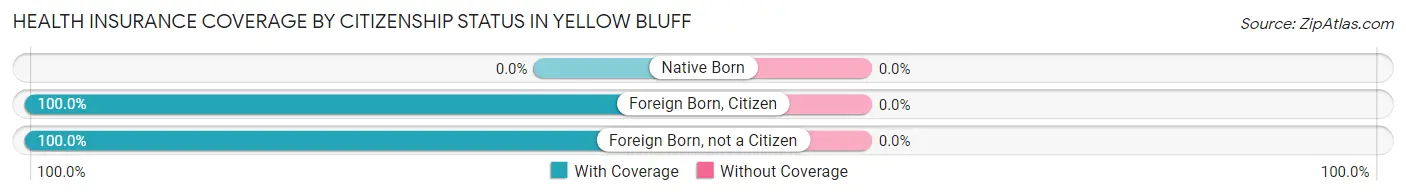
| Citizenship Status | With Coverage | Without Coverage |
| Native Born | 0 (0.0%) | 0 (0.0%) |
| Foreign Born, Citizen | 9 (100.0%) | 0 (0.0%) |
| Foreign Born, not a Citizen | 18 (100.0%) | 0 (0.0%) |
Health Insurance Coverage by Household Income in Yellow Bluff
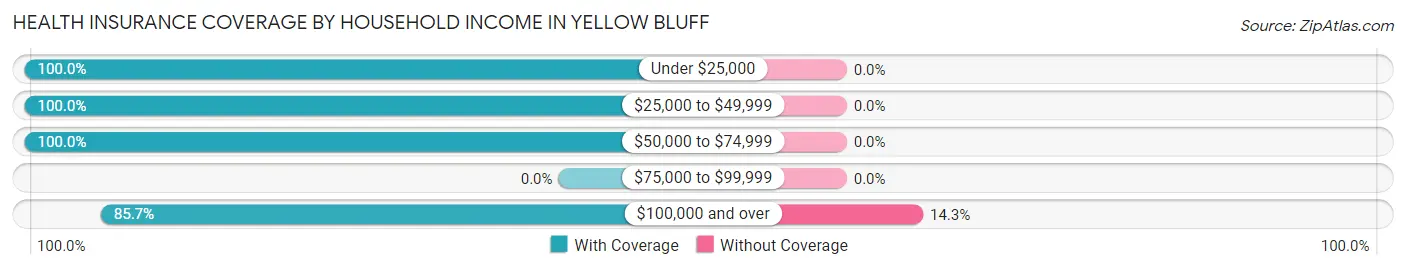
| Household Income | With Coverage | Without Coverage |
| Under $25,000 | 103 (100.0%) | 0 (0.0%) |
| $25,000 to $49,999 | 18 (100.0%) | 0 (0.0%) |
| $50,000 to $74,999 | 12 (100.0%) | 0 (0.0%) |
| $75,000 to $99,999 | 0 (0.0%) | 0 (0.0%) |
| $100,000 and over | 6 (85.7%) | 1 (14.3%) |
Public vs Private Health Insurance Coverage by Age in Yellow Bluff
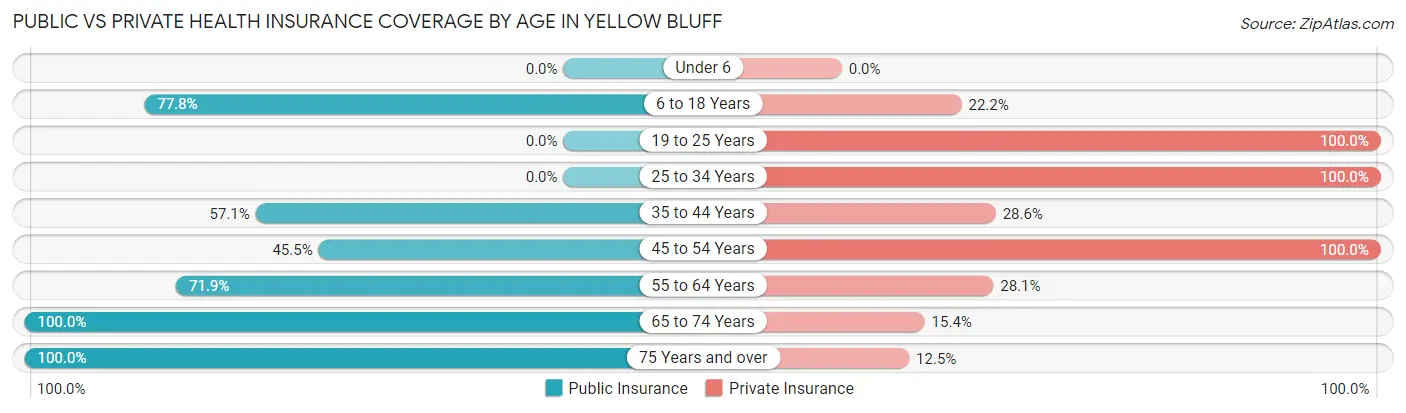
| Age Bracket | Public Insurance | Private Insurance |
| Under 6 | 0 (0.0%) | 0 (0.0%) |
| 6 to 18 Years | 7 (77.8%) | 2 (22.2%) |
| 19 to 25 Years | 0 (0.0%) | 18 (100.0%) |
| 25 to 34 Years | 0 (0.0%) | 8 (100.0%) |
| 35 to 44 Years | 4 (57.1%) | 2 (28.6%) |
| 45 to 54 Years | 5 (45.5%) | 11 (100.0%) |
| 55 to 64 Years | 23 (71.9%) | 9 (28.1%) |
| 65 to 74 Years | 39 (100.0%) | 6 (15.4%) |
| 75 Years and over | 16 (100.0%) | 2 (12.5%) |
| Total | 94 (67.1%) | 58 (41.4%) |
Disability Status by Sex by Age in Yellow Bluff
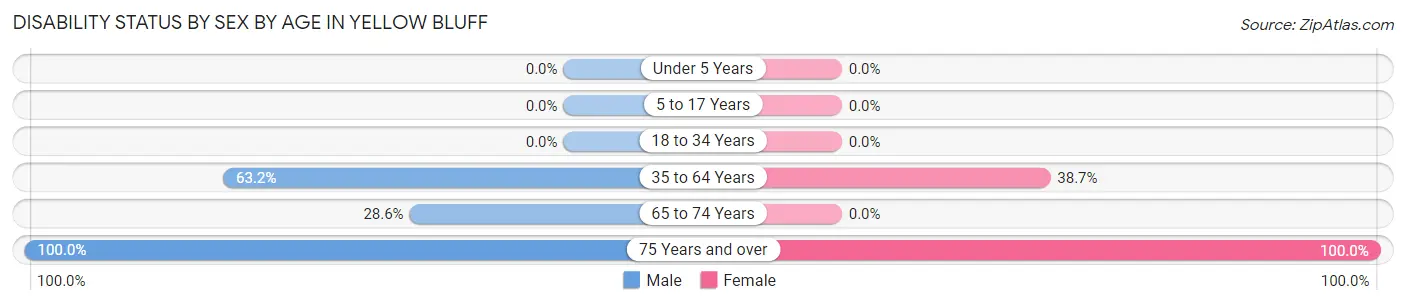
| Age Bracket | Male | Female |
| Under 5 Years | 0 (0.0%) | 0 (0.0%) |
| 5 to 17 Years | 0 (0.0%) | 0 (0.0%) |
| 18 to 34 Years | 0 (0.0%) | 0 (0.0%) |
| 35 to 64 Years | 12 (63.2%) | 12 (38.7%) |
| 65 to 74 Years | 2 (28.6%) | 0 (0.0%) |
| 75 Years and over | 4 (100.0%) | 12 (100.0%) |
Disability Class by Sex by Age in Yellow Bluff
Disability Class: Hearing Difficulty
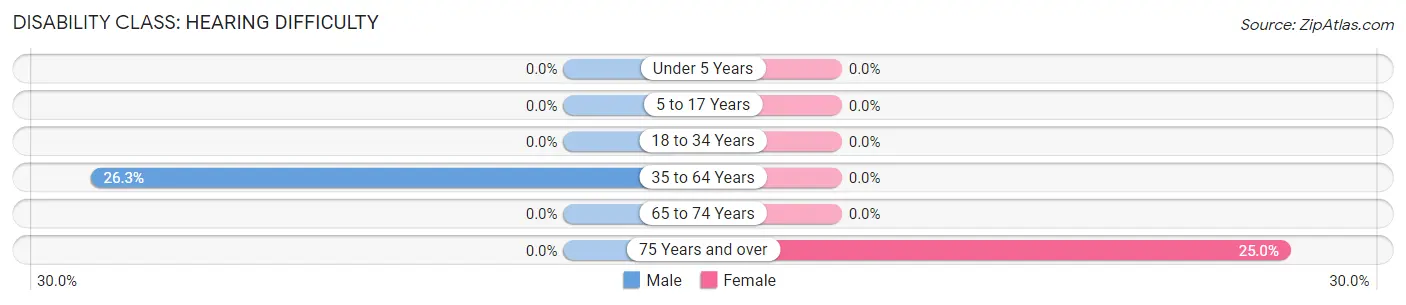
| Age Bracket | Male | Female |
| Under 5 Years | 0 (0.0%) | 0 (0.0%) |
| 5 to 17 Years | 0 (0.0%) | 0 (0.0%) |
| 18 to 34 Years | 0 (0.0%) | 0 (0.0%) |
| 35 to 64 Years | 5 (26.3%) | 0 (0.0%) |
| 65 to 74 Years | 0 (0.0%) | 0 (0.0%) |
| 75 Years and over | 0 (0.0%) | 3 (25.0%) |
Disability Class: Vision Difficulty
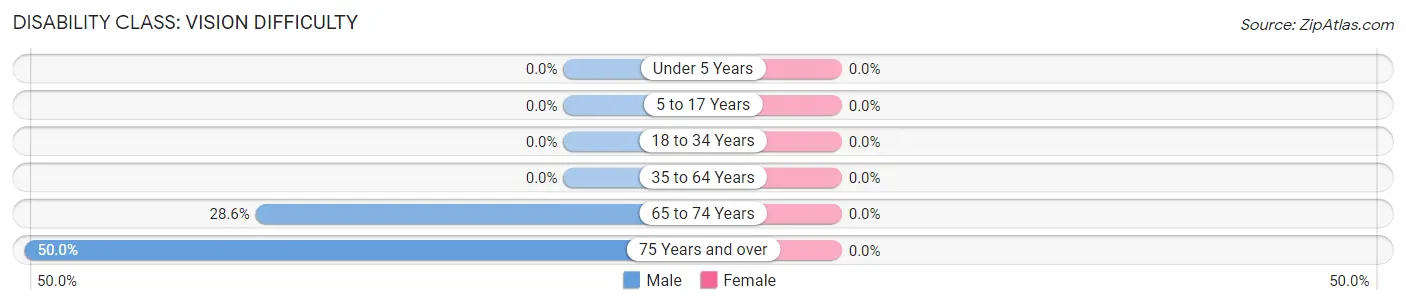
| Age Bracket | Male | Female |
| Under 5 Years | 0 (0.0%) | 0 (0.0%) |
| 5 to 17 Years | 0 (0.0%) | 0 (0.0%) |
| 18 to 34 Years | 0 (0.0%) | 0 (0.0%) |
| 35 to 64 Years | 0 (0.0%) | 0 (0.0%) |
| 65 to 74 Years | 2 (28.6%) | 0 (0.0%) |
| 75 Years and over | 2 (50.0%) | 0 (0.0%) |
Disability Class: Cognitive Difficulty
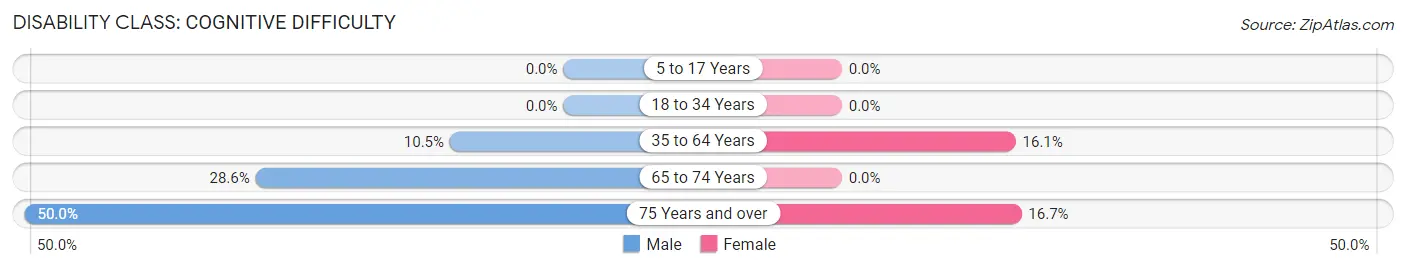
| Age Bracket | Male | Female |
| 5 to 17 Years | 0 (0.0%) | 0 (0.0%) |
| 18 to 34 Years | 0 (0.0%) | 0 (0.0%) |
| 35 to 64 Years | 2 (10.5%) | 5 (16.1%) |
| 65 to 74 Years | 2 (28.6%) | 0 (0.0%) |
| 75 Years and over | 2 (50.0%) | 2 (16.7%) |
Disability Class: Ambulatory Difficulty
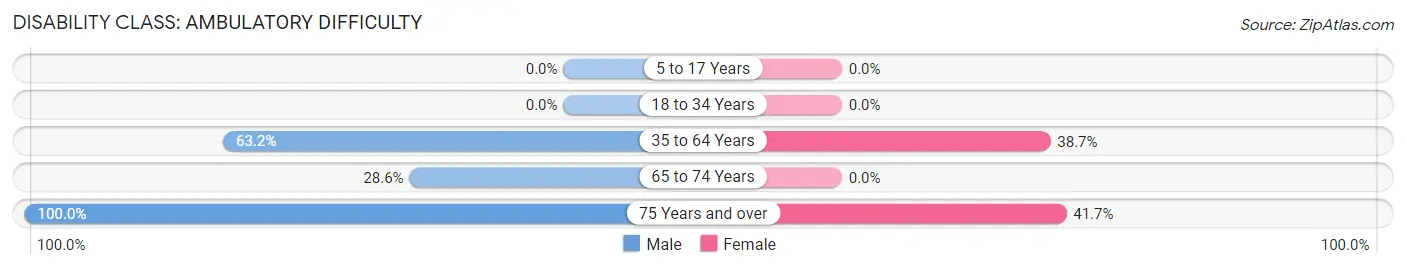
| Age Bracket | Male | Female |
| 5 to 17 Years | 0 (0.0%) | 0 (0.0%) |
| 18 to 34 Years | 0 (0.0%) | 0 (0.0%) |
| 35 to 64 Years | 12 (63.2%) | 12 (38.7%) |
| 65 to 74 Years | 2 (28.6%) | 0 (0.0%) |
| 75 Years and over | 4 (100.0%) | 5 (41.7%) |
Disability Class: Self-Care Difficulty
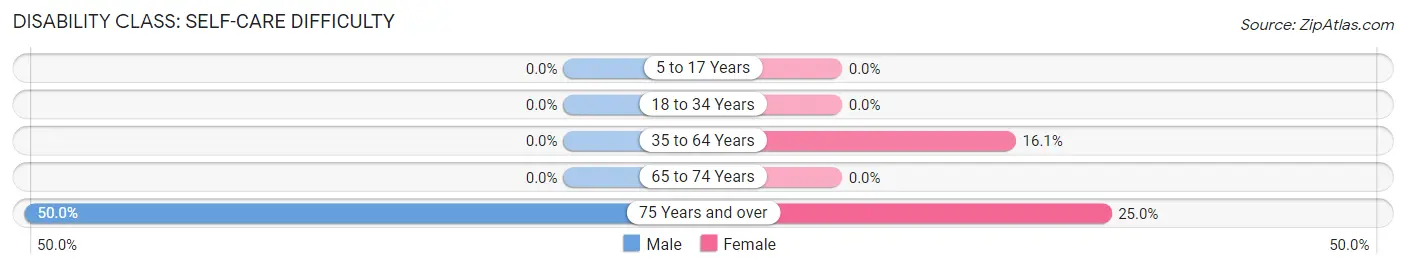
| Age Bracket | Male | Female |
| 5 to 17 Years | 0 (0.0%) | 0 (0.0%) |
| 18 to 34 Years | 0 (0.0%) | 0 (0.0%) |
| 35 to 64 Years | 0 (0.0%) | 5 (16.1%) |
| 65 to 74 Years | 0 (0.0%) | 0 (0.0%) |
| 75 Years and over | 2 (50.0%) | 3 (25.0%) |
Technology Access in Yellow Bluff
Computing Device Access in Yellow Bluff
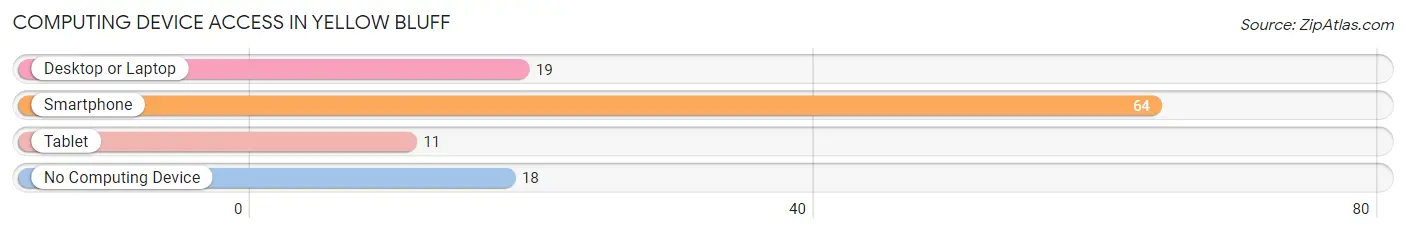
| Device Type | # Households | % Households |
| Desktop or Laptop | 19 | 22.9% |
| Smartphone | 64 | 77.1% |
| Tablet | 11 | 13.3% |
| No Computing Device | 18 | 21.7% |
| Total | 83 | 100.0% |
Internet Access in Yellow Bluff
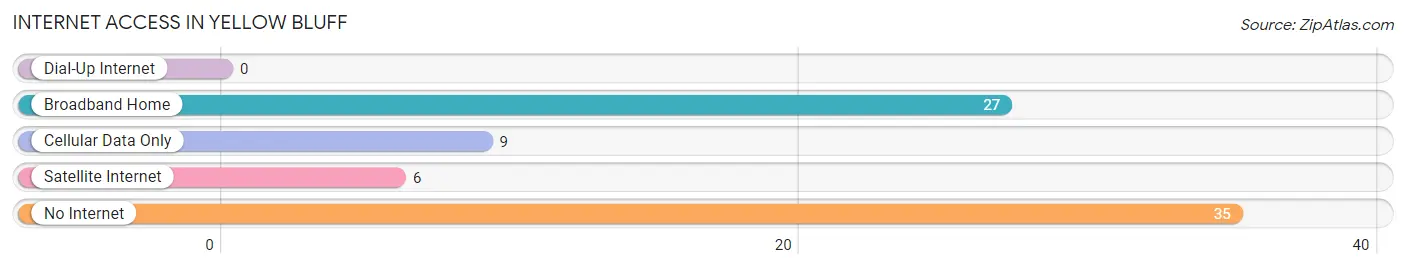
| Internet Type | # Households | % Households |
| Dial-Up Internet | 0 | 0.0% |
| Broadband Home | 27 | 32.5% |
| Cellular Data Only | 9 | 10.8% |
| Satellite Internet | 6 | 7.2% |
| No Internet | 35 | 42.2% |
| Total | 83 | 100.0% |
Yellow Bluff Summary
Introduction
Yellow Bluff is a small unincorporated community located in the northern part of Baldwin County, Alabama. It is situated on the banks of the Perdido River, which forms the border between Alabama and Florida. The community is located approximately 20 miles north of the city of Mobile and is part of the Mobile metropolitan area. The population of Yellow Bluff was estimated to be around 1,000 in 2020.
History
The area that is now Yellow Bluff was first settled in the early 1800s by settlers from the Carolinas and Georgia. The settlement was originally known as “Perdido”, after the nearby river. The name was changed to “Yellow Bluff” in 1836, when the post office was established. The name is believed to have been derived from the yellowish-brown color of the bluffs along the river.
The area was primarily agricultural, with cotton and corn being the main crops. The community also had a sawmill and a gristmill. In the late 1800s, the area was home to a number of small businesses, including a general store, a blacksmith shop, and a hotel.
Geography
Yellow Bluff is located in the northern part of Baldwin County, Alabama. It is situated on the banks of the Perdido River, which forms the border between Alabama and Florida. The community is located approximately 20 miles north of the city of Mobile and is part of the Mobile metropolitan area.
The terrain of the area is mostly flat, with some rolling hills. The soil is mostly sandy loam, with some areas of clay. The climate is humid subtropical, with hot, humid summers and mild winters.
Economy
The economy of Yellow Bluff is largely based on agriculture. The main crops are cotton, corn, soybeans, and peanuts. The area also has a number of small businesses, including a general store, a blacksmith shop, and a hotel.
The area is also home to a number of recreational activities, including fishing, hunting, and boating. The nearby Perdido River is a popular destination for fishing and boating.
Demographics
The population of Yellow Bluff was estimated to be around 1,000 in 2020. The racial makeup of the community is predominantly white (90.2%), with African Americans (7.2%), Hispanics (1.2%), and other races (1.4%) making up the remainder.
The median household income in Yellow Bluff is $37,500, which is lower than the national average of $60,000. The median age of the population is 44.7 years, which is slightly higher than the national average of 38.7 years.
Conclusion
Yellow Bluff is a small unincorporated community located in the northern part of Baldwin County, Alabama. It is situated on the banks of the Perdido River, which forms the border between Alabama and Florida. The community is primarily agricultural, with cotton and corn being the main crops. The population of Yellow Bluff was estimated to be around 1,000 in 2020. The racial makeup of the community is predominantly white, with African Americans, Hispanics, and other races making up the remainder. The median household income in Yellow Bluff is $37,500, which is lower than the national average. The area is also home to a number of recreational activities, including fishing, hunting, and boating.
Common Questions
What is Per Capita Income in Yellow Bluff?
Per Capita income in Yellow Bluff is $13,330.
What is the Median Household income in Yellow Bluff?
Median Household Income in Yellow Bluff is $12,348.
What is Income or Wage Gap in Yellow Bluff?
Income or Wage Gap in Yellow Bluff is 92.3%.
Women in Yellow Bluff earn 7.7 cents for every dollar earned by a man.
What is Inequality or Gini Index in Yellow Bluff?
Inequality or Gini Index in Yellow Bluff is 0.33.
What is the Total Population of Yellow Bluff?
Total Population of Yellow Bluff is 140.
What is the Total Male Population of Yellow Bluff?
Total Male Population of Yellow Bluff is 50.
What is the Total Female Population of Yellow Bluff?
Total Female Population of Yellow Bluff is 90.
What is the Ratio of Males per 100 Females in Yellow Bluff?
There are 55.56 Males per 100 Females in Yellow Bluff.
What is the Ratio of Females per 100 Males in Yellow Bluff?
There are 180.00 Females per 100 Males in Yellow Bluff.
What is the Median Population Age in Yellow Bluff?
Median Population Age in Yellow Bluff is 61.3 Years.
What is the Average Family Size in Yellow Bluff
Average Family Size in Yellow Bluff is 4.6 People.
What is the Average Household Size in Yellow Bluff
Average Household Size in Yellow Bluff is 1.7 People.
How Large is the Labor Force in Yellow Bluff?
There are 42 People in the Labor Forcein in Yellow Bluff.
What is the Percentage of People in the Labor Force in Yellow Bluff?
32.1% of People are in the Labor Force in Yellow Bluff.
What is the Unemployment Rate in Yellow Bluff?
Unemployment Rate in Yellow Bluff is 54.8%.