Forestdale, AL Map & Demographics
Forestdale Map
Forestdale Overview
$32,320
PER CAPITA INCOME
$78,512
AVG FAMILY INCOME
$62,908
AVG HOUSEHOLD INCOME
2.4%
WAGE / INCOME GAP [ % ]
97.6¢/ $1
WAGE / INCOME GAP [ $ ]
0.41
INEQUALITY / GINI INDEX
9,138
TOTAL POPULATION
4,310
MALE POPULATION
4,828
FEMALE POPULATION
89.27
MALES / 100 FEMALES
112.02
FEMALES / 100 MALES
43.7
MEDIAN AGE
3.0
AVG FAMILY SIZE
2.4
AVG HOUSEHOLD SIZE
5,049
LABOR FORCE [ PEOPLE ]
64.8%
PERCENT IN LABOR FORCE
8.4%
UNEMPLOYMENT RATE
Forestdale Area Codes
Income in Forestdale
Income Overview in Forestdale
Per Capita Income in Forestdale is $32,320, while median incomes of families and households are $78,512 and $62,908 respectively.
| Characteristic | Number | Measure |
| Per Capita Income | 9,138 | $32,320 |
| Median Family Income | 2,430 | $78,512 |
| Mean Family Income | 2,430 | $85,479 |
| Median Household Income | 3,868 | $62,908 |
| Mean Household Income | 3,868 | $72,911 |
| Income Deficit | 2,430 | $0 |
| Wage / Income Gap (%) | 9,138 | 2.45% |
| Wage / Income Gap ($) | 9,138 | 97.55¢ per $1 |
| Gini / Inequality Index | 9,138 | 0.41 |
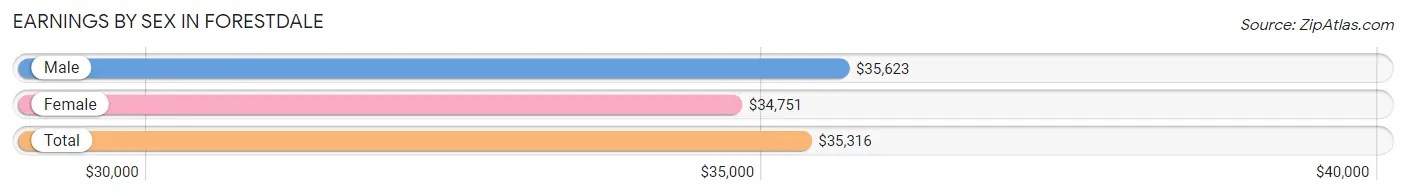
Earnings by Sex in Forestdale
Average Earnings in Forestdale are $35,316, $35,623 for men and $34,751 for women, a difference of 2.5%.
| Sex | Number | Average Earnings |
| Male | 2,658 (51.8%) | $35,623 |
| Female | 2,476 (48.2%) | $34,751 |
| Total | 5,134 (100.0%) | $35,316 |
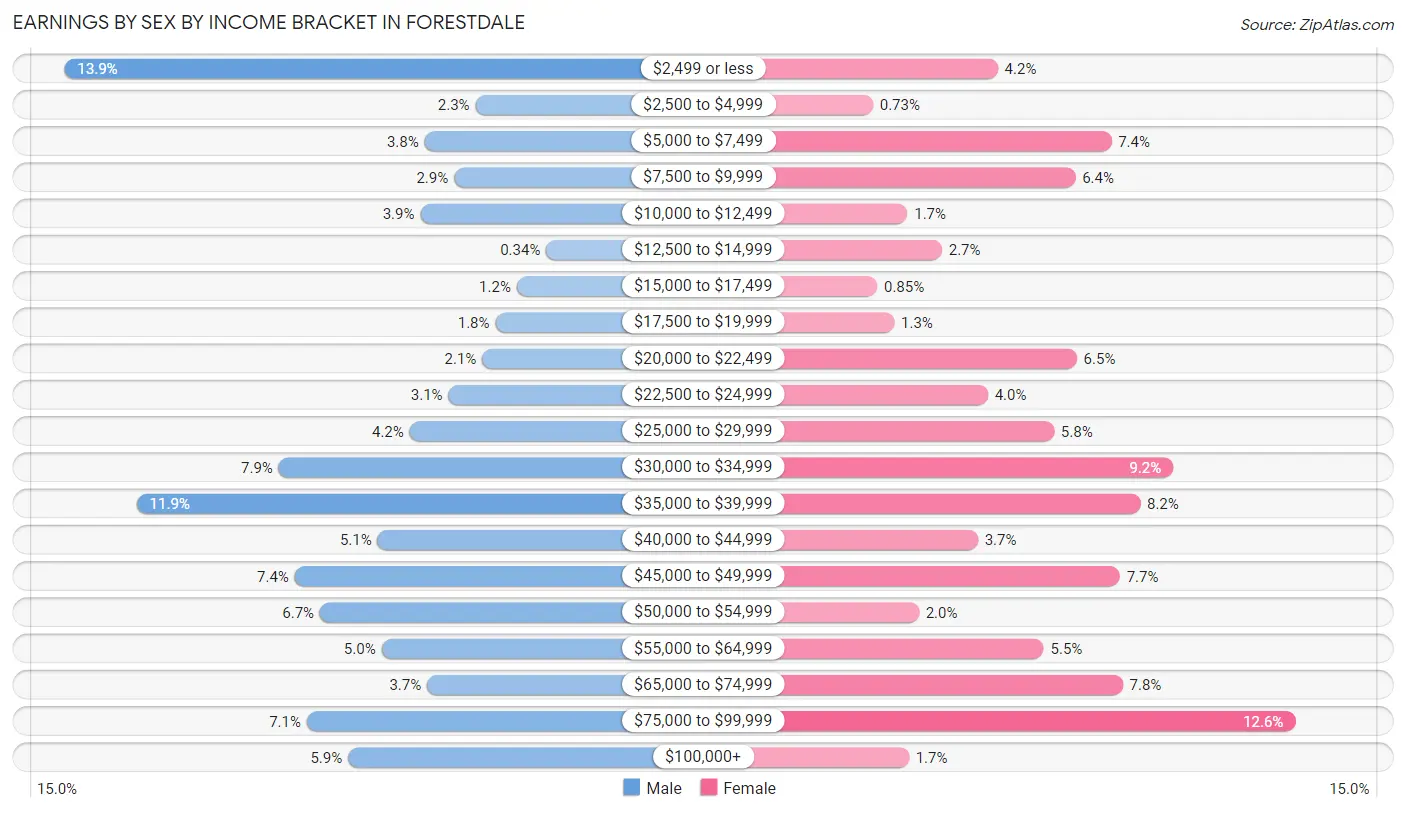
Earnings by Sex by Income Bracket in Forestdale
The most common earnings brackets in Forestdale are $2,499 or less for men (369 | 13.9%) and $75,000 to $99,999 for women (312 | 12.6%).
| Income | Male | Female |
| $2,499 or less | 369 (13.9%) | 105 (4.2%) |
| $2,500 to $4,999 | 62 (2.3%) | 18 (0.7%) |
| $5,000 to $7,499 | 100 (3.8%) | 184 (7.4%) |
| $7,500 to $9,999 | 78 (2.9%) | 159 (6.4%) |
| $10,000 to $12,499 | 103 (3.9%) | 42 (1.7%) |
| $12,500 to $14,999 | 9 (0.3%) | 66 (2.7%) |
| $15,000 to $17,499 | 31 (1.2%) | 21 (0.9%) |
| $17,500 to $19,999 | 47 (1.8%) | 33 (1.3%) |
| $20,000 to $22,499 | 57 (2.1%) | 160 (6.5%) |
| $22,500 to $24,999 | 82 (3.1%) | 98 (4.0%) |
| $25,000 to $29,999 | 111 (4.2%) | 144 (5.8%) |
| $30,000 to $34,999 | 209 (7.9%) | 227 (9.2%) |
| $35,000 to $39,999 | 315 (11.8%) | 204 (8.2%) |
| $40,000 to $44,999 | 135 (5.1%) | 91 (3.7%) |
| $45,000 to $49,999 | 197 (7.4%) | 190 (7.7%) |
| $50,000 to $54,999 | 178 (6.7%) | 50 (2.0%) |
| $55,000 to $64,999 | 132 (5.0%) | 137 (5.5%) |
| $65,000 to $74,999 | 98 (3.7%) | 192 (7.7%) |
| $75,000 to $99,999 | 188 (7.1%) | 312 (12.6%) |
| $100,000+ | 157 (5.9%) | 43 (1.7%) |
| Total | 2,658 (100.0%) | 2,476 (100.0%) |
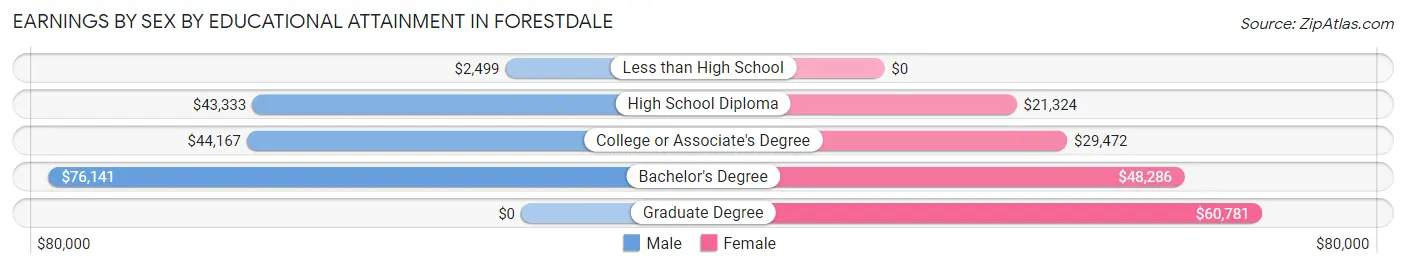
Earnings by Sex by Educational Attainment in Forestdale
Average earnings in Forestdale are $40,851 for men and $36,250 for women, a difference of 11.3%. Men with an educational attainment of bachelor's degree enjoy the highest average annual earnings of $76,141, while those with less than high school education earn the least with $2,499. Women with an educational attainment of graduate degree earn the most with the average annual earnings of $60,781, while those with high school diploma education have the smallest earnings of $21,324.
| Educational Attainment | Male Income | Female Income |
| Less than High School | $2,499 | $0 |
| High School Diploma | $43,333 | $21,324 |
| College or Associate's Degree | $44,167 | $29,472 |
| Bachelor's Degree | $76,141 | $48,286 |
| Graduate Degree | - | - |
| Total | $40,851 | $36,250 |
Family Income in Forestdale
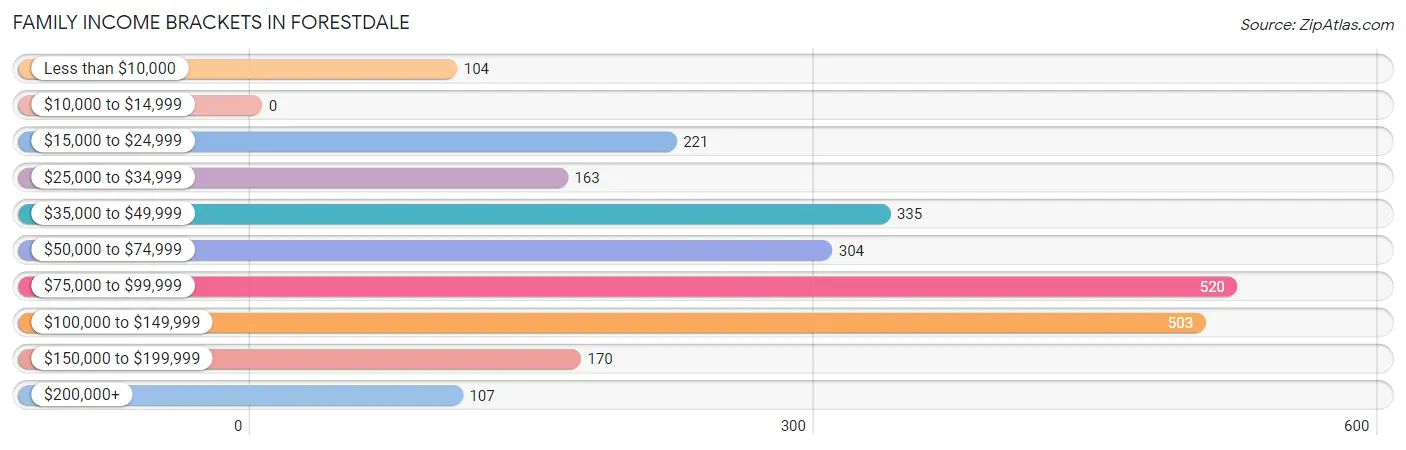
Family Income Brackets in Forestdale
According to the Forestdale family income data, there are 520 families falling into the $75,000 to $99,999 income range, which is the most common income bracket and makes up 21.4% of all families.
| Income Bracket | # Families | % Families |
| Less than $10,000 | 104 | 4.3% |
| $10,000 to $14,999 | 0 | 0.0% |
| $15,000 to $24,999 | 221 | 9.1% |
| $25,000 to $34,999 | 163 | 6.7% |
| $35,000 to $49,999 | 335 | 13.8% |
| $50,000 to $74,999 | 304 | 12.5% |
| $75,000 to $99,999 | 520 | 21.4% |
| $100,000 to $149,999 | 503 | 20.7% |
| $150,000 to $199,999 | 170 | 7.0% |
| $200,000+ | 107 | 4.4% |
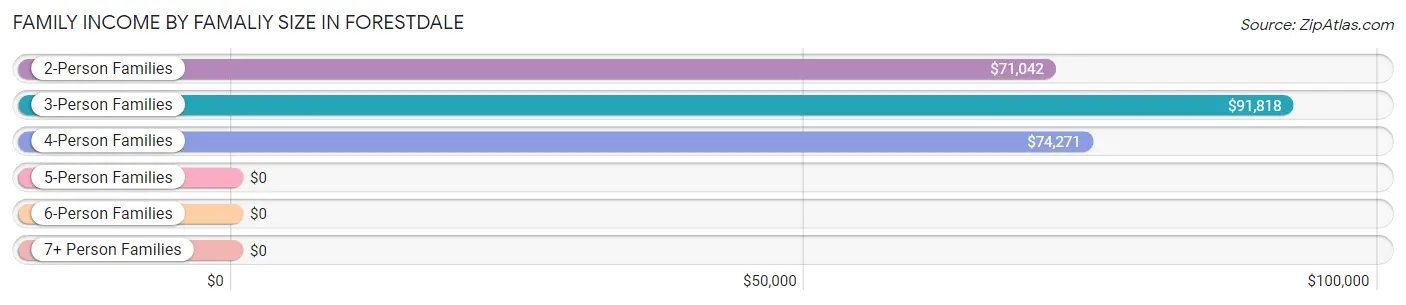
Family Income by Famaliy Size in Forestdale
3-person families (510 | 21.0%) account for the highest median family income in Forestdale with $91,818 per family, while 2-person families (1,361 | 56.0%) have the highest median income of $35,521 per family member.
| Income Bracket | # Families | Median Income |
| 2-Person Families | 1,361 (56.0%) | $71,042 |
| 3-Person Families | 510 (21.0%) | $91,818 |
| 4-Person Families | 450 (18.5%) | $74,271 |
| 5-Person Families | 60 (2.5%) | $0 |
| 6-Person Families | 49 (2.0%) | $0 |
| 7+ Person Families | 0 (0.0%) | $0 |
| Total | 2,430 (100.0%) | $78,512 |
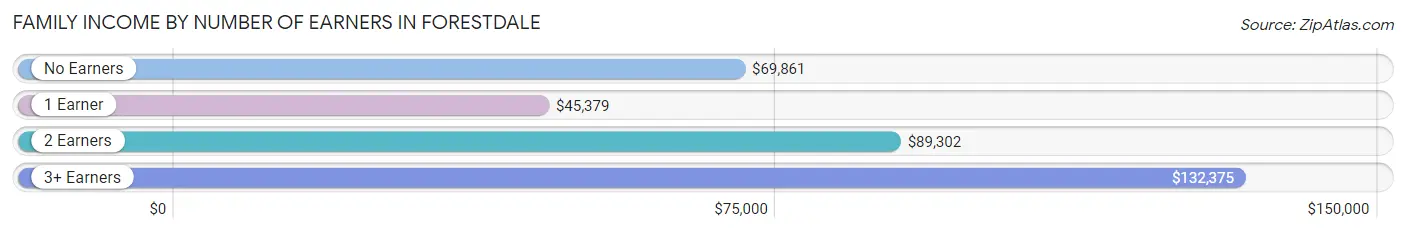
Family Income by Number of Earners in Forestdale
The median family income in Forestdale is $78,512, with families comprising 3+ earners (243) having the highest median family income of $132,375, while families with 1 earner (754) have the lowest median family income of $45,379, accounting for 10.0% and 31.0% of families, respectively.
| Number of Earners | # Families | Median Income |
| No Earners | 433 (17.8%) | $69,861 |
| 1 Earner | 754 (31.0%) | $45,379 |
| 2 Earners | 1,000 (41.1%) | $89,302 |
| 3+ Earners | 243 (10.0%) | $132,375 |
| Total | 2,430 (100.0%) | $78,512 |
Household Income in Forestdale
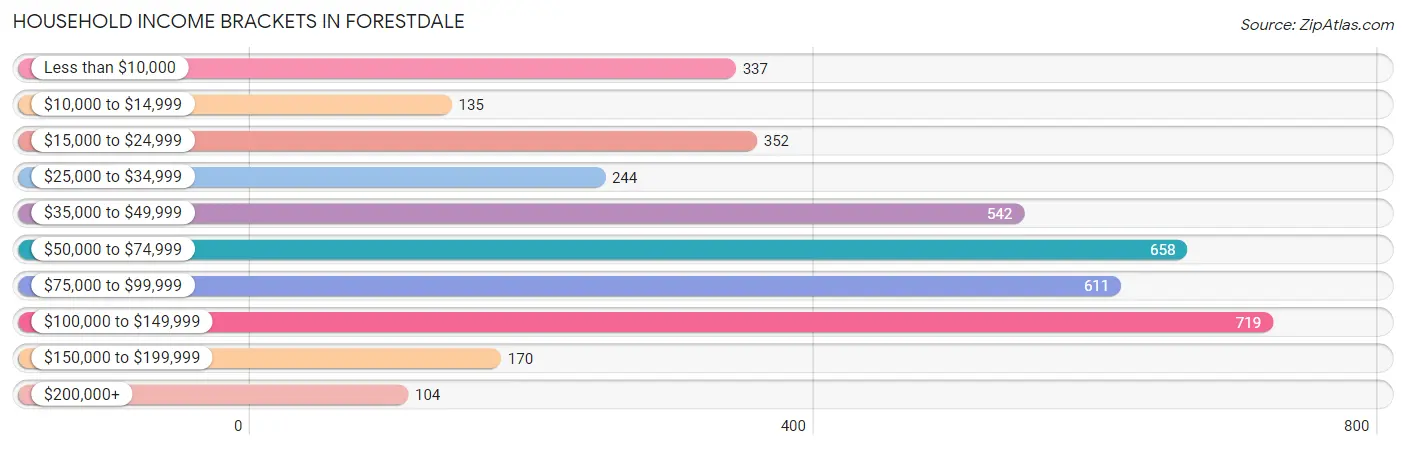
Household Income Brackets in Forestdale
With 719 households falling in the category, the $100,000 to $149,999 income range is the most frequent in Forestdale, accounting for 18.6% of all households. In contrast, only 104 households (2.7%) fall into the $200,000+ income bracket, making it the least populous group.
| Income Bracket | # Households | % Households |
| Less than $10,000 | 337 | 8.7% |
| $10,000 to $14,999 | 135 | 3.5% |
| $15,000 to $24,999 | 352 | 9.1% |
| $25,000 to $34,999 | 244 | 6.3% |
| $35,000 to $49,999 | 542 | 14.0% |
| $50,000 to $74,999 | 658 | 17.0% |
| $75,000 to $99,999 | 611 | 15.8% |
| $100,000 to $149,999 | 719 | 18.6% |
| $150,000 to $199,999 | 170 | 4.4% |
| $200,000+ | 104 | 2.7% |
Household Income by Householder Age in Forestdale
The median household income in Forestdale is $62,908, with the highest median household income of $91,119 found in the 45 to 64 years age bracket for the primary householder. A total of 1,346 households (34.8%) fall into this category. Meanwhile, the 15 to 24 years age bracket for the primary householder has the lowest median household income of $0, with 69 households (1.8%) in this group.
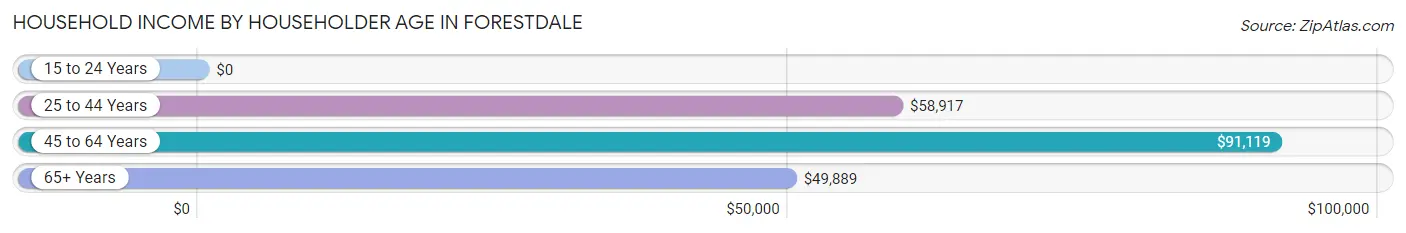
| Income Bracket | # Households | Median Income |
| 15 to 24 Years | 69 (1.8%) | $0 |
| 25 to 44 Years | 1,118 (28.9%) | $58,917 |
| 45 to 64 Years | 1,346 (34.8%) | $91,119 |
| 65+ Years | 1,335 (34.5%) | $49,889 |
| Total | 3,868 (100.0%) | $62,908 |
Poverty in Forestdale
Income Below Poverty by Sex and Age in Forestdale
With 13.2% poverty level for males and 18.8% for females among the residents of Forestdale, 6 to 11 year old males and under 5 year old females are the most vulnerable to poverty, with 83 males (40.9%) and 218 females (73.9%) in their respective age groups living below the poverty level.
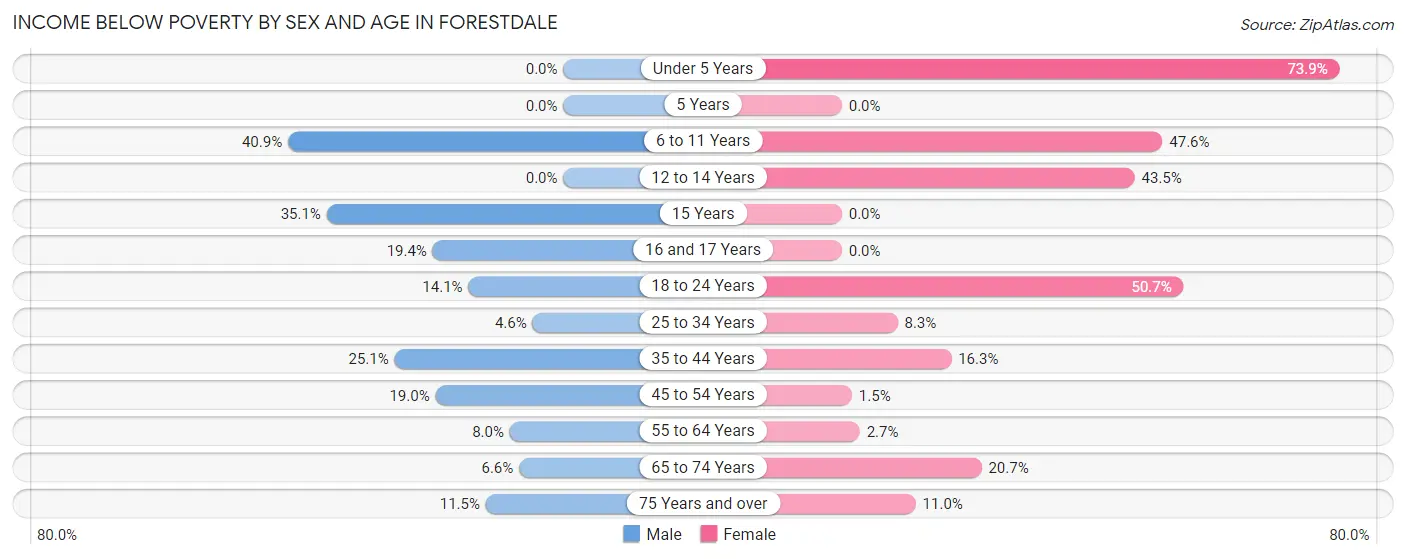
| Age Bracket | Male | Female |
| Under 5 Years | 0 (0.0%) | 218 (73.9%) |
| 5 Years | 0 (0.0%) | 0 (0.0%) |
| 6 to 11 Years | 83 (40.9%) | 159 (47.6%) |
| 12 to 14 Years | 0 (0.0%) | 40 (43.5%) |
| 15 Years | 39 (35.1%) | 0 (0.0%) |
| 16 and 17 Years | 39 (19.4%) | 0 (0.0%) |
| 18 to 24 Years | 75 (14.1%) | 69 (50.7%) |
| 25 to 34 Years | 29 (4.6%) | 56 (8.3%) |
| 35 to 44 Years | 93 (25.1%) | 118 (16.3%) |
| 45 to 54 Years | 83 (19.0%) | 7 (1.5%) |
| 55 to 64 Years | 64 (8.0%) | 18 (2.7%) |
| 65 to 74 Years | 36 (6.6%) | 156 (20.7%) |
| 75 Years and over | 25 (11.5%) | 53 (11.0%) |
| Total | 566 (13.2%) | 894 (18.8%) |
Income Above Poverty by Sex and Age in Forestdale
According to the poverty statistics in Forestdale, males aged under 5 years and females aged 16 and 17 years are the age groups that are most secure financially, with 100.0% of males and 100.0% of females in these age groups living above the poverty line.
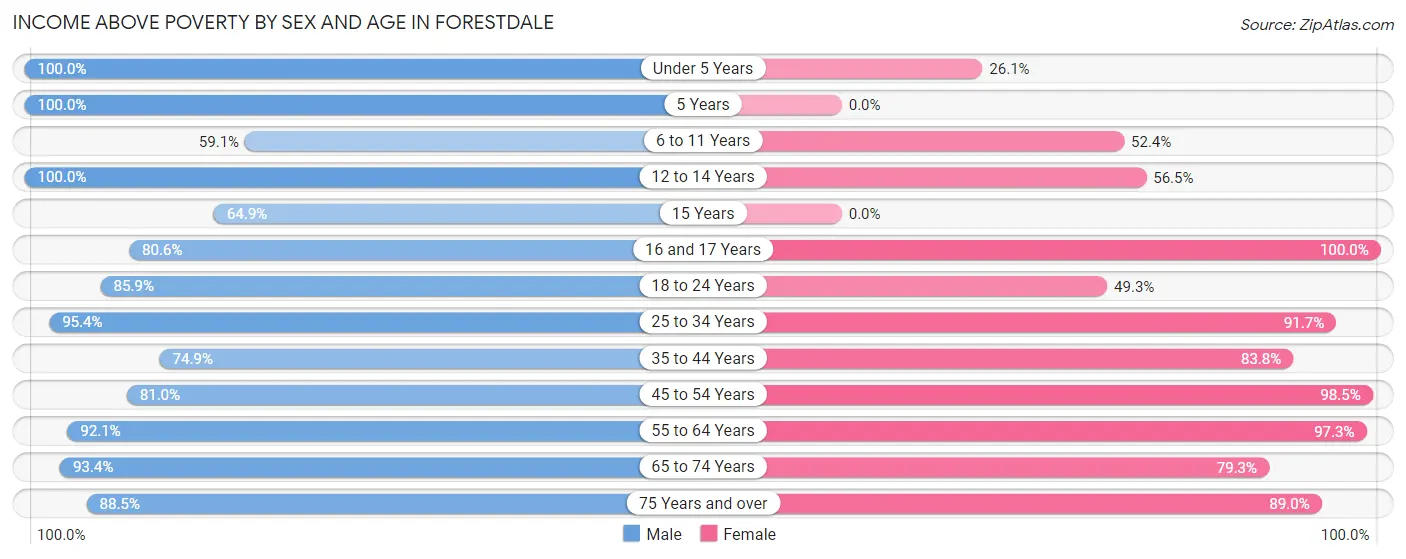
| Age Bracket | Male | Female |
| Under 5 Years | 102 (100.0%) | 77 (26.1%) |
| 5 Years | 33 (100.0%) | 0 (0.0%) |
| 6 to 11 Years | 120 (59.1%) | 175 (52.4%) |
| 12 to 14 Years | 85 (100.0%) | 52 (56.5%) |
| 15 Years | 72 (64.9%) | 0 (0.0%) |
| 16 and 17 Years | 162 (80.6%) | 127 (100.0%) |
| 18 to 24 Years | 457 (85.9%) | 67 (49.3%) |
| 25 to 34 Years | 606 (95.4%) | 620 (91.7%) |
| 35 to 44 Years | 278 (74.9%) | 608 (83.8%) |
| 45 to 54 Years | 354 (81.0%) | 461 (98.5%) |
| 55 to 64 Years | 741 (92.0%) | 659 (97.3%) |
| 65 to 74 Years | 512 (93.4%) | 596 (79.3%) |
| 75 Years and over | 192 (88.5%) | 430 (89.0%) |
| Total | 3,714 (86.8%) | 3,872 (81.2%) |
Income Below Poverty Among Married-Couple Families in Forestdale
The poverty statistics for married-couple families in Forestdale show that 2.1% or 29 of the total 1,374 families live below the poverty line. Families with 3 or 4 children have the highest poverty rate of 64.4%, comprising of 29 families. On the other hand, families with no children have the lowest poverty rate of 0.0%, which includes 0 families.
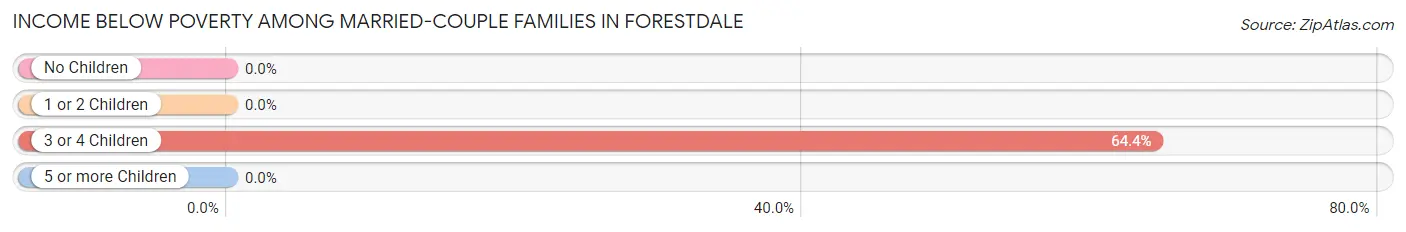
| Children | Above Poverty | Below Poverty |
| No Children | 975 (100.0%) | 0 (0.0%) |
| 1 or 2 Children | 354 (100.0%) | 0 (0.0%) |
| 3 or 4 Children | 16 (35.6%) | 29 (64.4%) |
| 5 or more Children | 0 (0.0%) | 0 (0.0%) |
| Total | 1,345 (97.9%) | 29 (2.1%) |
Income Below Poverty Among Single-Parent Households in Forestdale
According to the poverty data in Forestdale, 25.9% or 70 single-father households and 20.7% or 163 single-mother households are living below the poverty line. Among single-father households, those with no children have the highest poverty rate, with 70 households (37.0%) experiencing poverty. Likewise, among single-mother households, those with 3 or 4 children have the highest poverty rate, with 105 households (74.5%) falling below the poverty line.
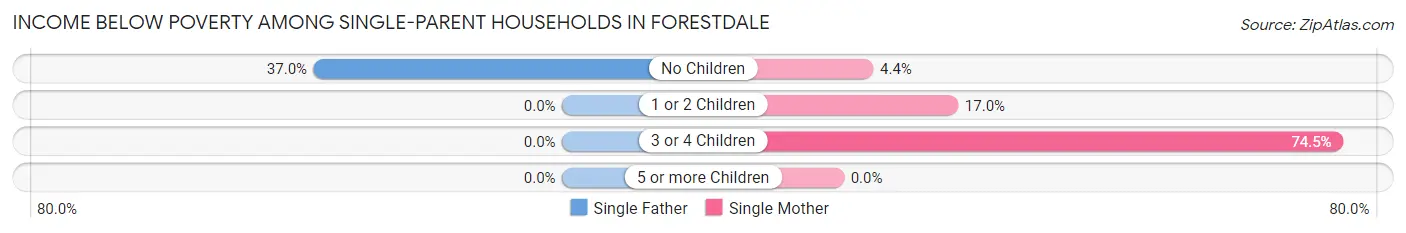
| Children | Single Father | Single Mother |
| No Children | 70 (37.0%) | 18 (4.4%) |
| 1 or 2 Children | 0 (0.0%) | 40 (17.0%) |
| 3 or 4 Children | 0 (0.0%) | 105 (74.5%) |
| 5 or more Children | 0 (0.0%) | 0 (0.0%) |
| Total | 70 (25.9%) | 163 (20.7%) |
Income Below Poverty Among Married-Couple vs Single-Parent Households in Forestdale
The poverty data for Forestdale shows that 29 of the married-couple family households (2.1%) and 233 of the single-parent households (22.1%) are living below the poverty level. Within the married-couple family households, those with 3 or 4 children have the highest poverty rate, with 29 households (64.4%) falling below the poverty line. Among the single-parent households, those with 3 or 4 children have the highest poverty rate, with 105 household (74.5%) living below poverty.
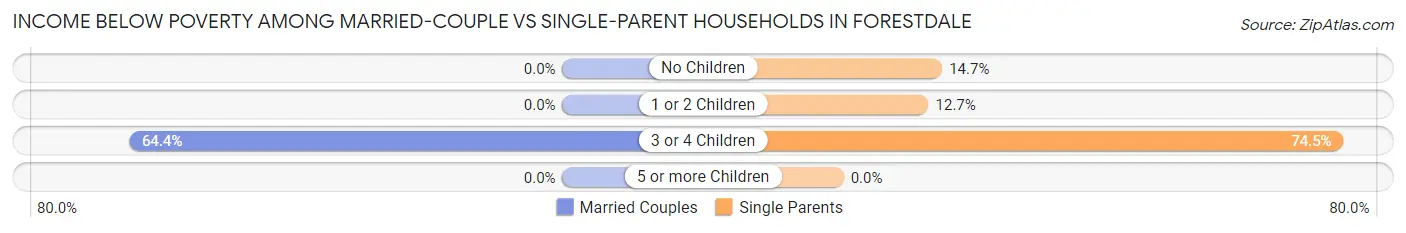
| Children | Married-Couple Families | Single-Parent Households |
| No Children | 0 (0.0%) | 88 (14.7%) |
| 1 or 2 Children | 0 (0.0%) | 40 (12.7%) |
| 3 or 4 Children | 29 (64.4%) | 105 (74.5%) |
| 5 or more Children | 0 (0.0%) | 0 (0.0%) |
| Total | 29 (2.1%) | 233 (22.1%) |
Race in Forestdale
The most populous races in Forestdale are Black / African American (6,975 | 76.3%), White / Caucasian (1,794 | 19.6%), and Two or more Races (225 | 2.5%).
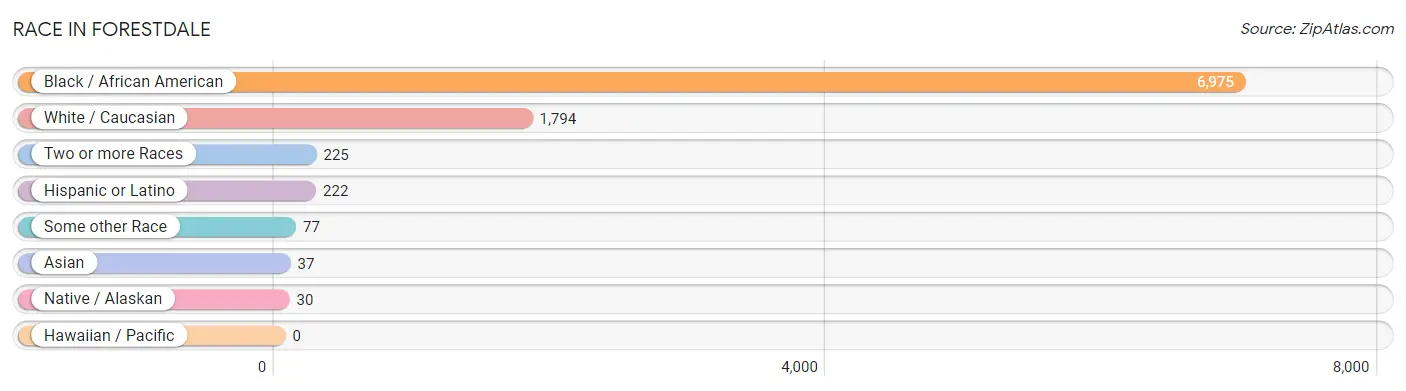
| Race | # Population | % Population |
| Asian | 37 | 0.4% |
| Black / African American | 6,975 | 76.3% |
| Hawaiian / Pacific | 0 | 0.0% |
| Hispanic or Latino | 222 | 2.4% |
| Native / Alaskan | 30 | 0.3% |
| White / Caucasian | 1,794 | 19.6% |
| Two or more Races | 225 | 2.5% |
| Some other Race | 77 | 0.8% |
| Total | 9,138 | 100.0% |
Ancestry in Forestdale
The most populous ancestries reported in Forestdale are American (815 | 8.9%), German (301 | 3.3%), English (283 | 3.1%), Irish (230 | 2.5%), and African (148 | 1.6%), together accounting for 19.5% of all Forestdale residents.
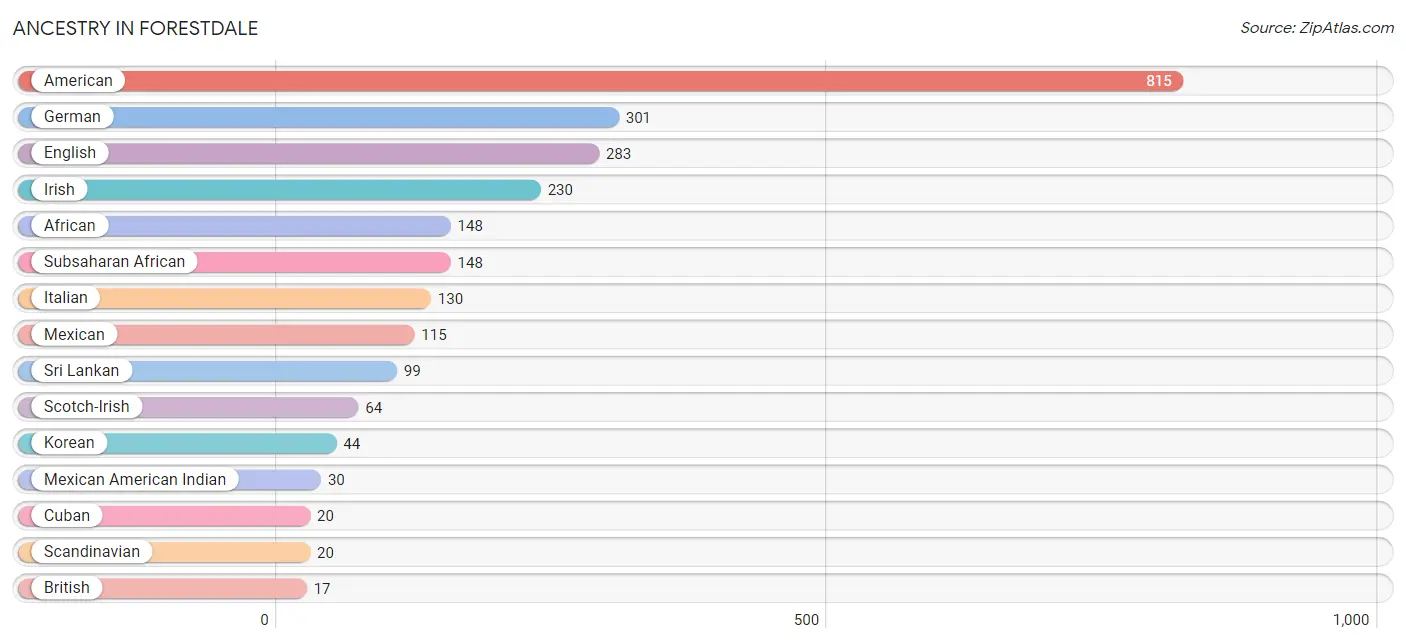
| Ancestry | # Population | % Population |
| African | 148 | 1.6% |
| American | 815 | 8.9% |
| Bhutanese | 6 | 0.1% |
| British | 17 | 0.2% |
| Cuban | 20 | 0.2% |
| Dutch | 8 | 0.1% |
| English | 283 | 3.1% |
| European | 8 | 0.1% |
| German | 301 | 3.3% |
| Irish | 230 | 2.5% |
| Italian | 130 | 1.4% |
| Korean | 44 | 0.5% |
| Mexican | 115 | 1.3% |
| Mexican American Indian | 30 | 0.3% |
| Scandinavian | 20 | 0.2% |
| Scotch-Irish | 64 | 0.7% |
| Slovak | 8 | 0.1% |
| Sri Lankan | 99 | 1.1% |
| Subsaharan African | 148 | 1.6% |
| Thai | 4 | 0.0% | View All 20 Rows |
Immigrants in Forestdale
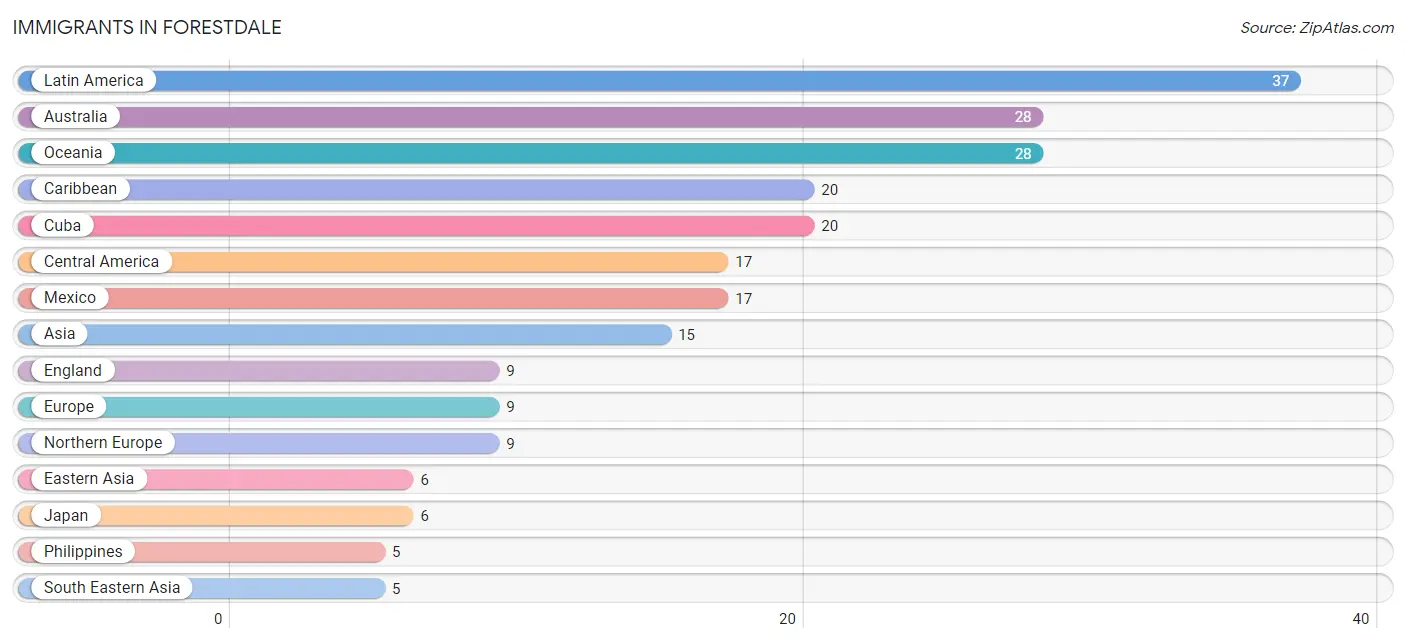
The most numerous immigrant groups reported in Forestdale came from Latin America (37 | 0.4%), Australia (28 | 0.3%), Oceania (28 | 0.3%), Caribbean (20 | 0.2%), and Cuba (20 | 0.2%), together accounting for 1.5% of all Forestdale residents.
| Immigration Origin | # Population | % Population |
| Asia | 15 | 0.2% |
| Australia | 28 | 0.3% |
| Caribbean | 20 | 0.2% |
| Central America | 17 | 0.2% |
| Cuba | 20 | 0.2% |
| Eastern Asia | 6 | 0.1% |
| England | 9 | 0.1% |
| Europe | 9 | 0.1% |
| India | 4 | 0.0% |
| Japan | 6 | 0.1% |
| Latin America | 37 | 0.4% |
| Mexico | 17 | 0.2% |
| Northern Europe | 9 | 0.1% |
| Oceania | 28 | 0.3% |
| Philippines | 5 | 0.1% |
| South Central Asia | 4 | 0.0% |
| South Eastern Asia | 5 | 0.1% | View All 17 Rows |
Sex and Age in Forestdale
Sex and Age in Forestdale
The most populous age groups in Forestdale are 15 to 19 Years (498 | 11.6%) for men and 65 to 69 Years (401 | 8.3%) for women.
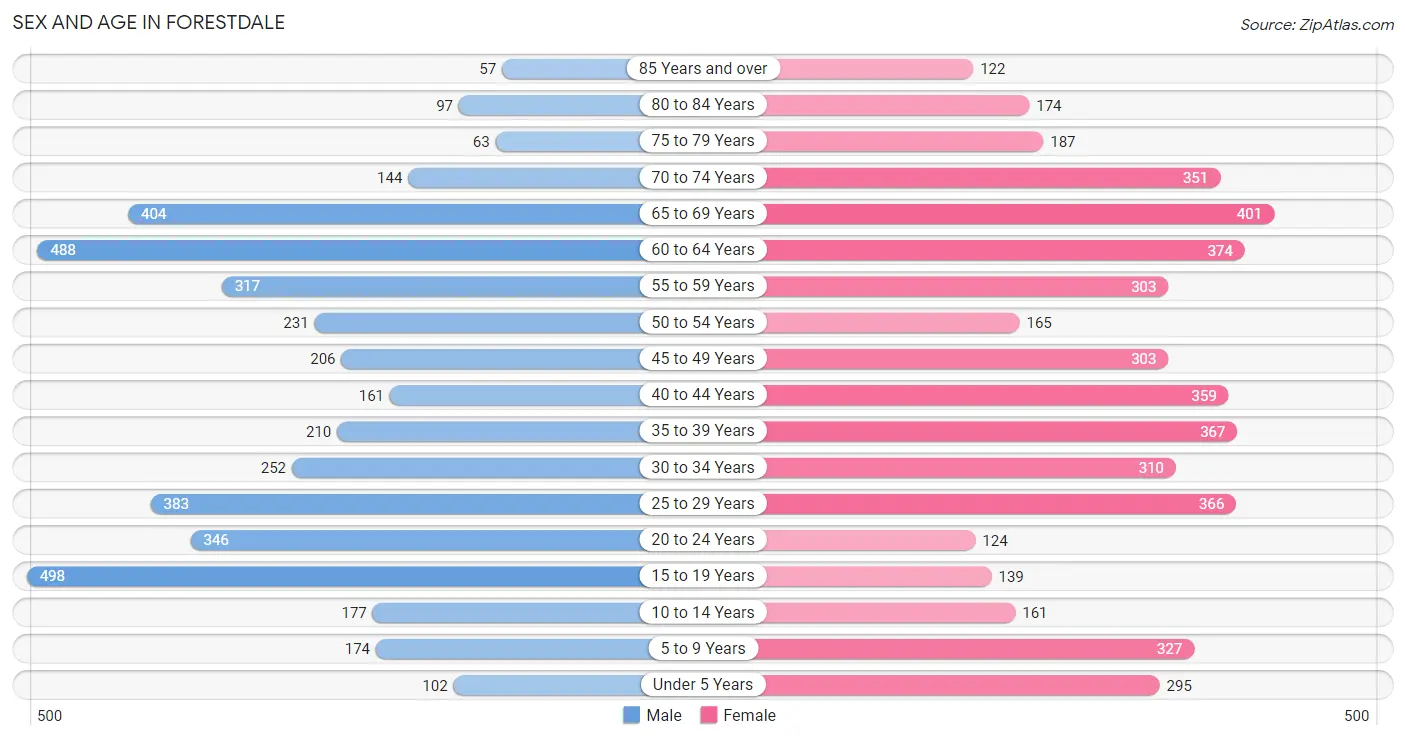
| Age Bracket | Male | Female |
| Under 5 Years | 102 (2.4%) | 295 (6.1%) |
| 5 to 9 Years | 174 (4.0%) | 327 (6.8%) |
| 10 to 14 Years | 177 (4.1%) | 161 (3.3%) |
| 15 to 19 Years | 498 (11.6%) | 139 (2.9%) |
| 20 to 24 Years | 346 (8.0%) | 124 (2.6%) |
| 25 to 29 Years | 383 (8.9%) | 366 (7.6%) |
| 30 to 34 Years | 252 (5.9%) | 310 (6.4%) |
| 35 to 39 Years | 210 (4.9%) | 367 (7.6%) |
| 40 to 44 Years | 161 (3.7%) | 359 (7.4%) |
| 45 to 49 Years | 206 (4.8%) | 303 (6.3%) |
| 50 to 54 Years | 231 (5.4%) | 165 (3.4%) |
| 55 to 59 Years | 317 (7.3%) | 303 (6.3%) |
| 60 to 64 Years | 488 (11.3%) | 374 (7.7%) |
| 65 to 69 Years | 404 (9.4%) | 401 (8.3%) |
| 70 to 74 Years | 144 (3.3%) | 351 (7.3%) |
| 75 to 79 Years | 63 (1.5%) | 187 (3.9%) |
| 80 to 84 Years | 97 (2.2%) | 174 (3.6%) |
| 85 Years and over | 57 (1.3%) | 122 (2.5%) |
| Total | 4,310 (100.0%) | 4,828 (100.0%) |
Families and Households in Forestdale
Median Family Size in Forestdale
The median family size in Forestdale is 2.99 persons per family, with single female/mother families (786 | 32.4%) accounting for the largest median family size of 3.46 persons per family. On the other hand, single male/father families (270 | 11.1%) represent the smallest median family size with 2.10 persons per family.
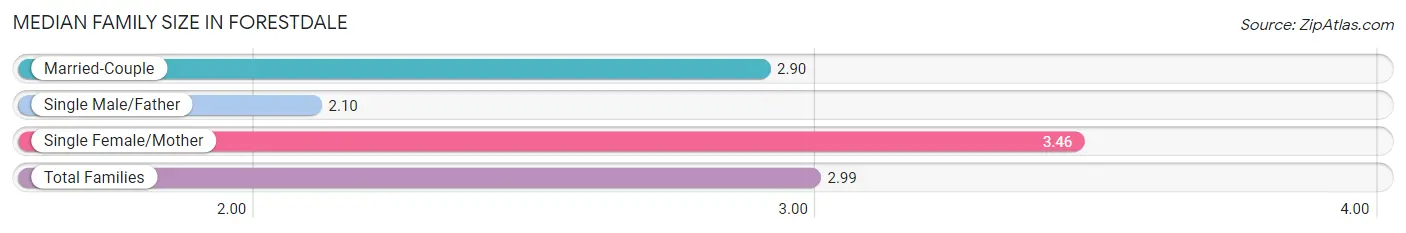
| Family Type | # Families | Family Size |
| Married-Couple | 1,374 (56.5%) | 2.90 |
| Single Male/Father | 270 (11.1%) | 2.10 |
| Single Female/Mother | 786 (32.4%) | 3.46 |
| Total Families | 2,430 (100.0%) | 2.99 |
Median Household Size in Forestdale
The median household size in Forestdale is 2.36 persons per household, with single female/mother households (786 | 20.3%) accounting for the largest median household size of 3.6 persons per household. non-family households (1,438 | 37.2%) represent the smallest median household size with 1.11 persons per household.
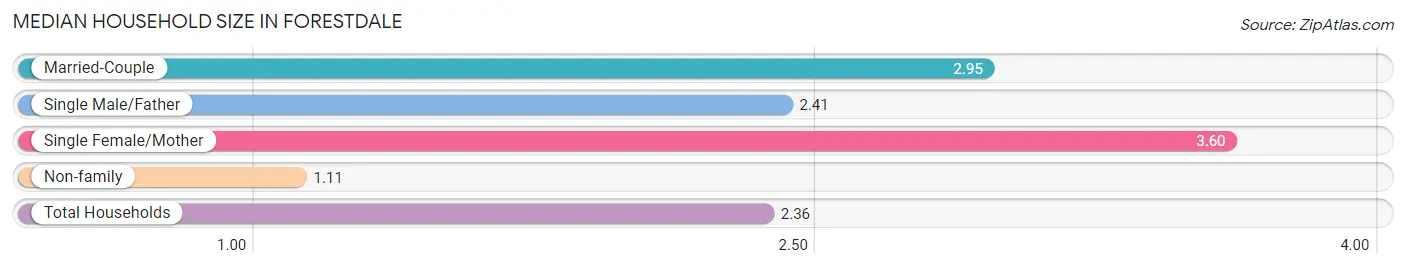
| Household Type | # Households | Household Size |
| Married-Couple | 1,374 (35.5%) | 2.95 |
| Single Male/Father | 270 (7.0%) | 2.41 |
| Single Female/Mother | 786 (20.3%) | 3.60 |
| Non-family | 1,438 (37.2%) | 1.11 |
| Total Households | 3,868 (100.0%) | 2.36 |
Household Size by Marriage Status in Forestdale
Out of a total of 3,868 households in Forestdale, 2,430 (62.8%) are family households, while 1,438 (37.2%) are nonfamily households. The most numerous type of family households are 2-person households, comprising 1,135, and the most common type of nonfamily households are 1-person households, comprising 1,299.
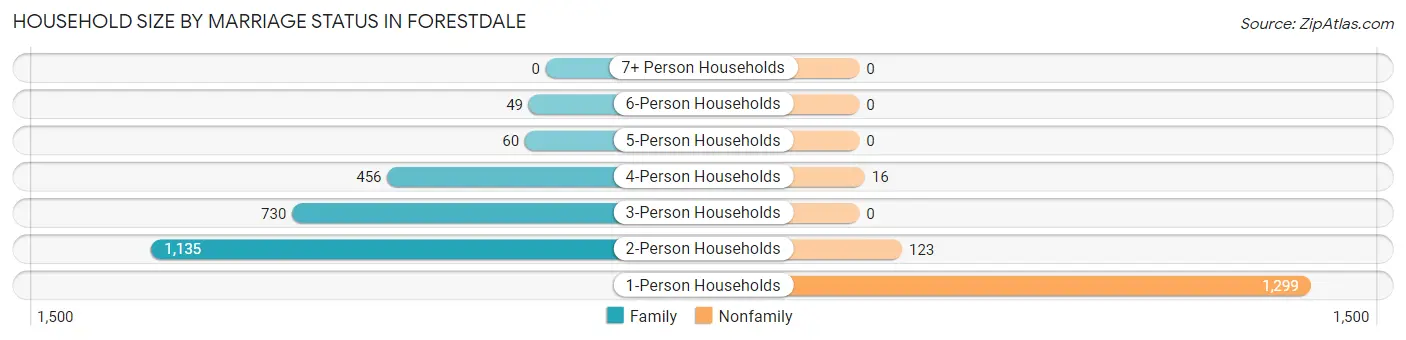
| Household Size | Family Households | Nonfamily Households |
| 1-Person Households | - | 1,299 (33.6%) |
| 2-Person Households | 1,135 (29.3%) | 123 (3.2%) |
| 3-Person Households | 730 (18.9%) | 0 (0.0%) |
| 4-Person Households | 456 (11.8%) | 16 (0.4%) |
| 5-Person Households | 60 (1.5%) | 0 (0.0%) |
| 6-Person Households | 49 (1.3%) | 0 (0.0%) |
| 7+ Person Households | 0 (0.0%) | 0 (0.0%) |
| Total | 2,430 (62.8%) | 1,438 (37.2%) |
Female Fertility in Forestdale
Fertility by Age in Forestdale
Average fertility rate in Forestdale is 19.0 births per 1,000 women. Women in the age bracket of 20 to 34 years have the highest fertility rate with 35.0 births per 1,000 women. Women in the age bracket of 20 to 34 years acount for 73.7% of all women with births.
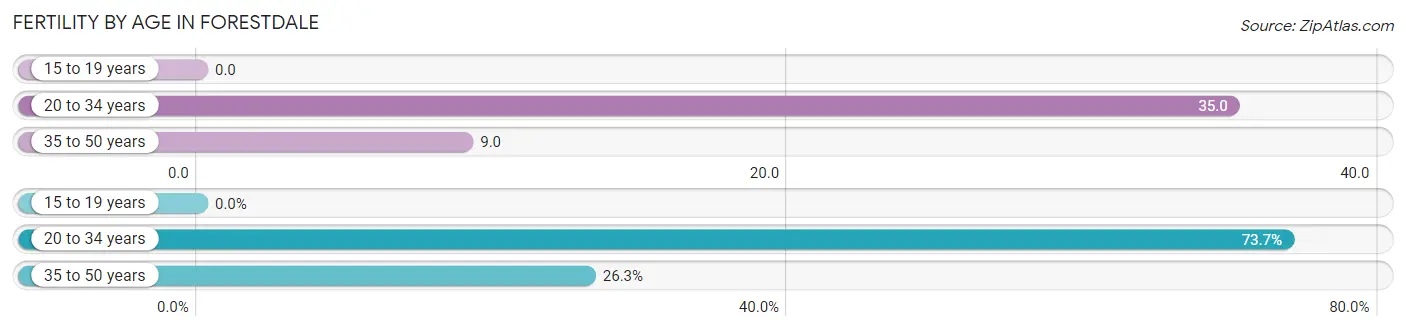
| Age Bracket | Women with Births | Births / 1,000 Women |
| 15 to 19 years | 0 (0.0%) | 0.0 |
| 20 to 34 years | 28 (73.7%) | 35.0 |
| 35 to 50 years | 10 (26.3%) | 9.0 |
| Total | 38 (100.0%) | 19.0 |
Fertility by Age by Marriage Status in Forestdale
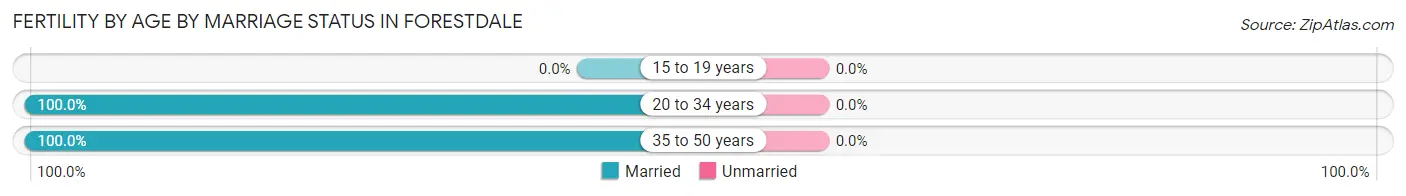
| Age Bracket | Married | Unmarried |
| 15 to 19 years | 0 (0.0%) | 0 (0.0%) |
| 20 to 34 years | 28 (100.0%) | 0 (0.0%) |
| 35 to 50 years | 10 (100.0%) | 0 (0.0%) |
| Total | 38 (100.0%) | 0 (0.0%) |
Fertility by Education in Forestdale
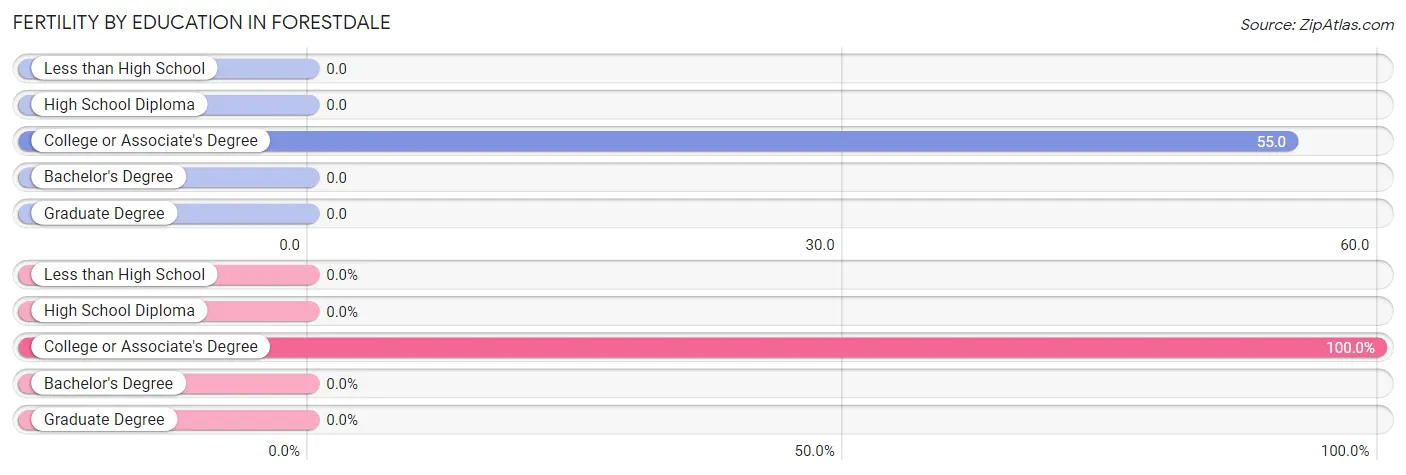
| Educational Attainment | Women with Births | Births / 1,000 Women |
| Less than High School | 0 (0.0%) | 0.0 |
| High School Diploma | 0 (0.0%) | 0.0 |
| College or Associate's Degree | 38 (100.0%) | 55.0 |
| Bachelor's Degree | 0 (0.0%) | 0.0 |
| Graduate Degree | 0 (0.0%) | 0.0 |
| Total | 38 (100.0%) | 19.0 |
Fertility by Education by Marriage Status in Forestdale
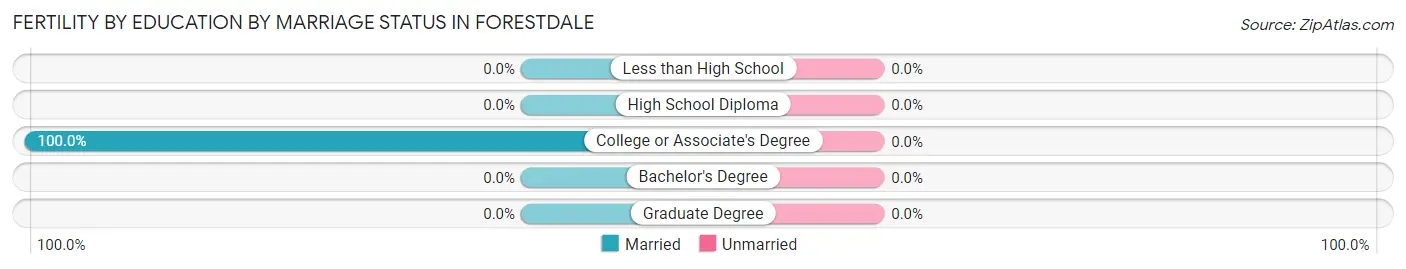
| Educational Attainment | Married | Unmarried |
| Less than High School | 0 (0.0%) | 0 (0.0%) |
| High School Diploma | 0 (0.0%) | 0 (0.0%) |
| College or Associate's Degree | 38 (100.0%) | 0 (0.0%) |
| Bachelor's Degree | 0 (0.0%) | 0 (0.0%) |
| Graduate Degree | 0 (0.0%) | 0 (0.0%) |
| Total | 38 (100.0%) | 0 (0.0%) |
Employment Characteristics in Forestdale
Employment by Class of Employer in Forestdale
Among the 4,558 employed individuals in Forestdale, private company employees (2,958 | 64.9%), not-for-profit organizations (461 | 10.1%), and local government employees (373 | 8.2%) make up the most common classes of employment.
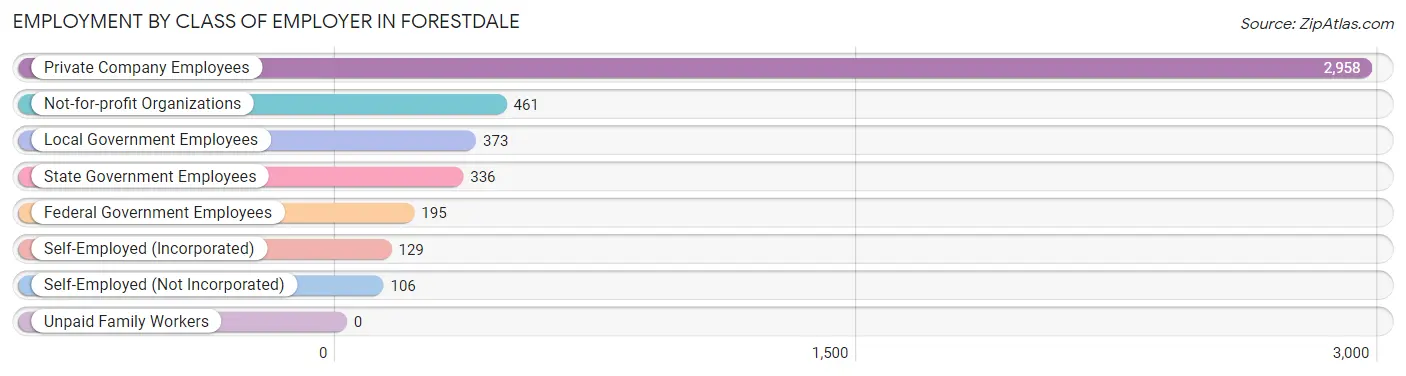
| Employer Class | # Employees | % Employees |
| Private Company Employees | 2,958 | 64.9% |
| Self-Employed (Incorporated) | 129 | 2.8% |
| Self-Employed (Not Incorporated) | 106 | 2.3% |
| Not-for-profit Organizations | 461 | 10.1% |
| Local Government Employees | 373 | 8.2% |
| State Government Employees | 336 | 7.4% |
| Federal Government Employees | 195 | 4.3% |
| Unpaid Family Workers | 0 | 0.0% |
| Total | 4,558 | 100.0% |
Employment Status by Age in Forestdale
According to the labor force statistics for Forestdale, out of the total population over 16 years of age (7,791), 64.8% or 5,049 individuals are in the labor force, with 8.4% or 424 of them unemployed. The age group with the highest labor force participation rate is 25 to 29 years, with 100.0% or 749 individuals in the labor force. Within the labor force, the 16 to 19 years age range has the highest percentage of unemployed individuals, with 64.1% or 127 of them being unemployed.
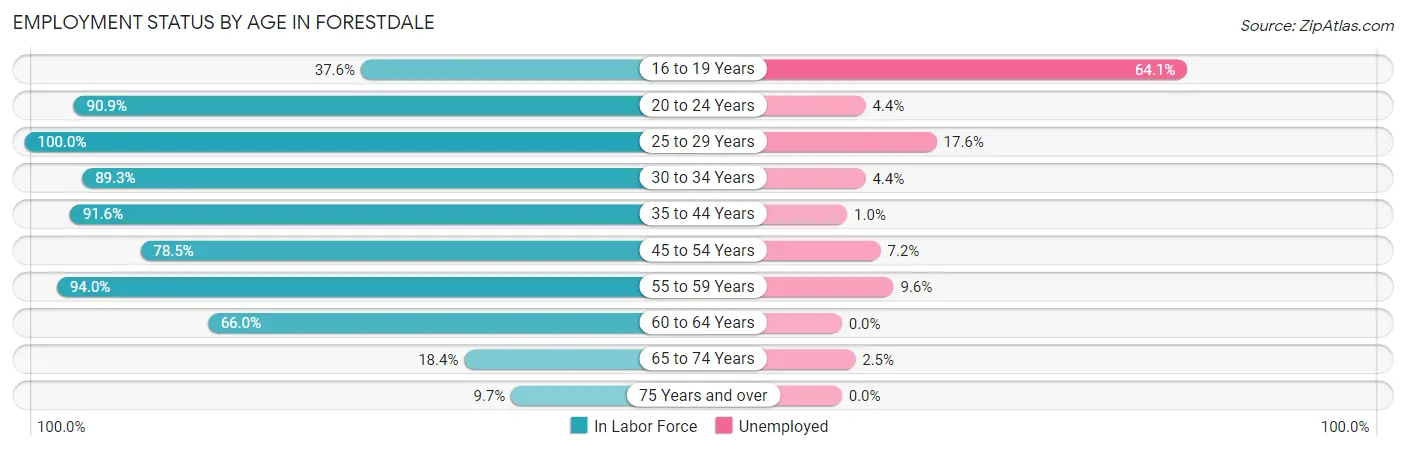
| Age Bracket | In Labor Force | Unemployed |
| 16 to 19 Years | 198 (37.6%) | 127 (64.1%) |
| 20 to 24 Years | 427 (90.9%) | 19 (4.4%) |
| 25 to 29 Years | 749 (100.0%) | 132 (17.6%) |
| 30 to 34 Years | 502 (89.3%) | 22 (4.4%) |
| 35 to 44 Years | 1,005 (91.6%) | 10 (1.0%) |
| 45 to 54 Years | 710 (78.5%) | 51 (7.2%) |
| 55 to 59 Years | 583 (94.0%) | 56 (9.6%) |
| 60 to 64 Years | 569 (66.0%) | 0 (0.0%) |
| 65 to 74 Years | 239 (18.4%) | 6 (2.5%) |
| 75 Years and over | 68 (9.7%) | 0 (0.0%) |
| Total | 5,049 (64.8%) | 424 (8.4%) |
Employment Status by Educational Attainment in Forestdale
According to labor force statistics for Forestdale, 85.9% of individuals (4,119) out of the total population between 25 and 64 years of age (4,795) are in the labor force, with 6.6% or 272 of them being unemployed. The group with the highest labor force participation rate are those with the educational attainment of bachelor's degree or higher, with 93.3% or 1,246 individuals in the labor force. Within the labor force, individuals with less than high school education have the highest percentage of unemployment, with 77.9% or 148 of them being unemployed.
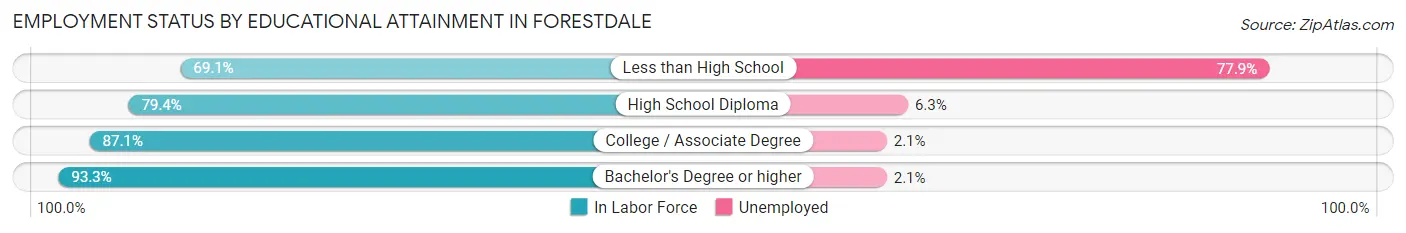
| Educational Attainment | In Labor Force | Unemployed |
| Less than High School | 190 (69.1%) | 214 (77.9%) |
| High School Diploma | 962 (79.4%) | 76 (6.3%) |
| College / Associate Degree | 1,719 (87.1%) | 41 (2.1%) |
| Bachelor's Degree or higher | 1,246 (93.3%) | 28 (2.1%) |
| Total | 4,119 (85.9%) | 316 (6.6%) |
Employment Occupations by Sex in Forestdale
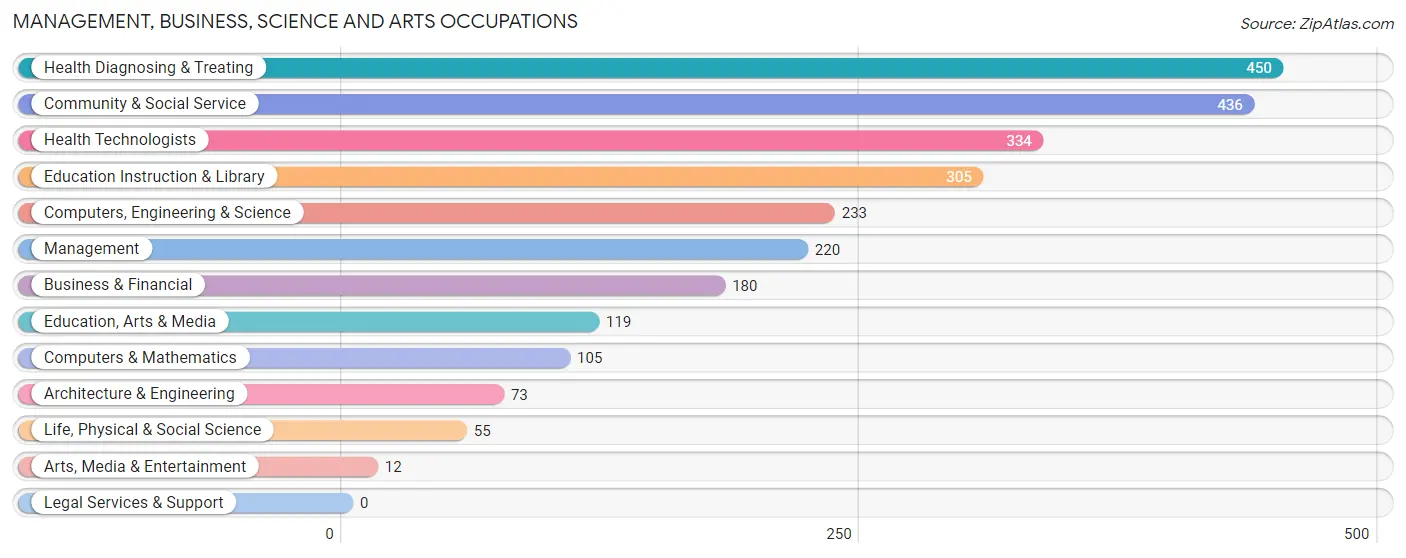
Management, Business, Science and Arts Occupations
The most common Management, Business, Science and Arts occupations in Forestdale are Health Diagnosing & Treating (450 | 9.7%), Community & Social Service (436 | 9.4%), Health Technologists (334 | 7.2%), Education Instruction & Library (305 | 6.6%), and Computers, Engineering & Science (233 | 5.0%).
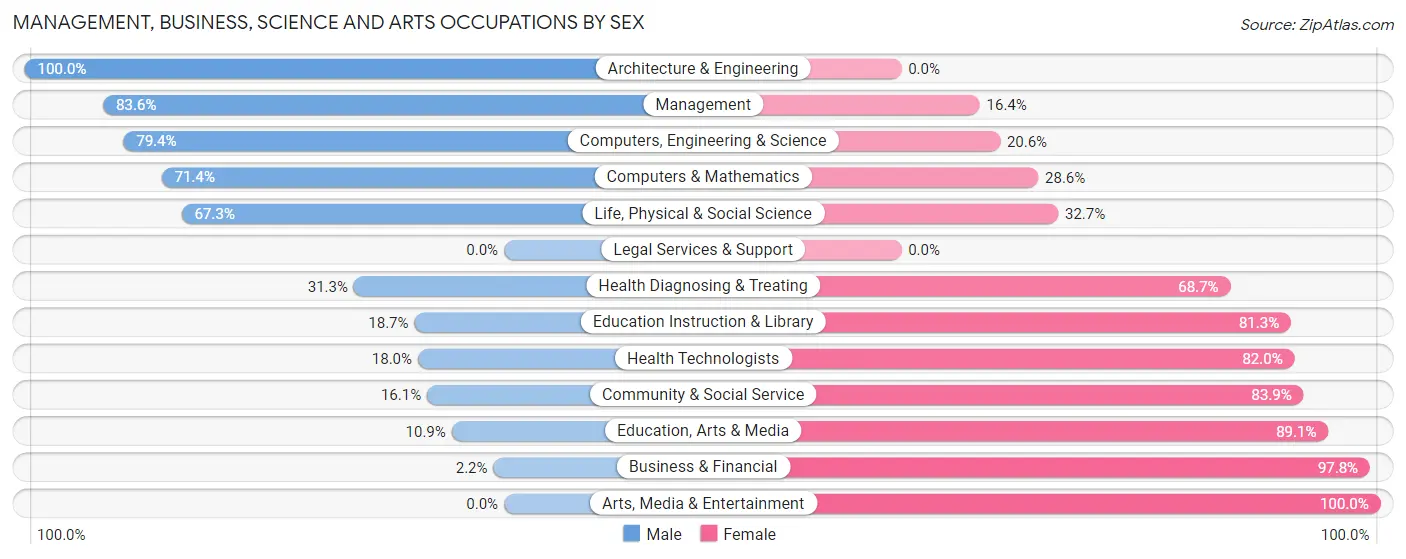
Management, Business, Science and Arts Occupations by Sex
Within the Management, Business, Science and Arts occupations in Forestdale, the most male-oriented occupations are Architecture & Engineering (100.0%), Management (83.6%), and Computers, Engineering & Science (79.4%), while the most female-oriented occupations are Arts, Media & Entertainment (100.0%), Business & Financial (97.8%), and Education, Arts & Media (89.1%).
| Occupation | Male | Female |
| Management | 184 (83.6%) | 36 (16.4%) |
| Business & Financial | 4 (2.2%) | 176 (97.8%) |
| Computers, Engineering & Science | 185 (79.4%) | 48 (20.6%) |
| Computers & Mathematics | 75 (71.4%) | 30 (28.6%) |
| Architecture & Engineering | 73 (100.0%) | 0 (0.0%) |
| Life, Physical & Social Science | 37 (67.3%) | 18 (32.7%) |
| Community & Social Service | 70 (16.1%) | 366 (83.9%) |
| Education, Arts & Media | 13 (10.9%) | 106 (89.1%) |
| Legal Services & Support | 0 (0.0%) | 0 (0.0%) |
| Education Instruction & Library | 57 (18.7%) | 248 (81.3%) |
| Arts, Media & Entertainment | 0 (0.0%) | 12 (100.0%) |
| Health Diagnosing & Treating | 141 (31.3%) | 309 (68.7%) |
| Health Technologists | 60 (18.0%) | 274 (82.0%) |
| Total (Category) | 584 (38.5%) | 935 (61.6%) |
| Total (Overall) | 2,235 (48.3%) | 2,392 (51.7%) |
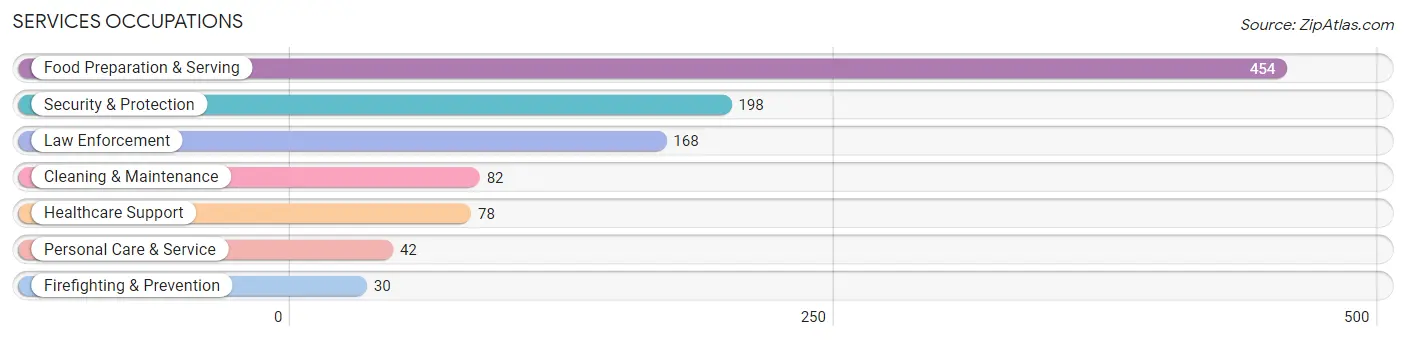
Services Occupations
The most common Services occupations in Forestdale are Food Preparation & Serving (454 | 9.8%), Security & Protection (198 | 4.3%), Law Enforcement (168 | 3.6%), Cleaning & Maintenance (82 | 1.8%), and Healthcare Support (78 | 1.7%).
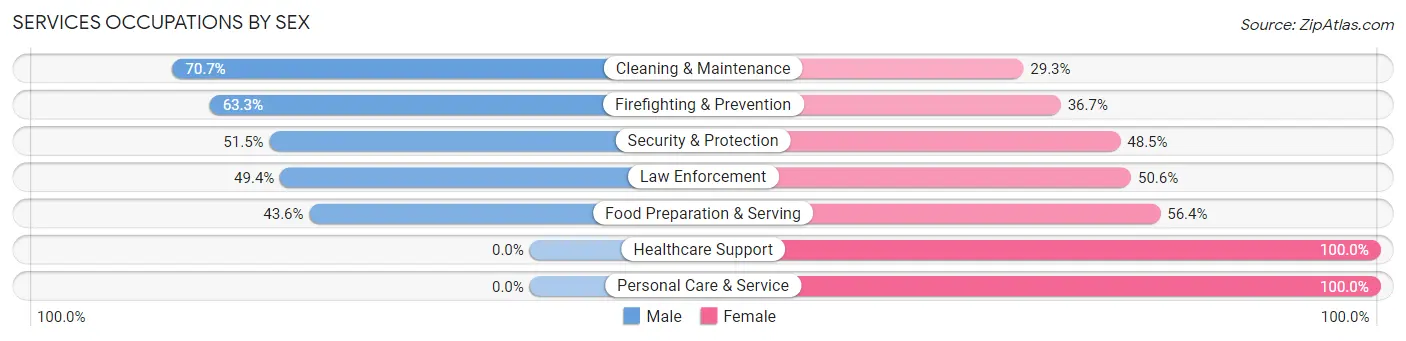
Services Occupations by Sex
Within the Services occupations in Forestdale, the most male-oriented occupations are Cleaning & Maintenance (70.7%), Firefighting & Prevention (63.3%), and Security & Protection (51.5%), while the most female-oriented occupations are Healthcare Support (100.0%), Personal Care & Service (100.0%), and Food Preparation & Serving (56.4%).
| Occupation | Male | Female |
| Healthcare Support | 0 (0.0%) | 78 (100.0%) |
| Security & Protection | 102 (51.5%) | 96 (48.5%) |
| Firefighting & Prevention | 19 (63.3%) | 11 (36.7%) |
| Law Enforcement | 83 (49.4%) | 85 (50.6%) |
| Food Preparation & Serving | 198 (43.6%) | 256 (56.4%) |
| Cleaning & Maintenance | 58 (70.7%) | 24 (29.3%) |
| Personal Care & Service | 0 (0.0%) | 42 (100.0%) |
| Total (Category) | 358 (41.9%) | 496 (58.1%) |
| Total (Overall) | 2,235 (48.3%) | 2,392 (51.7%) |
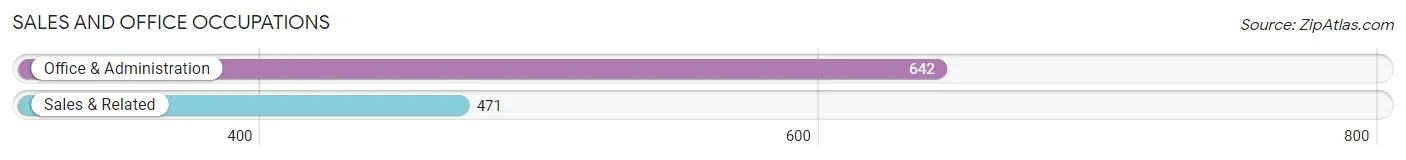
Sales and Office Occupations
The most common Sales and Office occupations in Forestdale are Office & Administration (642 | 13.9%), and Sales & Related (471 | 10.2%).
Sales and Office Occupations by Sex
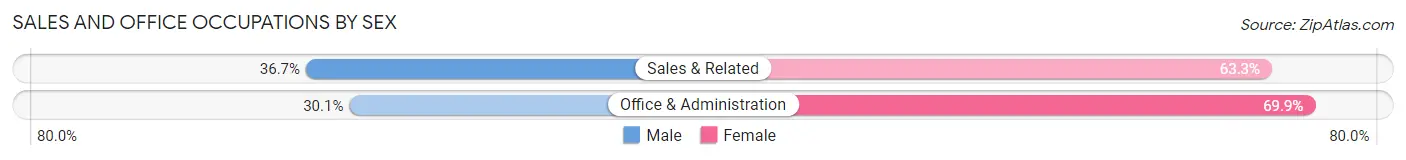
| Occupation | Male | Female |
| Sales & Related | 173 (36.7%) | 298 (63.3%) |
| Office & Administration | 193 (30.1%) | 449 (69.9%) |
| Total (Category) | 366 (32.9%) | 747 (67.1%) |
| Total (Overall) | 2,235 (48.3%) | 2,392 (51.7%) |
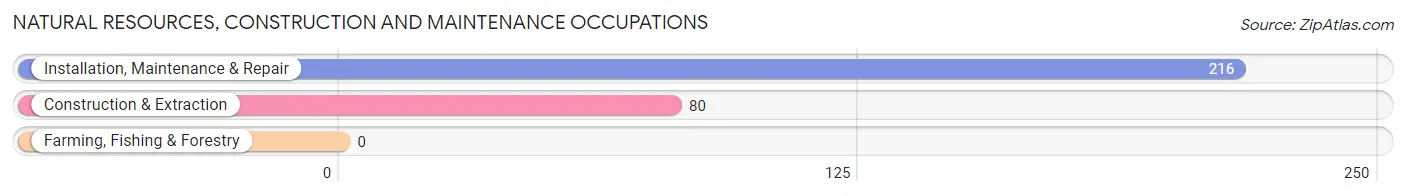
Natural Resources, Construction and Maintenance Occupations
The most common Natural Resources, Construction and Maintenance occupations in Forestdale are Installation, Maintenance & Repair (216 | 4.7%), and Construction & Extraction (80 | 1.7%).
Natural Resources, Construction and Maintenance Occupations by Sex
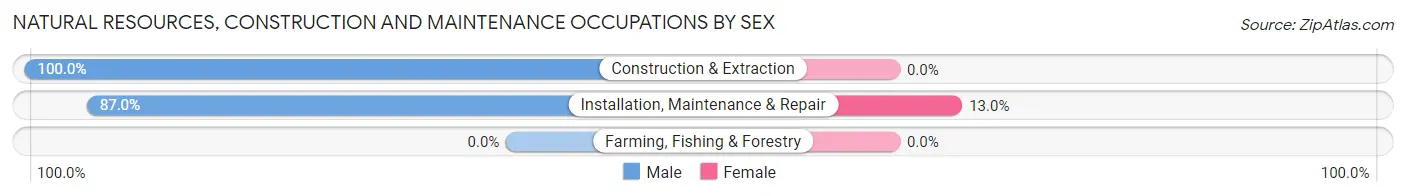
| Occupation | Male | Female |
| Farming, Fishing & Forestry | 0 (0.0%) | 0 (0.0%) |
| Construction & Extraction | 80 (100.0%) | 0 (0.0%) |
| Installation, Maintenance & Repair | 188 (87.0%) | 28 (13.0%) |
| Total (Category) | 268 (90.5%) | 28 (9.5%) |
| Total (Overall) | 2,235 (48.3%) | 2,392 (51.7%) |
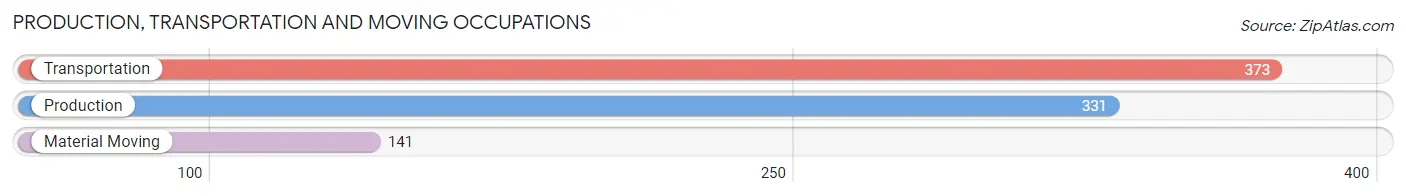
Production, Transportation and Moving Occupations
The most common Production, Transportation and Moving occupations in Forestdale are Transportation (373 | 8.1%), Production (331 | 7.1%), and Material Moving (141 | 3.0%).
Production, Transportation and Moving Occupations by Sex
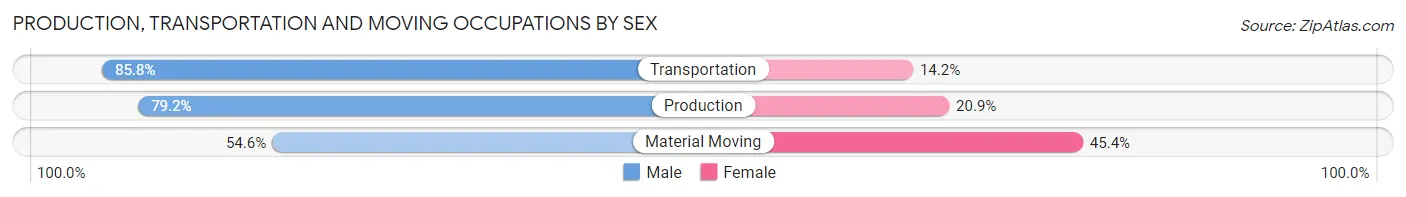
| Occupation | Male | Female |
| Production | 262 (79.1%) | 69 (20.8%) |
| Transportation | 320 (85.8%) | 53 (14.2%) |
| Material Moving | 77 (54.6%) | 64 (45.4%) |
| Total (Category) | 659 (78.0%) | 186 (22.0%) |
| Total (Overall) | 2,235 (48.3%) | 2,392 (51.7%) |
Employment Industries by Sex in Forestdale
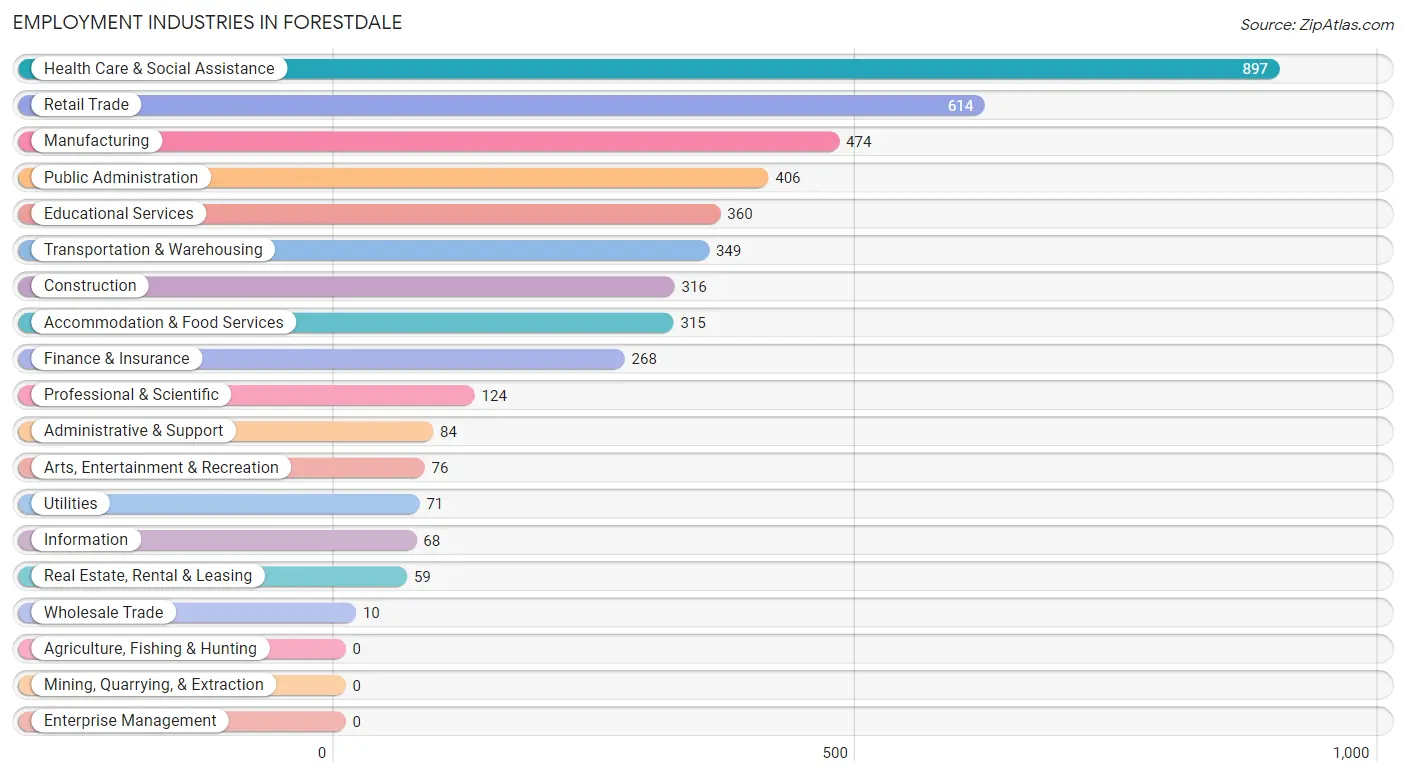
Employment Industries in Forestdale
The major employment industries in Forestdale include Health Care & Social Assistance (897 | 19.4%), Retail Trade (614 | 13.3%), Manufacturing (474 | 10.2%), Public Administration (406 | 8.8%), and Educational Services (360 | 7.8%).
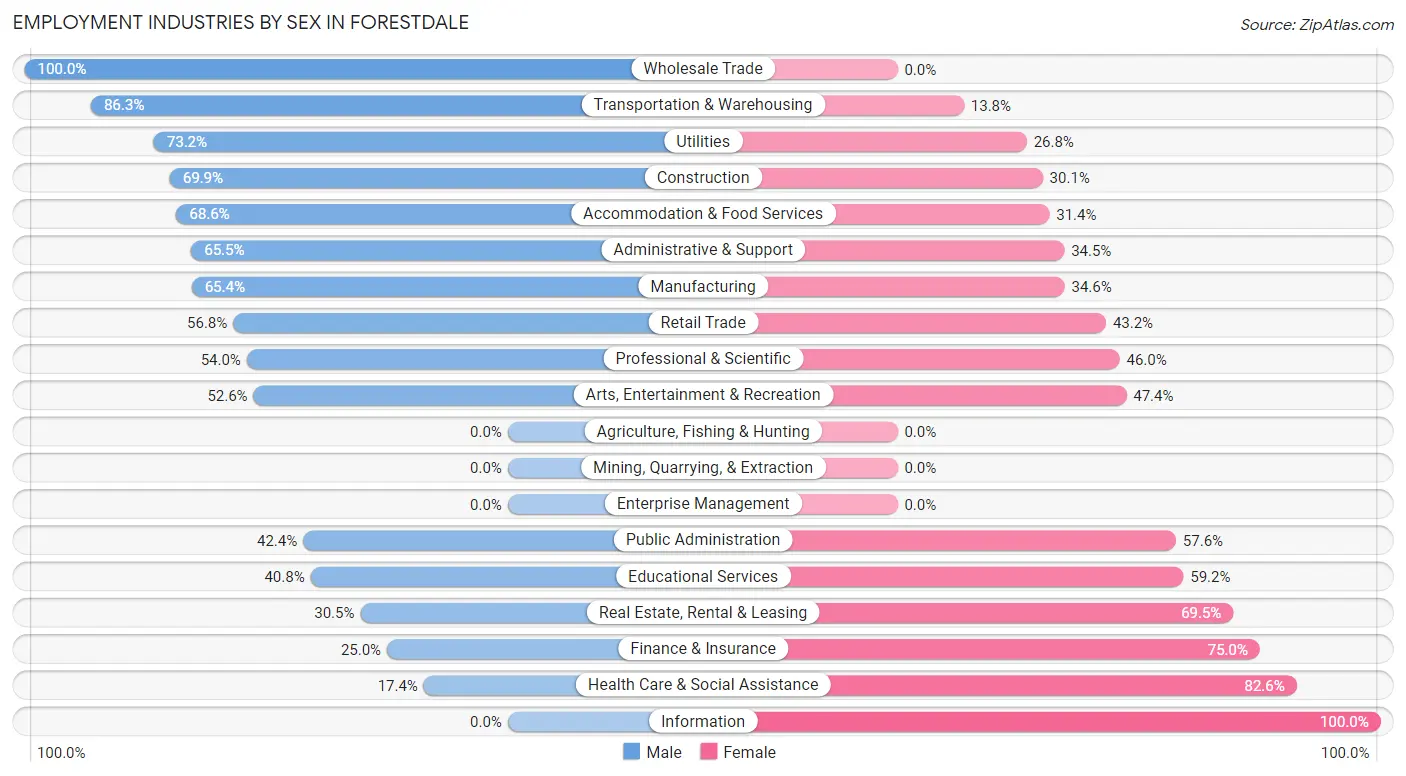
Employment Industries by Sex in Forestdale
The Forestdale industries that see more men than women are Wholesale Trade (100.0%), Transportation & Warehousing (86.3%), and Utilities (73.2%), whereas the industries that tend to have a higher number of women are Information (100.0%), Health Care & Social Assistance (82.6%), and Finance & Insurance (75.0%).
| Industry | Male | Female |
| Agriculture, Fishing & Hunting | 0 (0.0%) | 0 (0.0%) |
| Mining, Quarrying, & Extraction | 0 (0.0%) | 0 (0.0%) |
| Construction | 221 (69.9%) | 95 (30.1%) |
| Manufacturing | 310 (65.4%) | 164 (34.6%) |
| Wholesale Trade | 10 (100.0%) | 0 (0.0%) |
| Retail Trade | 349 (56.8%) | 265 (43.2%) |
| Transportation & Warehousing | 301 (86.3%) | 48 (13.8%) |
| Utilities | 52 (73.2%) | 19 (26.8%) |
| Information | 0 (0.0%) | 68 (100.0%) |
| Finance & Insurance | 67 (25.0%) | 201 (75.0%) |
| Real Estate, Rental & Leasing | 18 (30.5%) | 41 (69.5%) |
| Professional & Scientific | 67 (54.0%) | 57 (46.0%) |
| Enterprise Management | 0 (0.0%) | 0 (0.0%) |
| Administrative & Support | 55 (65.5%) | 29 (34.5%) |
| Educational Services | 147 (40.8%) | 213 (59.2%) |
| Health Care & Social Assistance | 156 (17.4%) | 741 (82.6%) |
| Arts, Entertainment & Recreation | 40 (52.6%) | 36 (47.4%) |
| Accommodation & Food Services | 216 (68.6%) | 99 (31.4%) |
| Public Administration | 172 (42.4%) | 234 (57.6%) |
| Total | 2,235 (48.3%) | 2,392 (51.7%) |
Education in Forestdale
School Enrollment in Forestdale
The most common levels of schooling among the 2,022 students in Forestdale are high school (486 | 24.0%), college / undergraduate (397 | 19.6%), and elementary school (388 | 19.2%).
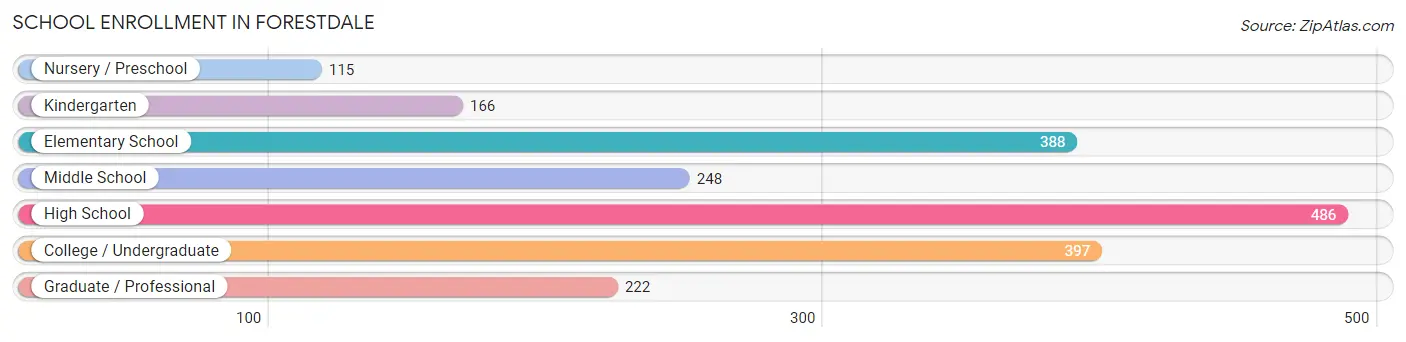
| School Level | # Students | % Students |
| Nursery / Preschool | 115 | 5.7% |
| Kindergarten | 166 | 8.2% |
| Elementary School | 388 | 19.2% |
| Middle School | 248 | 12.3% |
| High School | 486 | 24.0% |
| College / Undergraduate | 397 | 19.6% |
| Graduate / Professional | 222 | 11.0% |
| Total | 2,022 | 100.0% |
School Enrollment by Age by Funding Source in Forestdale
Out of a total of 2,022 students who are enrolled in schools in Forestdale, 210 (10.4%) attend a private institution, while the remaining 1,812 (89.6%) are enrolled in public schools. The age group of 35 years and over has the highest likelihood of being enrolled in private schools, with 125 (44.6% in the age bracket) enrolled. Conversely, the age group of 5 to 9 year old has the lowest likelihood of being enrolled in a private school, with 501 (100.0% in the age bracket) attending a public institution.
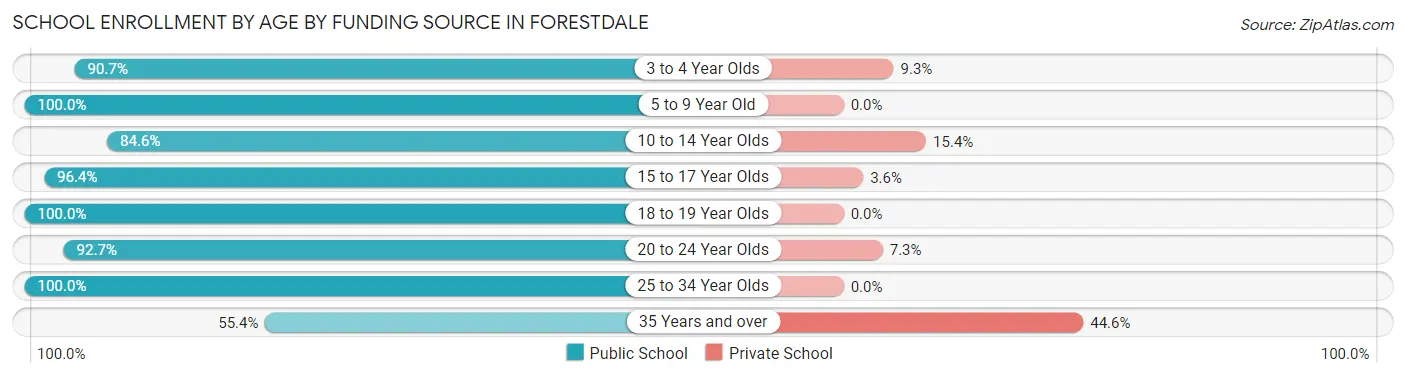
| Age Bracket | Public School | Private School |
| 3 to 4 Year Olds | 117 (90.7%) | 12 (9.3%) |
| 5 to 9 Year Old | 501 (100.0%) | 0 (0.0%) |
| 10 to 14 Year Olds | 259 (84.6%) | 47 (15.4%) |
| 15 to 17 Year Olds | 423 (96.4%) | 16 (3.6%) |
| 18 to 19 Year Olds | 40 (100.0%) | 0 (0.0%) |
| 20 to 24 Year Olds | 140 (92.7%) | 11 (7.3%) |
| 25 to 34 Year Olds | 176 (100.0%) | 0 (0.0%) |
| 35 Years and over | 155 (55.4%) | 125 (44.6%) |
| Total | 1,812 (89.6%) | 210 (10.4%) |
Educational Attainment by Field of Study in Forestdale
Education (470 | 22.2%), business (381 | 17.9%), science & technology (346 | 16.3%), psychology (256 | 12.1%), and arts & humanities (205 | 9.7%) are the most common fields of study among 2,122 individuals in Forestdale who have obtained a bachelor's degree or higher.
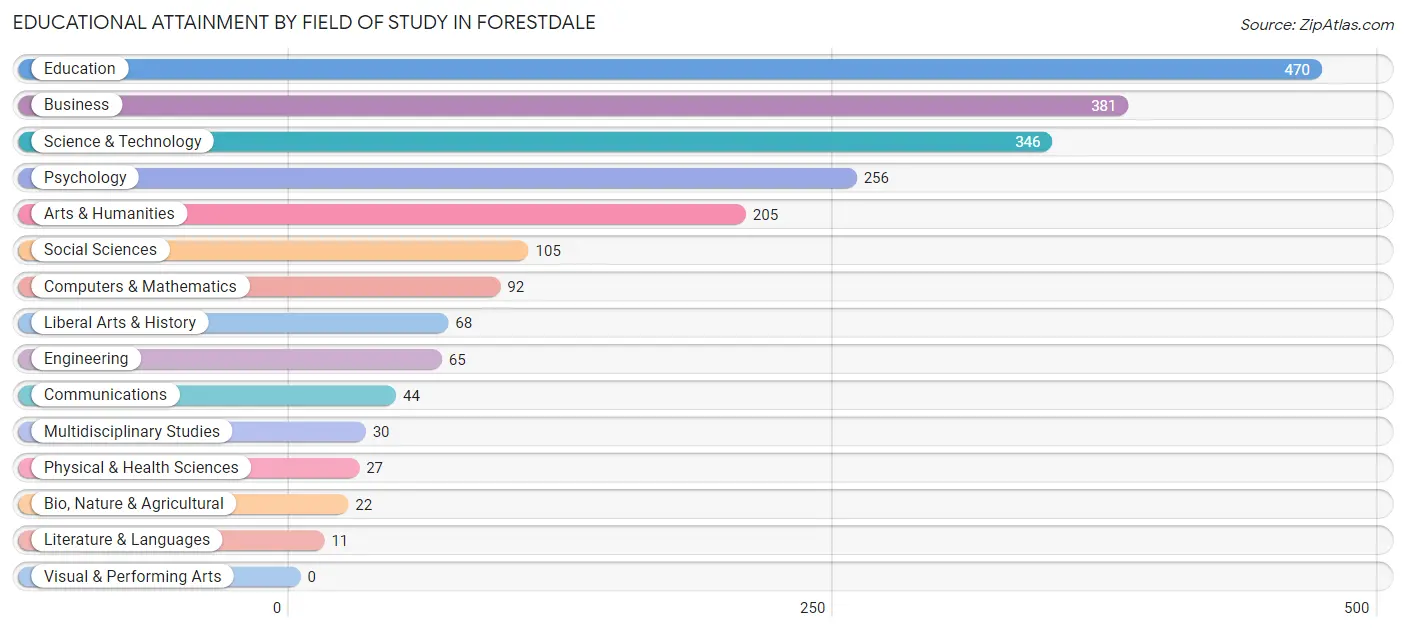
| Field of Study | # Graduates | % Graduates |
| Computers & Mathematics | 92 | 4.3% |
| Bio, Nature & Agricultural | 22 | 1.0% |
| Physical & Health Sciences | 27 | 1.3% |
| Psychology | 256 | 12.1% |
| Social Sciences | 105 | 5.0% |
| Engineering | 65 | 3.1% |
| Multidisciplinary Studies | 30 | 1.4% |
| Science & Technology | 346 | 16.3% |
| Business | 381 | 17.9% |
| Education | 470 | 22.2% |
| Literature & Languages | 11 | 0.5% |
| Liberal Arts & History | 68 | 3.2% |
| Visual & Performing Arts | 0 | 0.0% |
| Communications | 44 | 2.1% |
| Arts & Humanities | 205 | 9.7% |
| Total | 2,122 | 100.0% |
Transportation & Commute in Forestdale
Vehicle Availability by Sex in Forestdale
The most prevalent vehicle ownership categories in Forestdale are males with 2 vehicles (938, accounting for 42.7%) and females with 2 vehicles (775, making up 39.8%).
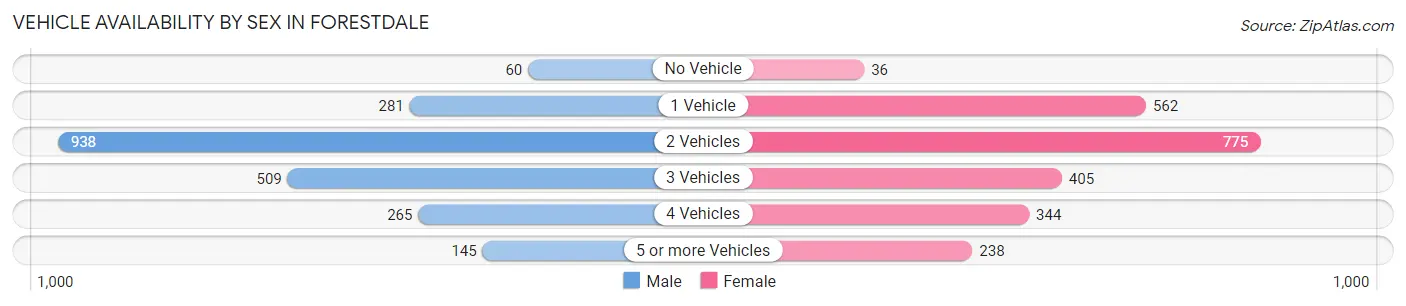
| Vehicles Available | Male | Female |
| No Vehicle | 60 (2.7%) | 36 (1.5%) |
| 1 Vehicle | 281 (12.8%) | 562 (23.8%) |
| 2 Vehicles | 938 (42.7%) | 775 (32.8%) |
| 3 Vehicles | 509 (23.2%) | 405 (17.2%) |
| 4 Vehicles | 265 (12.1%) | 344 (14.6%) |
| 5 or more Vehicles | 145 (6.6%) | 238 (10.1%) |
| Total | 2,198 (100.0%) | 2,360 (100.0%) |
Commute Time in Forestdale
The most frequently occuring commute durations in Forestdale are 30 to 34 minutes (960 commuters, 22.0%), 20 to 24 minutes (958 commuters, 22.0%), and 15 to 19 minutes (867 commuters, 19.9%).
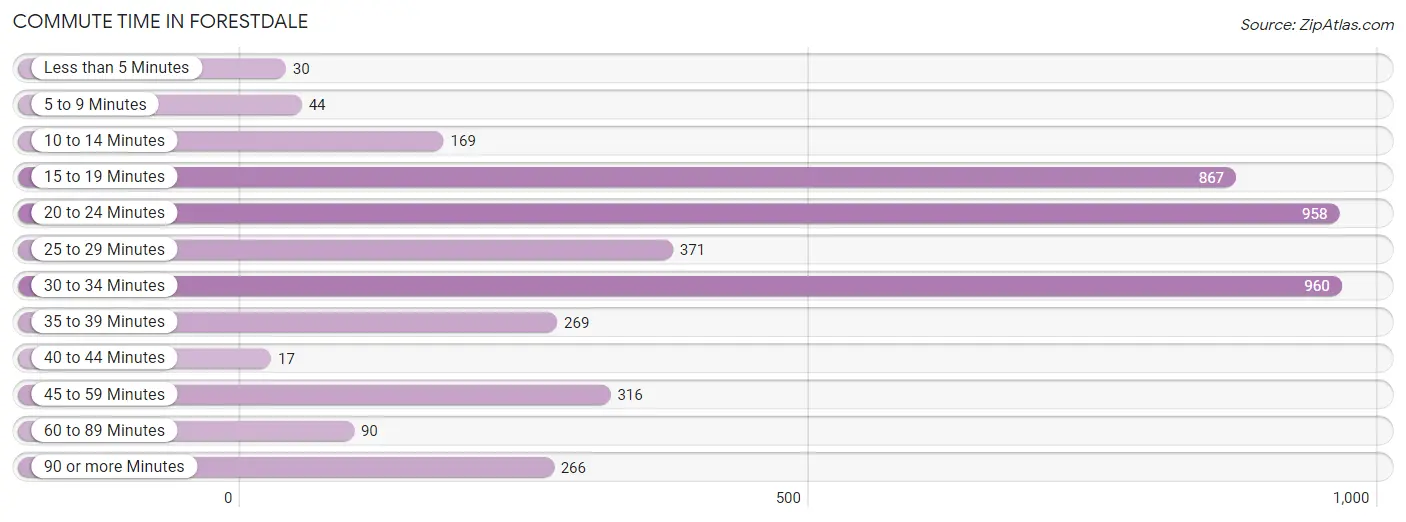
| Commute Time | # Commuters | % Commuters |
| Less than 5 Minutes | 30 | 0.7% |
| 5 to 9 Minutes | 44 | 1.0% |
| 10 to 14 Minutes | 169 | 3.9% |
| 15 to 19 Minutes | 867 | 19.9% |
| 20 to 24 Minutes | 958 | 22.0% |
| 25 to 29 Minutes | 371 | 8.5% |
| 30 to 34 Minutes | 960 | 22.0% |
| 35 to 39 Minutes | 269 | 6.2% |
| 40 to 44 Minutes | 17 | 0.4% |
| 45 to 59 Minutes | 316 | 7.2% |
| 60 to 89 Minutes | 90 | 2.1% |
| 90 or more Minutes | 266 | 6.1% |
Commute Time by Sex in Forestdale
The most common commute times in Forestdale are 20 to 24 minutes (589 commuters, 27.6%) for males and 15 to 19 minutes (674 commuters, 30.4%) for females.
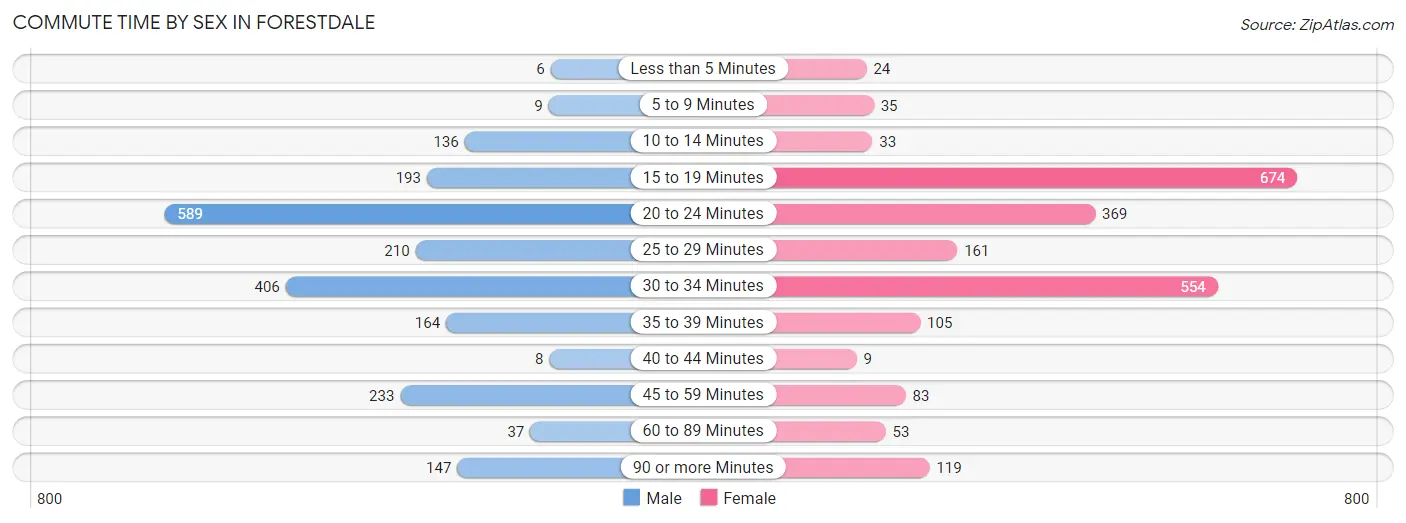
| Commute Time | Male | Female |
| Less than 5 Minutes | 6 (0.3%) | 24 (1.1%) |
| 5 to 9 Minutes | 9 (0.4%) | 35 (1.6%) |
| 10 to 14 Minutes | 136 (6.4%) | 33 (1.5%) |
| 15 to 19 Minutes | 193 (9.0%) | 674 (30.4%) |
| 20 to 24 Minutes | 589 (27.6%) | 369 (16.6%) |
| 25 to 29 Minutes | 210 (9.8%) | 161 (7.3%) |
| 30 to 34 Minutes | 406 (19.0%) | 554 (25.0%) |
| 35 to 39 Minutes | 164 (7.7%) | 105 (4.7%) |
| 40 to 44 Minutes | 8 (0.4%) | 9 (0.4%) |
| 45 to 59 Minutes | 233 (10.9%) | 83 (3.7%) |
| 60 to 89 Minutes | 37 (1.7%) | 53 (2.4%) |
| 90 or more Minutes | 147 (6.9%) | 119 (5.4%) |
Time of Departure to Work by Sex in Forestdale
The most frequent times of departure to work in Forestdale are 7:00 AM to 7:29 AM (522, 24.4%) for males and 7:00 AM to 7:29 AM (456, 20.5%) for females.
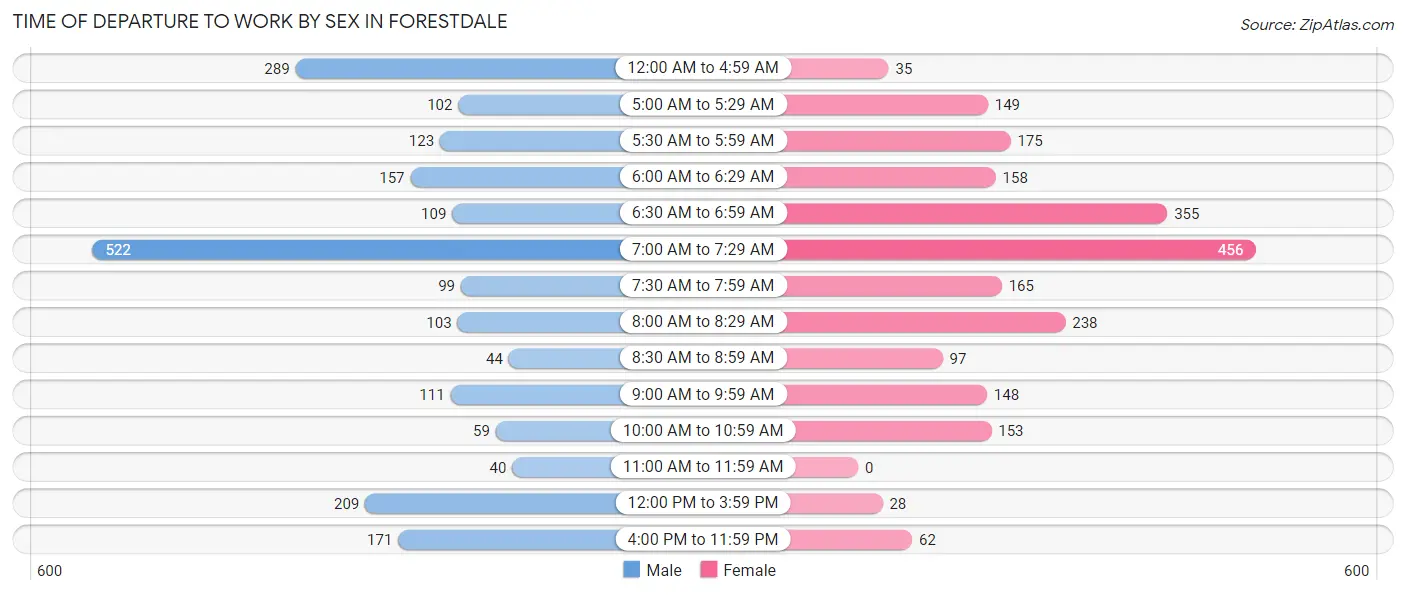
| Time of Departure | Male | Female |
| 12:00 AM to 4:59 AM | 289 (13.5%) | 35 (1.6%) |
| 5:00 AM to 5:29 AM | 102 (4.8%) | 149 (6.7%) |
| 5:30 AM to 5:59 AM | 123 (5.8%) | 175 (7.9%) |
| 6:00 AM to 6:29 AM | 157 (7.3%) | 158 (7.1%) |
| 6:30 AM to 6:59 AM | 109 (5.1%) | 355 (16.0%) |
| 7:00 AM to 7:29 AM | 522 (24.4%) | 456 (20.5%) |
| 7:30 AM to 7:59 AM | 99 (4.6%) | 165 (7.4%) |
| 8:00 AM to 8:29 AM | 103 (4.8%) | 238 (10.7%) |
| 8:30 AM to 8:59 AM | 44 (2.1%) | 97 (4.4%) |
| 9:00 AM to 9:59 AM | 111 (5.2%) | 148 (6.7%) |
| 10:00 AM to 10:59 AM | 59 (2.8%) | 153 (6.9%) |
| 11:00 AM to 11:59 AM | 40 (1.9%) | 0 (0.0%) |
| 12:00 PM to 3:59 PM | 209 (9.8%) | 28 (1.3%) |
| 4:00 PM to 11:59 PM | 171 (8.0%) | 62 (2.8%) |
| Total | 2,138 (100.0%) | 2,219 (100.0%) |
Housing Occupancy in Forestdale
Occupancy by Ownership in Forestdale
Of the total 3,868 dwellings in Forestdale, owner-occupied units account for 2,853 (73.8%), while renter-occupied units make up 1,015 (26.2%).
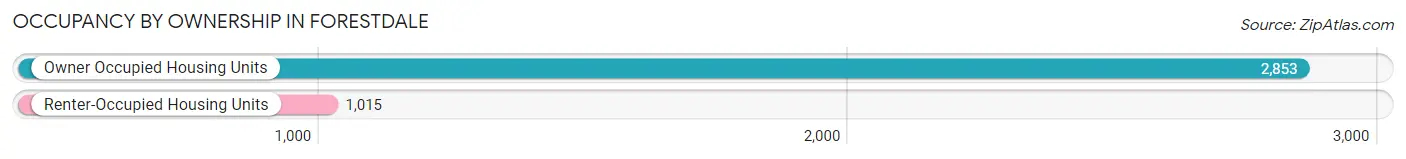
| Occupancy | # Housing Units | % Housing Units |
| Owner Occupied Housing Units | 2,853 | 73.8% |
| Renter-Occupied Housing Units | 1,015 | 26.2% |
| Total Occupied Housing Units | 3,868 | 100.0% |
Occupancy by Household Size in Forestdale
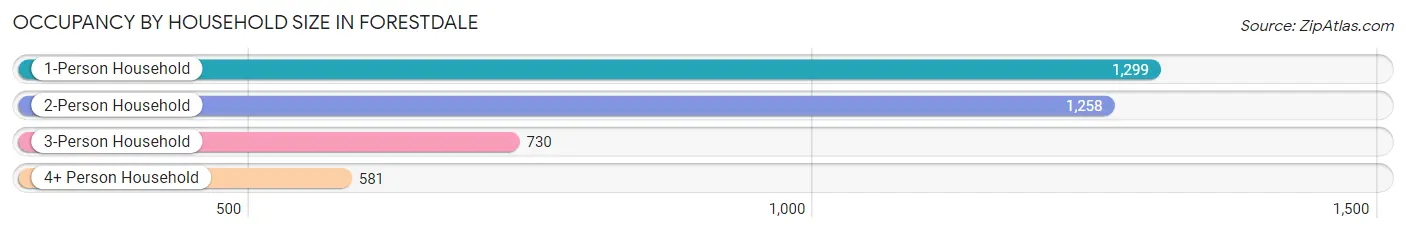
| Household Size | # Housing Units | % Housing Units |
| 1-Person Household | 1,299 | 33.6% |
| 2-Person Household | 1,258 | 32.5% |
| 3-Person Household | 730 | 18.9% |
| 4+ Person Household | 581 | 15.0% |
| Total Housing Units | 3,868 | 100.0% |
Occupancy by Ownership by Household Size in Forestdale
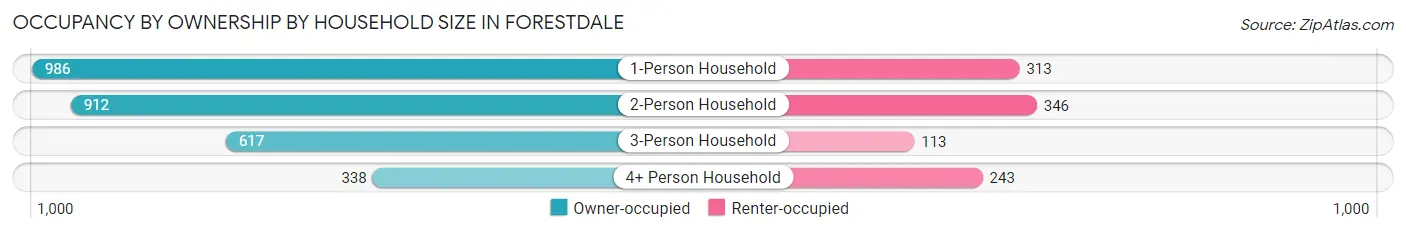
| Household Size | Owner-occupied | Renter-occupied |
| 1-Person Household | 986 (75.9%) | 313 (24.1%) |
| 2-Person Household | 912 (72.5%) | 346 (27.5%) |
| 3-Person Household | 617 (84.5%) | 113 (15.5%) |
| 4+ Person Household | 338 (58.2%) | 243 (41.8%) |
| Total Housing Units | 2,853 (73.8%) | 1,015 (26.2%) |
Occupancy by Educational Attainment in Forestdale
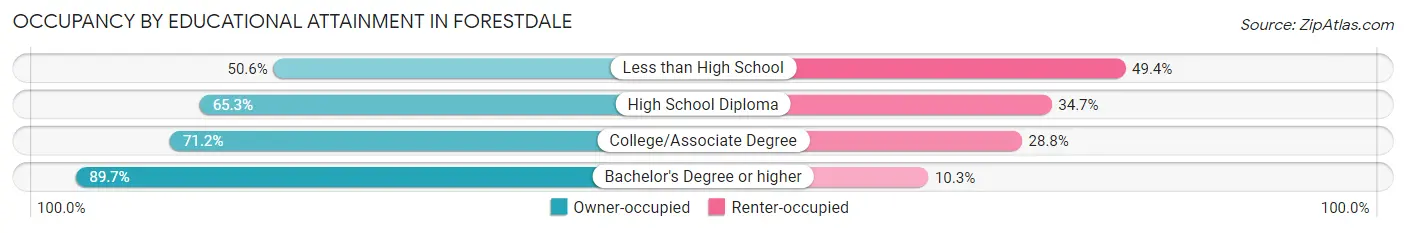
| Household Size | Owner-occupied | Renter-occupied |
| Less than High School | 79 (50.6%) | 77 (49.4%) |
| High School Diploma | 716 (65.3%) | 381 (34.7%) |
| College/Associate Degree | 1,106 (71.2%) | 448 (28.8%) |
| Bachelor's Degree or higher | 952 (89.7%) | 109 (10.3%) |
Occupancy by Age of Householder in Forestdale
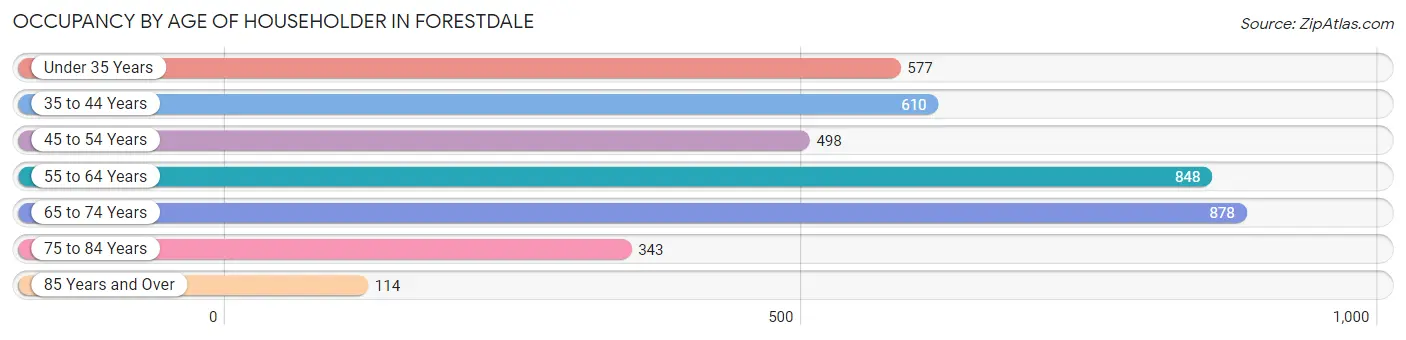
| Age Bracket | # Households | % Households |
| Under 35 Years | 577 | 14.9% |
| 35 to 44 Years | 610 | 15.8% |
| 45 to 54 Years | 498 | 12.9% |
| 55 to 64 Years | 848 | 21.9% |
| 65 to 74 Years | 878 | 22.7% |
| 75 to 84 Years | 343 | 8.9% |
| 85 Years and Over | 114 | 2.9% |
| Total | 3,868 | 100.0% |
Housing Finances in Forestdale
Median Income by Occupancy in Forestdale
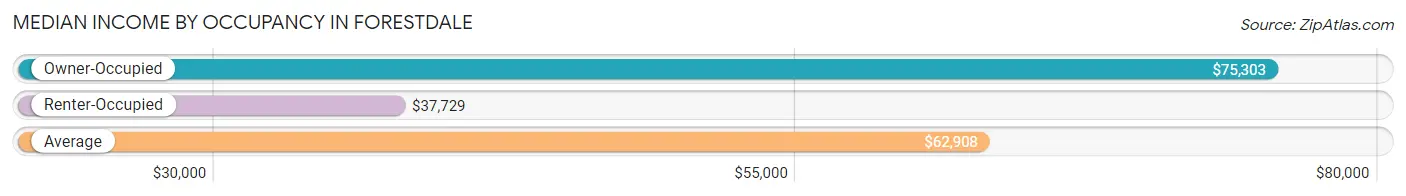
| Occupancy Type | # Households | Median Income |
| Owner-Occupied | 2,853 (73.8%) | $75,303 |
| Renter-Occupied | 1,015 (26.2%) | $37,729 |
| Average | 3,868 (100.0%) | $62,908 |
Occupancy by Householder Income Bracket in Forestdale
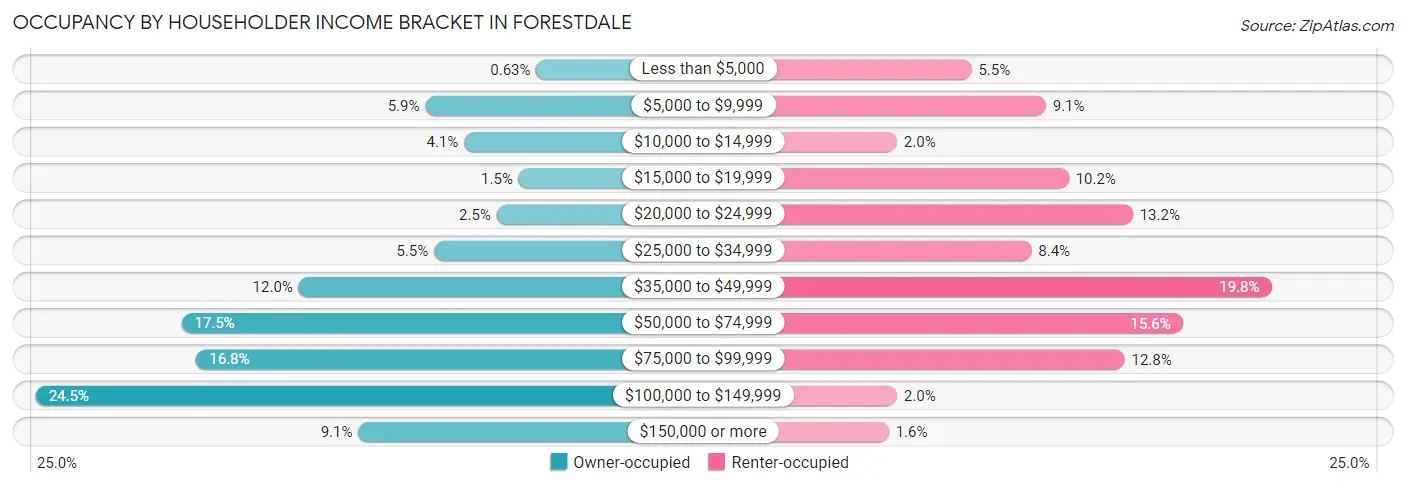
| Income Bracket | Owner-occupied | Renter-occupied |
| Less than $5,000 | 18 (0.6%) | 56 (5.5%) |
| $5,000 to $9,999 | 169 (5.9%) | 92 (9.1%) |
| $10,000 to $14,999 | 116 (4.1%) | 20 (2.0%) |
| $15,000 to $19,999 | 42 (1.5%) | 103 (10.2%) |
| $20,000 to $24,999 | 72 (2.5%) | 134 (13.2%) |
| $25,000 to $34,999 | 157 (5.5%) | 85 (8.4%) |
| $35,000 to $49,999 | 341 (11.9%) | 201 (19.8%) |
| $50,000 to $74,999 | 500 (17.5%) | 158 (15.6%) |
| $75,000 to $99,999 | 480 (16.8%) | 130 (12.8%) |
| $100,000 to $149,999 | 698 (24.5%) | 20 (2.0%) |
| $150,000 or more | 260 (9.1%) | 16 (1.6%) |
| Total | 2,853 (100.0%) | 1,015 (100.0%) |
Monthly Housing Cost Tiers in Forestdale
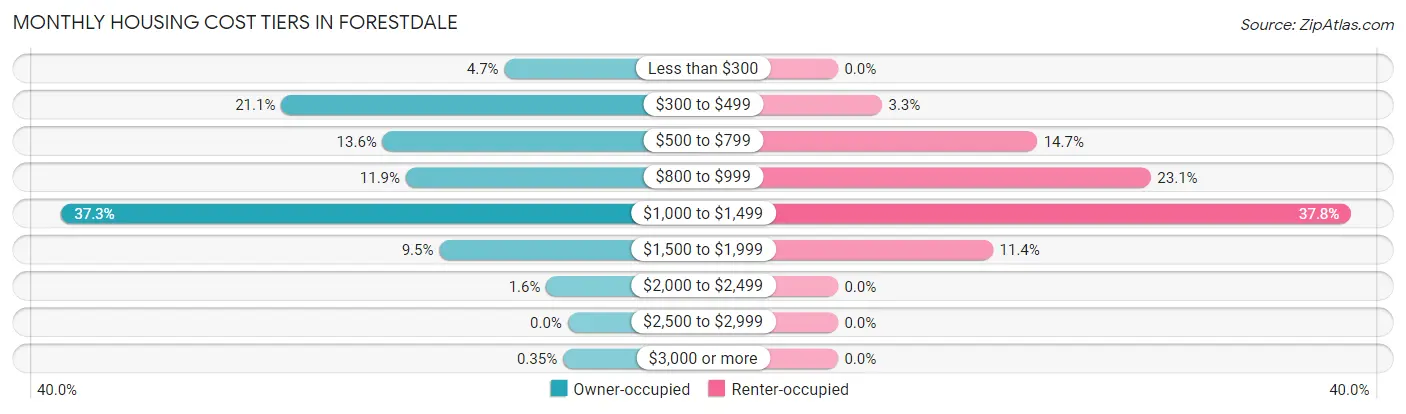
| Monthly Cost | Owner-occupied | Renter-occupied |
| Less than $300 | 133 (4.7%) | 0 (0.0%) |
| $300 to $499 | 602 (21.1%) | 33 (3.3%) |
| $500 to $799 | 389 (13.6%) | 149 (14.7%) |
| $800 to $999 | 340 (11.9%) | 234 (23.1%) |
| $1,000 to $1,499 | 1,064 (37.3%) | 384 (37.8%) |
| $1,500 to $1,999 | 270 (9.5%) | 116 (11.4%) |
| $2,000 to $2,499 | 45 (1.6%) | 0 (0.0%) |
| $2,500 to $2,999 | 0 (0.0%) | 0 (0.0%) |
| $3,000 or more | 10 (0.4%) | 0 (0.0%) |
| Total | 2,853 (100.0%) | 1,015 (100.0%) |
Physical Housing Characteristics in Forestdale
Housing Structures in Forestdale
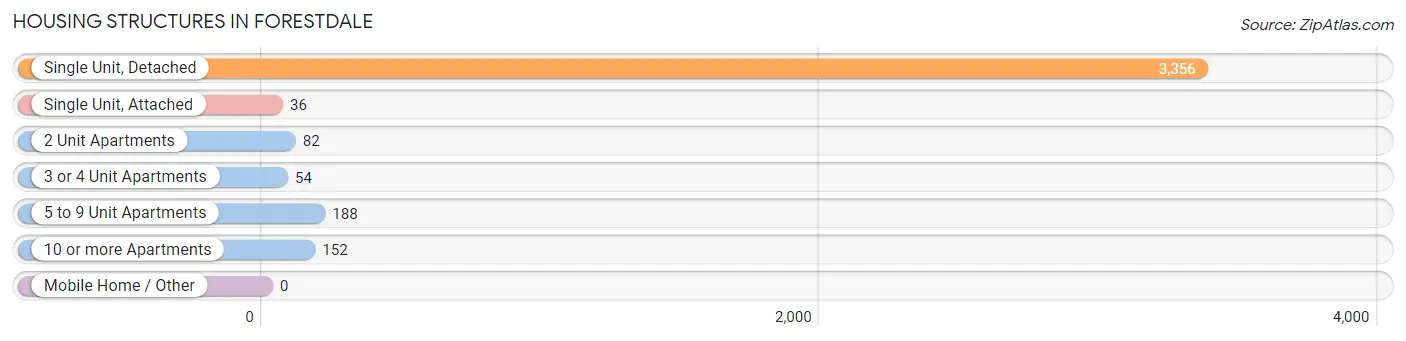
| Structure Type | # Housing Units | % Housing Units |
| Single Unit, Detached | 3,356 | 86.8% |
| Single Unit, Attached | 36 | 0.9% |
| 2 Unit Apartments | 82 | 2.1% |
| 3 or 4 Unit Apartments | 54 | 1.4% |
| 5 to 9 Unit Apartments | 188 | 4.9% |
| 10 or more Apartments | 152 | 3.9% |
| Mobile Home / Other | 0 | 0.0% |
| Total | 3,868 | 100.0% |
Housing Structures by Occupancy in Forestdale
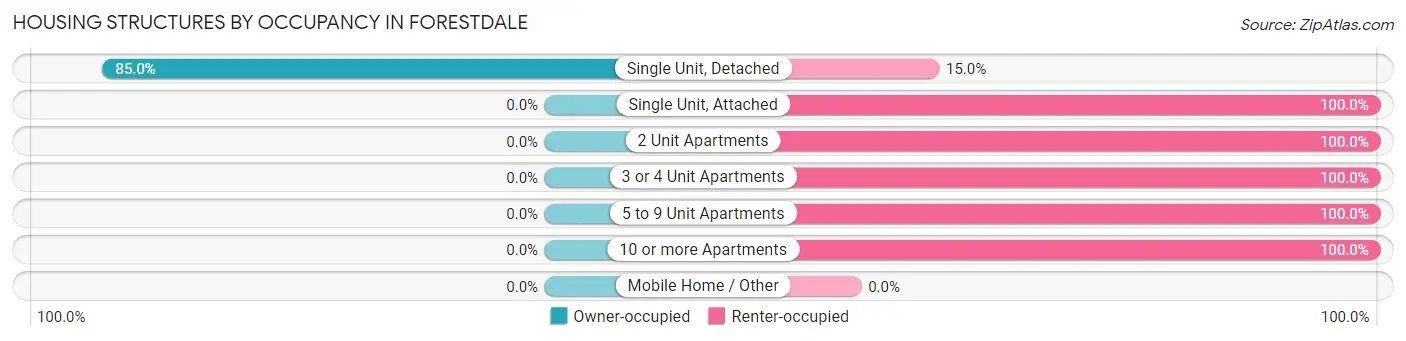
| Structure Type | Owner-occupied | Renter-occupied |
| Single Unit, Detached | 2,853 (85.0%) | 503 (15.0%) |
| Single Unit, Attached | 0 (0.0%) | 36 (100.0%) |
| 2 Unit Apartments | 0 (0.0%) | 82 (100.0%) |
| 3 or 4 Unit Apartments | 0 (0.0%) | 54 (100.0%) |
| 5 to 9 Unit Apartments | 0 (0.0%) | 188 (100.0%) |
| 10 or more Apartments | 0 (0.0%) | 152 (100.0%) |
| Mobile Home / Other | 0 (0.0%) | 0 (0.0%) |
| Total | 2,853 (73.8%) | 1,015 (26.2%) |
Housing Structures by Number of Rooms in Forestdale
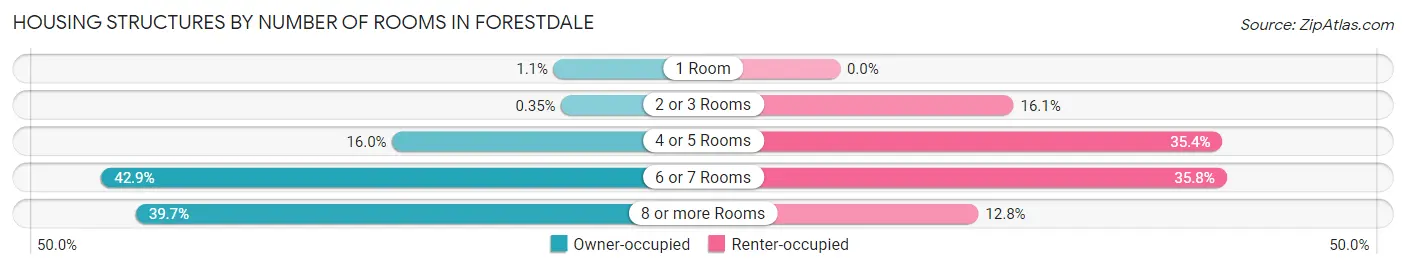
| Number of Rooms | Owner-occupied | Renter-occupied |
| 1 Room | 30 (1.1%) | 0 (0.0%) |
| 2 or 3 Rooms | 10 (0.4%) | 163 (16.1%) |
| 4 or 5 Rooms | 456 (16.0%) | 359 (35.4%) |
| 6 or 7 Rooms | 1,224 (42.9%) | 363 (35.8%) |
| 8 or more Rooms | 1,133 (39.7%) | 130 (12.8%) |
| Total | 2,853 (100.0%) | 1,015 (100.0%) |
Housing Structure by Heating Type in Forestdale
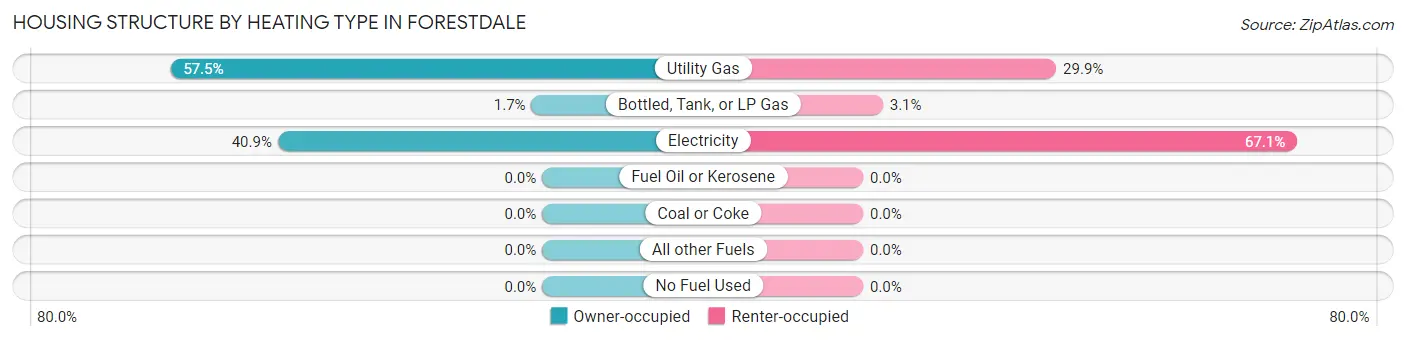
| Heating Type | Owner-occupied | Renter-occupied |
| Utility Gas | 1,640 (57.5%) | 303 (29.8%) |
| Bottled, Tank, or LP Gas | 47 (1.7%) | 31 (3.0%) |
| Electricity | 1,166 (40.9%) | 681 (67.1%) |
| Fuel Oil or Kerosene | 0 (0.0%) | 0 (0.0%) |
| Coal or Coke | 0 (0.0%) | 0 (0.0%) |
| All other Fuels | 0 (0.0%) | 0 (0.0%) |
| No Fuel Used | 0 (0.0%) | 0 (0.0%) |
| Total | 2,853 (100.0%) | 1,015 (100.0%) |
Household Vehicle Usage in Forestdale
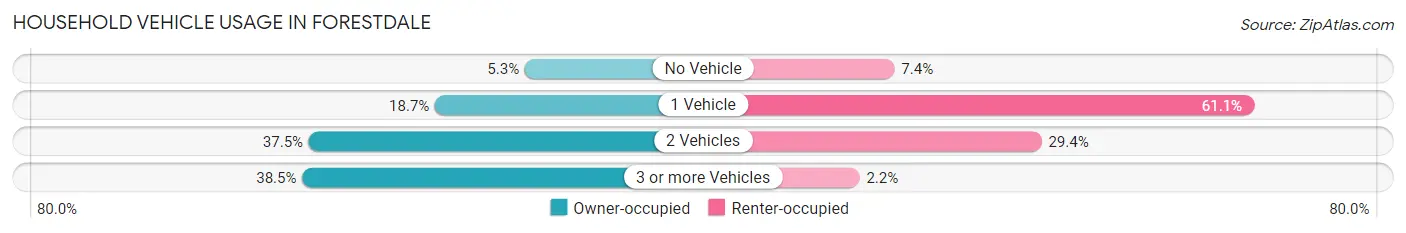
| Vehicles per Household | Owner-occupied | Renter-occupied |
| No Vehicle | 150 (5.3%) | 75 (7.4%) |
| 1 Vehicle | 533 (18.7%) | 620 (61.1%) |
| 2 Vehicles | 1,071 (37.5%) | 298 (29.4%) |
| 3 or more Vehicles | 1,099 (38.5%) | 22 (2.2%) |
| Total | 2,853 (100.0%) | 1,015 (100.0%) |
Real Estate & Mortgages in Forestdale
Real Estate and Mortgage Overview in Forestdale
| Characteristic | Without Mortgage | With Mortgage |
| Housing Units | 1,102 | 1,751 |
| Median Property Value | $157,900 | $144,600 |
| Median Household Income | $69,750 | $154 |
| Monthly Housing Costs | $449 | $10 |
| Real Estate Taxes | $678 | $280 |
Property Value by Mortgage Status in Forestdale
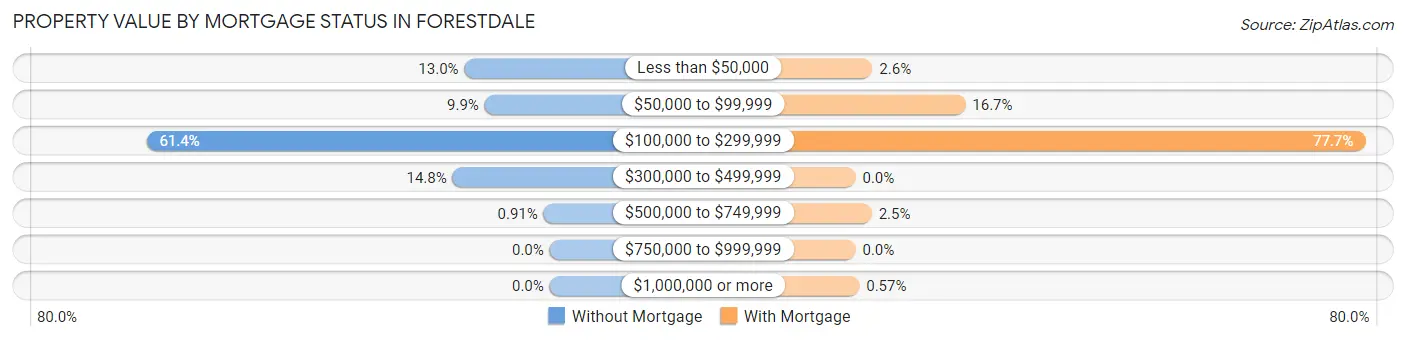
| Property Value | Without Mortgage | With Mortgage |
| Less than $50,000 | 143 (13.0%) | 45 (2.6%) |
| $50,000 to $99,999 | 109 (9.9%) | 293 (16.7%) |
| $100,000 to $299,999 | 677 (61.4%) | 1,360 (77.7%) |
| $300,000 to $499,999 | 163 (14.8%) | 0 (0.0%) |
| $500,000 to $749,999 | 10 (0.9%) | 43 (2.5%) |
| $750,000 to $999,999 | 0 (0.0%) | 0 (0.0%) |
| $1,000,000 or more | 0 (0.0%) | 10 (0.6%) |
| Total | 1,102 (100.0%) | 1,751 (100.0%) |
Household Income by Mortgage Status in Forestdale
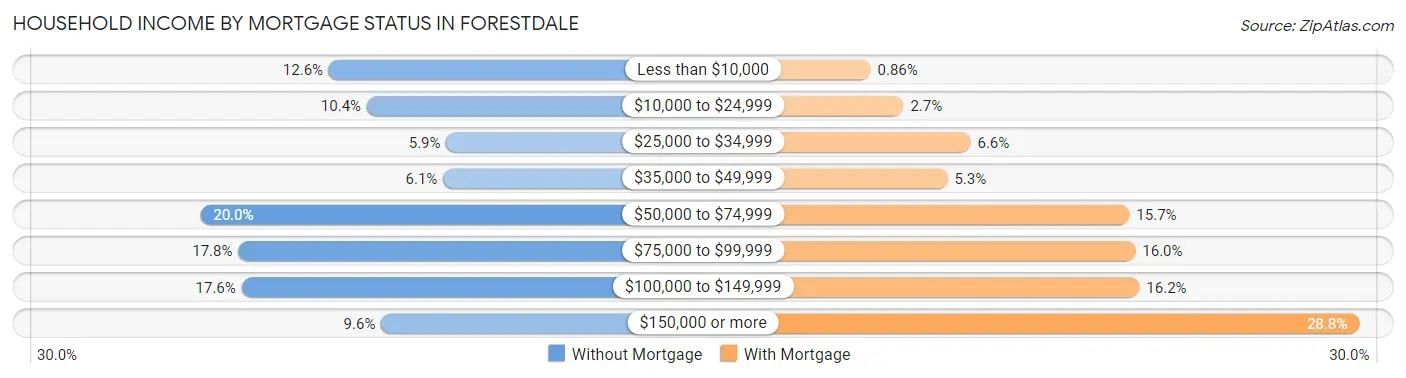
| Household Income | Without Mortgage | With Mortgage |
| Less than $10,000 | 139 (12.6%) | 15 (0.9%) |
| $10,000 to $24,999 | 115 (10.4%) | 48 (2.7%) |
| $25,000 to $34,999 | 65 (5.9%) | 115 (6.6%) |
| $35,000 to $49,999 | 67 (6.1%) | 92 (5.2%) |
| $50,000 to $74,999 | 220 (20.0%) | 274 (15.7%) |
| $75,000 to $99,999 | 196 (17.8%) | 280 (16.0%) |
| $100,000 to $149,999 | 194 (17.6%) | 284 (16.2%) |
| $150,000 or more | 106 (9.6%) | 504 (28.8%) |
| Total | 1,102 (100.0%) | 1,751 (100.0%) |
Property Value to Household Income Ratio in Forestdale
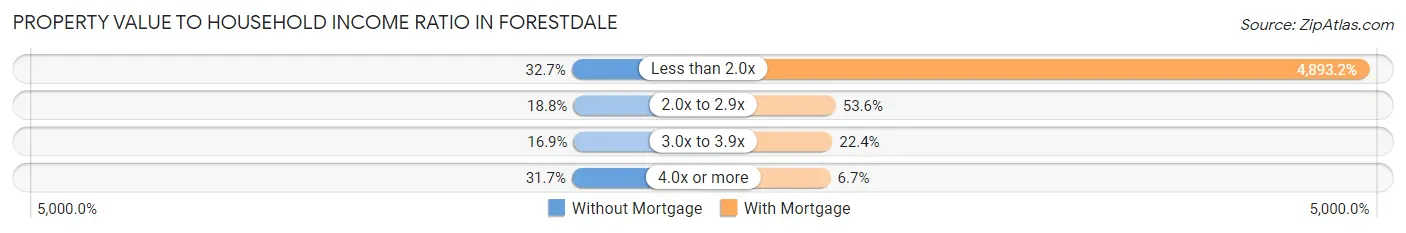
| Value-to-Income Ratio | Without Mortgage | With Mortgage |
| Less than 2.0x | 360 (32.7%) | 85,679 (4,893.1%) |
| 2.0x to 2.9x | 207 (18.8%) | 939 (53.6%) |
| 3.0x to 3.9x | 186 (16.9%) | 392 (22.4%) |
| 4.0x or more | 349 (31.7%) | 118 (6.7%) |
| Total | 1,102 (100.0%) | 1,751 (100.0%) |
Real Estate Taxes by Mortgage Status in Forestdale
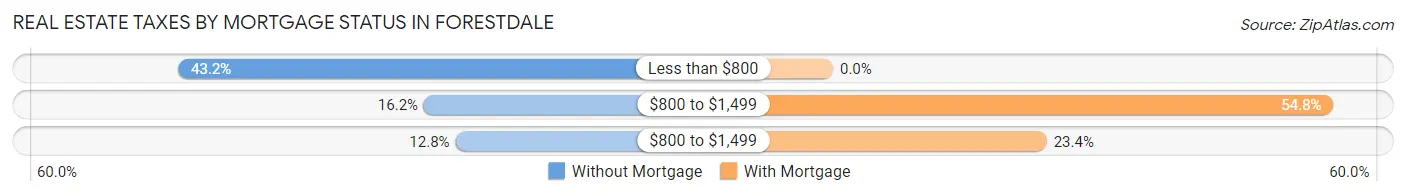
| Property Taxes | Without Mortgage | With Mortgage |
| Less than $800 | 476 (43.2%) | 0 (0.0%) |
| $800 to $1,499 | 179 (16.2%) | 960 (54.8%) |
| $800 to $1,499 | 141 (12.8%) | 410 (23.4%) |
| Total | 1,102 (100.0%) | 1,751 (100.0%) |
Health & Disability in Forestdale
Health Insurance Coverage by Age in Forestdale
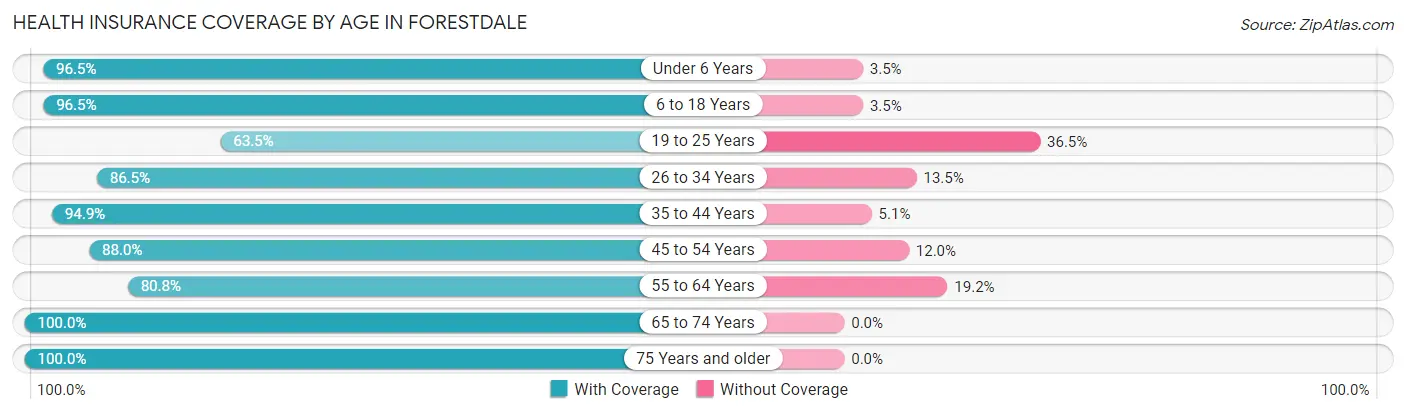
| Age Bracket | With Coverage | Without Coverage |
| Under 6 Years | 475 (96.5%) | 17 (3.5%) |
| 6 to 18 Years | 1,222 (96.5%) | 44 (3.5%) |
| 19 to 25 Years | 539 (63.5%) | 310 (36.5%) |
| 26 to 34 Years | 906 (86.5%) | 141 (13.5%) |
| 35 to 44 Years | 1,041 (94.9%) | 56 (5.1%) |
| 45 to 54 Years | 796 (88.0%) | 109 (12.0%) |
| 55 to 64 Years | 1,197 (80.8%) | 285 (19.2%) |
| 65 to 74 Years | 1,300 (100.0%) | 0 (0.0%) |
| 75 Years and older | 700 (100.0%) | 0 (0.0%) |
| Total | 8,176 (89.5%) | 962 (10.5%) |
Health Insurance Coverage by Citizenship Status in Forestdale
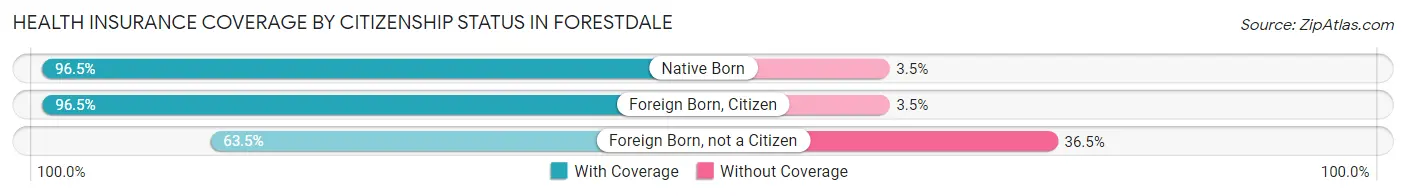
| Citizenship Status | With Coverage | Without Coverage |
| Native Born | 475 (96.5%) | 17 (3.5%) |
| Foreign Born, Citizen | 1,222 (96.5%) | 44 (3.5%) |
| Foreign Born, not a Citizen | 539 (63.5%) | 310 (36.5%) |
Health Insurance Coverage by Household Income in Forestdale
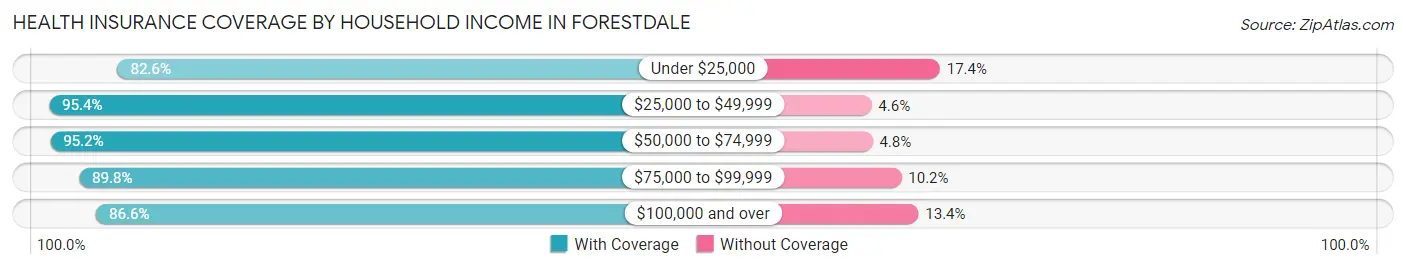
| Household Income | With Coverage | Without Coverage |
| Under $25,000 | 1,209 (82.6%) | 255 (17.4%) |
| $25,000 to $49,999 | 1,676 (95.4%) | 81 (4.6%) |
| $50,000 to $74,999 | 1,327 (95.2%) | 67 (4.8%) |
| $75,000 to $99,999 | 1,335 (89.8%) | 152 (10.2%) |
| $100,000 and over | 2,629 (86.6%) | 407 (13.4%) |
Public vs Private Health Insurance Coverage by Age in Forestdale
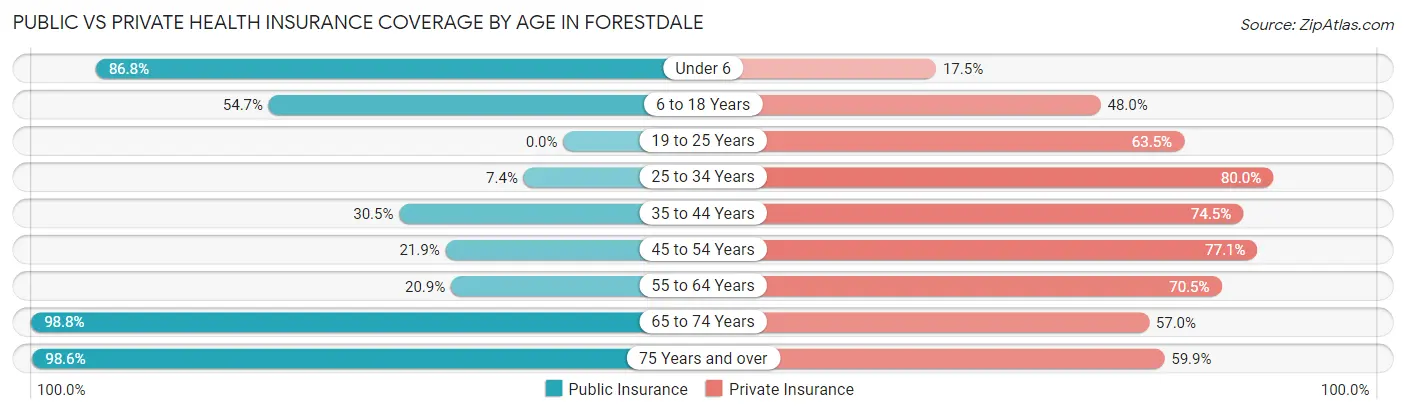
| Age Bracket | Public Insurance | Private Insurance |
| Under 6 | 427 (86.8%) | 86 (17.5%) |
| 6 to 18 Years | 692 (54.7%) | 608 (48.0%) |
| 19 to 25 Years | 0 (0.0%) | 539 (63.5%) |
| 25 to 34 Years | 77 (7.3%) | 838 (80.0%) |
| 35 to 44 Years | 334 (30.4%) | 817 (74.5%) |
| 45 to 54 Years | 198 (21.9%) | 698 (77.1%) |
| 55 to 64 Years | 309 (20.8%) | 1,044 (70.5%) |
| 65 to 74 Years | 1,284 (98.8%) | 741 (57.0%) |
| 75 Years and over | 690 (98.6%) | 419 (59.9%) |
| Total | 4,011 (43.9%) | 5,790 (63.4%) |
Disability Status by Sex by Age in Forestdale
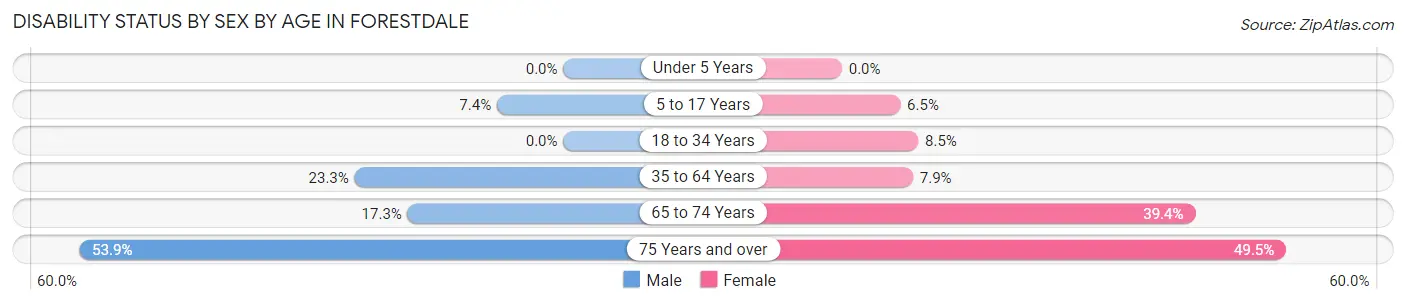
| Age Bracket | Male | Female |
| Under 5 Years | 0 (0.0%) | 0 (0.0%) |
| 5 to 17 Years | 49 (7.4%) | 40 (6.5%) |
| 18 to 34 Years | 0 (0.0%) | 69 (8.5%) |
| 35 to 64 Years | 375 (23.3%) | 148 (7.9%) |
| 65 to 74 Years | 95 (17.3%) | 296 (39.4%) |
| 75 Years and over | 117 (53.9%) | 239 (49.5%) |
Disability Class by Sex by Age in Forestdale
Disability Class: Hearing Difficulty
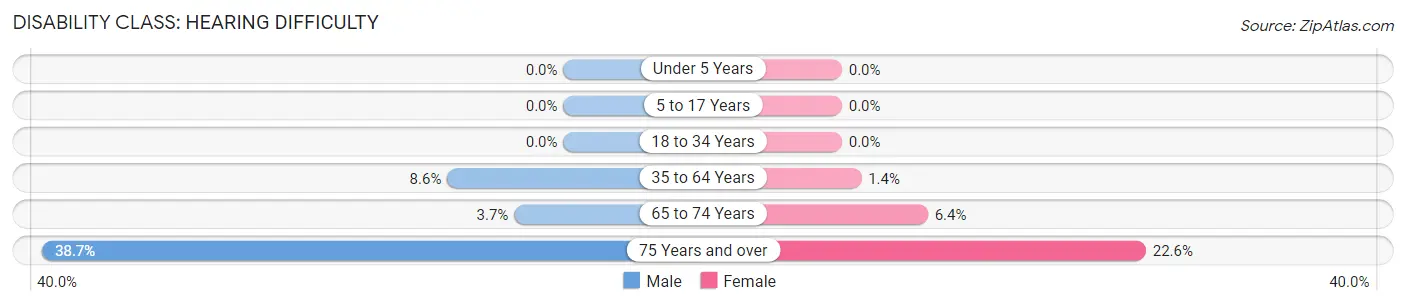
| Age Bracket | Male | Female |
| Under 5 Years | 0 (0.0%) | 0 (0.0%) |
| 5 to 17 Years | 0 (0.0%) | 0 (0.0%) |
| 18 to 34 Years | 0 (0.0%) | 0 (0.0%) |
| 35 to 64 Years | 139 (8.6%) | 27 (1.4%) |
| 65 to 74 Years | 20 (3.6%) | 48 (6.4%) |
| 75 Years and over | 84 (38.7%) | 109 (22.6%) |
Disability Class: Vision Difficulty
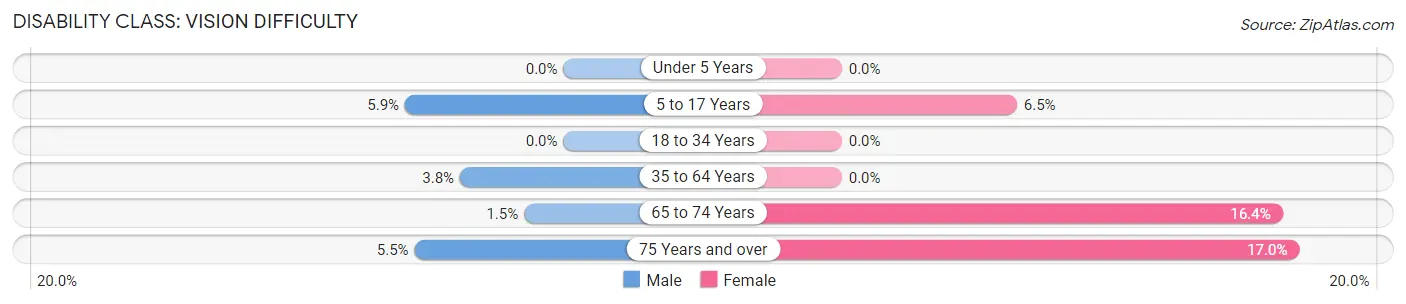
| Age Bracket | Male | Female |
| Under 5 Years | 0 (0.0%) | 0 (0.0%) |
| 5 to 17 Years | 39 (5.9%) | 40 (6.5%) |
| 18 to 34 Years | 0 (0.0%) | 0 (0.0%) |
| 35 to 64 Years | 62 (3.8%) | 0 (0.0%) |
| 65 to 74 Years | 8 (1.5%) | 123 (16.4%) |
| 75 Years and over | 12 (5.5%) | 82 (17.0%) |
Disability Class: Cognitive Difficulty
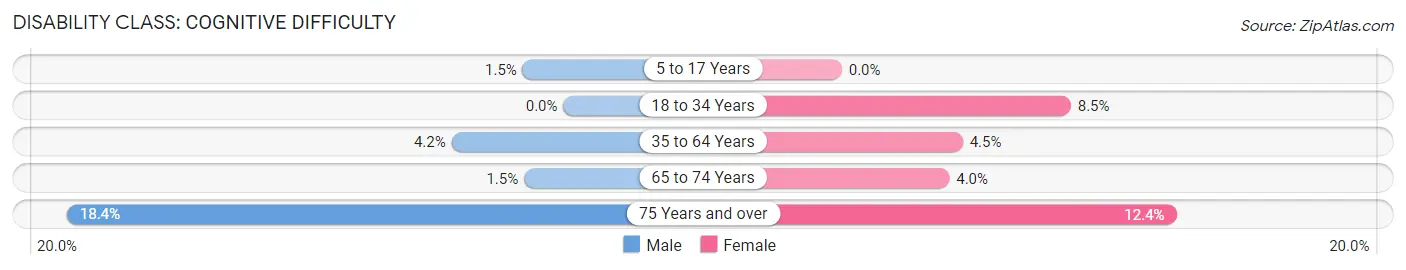
| Age Bracket | Male | Female |
| 5 to 17 Years | 10 (1.5%) | 0 (0.0%) |
| 18 to 34 Years | 0 (0.0%) | 69 (8.5%) |
| 35 to 64 Years | 67 (4.2%) | 84 (4.5%) |
| 65 to 74 Years | 8 (1.5%) | 30 (4.0%) |
| 75 Years and over | 40 (18.4%) | 60 (12.4%) |
Disability Class: Ambulatory Difficulty
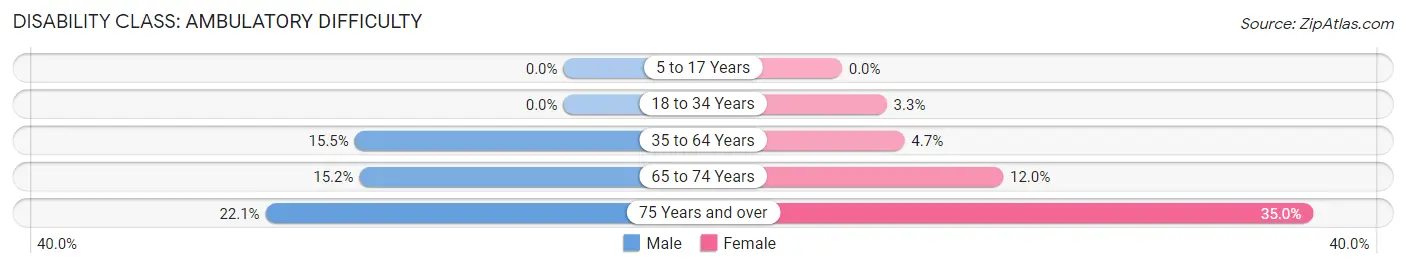
| Age Bracket | Male | Female |
| 5 to 17 Years | 0 (0.0%) | 0 (0.0%) |
| 18 to 34 Years | 0 (0.0%) | 27 (3.3%) |
| 35 to 64 Years | 250 (15.5%) | 87 (4.6%) |
| 65 to 74 Years | 83 (15.1%) | 90 (12.0%) |
| 75 Years and over | 48 (22.1%) | 169 (35.0%) |
Disability Class: Self-Care Difficulty
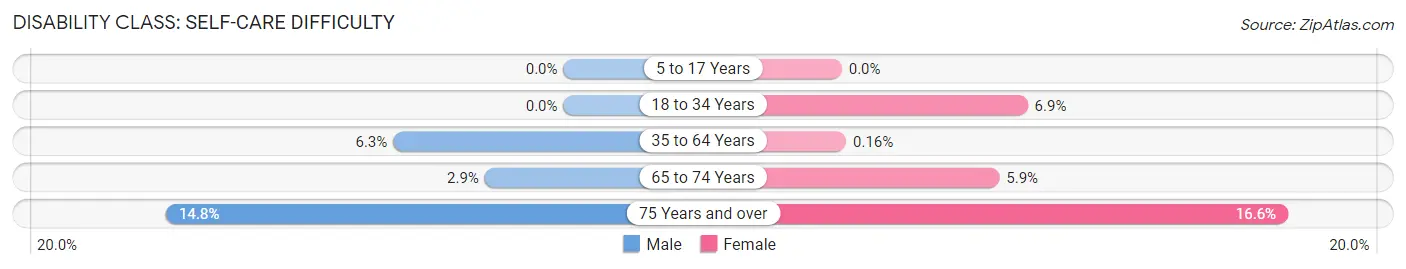
| Age Bracket | Male | Female |
| 5 to 17 Years | 0 (0.0%) | 0 (0.0%) |
| 18 to 34 Years | 0 (0.0%) | 56 (6.9%) |
| 35 to 64 Years | 102 (6.3%) | 3 (0.2%) |
| 65 to 74 Years | 16 (2.9%) | 44 (5.9%) |
| 75 Years and over | 32 (14.7%) | 80 (16.6%) |
Technology Access in Forestdale
Computing Device Access in Forestdale
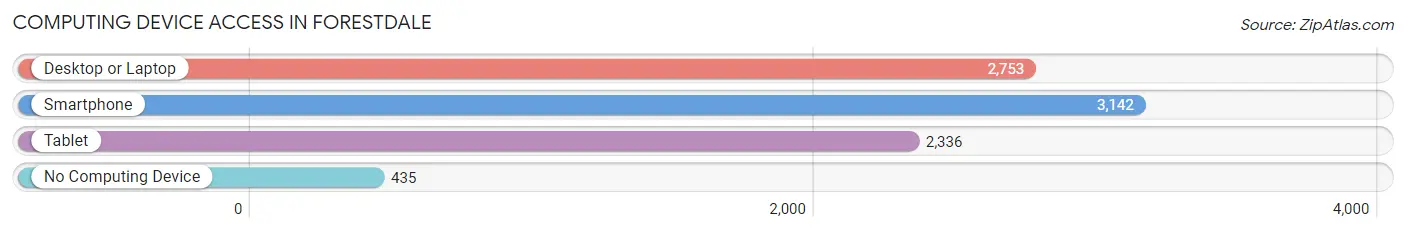
| Device Type | # Households | % Households |
| Desktop or Laptop | 2,753 | 71.2% |
| Smartphone | 3,142 | 81.2% |
| Tablet | 2,336 | 60.4% |
| No Computing Device | 435 | 11.3% |
| Total | 3,868 | 100.0% |
Internet Access in Forestdale
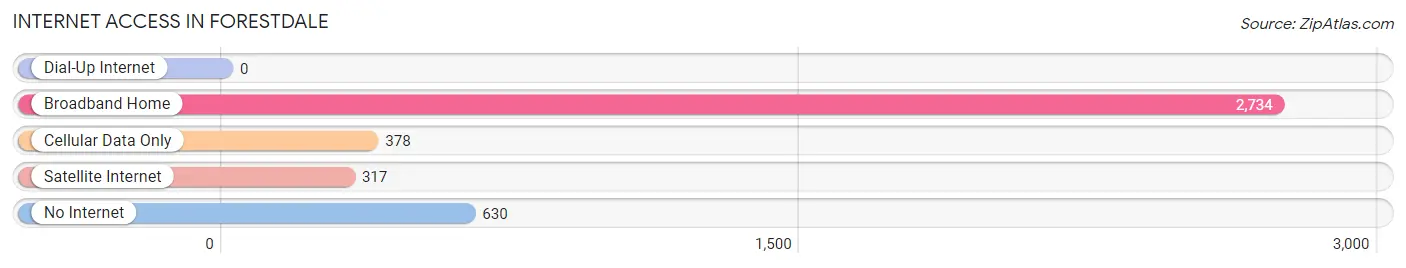
| Internet Type | # Households | % Households |
| Dial-Up Internet | 0 | 0.0% |
| Broadband Home | 2,734 | 70.7% |
| Cellular Data Only | 378 | 9.8% |
| Satellite Internet | 317 | 8.2% |
| No Internet | 630 | 16.3% |
| Total | 3,868 | 100.0% |
Forestdale Summary
History
The area now known as Forestdale, Alabama was first settled in the early 1800s by a group of settlers from Georgia. The area was originally known as "The Crossroads" due to its location at the intersection of two major roads. The first post office was established in 1837 and the town was officially incorporated in 1887.
The town was named after the nearby forest, which was home to a variety of wildlife, including deer, turkey, and other animals. The area was also home to a variety of plants, including wildflowers, trees, and shrubs.
The town grew slowly but steadily over the years, and by the early 1900s, it had become a thriving community. The town was home to several businesses, including a general store, a blacksmith shop, and a sawmill. The town also had a school, a church, and a post office.
In the 1950s, the town began to experience a period of growth and development. The population increased, and new businesses opened, including a grocery store, a hardware store, and a gas station. The town also had a library, a movie theater, and a bowling alley.
In the late 1960s, the town began to experience a period of decline. Many of the businesses closed, and the population began to decline. In the 1980s, the town began to experience a period of revitalization. New businesses opened, and the population began to increase.
Geography
Forestdale is located in Jefferson County, Alabama, approximately 10 miles south of Birmingham. The town is situated in the foothills of the Appalachian Mountains, and is surrounded by rolling hills and forests. The town is located near the Black Warrior River, and is home to several small lakes and streams.
The climate in Forestdale is mild and humid, with hot summers and mild winters. The average annual temperature is around 70 degrees Fahrenheit. The average annual precipitation is around 50 inches.
Economy
The economy of Forestdale is largely based on the service industry. The town is home to several small businesses, including restaurants, retail stores, and professional services. The town is also home to several manufacturing companies, including a furniture factory and a paper mill.
The town is also home to several educational institutions, including a community college and a technical school. The town is also home to a hospital and several medical clinics.
Demographics
As of the 2010 census, the population of Forestdale was 8,845. The racial makeup of the town was 79.3% White, 16.2% African American, 0.5% Native American, 0.7% Asian, 0.1% Pacific Islander, and 3.2% from other races. The median household income was $37,945, and the median family income was $45,945. The per capita income was $19,945.
Conclusion
Forestdale, Alabama is a small town located in Jefferson County, Alabama. The town has a rich history, and has experienced periods of growth and decline over the years. The town is home to a variety of businesses, educational institutions, and medical facilities. The population of the town is largely white, with a small percentage of African Americans and other races. The median household income is slightly below the national average, and the per capita income is slightly above the national average.
Common Questions
What is Per Capita Income in Forestdale?
Per Capita income in Forestdale is $32,320.
What is the Median Family Income in Forestdale?
Median Family Income in Forestdale is $78,512.
What is the Median Household income in Forestdale?
Median Household Income in Forestdale is $62,908.
What is Income or Wage Gap in Forestdale?
Income or Wage Gap in Forestdale is 2.4%.
Women in Forestdale earn 97.6 cents for every dollar earned by a man.
What is Inequality or Gini Index in Forestdale?
Inequality or Gini Index in Forestdale is 0.41.
What is the Total Population of Forestdale?
Total Population of Forestdale is 9,138.
What is the Total Male Population of Forestdale?
Total Male Population of Forestdale is 4,310.
What is the Total Female Population of Forestdale?
Total Female Population of Forestdale is 4,828.
What is the Ratio of Males per 100 Females in Forestdale?
There are 89.27 Males per 100 Females in Forestdale.
What is the Ratio of Females per 100 Males in Forestdale?
There are 112.02 Females per 100 Males in Forestdale.
What is the Median Population Age in Forestdale?
Median Population Age in Forestdale is 43.7 Years.
What is the Average Family Size in Forestdale
Average Family Size in Forestdale is 3.0 People.
What is the Average Household Size in Forestdale
Average Household Size in Forestdale is 2.4 People.
How Large is the Labor Force in Forestdale?
There are 5,049 People in the Labor Forcein in Forestdale.
What is the Percentage of People in the Labor Force in Forestdale?
64.8% of People are in the Labor Force in Forestdale.
What is the Unemployment Rate in Forestdale?
Unemployment Rate in Forestdale is 8.4%.