Sylacauga, AL Map & Demographics
Sylacauga Map
Sylacauga Overview
$25,806
PER CAPITA INCOME
$65,164
AVG FAMILY INCOME
$46,137
AVG HOUSEHOLD INCOME
45.7%
WAGE / INCOME GAP [ % ]
54.3¢/ $1
WAGE / INCOME GAP [ $ ]
$11,128
FAMILY INCOME DEFICIT
0.46
INEQUALITY / GINI INDEX
12,465
TOTAL POPULATION
5,389
MALE POPULATION
7,076
FEMALE POPULATION
76.16
MALES / 100 FEMALES
131.30
FEMALES / 100 MALES
37.2
MEDIAN AGE
2.8
AVG FAMILY SIZE
2.3
AVG HOUSEHOLD SIZE
5,613
LABOR FORCE [ PEOPLE ]
57.6%
PERCENT IN LABOR FORCE
8.9%
UNEMPLOYMENT RATE
Sylacauga Area Codes
Income in Sylacauga
Income Overview in Sylacauga
Per Capita Income in Sylacauga is $25,806, while median incomes of families and households are $65,164 and $46,137 respectively.
| Characteristic | Number | Measure |
| Per Capita Income | 12,465 | $25,806 |
| Median Family Income | 3,506 | $65,164 |
| Mean Family Income | 3,506 | $70,190 |
| Median Household Income | 5,291 | $46,137 |
| Mean Household Income | 5,291 | $59,821 |
| Income Deficit | 3,506 | $11,128 |
| Wage / Income Gap (%) | 12,465 | 45.73% |
| Wage / Income Gap ($) | 12,465 | 54.27¢ per $1 |
| Gini / Inequality Index | 12,465 | 0.46 |
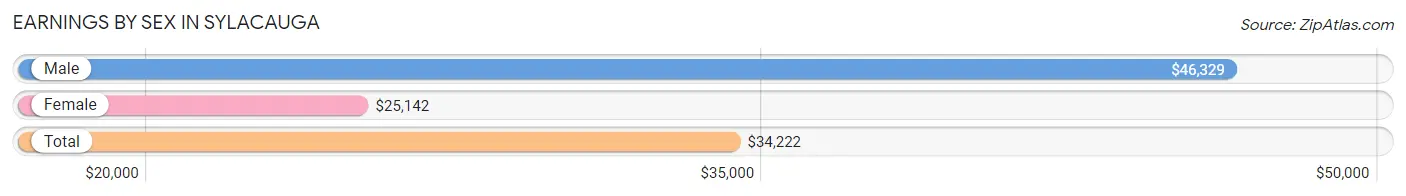
Earnings by Sex in Sylacauga
Average Earnings in Sylacauga are $34,222, $46,329 for men and $25,142 for women, a difference of 45.7%.
| Sex | Number | Average Earnings |
| Male | 2,660 (47.0%) | $46,329 |
| Female | 3,000 (53.0%) | $25,142 |
| Total | 5,660 (100.0%) | $34,222 |
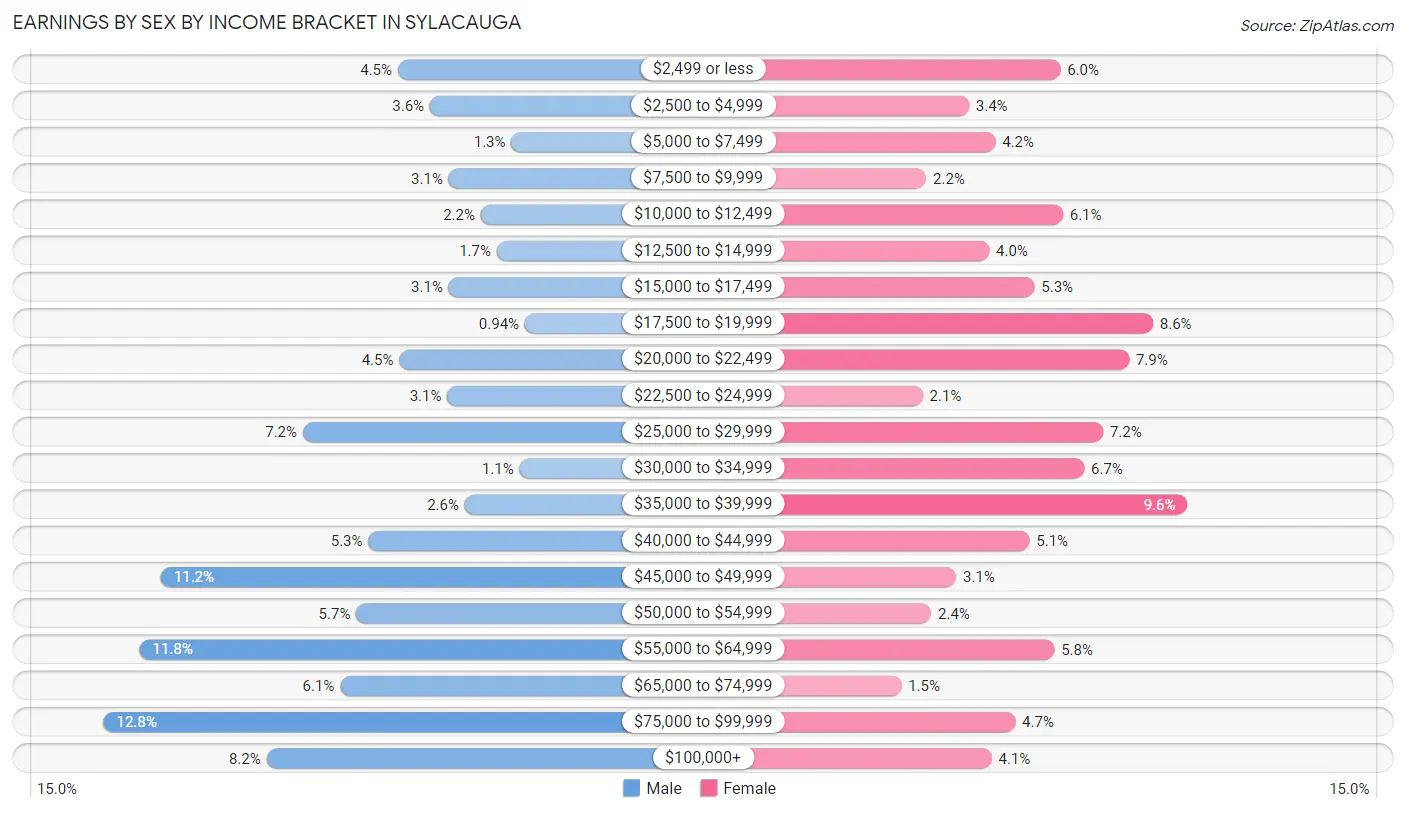
Earnings by Sex by Income Bracket in Sylacauga
The most common earnings brackets in Sylacauga are $75,000 to $99,999 for men (340 | 12.8%) and $35,000 to $39,999 for women (287 | 9.6%).
| Income | Male | Female |
| $2,499 or less | 120 (4.5%) | 180 (6.0%) |
| $2,500 to $4,999 | 96 (3.6%) | 103 (3.4%) |
| $5,000 to $7,499 | 35 (1.3%) | 125 (4.2%) |
| $7,500 to $9,999 | 82 (3.1%) | 67 (2.2%) |
| $10,000 to $12,499 | 58 (2.2%) | 182 (6.1%) |
| $12,500 to $14,999 | 46 (1.7%) | 120 (4.0%) |
| $15,000 to $17,499 | 82 (3.1%) | 158 (5.3%) |
| $17,500 to $19,999 | 25 (0.9%) | 258 (8.6%) |
| $20,000 to $22,499 | 119 (4.5%) | 238 (7.9%) |
| $22,500 to $24,999 | 83 (3.1%) | 64 (2.1%) |
| $25,000 to $29,999 | 191 (7.2%) | 216 (7.2%) |
| $30,000 to $34,999 | 29 (1.1%) | 200 (6.7%) |
| $35,000 to $39,999 | 70 (2.6%) | 287 (9.6%) |
| $40,000 to $44,999 | 142 (5.3%) | 154 (5.1%) |
| $45,000 to $49,999 | 297 (11.2%) | 92 (3.1%) |
| $50,000 to $54,999 | 151 (5.7%) | 71 (2.4%) |
| $55,000 to $64,999 | 313 (11.8%) | 175 (5.8%) |
| $65,000 to $74,999 | 163 (6.1%) | 46 (1.5%) |
| $75,000 to $99,999 | 340 (12.8%) | 142 (4.7%) |
| $100,000+ | 218 (8.2%) | 122 (4.1%) |
| Total | 2,660 (100.0%) | 3,000 (100.0%) |
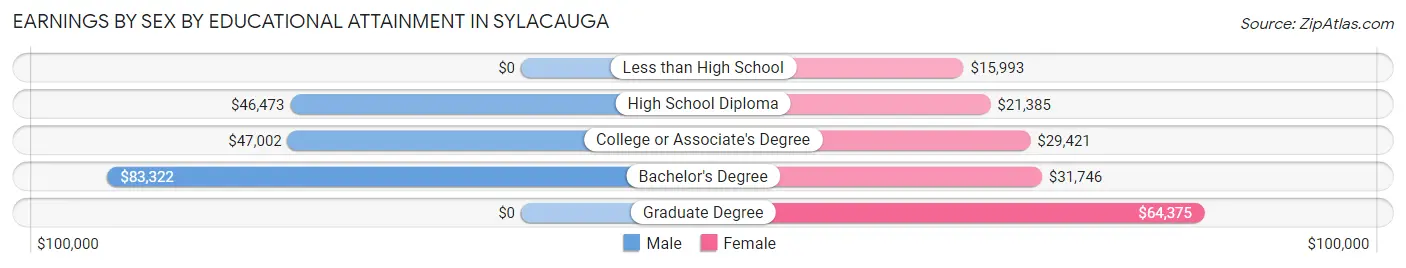
Earnings by Sex by Educational Attainment in Sylacauga
Average earnings in Sylacauga are $47,351 for men and $28,818 for women, a difference of 39.1%. Men with an educational attainment of bachelor's degree enjoy the highest average annual earnings of $83,322, while those with high school diploma education earn the least with $46,473. Women with an educational attainment of graduate degree earn the most with the average annual earnings of $64,375, while those with less than high school education have the smallest earnings of $15,993.
| Educational Attainment | Male Income | Female Income |
| Less than High School | - | - |
| High School Diploma | $46,473 | $21,385 |
| College or Associate's Degree | $47,002 | $29,421 |
| Bachelor's Degree | $83,322 | $31,746 |
| Graduate Degree | - | - |
| Total | $47,351 | $28,818 |
Family Income in Sylacauga
Family Income Brackets in Sylacauga
According to the Sylacauga family income data, there are 761 families falling into the $75,000 to $99,999 income range, which is the most common income bracket and makes up 21.7% of all families. Conversely, the $200,000+ income bracket is the least frequent group with only 102 families (2.9%) belonging to this category.
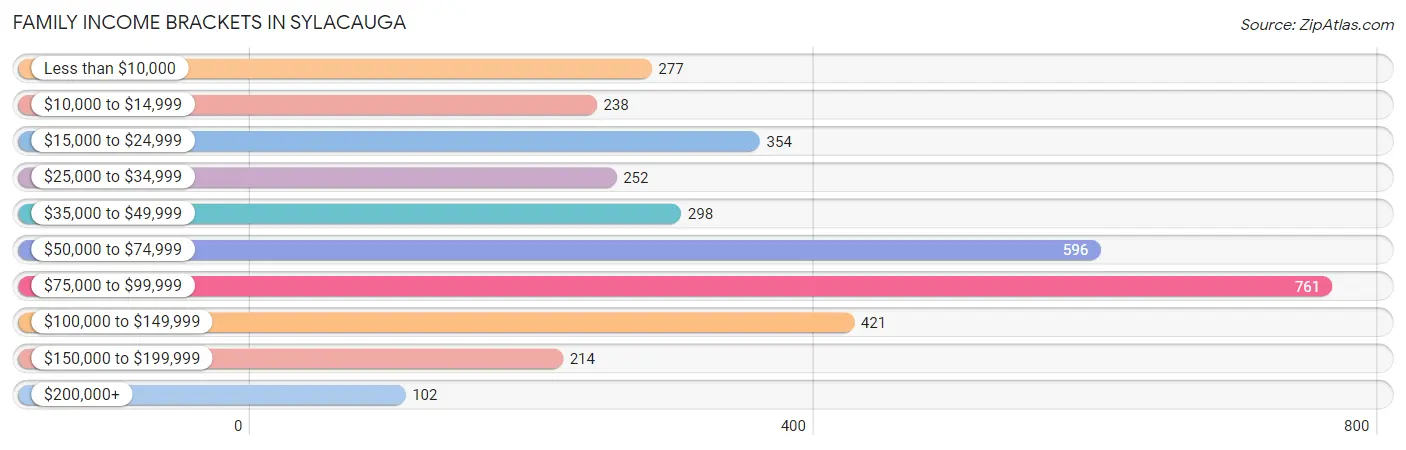
| Income Bracket | # Families | % Families |
| Less than $10,000 | 277 | 7.9% |
| $10,000 to $14,999 | 238 | 6.8% |
| $15,000 to $24,999 | 354 | 10.1% |
| $25,000 to $34,999 | 252 | 7.2% |
| $35,000 to $49,999 | 298 | 8.5% |
| $50,000 to $74,999 | 596 | 17.0% |
| $75,000 to $99,999 | 761 | 21.7% |
| $100,000 to $149,999 | 421 | 12.0% |
| $150,000 to $199,999 | 214 | 6.1% |
| $200,000+ | 102 | 2.9% |
Family Income by Famaliy Size in Sylacauga
5-person families (250 | 7.1%) account for the highest median family income in Sylacauga with $96,515 per family, while 2-person families (1,897 | 54.1%) have the highest median income of $29,488 per family member.
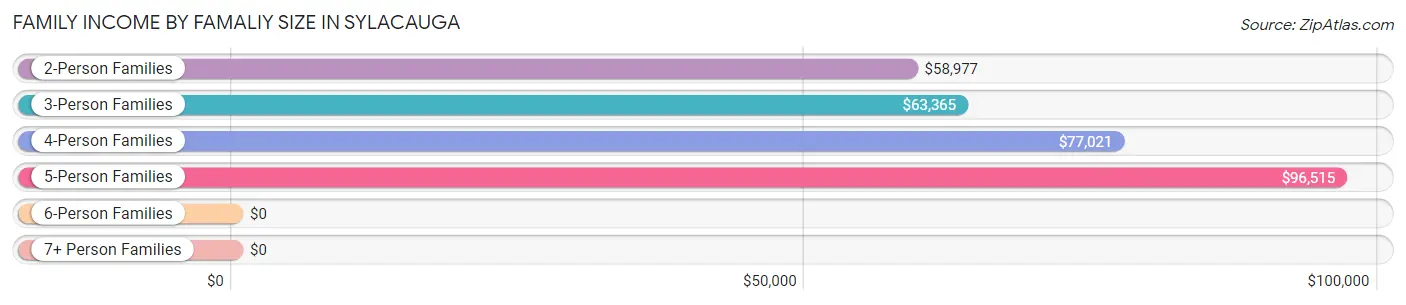
| Income Bracket | # Families | Median Income |
| 2-Person Families | 1,897 (54.1%) | $58,977 |
| 3-Person Families | 853 (24.3%) | $63,365 |
| 4-Person Families | 422 (12.0%) | $77,021 |
| 5-Person Families | 250 (7.1%) | $96,515 |
| 6-Person Families | 81 (2.3%) | $0 |
| 7+ Person Families | 3 (0.1%) | $0 |
| Total | 3,506 (100.0%) | $65,164 |
Family Income by Number of Earners in Sylacauga
The median family income in Sylacauga is $65,164, with families comprising 3+ earners (163) having the highest median family income of $166,875, while families with no earners (800) have the lowest median family income of $27,308, accounting for 4.6% and 22.8% of families, respectively.
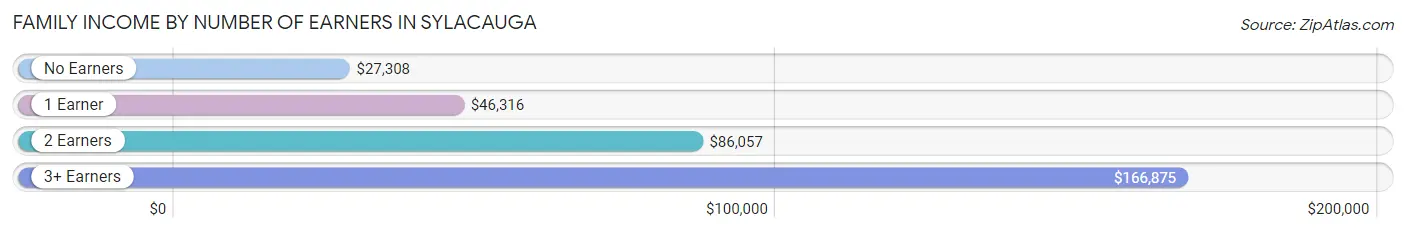
| Number of Earners | # Families | Median Income |
| No Earners | 800 (22.8%) | $27,308 |
| 1 Earner | 1,206 (34.4%) | $46,316 |
| 2 Earners | 1,337 (38.1%) | $86,057 |
| 3+ Earners | 163 (4.6%) | $166,875 |
| Total | 3,506 (100.0%) | $65,164 |
Household Income in Sylacauga
Household Income Brackets in Sylacauga
With 852 households falling in the category, the $75,000 to $99,999 income range is the most frequent in Sylacauga, accounting for 16.1% of all households. In contrast, only 111 households (2.1%) fall into the $200,000+ income bracket, making it the least populous group.
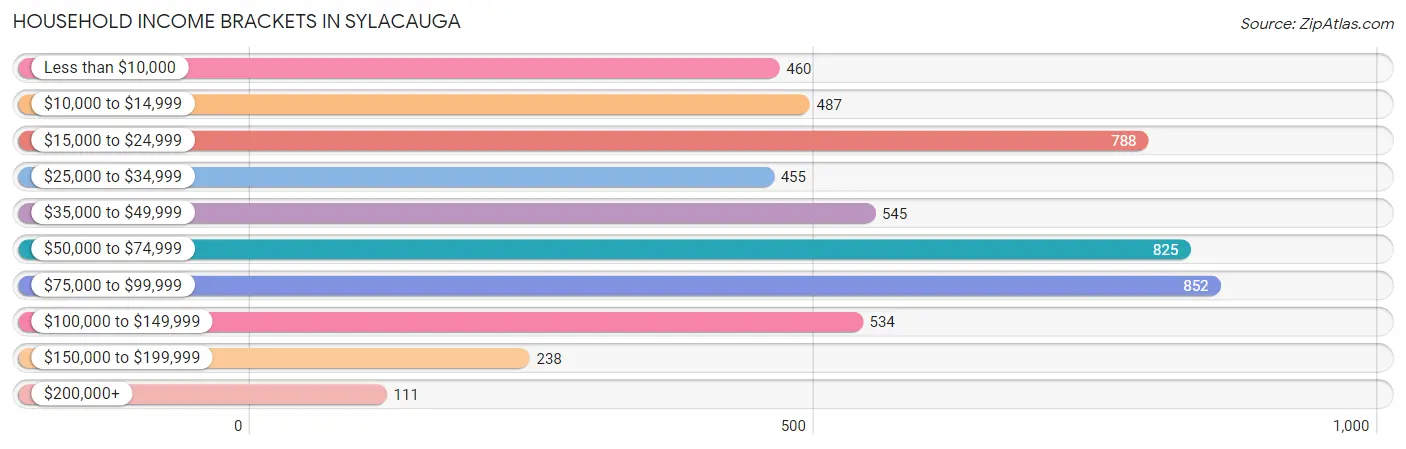
| Income Bracket | # Households | % Households |
| Less than $10,000 | 460 | 8.7% |
| $10,000 to $14,999 | 487 | 9.2% |
| $15,000 to $24,999 | 788 | 14.9% |
| $25,000 to $34,999 | 455 | 8.6% |
| $35,000 to $49,999 | 545 | 10.3% |
| $50,000 to $74,999 | 825 | 15.6% |
| $75,000 to $99,999 | 852 | 16.1% |
| $100,000 to $149,999 | 534 | 10.1% |
| $150,000 to $199,999 | 238 | 4.5% |
| $200,000+ | 111 | 2.1% |
Household Income by Householder Age in Sylacauga
The median household income in Sylacauga is $46,137, with the highest median household income of $56,671 found in the 45 to 64 years age bracket for the primary householder. A total of 1,821 households (34.4%) fall into this category. Meanwhile, the 15 to 24 years age bracket for the primary householder has the lowest median household income of $0, with 204 households (3.9%) in this group.
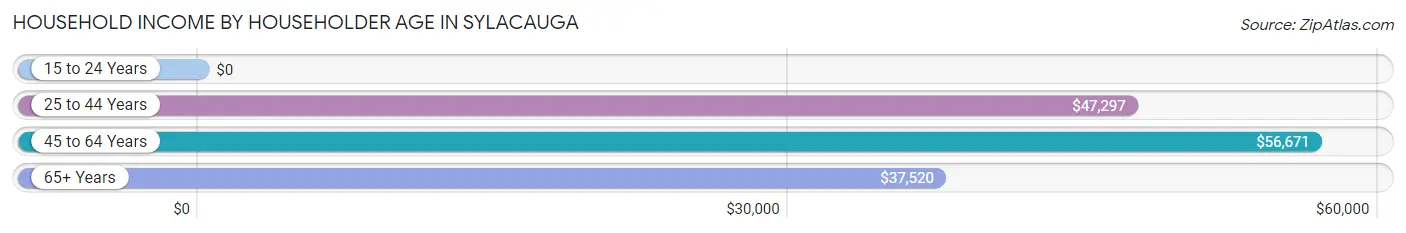
| Income Bracket | # Households | Median Income |
| 15 to 24 Years | 204 (3.9%) | $0 |
| 25 to 44 Years | 1,825 (34.5%) | $47,297 |
| 45 to 64 Years | 1,821 (34.4%) | $56,671 |
| 65+ Years | 1,441 (27.2%) | $37,520 |
| Total | 5,291 (100.0%) | $46,137 |
Poverty in Sylacauga
Income Below Poverty by Sex and Age in Sylacauga
With 14.0% poverty level for males and 29.0% for females among the residents of Sylacauga, under 5 year old males and 12 to 14 year old females are the most vulnerable to poverty, with 55 males (45.8%) and 120 females (56.9%) in their respective age groups living below the poverty level.
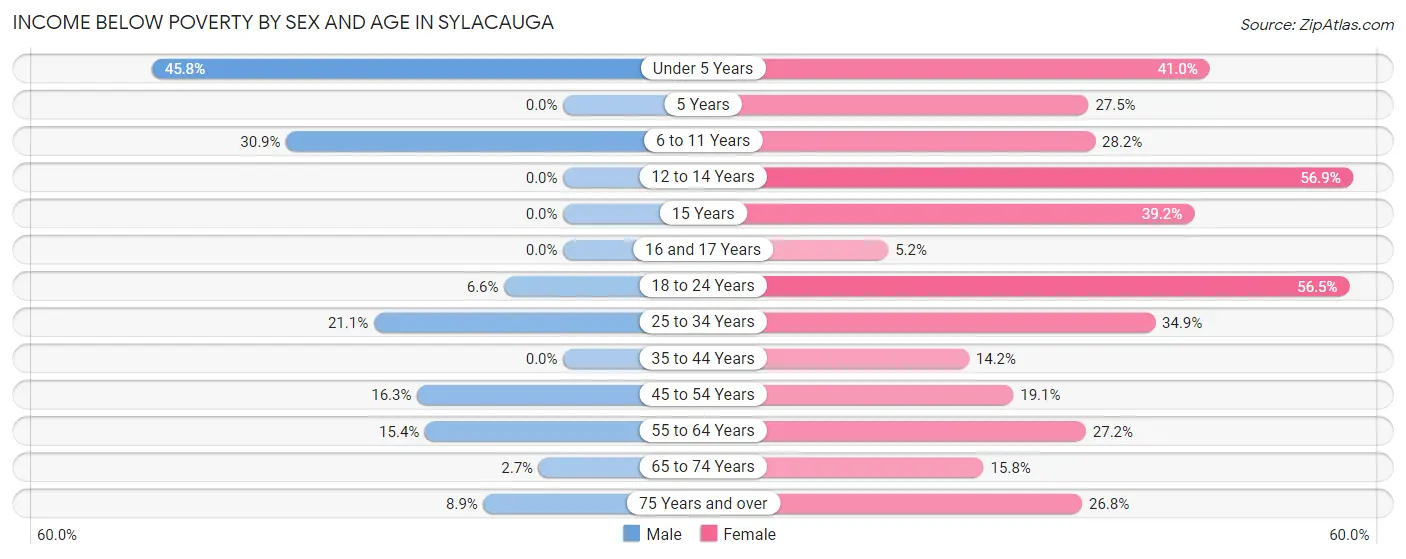
| Age Bracket | Male | Female |
| Under 5 Years | 55 (45.8%) | 186 (41.0%) |
| 5 Years | 0 (0.0%) | 50 (27.5%) |
| 6 to 11 Years | 182 (30.8%) | 178 (28.2%) |
| 12 to 14 Years | 0 (0.0%) | 120 (56.9%) |
| 15 Years | 0 (0.0%) | 71 (39.2%) |
| 16 and 17 Years | 0 (0.0%) | 6 (5.2%) |
| 18 to 24 Years | 18 (6.6%) | 234 (56.5%) |
| 25 to 34 Years | 236 (21.1%) | 418 (34.9%) |
| 35 to 44 Years | 0 (0.0%) | 89 (14.1%) |
| 45 to 54 Years | 95 (16.3%) | 148 (19.1%) |
| 55 to 64 Years | 115 (15.4%) | 259 (27.2%) |
| 65 to 74 Years | 20 (2.7%) | 97 (15.8%) |
| 75 Years and over | 18 (8.9%) | 152 (26.8%) |
| Total | 739 (14.0%) | 2,008 (29.0%) |
Income Above Poverty by Sex and Age in Sylacauga
According to the poverty statistics in Sylacauga, males aged 5 years and females aged 16 and 17 years are the age groups that are most secure financially, with 100.0% of males and 94.8% of females in these age groups living above the poverty line.
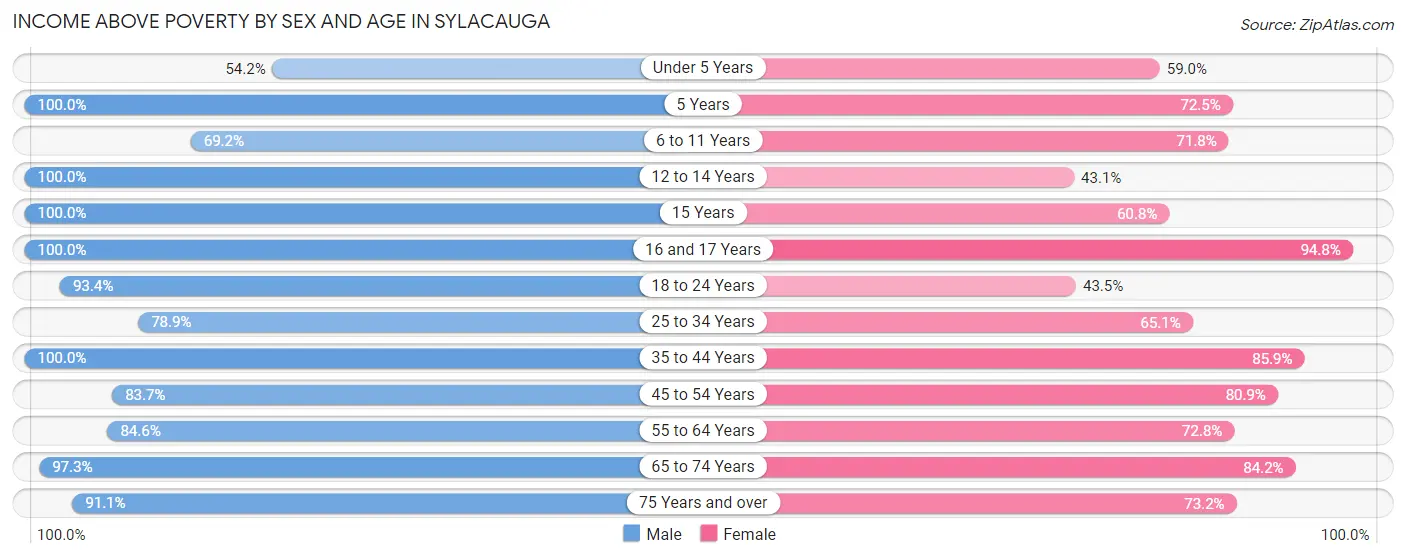
| Age Bracket | Male | Female |
| Under 5 Years | 65 (54.2%) | 268 (59.0%) |
| 5 Years | 8 (100.0%) | 132 (72.5%) |
| 6 to 11 Years | 408 (69.2%) | 453 (71.8%) |
| 12 to 14 Years | 225 (100.0%) | 91 (43.1%) |
| 15 Years | 51 (100.0%) | 110 (60.8%) |
| 16 and 17 Years | 155 (100.0%) | 110 (94.8%) |
| 18 to 24 Years | 256 (93.4%) | 180 (43.5%) |
| 25 to 34 Years | 883 (78.9%) | 780 (65.1%) |
| 35 to 44 Years | 453 (100.0%) | 540 (85.9%) |
| 45 to 54 Years | 489 (83.7%) | 627 (80.9%) |
| 55 to 64 Years | 632 (84.6%) | 694 (72.8%) |
| 65 to 74 Years | 714 (97.3%) | 517 (84.2%) |
| 75 Years and over | 185 (91.1%) | 416 (73.2%) |
| Total | 4,524 (86.0%) | 4,918 (71.0%) |
Income Below Poverty Among Married-Couple Families in Sylacauga
The poverty statistics for married-couple families in Sylacauga show that 7.0% or 163 of the total 2,322 families live below the poverty line. Families with no children have the highest poverty rate of 9.1%, comprising of 130 families. On the other hand, families with 3 or 4 children have the lowest poverty rate of 0.0%, which includes 0 families.
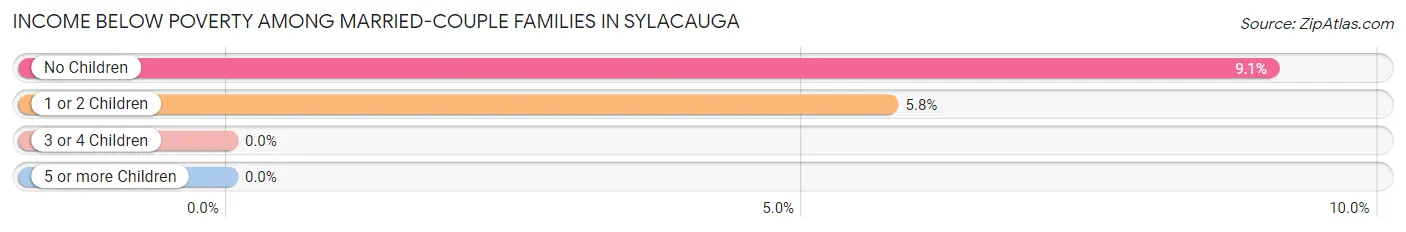
| Children | Above Poverty | Below Poverty |
| No Children | 1,305 (90.9%) | 130 (9.1%) |
| 1 or 2 Children | 541 (94.3%) | 33 (5.8%) |
| 3 or 4 Children | 313 (100.0%) | 0 (0.0%) |
| 5 or more Children | 0 (0.0%) | 0 (0.0%) |
| Total | 2,159 (93.0%) | 163 (7.0%) |
Income Below Poverty Among Single-Parent Households in Sylacauga
According to the poverty data in Sylacauga, 32.6% or 88 single-father households and 56.5% or 516 single-mother households are living below the poverty line. Among single-father households, those with no children have the highest poverty rate, with 51 households (45.5%) experiencing poverty. Likewise, among single-mother households, those with 1 or 2 children have the highest poverty rate, with 494 households (70.8%) falling below the poverty line.
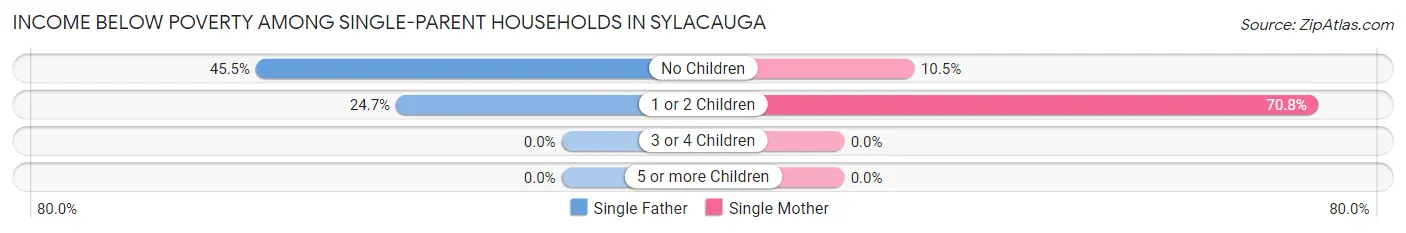
| Children | Single Father | Single Mother |
| No Children | 51 (45.5%) | 22 (10.5%) |
| 1 or 2 Children | 37 (24.7%) | 494 (70.8%) |
| 3 or 4 Children | 0 (0.0%) | 0 (0.0%) |
| 5 or more Children | 0 (0.0%) | 0 (0.0%) |
| Total | 88 (32.6%) | 516 (56.5%) |
Income Below Poverty Among Married-Couple vs Single-Parent Households in Sylacauga
The poverty data for Sylacauga shows that 163 of the married-couple family households (7.0%) and 604 of the single-parent households (51.0%) are living below the poverty level. Within the married-couple family households, those with no children have the highest poverty rate, with 130 households (9.1%) falling below the poverty line. Among the single-parent households, those with 1 or 2 children have the highest poverty rate, with 531 household (62.6%) living below poverty.
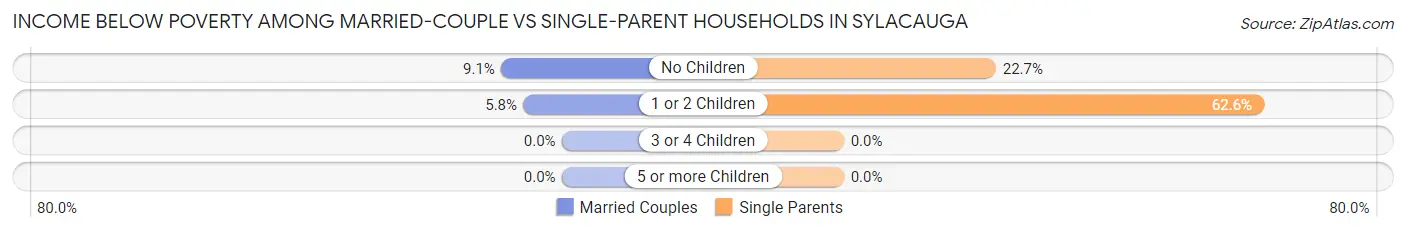
| Children | Married-Couple Families | Single-Parent Households |
| No Children | 130 (9.1%) | 73 (22.7%) |
| 1 or 2 Children | 33 (5.8%) | 531 (62.6%) |
| 3 or 4 Children | 0 (0.0%) | 0 (0.0%) |
| 5 or more Children | 0 (0.0%) | 0 (0.0%) |
| Total | 163 (7.0%) | 604 (51.0%) |
Race in Sylacauga
The most populous races in Sylacauga are White / Caucasian (7,990 | 64.1%), Black / African American (3,882 | 31.1%), and Two or more Races (359 | 2.9%).
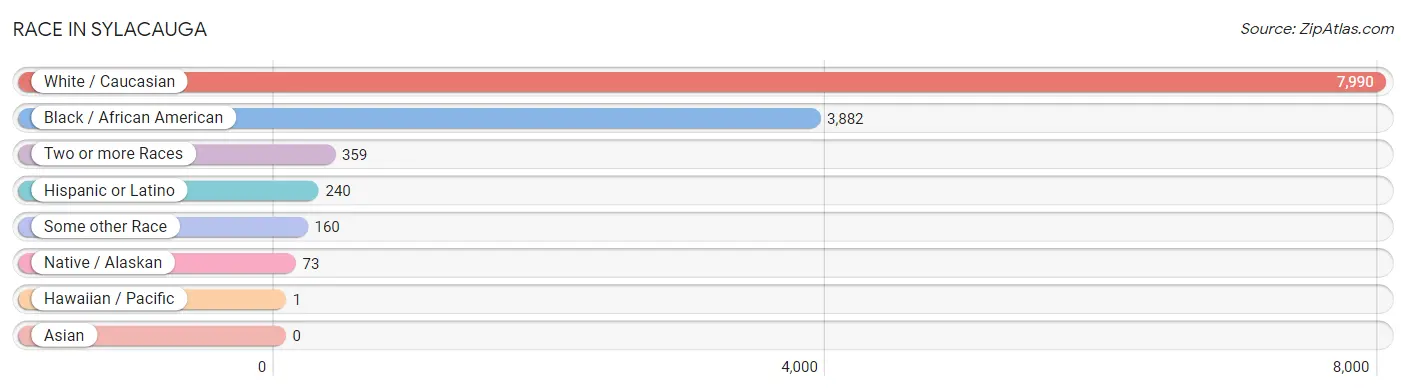
| Race | # Population | % Population |
| Asian | 0 | 0.0% |
| Black / African American | 3,882 | 31.1% |
| Hawaiian / Pacific | 1 | 0.0% |
| Hispanic or Latino | 240 | 1.9% |
| Native / Alaskan | 73 | 0.6% |
| White / Caucasian | 7,990 | 64.1% |
| Two or more Races | 359 | 2.9% |
| Some other Race | 160 | 1.3% |
| Total | 12,465 | 100.0% |
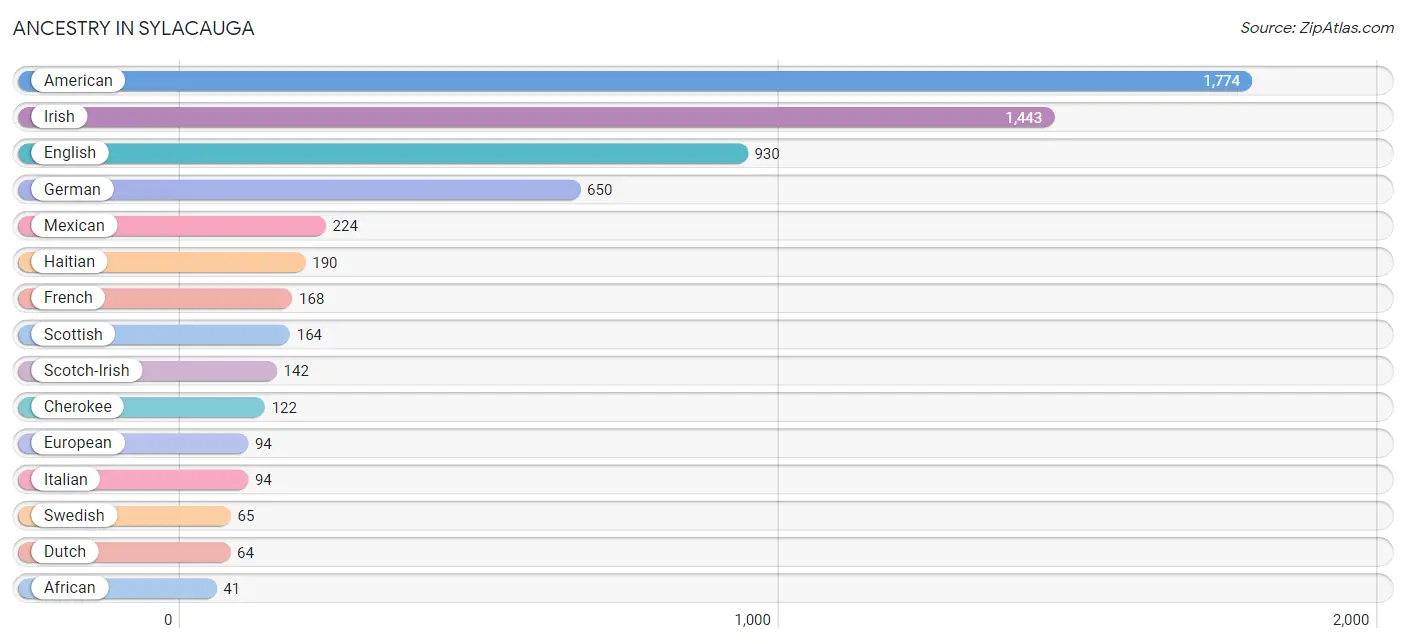
Ancestry in Sylacauga
The most populous ancestries reported in Sylacauga are American (1,774 | 14.2%), Irish (1,443 | 11.6%), English (930 | 7.5%), German (650 | 5.2%), and Mexican (224 | 1.8%), together accounting for 40.3% of all Sylacauga residents.
| Ancestry | # Population | % Population |
| African | 41 | 0.3% |
| American | 1,774 | 14.2% |
| British | 28 | 0.2% |
| Canadian | 3 | 0.0% |
| Central American | 16 | 0.1% |
| Cherokee | 122 | 1.0% |
| Czech | 17 | 0.1% |
| Dutch | 64 | 0.5% |
| English | 930 | 7.5% |
| European | 94 | 0.7% |
| Fijian | 1 | 0.0% |
| French | 168 | 1.3% |
| German | 650 | 5.2% |
| Greek | 6 | 0.1% |
| Haitian | 190 | 1.5% |
| Irish | 1,443 | 11.6% |
| Italian | 94 | 0.7% |
| Mexican | 224 | 1.8% |
| Navajo | 6 | 0.1% |
| Northern European | 22 | 0.2% |
| Norwegian | 6 | 0.1% |
| Pakistani | 29 | 0.2% |
| Panamanian | 16 | 0.1% |
| Polish | 17 | 0.1% |
| Scotch-Irish | 142 | 1.1% |
| Scottish | 164 | 1.3% |
| Subsaharan African | 41 | 0.3% |
| Swedish | 65 | 0.5% |
| Swiss | 5 | 0.0% |
| Welsh | 33 | 0.3% | View All 30 Rows |
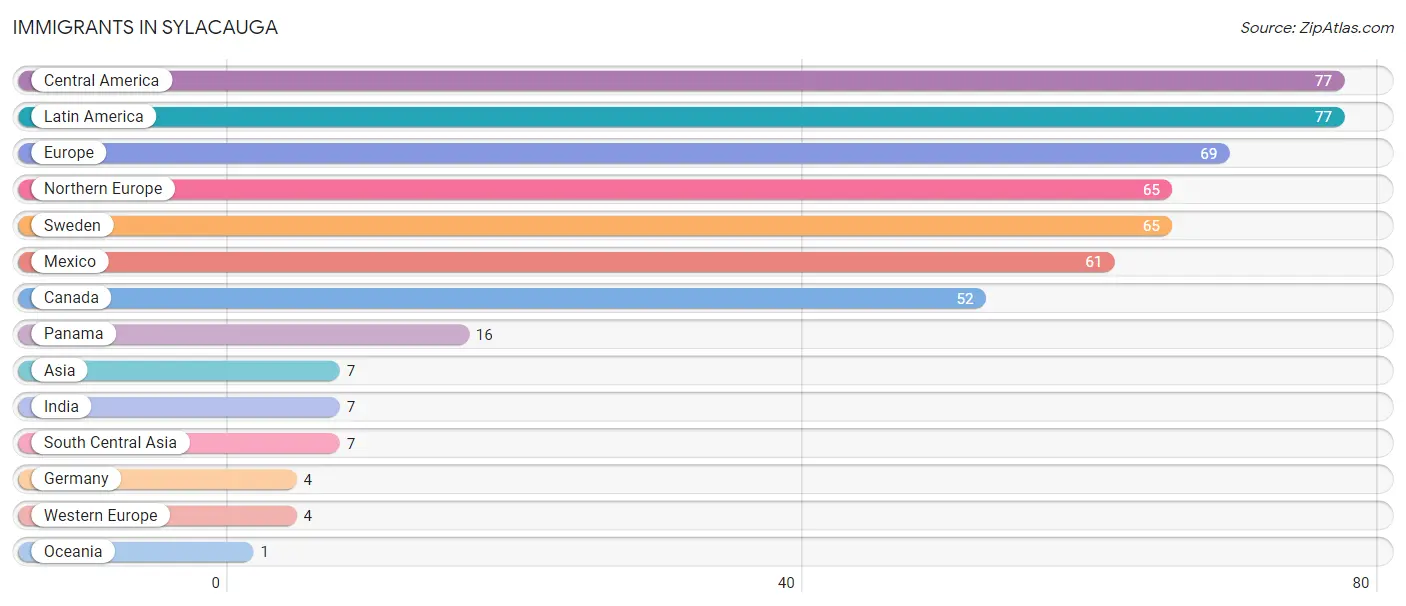
Immigrants in Sylacauga
The most numerous immigrant groups reported in Sylacauga came from Central America (77 | 0.6%), Latin America (77 | 0.6%), Europe (69 | 0.5%), Northern Europe (65 | 0.5%), and Sweden (65 | 0.5%), together accounting for 2.8% of all Sylacauga residents.
| Immigration Origin | # Population | % Population |
| Asia | 7 | 0.1% |
| Canada | 52 | 0.4% |
| Central America | 77 | 0.6% |
| Europe | 69 | 0.5% |
| Germany | 4 | 0.0% |
| India | 7 | 0.1% |
| Latin America | 77 | 0.6% |
| Mexico | 61 | 0.5% |
| Northern Europe | 65 | 0.5% |
| Oceania | 1 | 0.0% |
| Panama | 16 | 0.1% |
| South Central Asia | 7 | 0.1% |
| Sweden | 65 | 0.5% |
| Western Europe | 4 | 0.0% | View All 14 Rows |
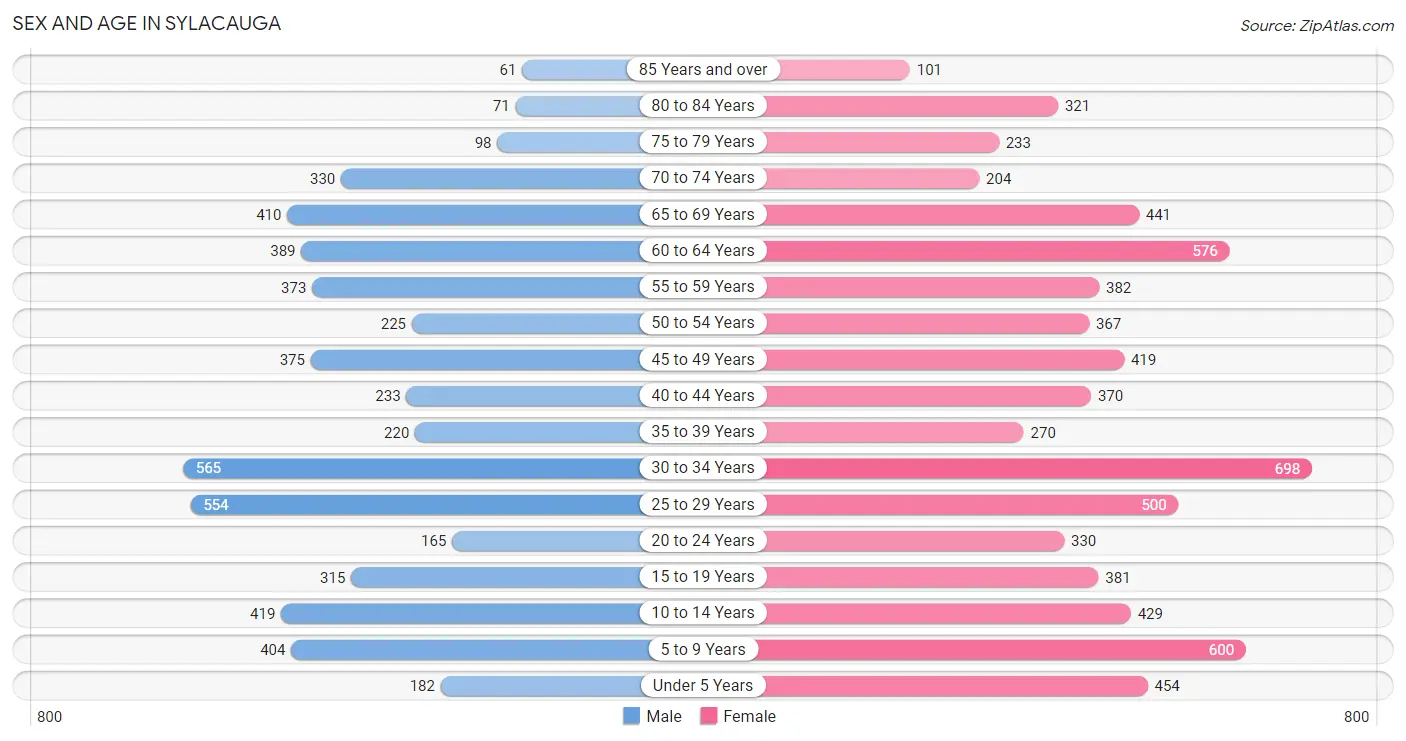
Sex and Age in Sylacauga
Sex and Age in Sylacauga
The most populous age groups in Sylacauga are 30 to 34 Years (565 | 10.5%) for men and 30 to 34 Years (698 | 9.9%) for women.
| Age Bracket | Male | Female |
| Under 5 Years | 182 (3.4%) | 454 (6.4%) |
| 5 to 9 Years | 404 (7.5%) | 600 (8.5%) |
| 10 to 14 Years | 419 (7.8%) | 429 (6.1%) |
| 15 to 19 Years | 315 (5.9%) | 381 (5.4%) |
| 20 to 24 Years | 165 (3.1%) | 330 (4.7%) |
| 25 to 29 Years | 554 (10.3%) | 500 (7.1%) |
| 30 to 34 Years | 565 (10.5%) | 698 (9.9%) |
| 35 to 39 Years | 220 (4.1%) | 270 (3.8%) |
| 40 to 44 Years | 233 (4.3%) | 370 (5.2%) |
| 45 to 49 Years | 375 (7.0%) | 419 (5.9%) |
| 50 to 54 Years | 225 (4.2%) | 367 (5.2%) |
| 55 to 59 Years | 373 (6.9%) | 382 (5.4%) |
| 60 to 64 Years | 389 (7.2%) | 576 (8.1%) |
| 65 to 69 Years | 410 (7.6%) | 441 (6.2%) |
| 70 to 74 Years | 330 (6.1%) | 204 (2.9%) |
| 75 to 79 Years | 98 (1.8%) | 233 (3.3%) |
| 80 to 84 Years | 71 (1.3%) | 321 (4.5%) |
| 85 Years and over | 61 (1.1%) | 101 (1.4%) |
| Total | 5,389 (100.0%) | 7,076 (100.0%) |
Families and Households in Sylacauga
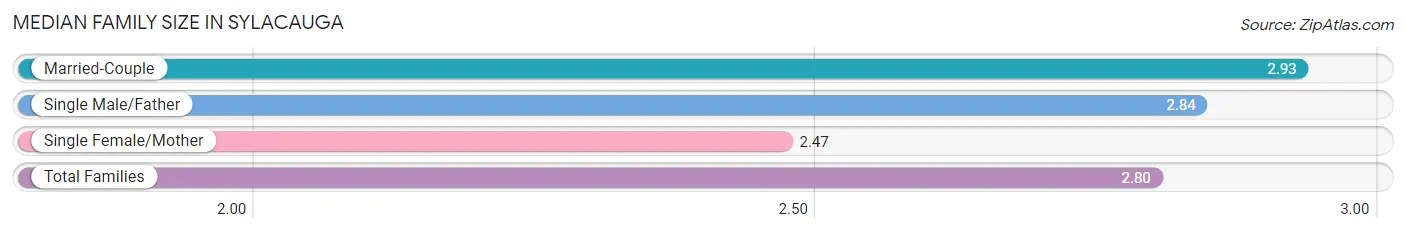
Median Family Size in Sylacauga
The median family size in Sylacauga is 2.80 persons per family, with married-couple families (2,322 | 66.2%) accounting for the largest median family size of 2.93 persons per family. On the other hand, single female/mother families (914 | 26.1%) represent the smallest median family size with 2.47 persons per family.
| Family Type | # Families | Family Size |
| Married-Couple | 2,322 (66.2%) | 2.93 |
| Single Male/Father | 270 (7.7%) | 2.84 |
| Single Female/Mother | 914 (26.1%) | 2.47 |
| Total Families | 3,506 (100.0%) | 2.80 |
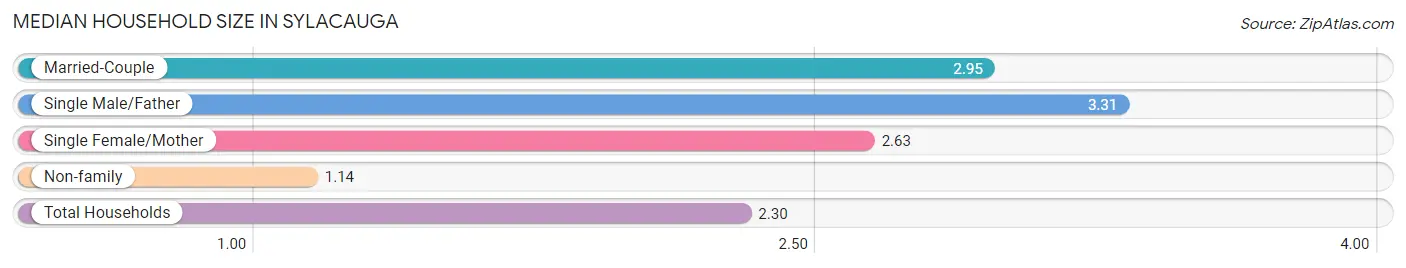
Median Household Size in Sylacauga
The median household size in Sylacauga is 2.30 persons per household, with single male/father households (270 | 5.1%) accounting for the largest median household size of 3.31 persons per household. non-family households (1,785 | 33.7%) represent the smallest median household size with 1.14 persons per household.
| Household Type | # Households | Household Size |
| Married-Couple | 2,322 (43.9%) | 2.95 |
| Single Male/Father | 270 (5.1%) | 3.31 |
| Single Female/Mother | 914 (17.3%) | 2.63 |
| Non-family | 1,785 (33.7%) | 1.14 |
| Total Households | 5,291 (100.0%) | 2.30 |
Household Size by Marriage Status in Sylacauga
Out of a total of 5,291 households in Sylacauga, 3,506 (66.3%) are family households, while 1,785 (33.7%) are nonfamily households. The most numerous type of family households are 2-person households, comprising 1,697, and the most common type of nonfamily households are 1-person households, comprising 1,621.
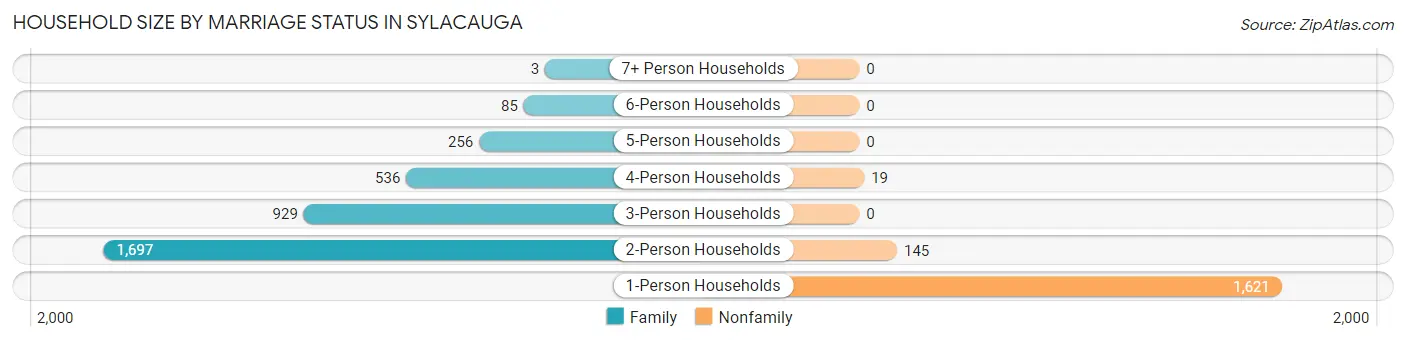
| Household Size | Family Households | Nonfamily Households |
| 1-Person Households | - | 1,621 (30.6%) |
| 2-Person Households | 1,697 (32.1%) | 145 (2.7%) |
| 3-Person Households | 929 (17.6%) | 0 (0.0%) |
| 4-Person Households | 536 (10.1%) | 19 (0.4%) |
| 5-Person Households | 256 (4.8%) | 0 (0.0%) |
| 6-Person Households | 85 (1.6%) | 0 (0.0%) |
| 7+ Person Households | 3 (0.1%) | 0 (0.0%) |
| Total | 3,506 (66.3%) | 1,785 (33.7%) |
Female Fertility in Sylacauga
Fertility by Age in Sylacauga
Average fertility rate in Sylacauga is 87.0 births per 1,000 women. Women in the age bracket of 20 to 34 years have the highest fertility rate with 157.0 births per 1,000 women. Women in the age bracket of 20 to 34 years acount for 92.3% of all women with births.
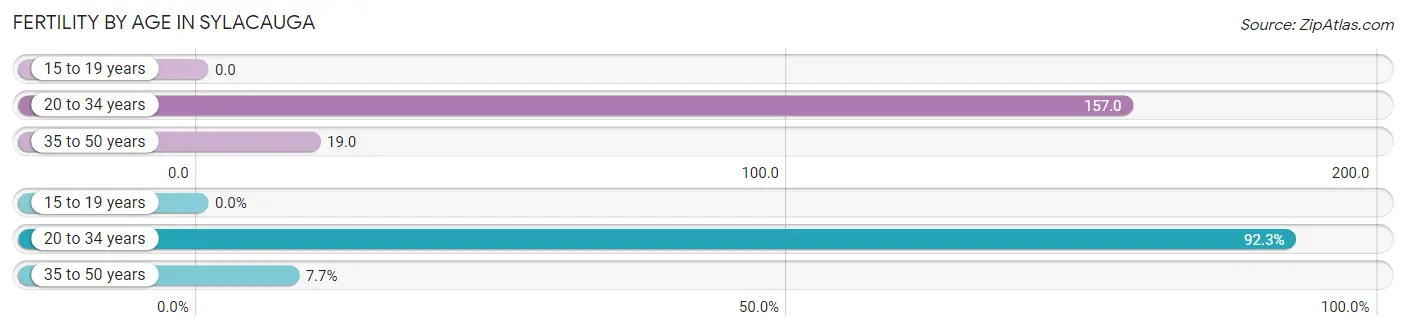
| Age Bracket | Women with Births | Births / 1,000 Women |
| 15 to 19 years | 0 (0.0%) | 0.0 |
| 20 to 34 years | 240 (92.3%) | 157.0 |
| 35 to 50 years | 20 (7.7%) | 19.0 |
| Total | 260 (100.0%) | 87.0 |
Fertility by Age by Marriage Status in Sylacauga
42.7% of women with births (260) in Sylacauga are married. The highest percentage of unmarried women with births falls into 35 to 50 years age bracket with 100.0% of them unmarried at the time of birth, while the lowest percentage of unmarried women with births belong to 20 to 34 years age bracket with 53.7% of them unmarried.
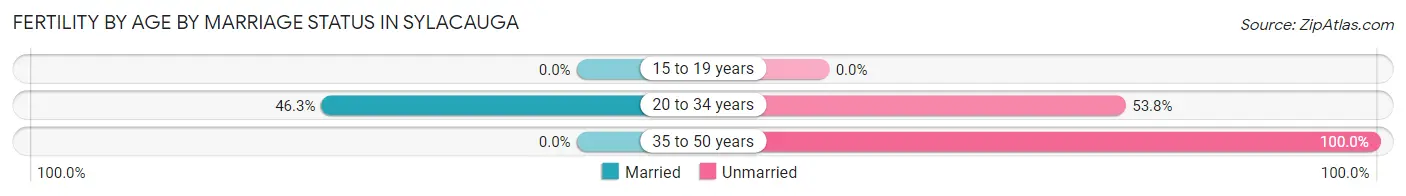
| Age Bracket | Married | Unmarried |
| 15 to 19 years | 0 (0.0%) | 0 (0.0%) |
| 20 to 34 years | 111 (46.3%) | 129 (53.7%) |
| 35 to 50 years | 0 (0.0%) | 20 (100.0%) |
| Total | 111 (42.7%) | 149 (57.3%) |
Fertility by Education in Sylacauga
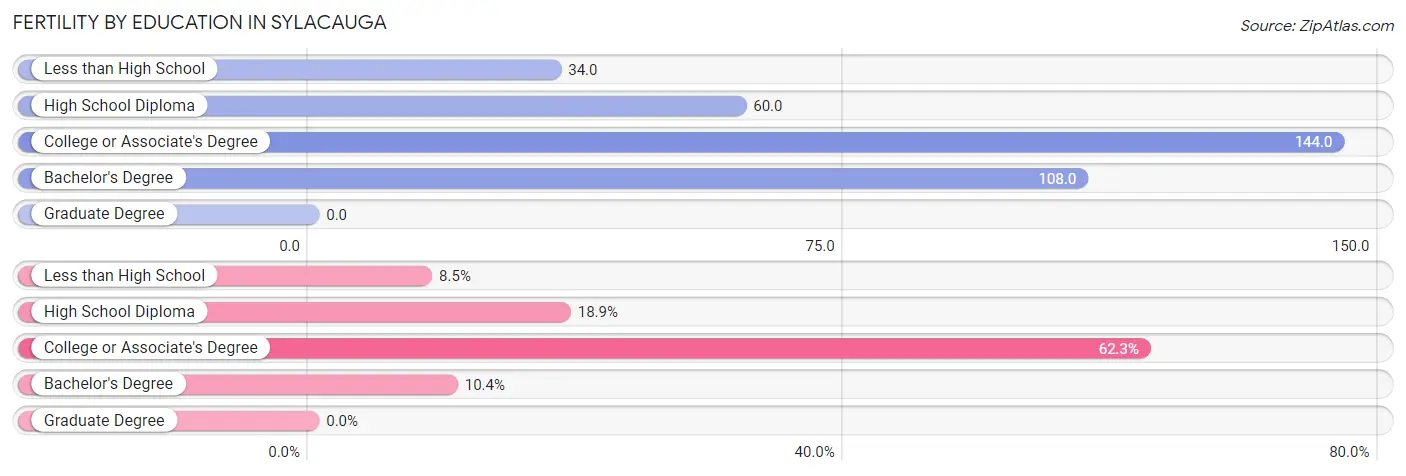
| Educational Attainment | Women with Births | Births / 1,000 Women |
| Less than High School | 22 (8.5%) | 34.0 |
| High School Diploma | 49 (18.9%) | 60.0 |
| College or Associate's Degree | 162 (62.3%) | 144.0 |
| Bachelor's Degree | 27 (10.4%) | 108.0 |
| Graduate Degree | 0 (0.0%) | 0.0 |
| Total | 260 (100.0%) | 87.0 |
Fertility by Education by Marriage Status in Sylacauga
57.3% of women with births in Sylacauga are unmarried. Women with the educational attainment of bachelor's degree are most likely to be married with 100.0% of them married at childbirth, while women with the educational attainment of less than high school are least likely to be married with 100.0% of them unmarried at childbirth.
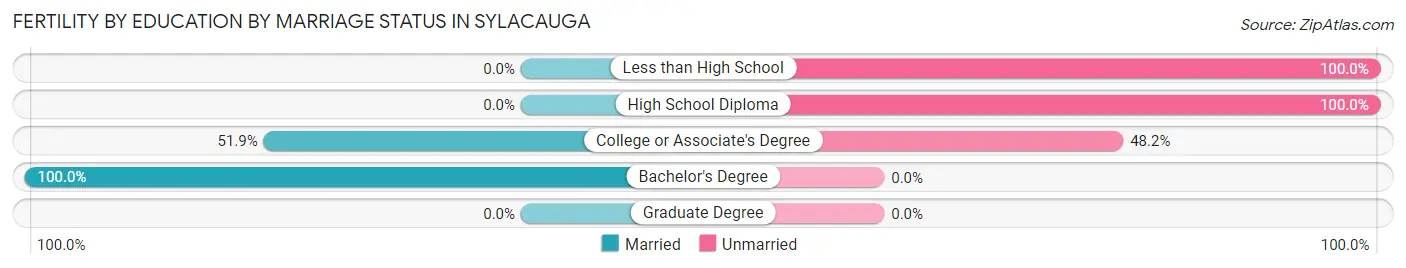
| Educational Attainment | Married | Unmarried |
| Less than High School | 0 (0.0%) | 22 (100.0%) |
| High School Diploma | 0 (0.0%) | 49 (100.0%) |
| College or Associate's Degree | 84 (51.8%) | 78 (48.1%) |
| Bachelor's Degree | 27 (100.0%) | 0 (0.0%) |
| Graduate Degree | 0 (0.0%) | 0 (0.0%) |
| Total | 111 (42.7%) | 149 (57.3%) |
Employment Characteristics in Sylacauga
Employment by Class of Employer in Sylacauga
Among the 4,985 employed individuals in Sylacauga, private company employees (3,390 | 68.0%), local government employees (429 | 8.6%), and state government employees (329 | 6.6%) make up the most common classes of employment.
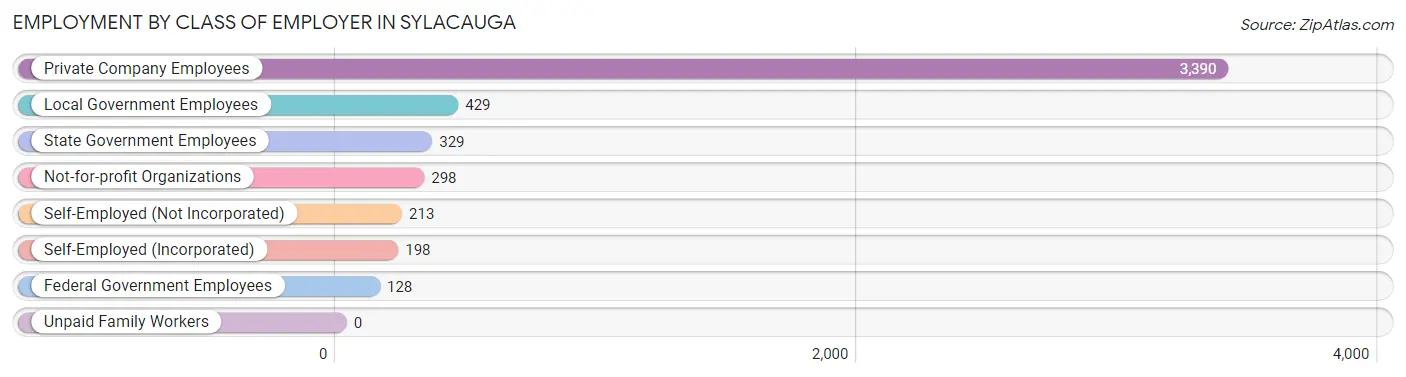
| Employer Class | # Employees | % Employees |
| Private Company Employees | 3,390 | 68.0% |
| Self-Employed (Incorporated) | 198 | 4.0% |
| Self-Employed (Not Incorporated) | 213 | 4.3% |
| Not-for-profit Organizations | 298 | 6.0% |
| Local Government Employees | 429 | 8.6% |
| State Government Employees | 329 | 6.6% |
| Federal Government Employees | 128 | 2.6% |
| Unpaid Family Workers | 0 | 0.0% |
| Total | 4,985 | 100.0% |
Employment Status by Age in Sylacauga
According to the labor force statistics for Sylacauga, out of the total population over 16 years of age (9,745), 57.6% or 5,613 individuals are in the labor force, with 8.9% or 500 of them unemployed. The age group with the highest labor force participation rate is 25 to 29 years, with 89.6% or 944 individuals in the labor force. Within the labor force, the 16 to 19 years age range has the highest percentage of unemployed individuals, with 35.1% or 53 of them being unemployed.
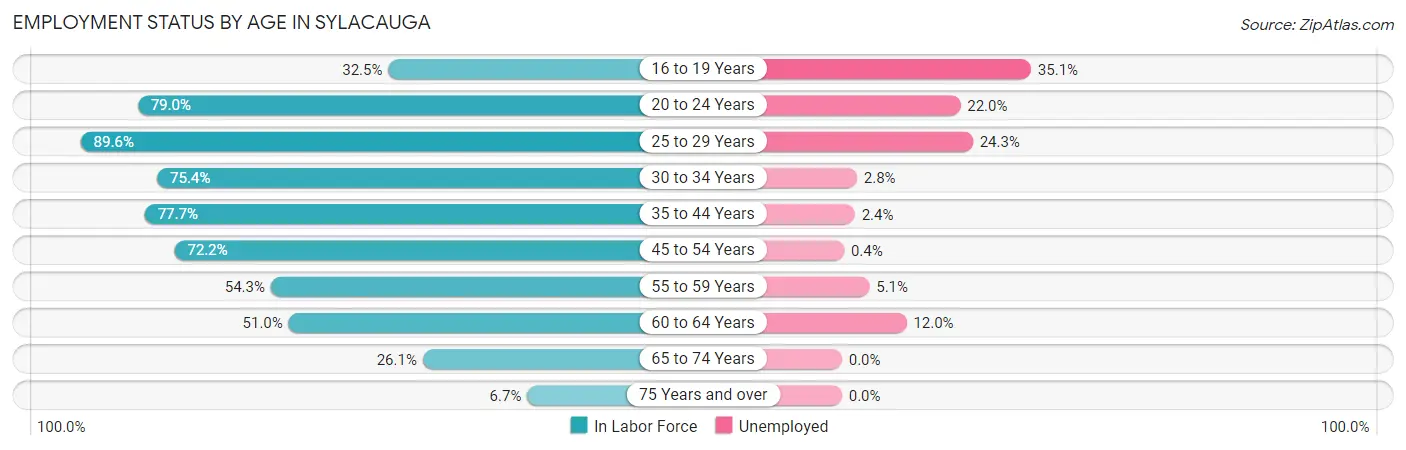
| Age Bracket | In Labor Force | Unemployed |
| 16 to 19 Years | 151 (32.5%) | 53 (35.1%) |
| 20 to 24 Years | 391 (79.0%) | 86 (22.0%) |
| 25 to 29 Years | 944 (89.6%) | 229 (24.3%) |
| 30 to 34 Years | 952 (75.4%) | 27 (2.8%) |
| 35 to 44 Years | 849 (77.7%) | 20 (2.4%) |
| 45 to 54 Years | 1,001 (72.2%) | 4 (0.4%) |
| 55 to 59 Years | 410 (54.3%) | 21 (5.1%) |
| 60 to 64 Years | 492 (51.0%) | 59 (12.0%) |
| 65 to 74 Years | 361 (26.1%) | 0 (0.0%) |
| 75 Years and over | 59 (6.7%) | 0 (0.0%) |
| Total | 5,613 (57.6%) | 500 (8.9%) |
Employment Status by Educational Attainment in Sylacauga
According to labor force statistics for Sylacauga, 71.3% of individuals (4,646) out of the total population between 25 and 64 years of age (6,516) are in the labor force, with 7.7% or 358 of them being unemployed. The group with the highest labor force participation rate are those with the educational attainment of bachelor's degree or higher, with 93.7% or 1,004 individuals in the labor force. Within the labor force, individuals with less than high school education have the highest percentage of unemployment, with 32.6% or 108 of them being unemployed.
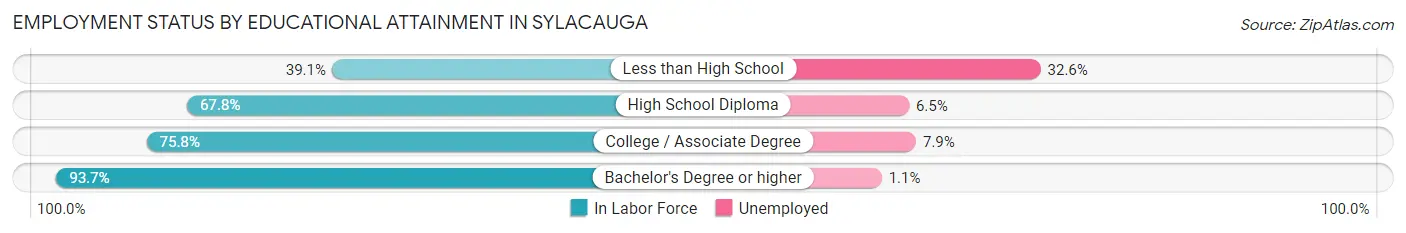
| Educational Attainment | In Labor Force | Unemployed |
| Less than High School | 331 (39.1%) | 276 (32.6%) |
| High School Diploma | 1,467 (67.8%) | 141 (6.5%) |
| College / Associate Degree | 1,844 (75.8%) | 192 (7.9%) |
| Bachelor's Degree or higher | 1,004 (93.7%) | 12 (1.1%) |
| Total | 4,646 (71.3%) | 502 (7.7%) |
Employment Occupations by Sex in Sylacauga
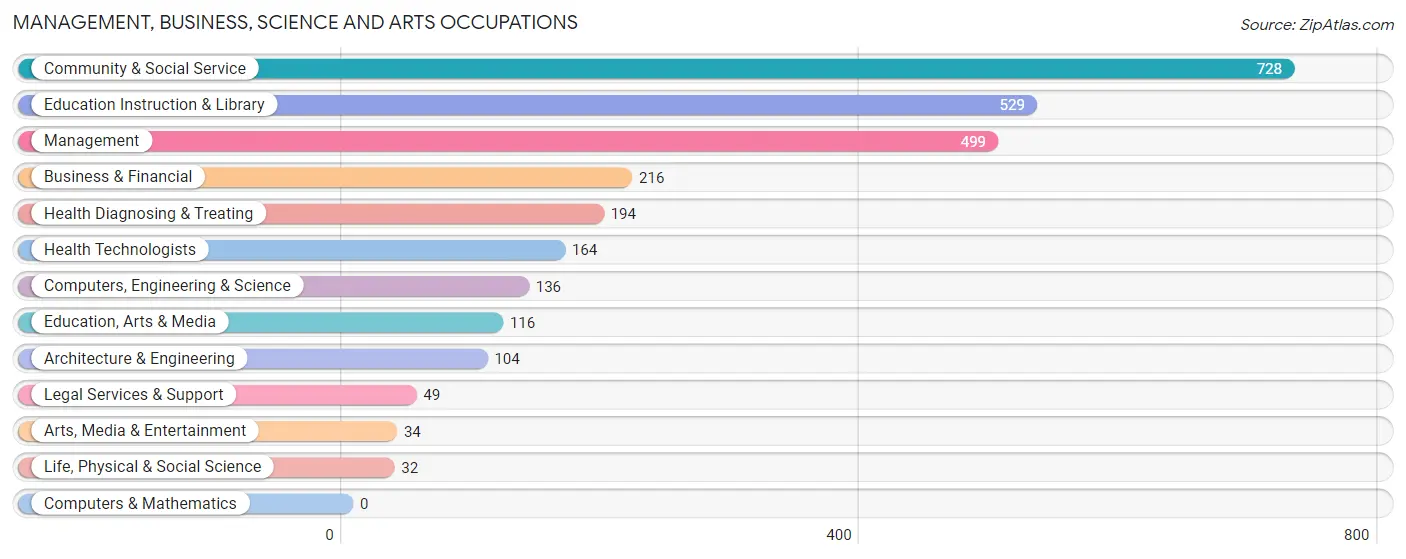
Management, Business, Science and Arts Occupations
The most common Management, Business, Science and Arts occupations in Sylacauga are Community & Social Service (728 | 14.2%), Education Instruction & Library (529 | 10.3%), Management (499 | 9.8%), Business & Financial (216 | 4.2%), and Health Diagnosing & Treating (194 | 3.8%).
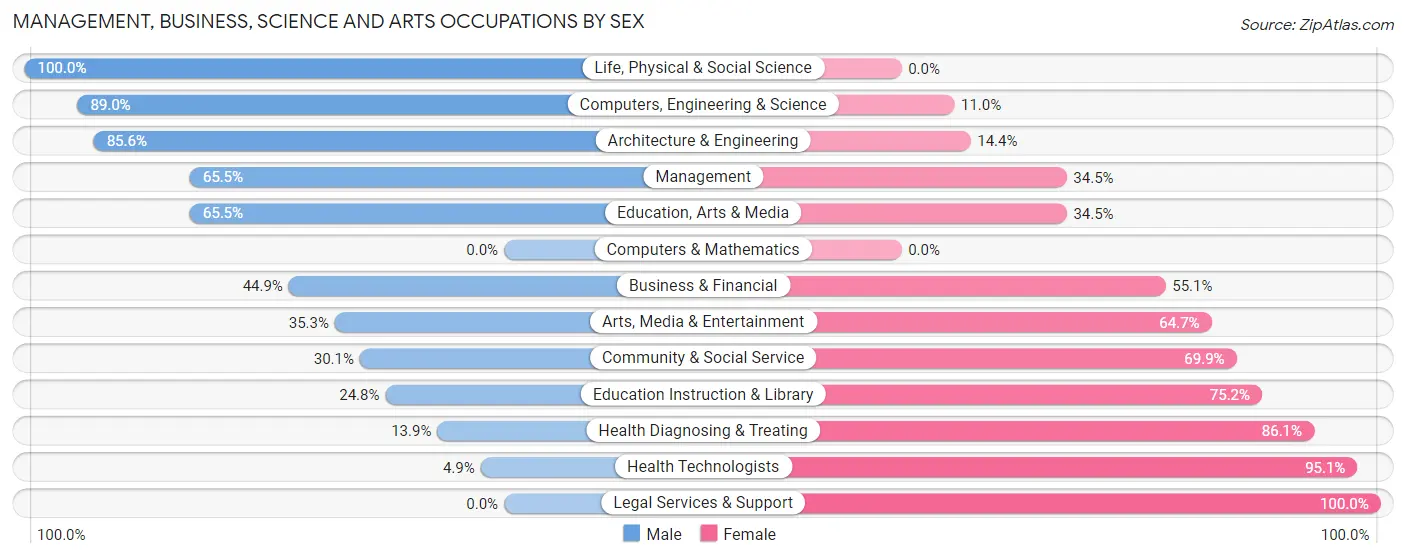
Management, Business, Science and Arts Occupations by Sex
Within the Management, Business, Science and Arts occupations in Sylacauga, the most male-oriented occupations are Life, Physical & Social Science (100.0%), Computers, Engineering & Science (89.0%), and Architecture & Engineering (85.6%), while the most female-oriented occupations are Legal Services & Support (100.0%), Health Technologists (95.1%), and Health Diagnosing & Treating (86.1%).
| Occupation | Male | Female |
| Management | 327 (65.5%) | 172 (34.5%) |
| Business & Financial | 97 (44.9%) | 119 (55.1%) |
| Computers, Engineering & Science | 121 (89.0%) | 15 (11.0%) |
| Computers & Mathematics | 0 (0.0%) | 0 (0.0%) |
| Architecture & Engineering | 89 (85.6%) | 15 (14.4%) |
| Life, Physical & Social Science | 32 (100.0%) | 0 (0.0%) |
| Community & Social Service | 219 (30.1%) | 509 (69.9%) |
| Education, Arts & Media | 76 (65.5%) | 40 (34.5%) |
| Legal Services & Support | 0 (0.0%) | 49 (100.0%) |
| Education Instruction & Library | 131 (24.8%) | 398 (75.2%) |
| Arts, Media & Entertainment | 12 (35.3%) | 22 (64.7%) |
| Health Diagnosing & Treating | 27 (13.9%) | 167 (86.1%) |
| Health Technologists | 8 (4.9%) | 156 (95.1%) |
| Total (Category) | 791 (44.6%) | 982 (55.4%) |
| Total (Overall) | 2,497 (48.9%) | 2,613 (51.1%) |
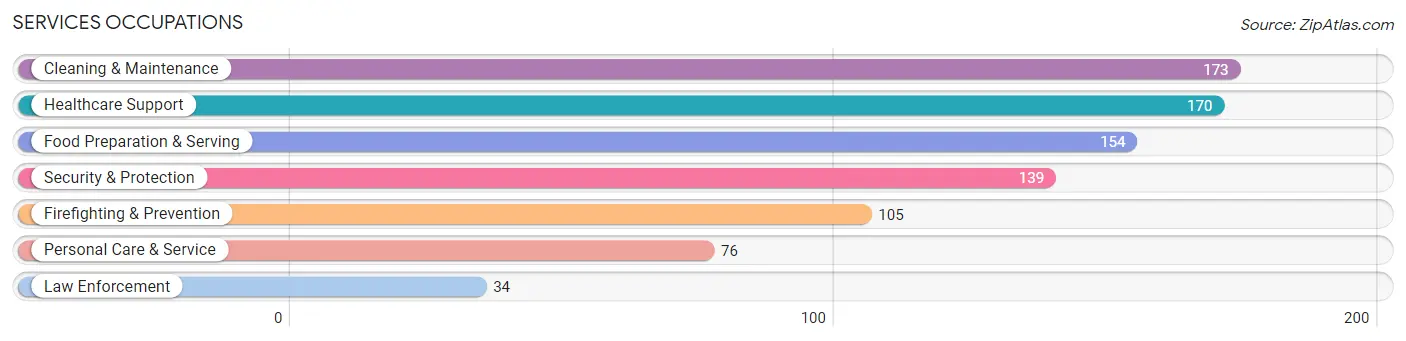
Services Occupations
The most common Services occupations in Sylacauga are Cleaning & Maintenance (173 | 3.4%), Healthcare Support (170 | 3.3%), Food Preparation & Serving (154 | 3.0%), Security & Protection (139 | 2.7%), and Firefighting & Prevention (105 | 2.1%).
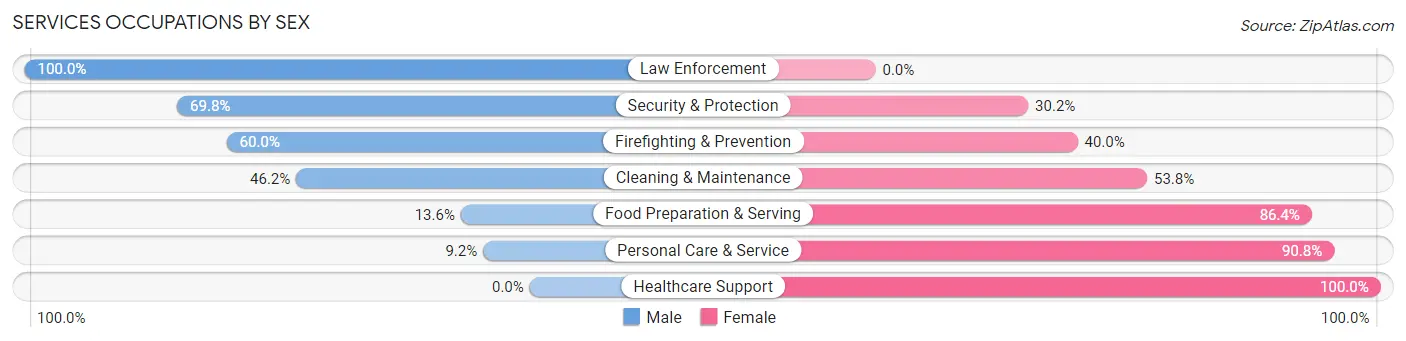
Services Occupations by Sex
Within the Services occupations in Sylacauga, the most male-oriented occupations are Law Enforcement (100.0%), Security & Protection (69.8%), and Firefighting & Prevention (60.0%), while the most female-oriented occupations are Healthcare Support (100.0%), Personal Care & Service (90.8%), and Food Preparation & Serving (86.4%).
| Occupation | Male | Female |
| Healthcare Support | 0 (0.0%) | 170 (100.0%) |
| Security & Protection | 97 (69.8%) | 42 (30.2%) |
| Firefighting & Prevention | 63 (60.0%) | 42 (40.0%) |
| Law Enforcement | 34 (100.0%) | 0 (0.0%) |
| Food Preparation & Serving | 21 (13.6%) | 133 (86.4%) |
| Cleaning & Maintenance | 80 (46.2%) | 93 (53.8%) |
| Personal Care & Service | 7 (9.2%) | 69 (90.8%) |
| Total (Category) | 205 (28.8%) | 507 (71.2%) |
| Total (Overall) | 2,497 (48.9%) | 2,613 (51.1%) |
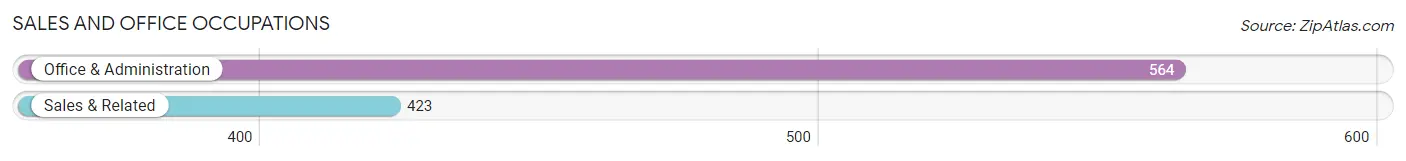
Sales and Office Occupations
The most common Sales and Office occupations in Sylacauga are Office & Administration (564 | 11.0%), and Sales & Related (423 | 8.3%).
Sales and Office Occupations by Sex
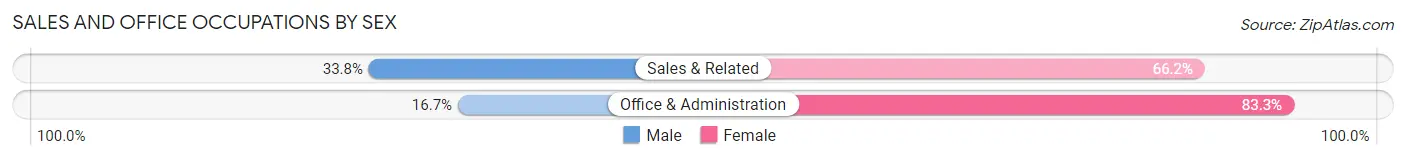
| Occupation | Male | Female |
| Sales & Related | 143 (33.8%) | 280 (66.2%) |
| Office & Administration | 94 (16.7%) | 470 (83.3%) |
| Total (Category) | 237 (24.0%) | 750 (76.0%) |
| Total (Overall) | 2,497 (48.9%) | 2,613 (51.1%) |
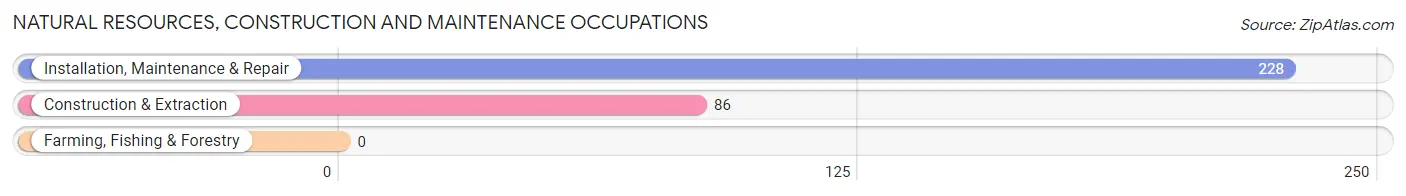
Natural Resources, Construction and Maintenance Occupations
The most common Natural Resources, Construction and Maintenance occupations in Sylacauga are Installation, Maintenance & Repair (228 | 4.5%), and Construction & Extraction (86 | 1.7%).
Natural Resources, Construction and Maintenance Occupations by Sex
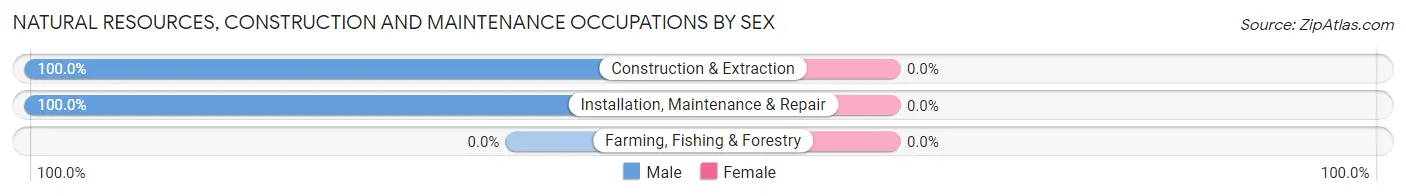
| Occupation | Male | Female |
| Farming, Fishing & Forestry | 0 (0.0%) | 0 (0.0%) |
| Construction & Extraction | 86 (100.0%) | 0 (0.0%) |
| Installation, Maintenance & Repair | 228 (100.0%) | 0 (0.0%) |
| Total (Category) | 314 (100.0%) | 0 (0.0%) |
| Total (Overall) | 2,497 (48.9%) | 2,613 (51.1%) |
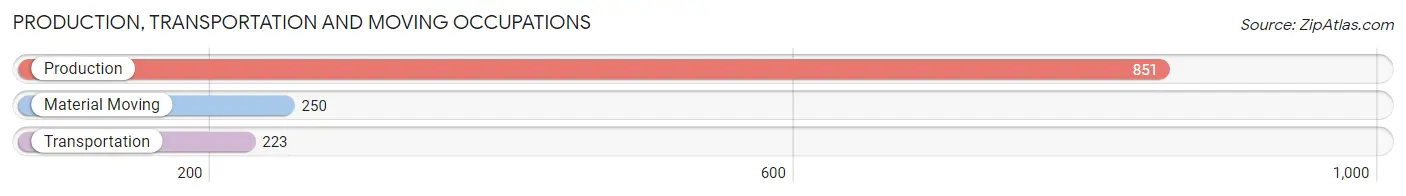
Production, Transportation and Moving Occupations
The most common Production, Transportation and Moving occupations in Sylacauga are Production (851 | 16.7%), Material Moving (250 | 4.9%), and Transportation (223 | 4.4%).
Production, Transportation and Moving Occupations by Sex
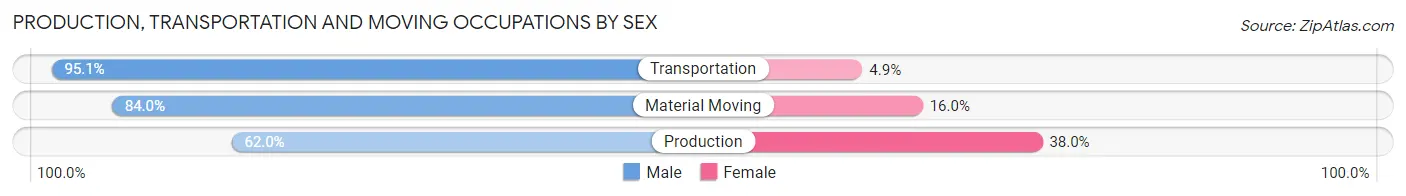
| Occupation | Male | Female |
| Production | 528 (62.0%) | 323 (38.0%) |
| Transportation | 212 (95.1%) | 11 (4.9%) |
| Material Moving | 210 (84.0%) | 40 (16.0%) |
| Total (Category) | 950 (71.8%) | 374 (28.2%) |
| Total (Overall) | 2,497 (48.9%) | 2,613 (51.1%) |
Employment Industries by Sex in Sylacauga
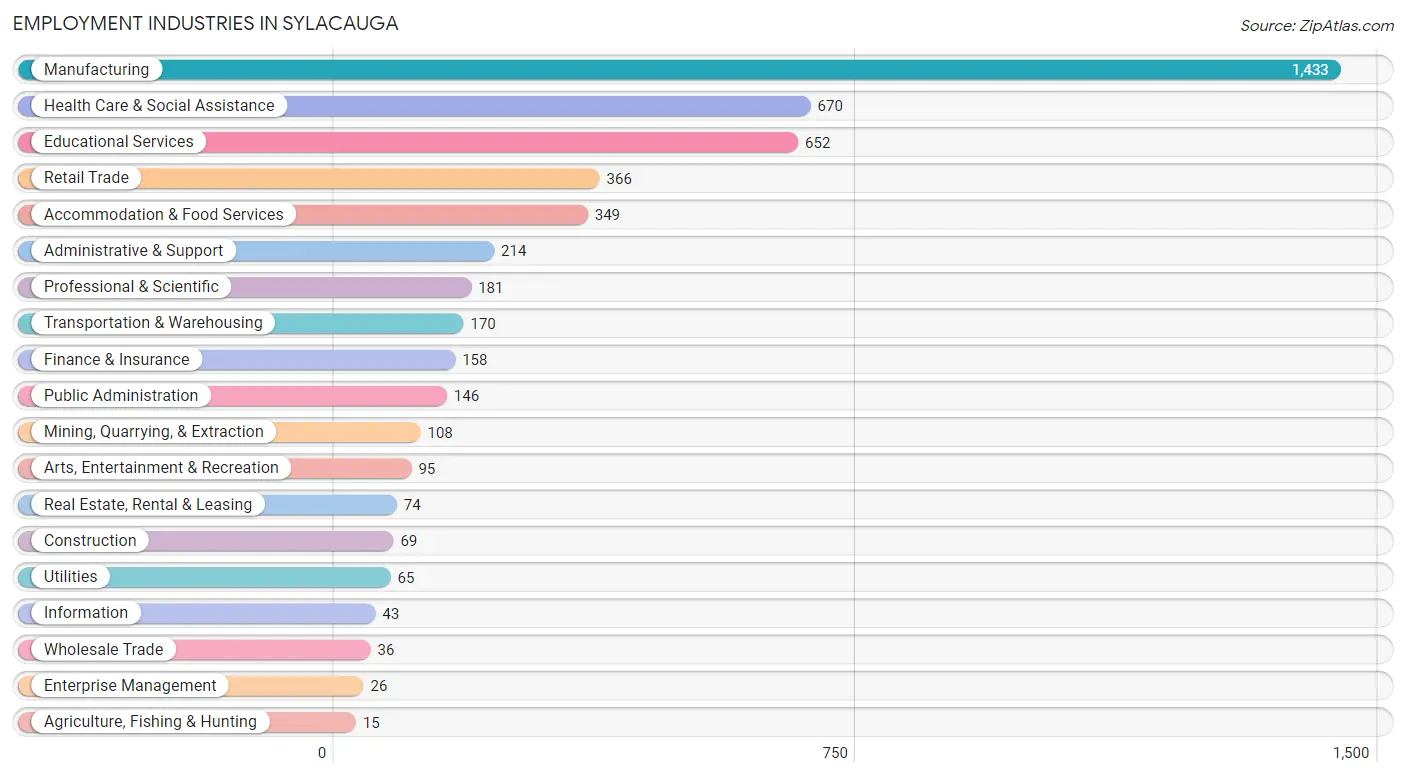
Employment Industries in Sylacauga
The major employment industries in Sylacauga include Manufacturing (1,433 | 28.0%), Health Care & Social Assistance (670 | 13.1%), Educational Services (652 | 12.8%), Retail Trade (366 | 7.2%), and Accommodation & Food Services (349 | 6.8%).
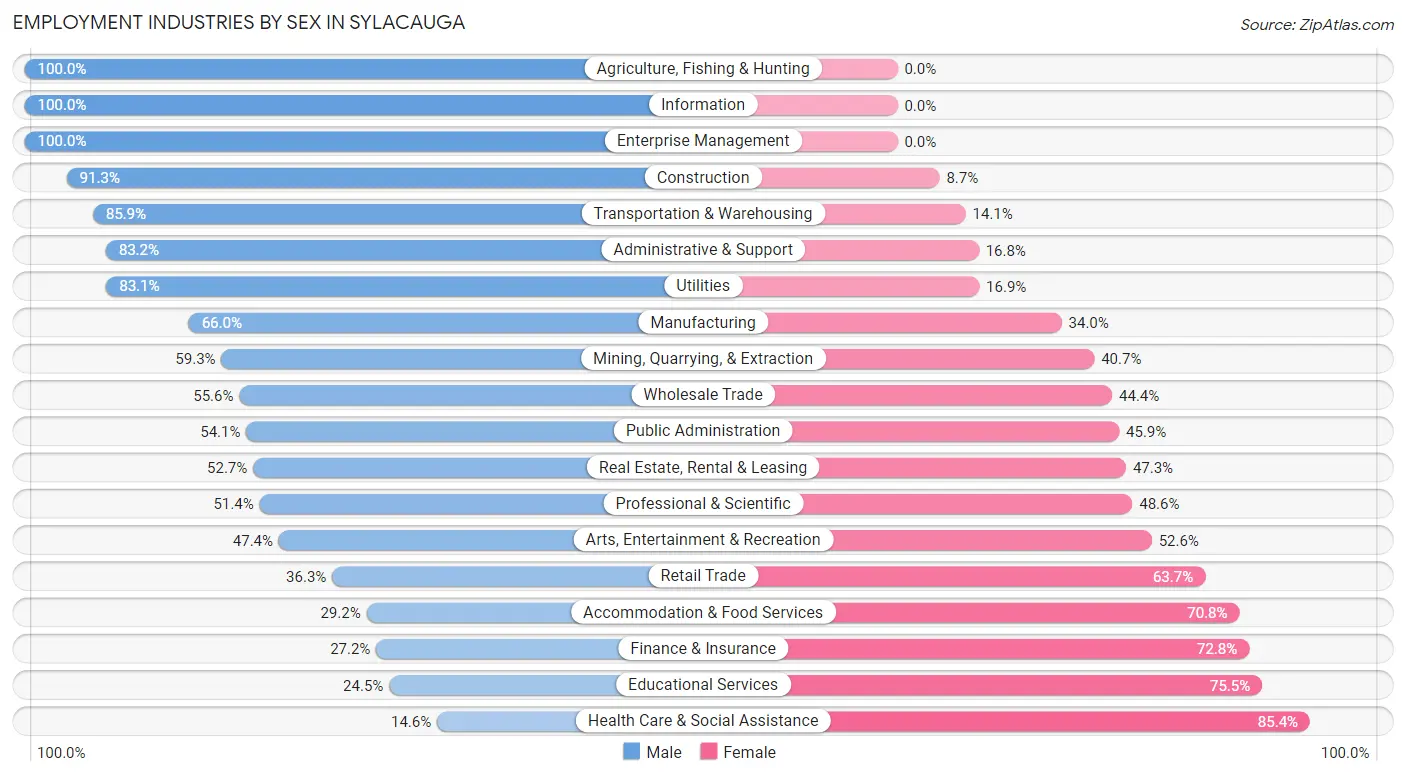
Employment Industries by Sex in Sylacauga
The Sylacauga industries that see more men than women are Agriculture, Fishing & Hunting (100.0%), Information (100.0%), and Enterprise Management (100.0%), whereas the industries that tend to have a higher number of women are Health Care & Social Assistance (85.4%), Educational Services (75.5%), and Finance & Insurance (72.8%).
| Industry | Male | Female |
| Agriculture, Fishing & Hunting | 15 (100.0%) | 0 (0.0%) |
| Mining, Quarrying, & Extraction | 64 (59.3%) | 44 (40.7%) |
| Construction | 63 (91.3%) | 6 (8.7%) |
| Manufacturing | 946 (66.0%) | 487 (34.0%) |
| Wholesale Trade | 20 (55.6%) | 16 (44.4%) |
| Retail Trade | 133 (36.3%) | 233 (63.7%) |
| Transportation & Warehousing | 146 (85.9%) | 24 (14.1%) |
| Utilities | 54 (83.1%) | 11 (16.9%) |
| Information | 43 (100.0%) | 0 (0.0%) |
| Finance & Insurance | 43 (27.2%) | 115 (72.8%) |
| Real Estate, Rental & Leasing | 39 (52.7%) | 35 (47.3%) |
| Professional & Scientific | 93 (51.4%) | 88 (48.6%) |
| Enterprise Management | 26 (100.0%) | 0 (0.0%) |
| Administrative & Support | 178 (83.2%) | 36 (16.8%) |
| Educational Services | 160 (24.5%) | 492 (75.5%) |
| Health Care & Social Assistance | 98 (14.6%) | 572 (85.4%) |
| Arts, Entertainment & Recreation | 45 (47.4%) | 50 (52.6%) |
| Accommodation & Food Services | 102 (29.2%) | 247 (70.8%) |
| Public Administration | 79 (54.1%) | 67 (45.9%) |
| Total | 2,497 (48.9%) | 2,613 (51.1%) |
Education in Sylacauga
School Enrollment in Sylacauga
The most common levels of schooling among the 3,078 students in Sylacauga are elementary school (774 | 25.2%), middle school (735 | 23.9%), and high school (679 | 22.1%).
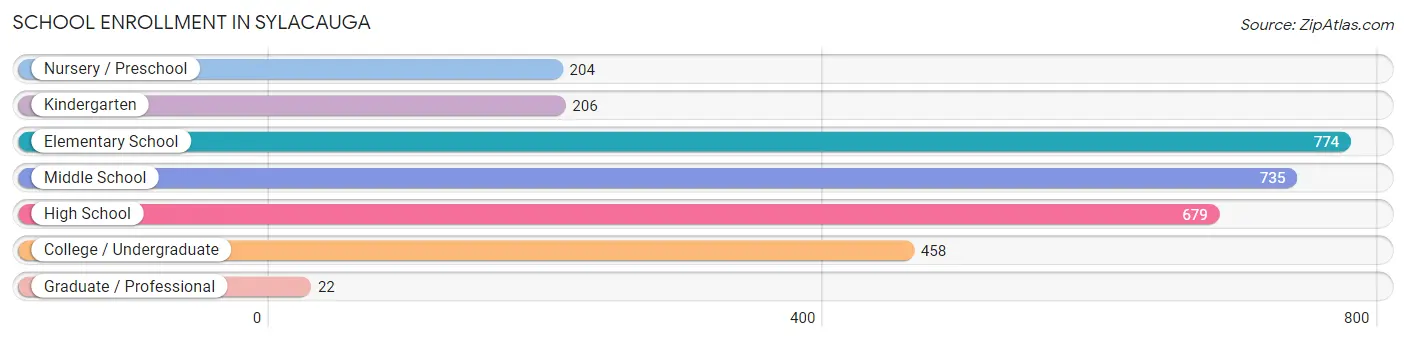
| School Level | # Students | % Students |
| Nursery / Preschool | 204 | 6.6% |
| Kindergarten | 206 | 6.7% |
| Elementary School | 774 | 25.2% |
| Middle School | 735 | 23.9% |
| High School | 679 | 22.1% |
| College / Undergraduate | 458 | 14.9% |
| Graduate / Professional | 22 | 0.7% |
| Total | 3,078 | 100.0% |
School Enrollment by Age by Funding Source in Sylacauga
Out of a total of 3,078 students who are enrolled in schools in Sylacauga, 117 (3.8%) attend a private institution, while the remaining 2,961 (96.2%) are enrolled in public schools. The age group of 35 years and over has the highest likelihood of being enrolled in private schools, with 33 (26.4% in the age bracket) enrolled. Conversely, the age group of 3 to 4 year olds has the lowest likelihood of being enrolled in a private school, with 133 (100.0% in the age bracket) attending a public institution.
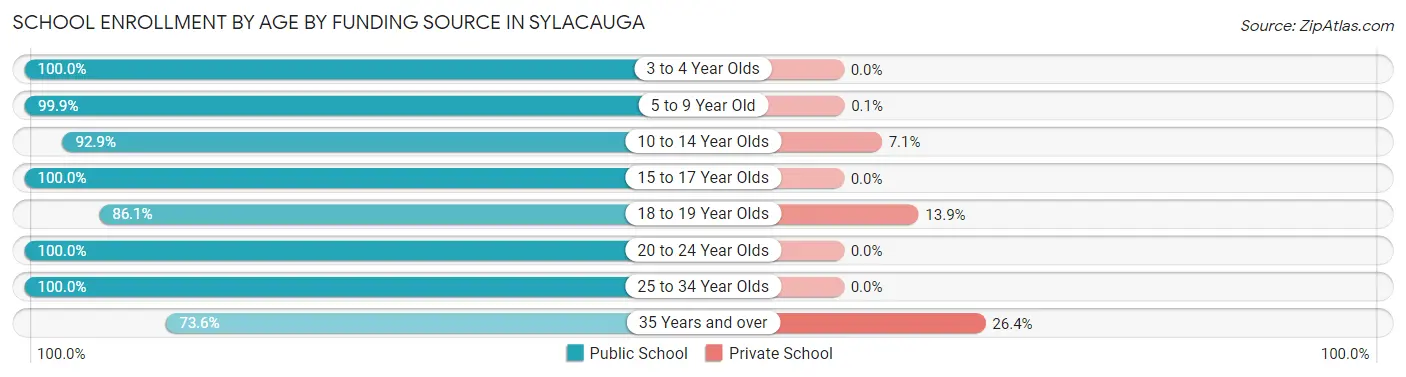
| Age Bracket | Public School | Private School |
| 3 to 4 Year Olds | 133 (100.0%) | 0 (0.0%) |
| 5 to 9 Year Old | 985 (99.9%) | 1 (0.1%) |
| 10 to 14 Year Olds | 788 (92.9%) | 60 (7.1%) |
| 15 to 17 Year Olds | 503 (100.0%) | 0 (0.0%) |
| 18 to 19 Year Olds | 136 (86.1%) | 22 (13.9%) |
| 20 to 24 Year Olds | 134 (100.0%) | 0 (0.0%) |
| 25 to 34 Year Olds | 191 (100.0%) | 0 (0.0%) |
| 35 Years and over | 92 (73.6%) | 33 (26.4%) |
| Total | 2,961 (96.2%) | 117 (3.8%) |
Educational Attainment by Field of Study in Sylacauga
Business (387 | 24.1%), education (370 | 23.0%), arts & humanities (181 | 11.3%), science & technology (121 | 7.5%), and bio, nature & agricultural (116 | 7.2%) are the most common fields of study among 1,608 individuals in Sylacauga who have obtained a bachelor's degree or higher.
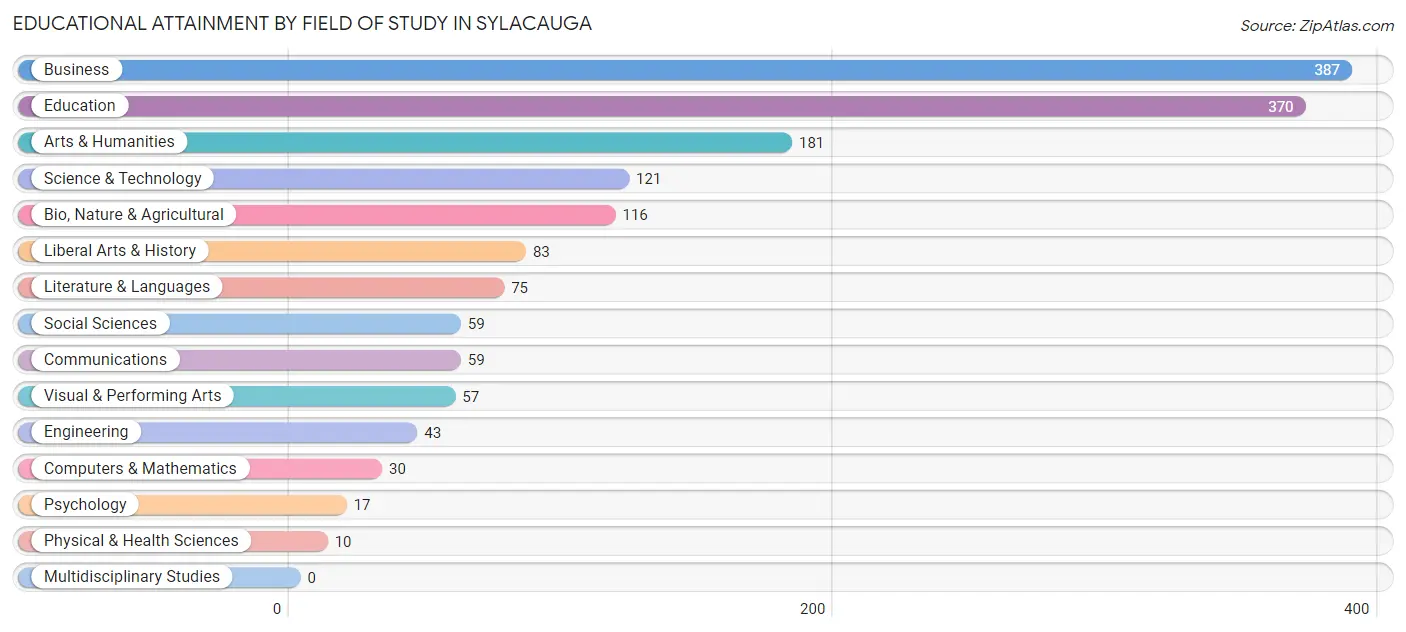
| Field of Study | # Graduates | % Graduates |
| Computers & Mathematics | 30 | 1.9% |
| Bio, Nature & Agricultural | 116 | 7.2% |
| Physical & Health Sciences | 10 | 0.6% |
| Psychology | 17 | 1.1% |
| Social Sciences | 59 | 3.7% |
| Engineering | 43 | 2.7% |
| Multidisciplinary Studies | 0 | 0.0% |
| Science & Technology | 121 | 7.5% |
| Business | 387 | 24.1% |
| Education | 370 | 23.0% |
| Literature & Languages | 75 | 4.7% |
| Liberal Arts & History | 83 | 5.2% |
| Visual & Performing Arts | 57 | 3.5% |
| Communications | 59 | 3.7% |
| Arts & Humanities | 181 | 11.3% |
| Total | 1,608 | 100.0% |
Transportation & Commute in Sylacauga
Vehicle Availability by Sex in Sylacauga
The most prevalent vehicle ownership categories in Sylacauga are males with 3 vehicles (935, accounting for 38.2%) and females with 3 vehicles (892, making up 36.8%).
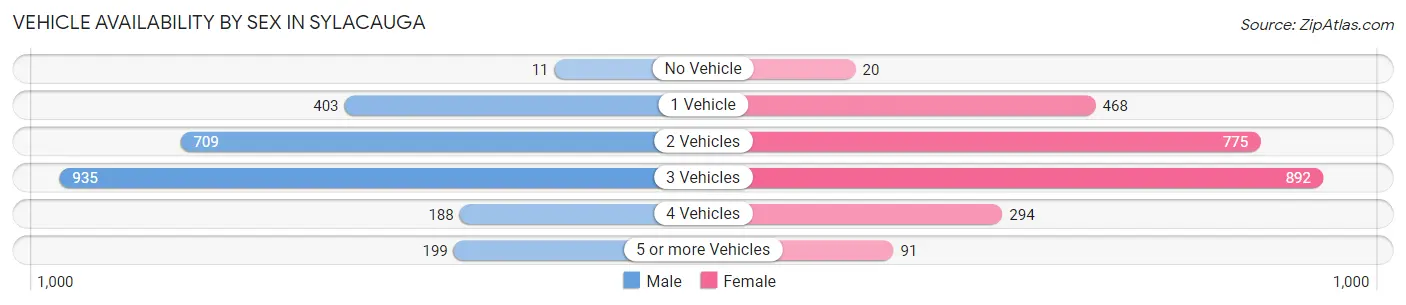
| Vehicles Available | Male | Female |
| No Vehicle | 11 (0.4%) | 20 (0.8%) |
| 1 Vehicle | 403 (16.5%) | 468 (18.4%) |
| 2 Vehicles | 709 (29.0%) | 775 (30.5%) |
| 3 Vehicles | 935 (38.2%) | 892 (35.1%) |
| 4 Vehicles | 188 (7.7%) | 294 (11.6%) |
| 5 or more Vehicles | 199 (8.1%) | 91 (3.6%) |
| Total | 2,445 (100.0%) | 2,540 (100.0%) |
Commute Time in Sylacauga
The most frequently occuring commute durations in Sylacauga are 5 to 9 minutes (1,222 commuters, 25.3%), 10 to 14 minutes (1,166 commuters, 24.2%), and 30 to 34 minutes (449 commuters, 9.3%).
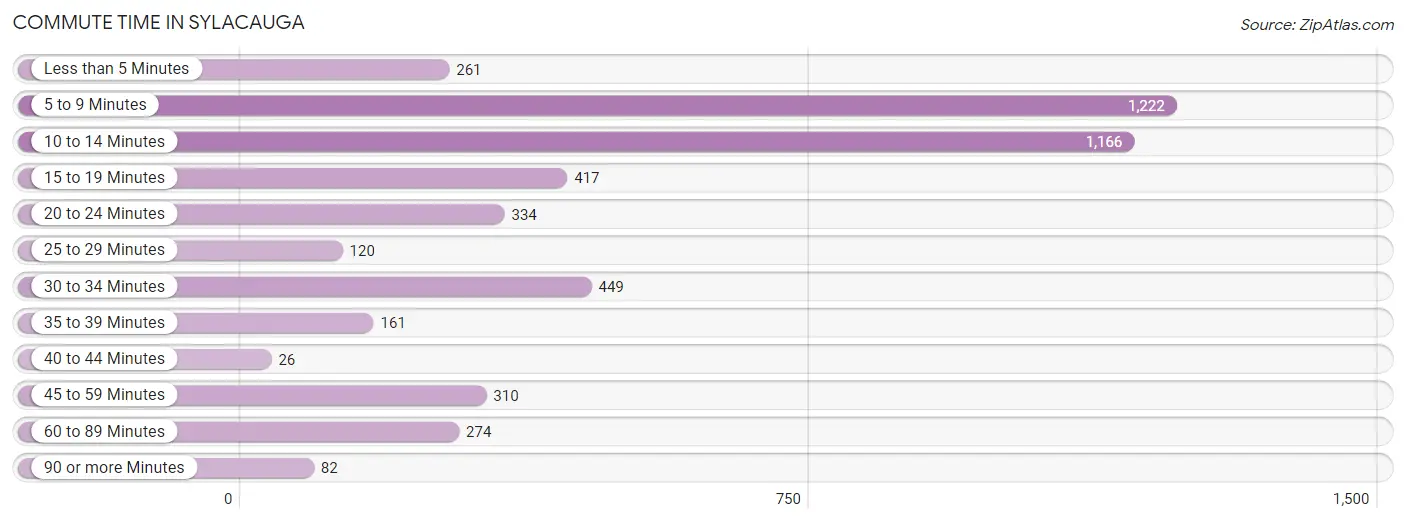
| Commute Time | # Commuters | % Commuters |
| Less than 5 Minutes | 261 | 5.4% |
| 5 to 9 Minutes | 1,222 | 25.3% |
| 10 to 14 Minutes | 1,166 | 24.2% |
| 15 to 19 Minutes | 417 | 8.6% |
| 20 to 24 Minutes | 334 | 6.9% |
| 25 to 29 Minutes | 120 | 2.5% |
| 30 to 34 Minutes | 449 | 9.3% |
| 35 to 39 Minutes | 161 | 3.3% |
| 40 to 44 Minutes | 26 | 0.5% |
| 45 to 59 Minutes | 310 | 6.4% |
| 60 to 89 Minutes | 274 | 5.7% |
| 90 or more Minutes | 82 | 1.7% |
Commute Time by Sex in Sylacauga
The most common commute times in Sylacauga are 10 to 14 minutes (674 commuters, 27.7%) for males and 5 to 9 minutes (740 commuters, 31.0%) for females.
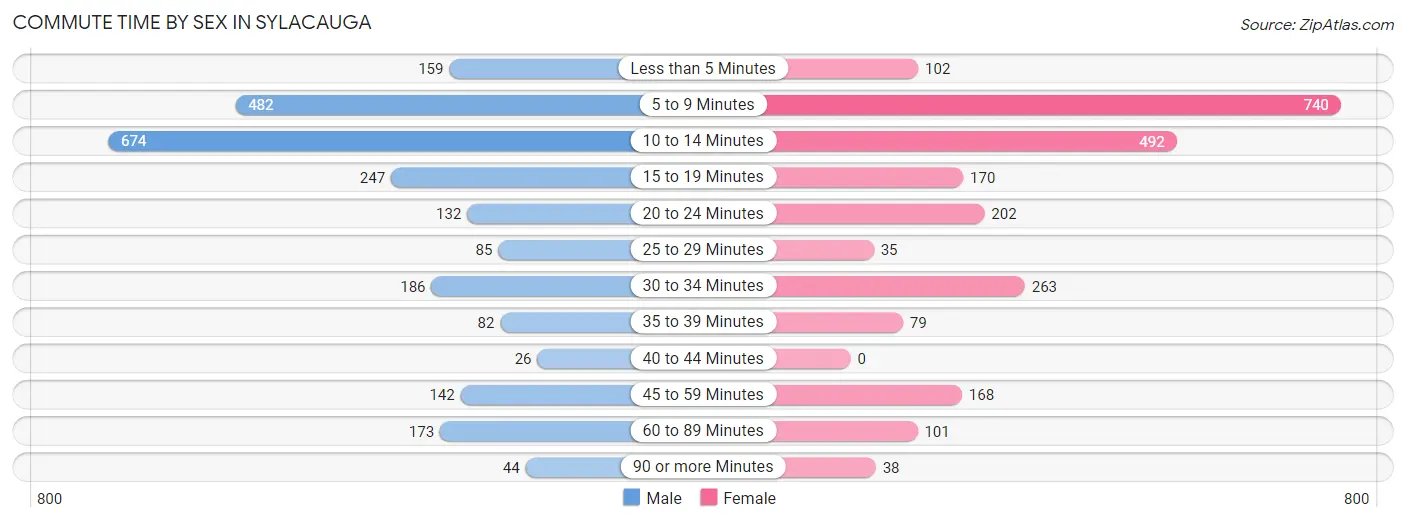
| Commute Time | Male | Female |
| Less than 5 Minutes | 159 (6.5%) | 102 (4.3%) |
| 5 to 9 Minutes | 482 (19.8%) | 740 (31.0%) |
| 10 to 14 Minutes | 674 (27.7%) | 492 (20.6%) |
| 15 to 19 Minutes | 247 (10.2%) | 170 (7.1%) |
| 20 to 24 Minutes | 132 (5.4%) | 202 (8.5%) |
| 25 to 29 Minutes | 85 (3.5%) | 35 (1.5%) |
| 30 to 34 Minutes | 186 (7.6%) | 263 (11.0%) |
| 35 to 39 Minutes | 82 (3.4%) | 79 (3.3%) |
| 40 to 44 Minutes | 26 (1.1%) | 0 (0.0%) |
| 45 to 59 Minutes | 142 (5.8%) | 168 (7.0%) |
| 60 to 89 Minutes | 173 (7.1%) | 101 (4.2%) |
| 90 or more Minutes | 44 (1.8%) | 38 (1.6%) |
Time of Departure to Work by Sex in Sylacauga
The most frequent times of departure to work in Sylacauga are 12:00 AM to 4:59 AM (402, 16.5%) for males and 7:00 AM to 7:29 AM (596, 24.9%) for females.
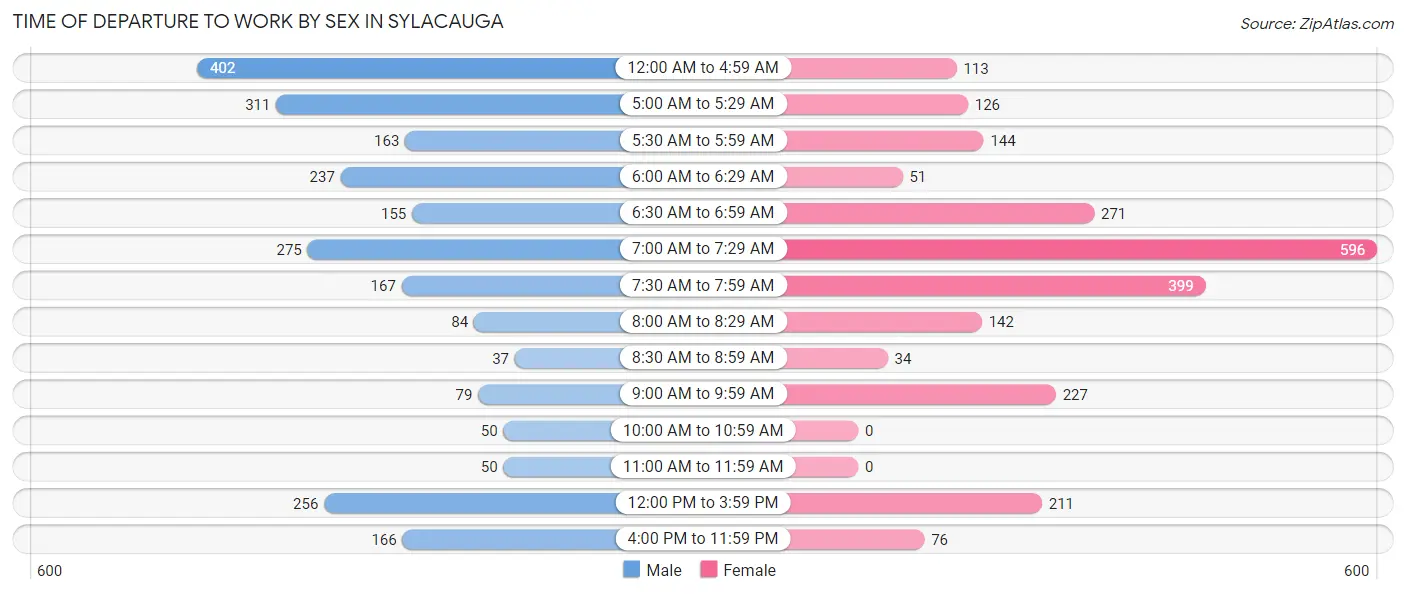
| Time of Departure | Male | Female |
| 12:00 AM to 4:59 AM | 402 (16.5%) | 113 (4.7%) |
| 5:00 AM to 5:29 AM | 311 (12.8%) | 126 (5.3%) |
| 5:30 AM to 5:59 AM | 163 (6.7%) | 144 (6.0%) |
| 6:00 AM to 6:29 AM | 237 (9.8%) | 51 (2.1%) |
| 6:30 AM to 6:59 AM | 155 (6.4%) | 271 (11.3%) |
| 7:00 AM to 7:29 AM | 275 (11.3%) | 596 (24.9%) |
| 7:30 AM to 7:59 AM | 167 (6.9%) | 399 (16.7%) |
| 8:00 AM to 8:29 AM | 84 (3.5%) | 142 (5.9%) |
| 8:30 AM to 8:59 AM | 37 (1.5%) | 34 (1.4%) |
| 9:00 AM to 9:59 AM | 79 (3.3%) | 227 (9.5%) |
| 10:00 AM to 10:59 AM | 50 (2.1%) | 0 (0.0%) |
| 11:00 AM to 11:59 AM | 50 (2.1%) | 0 (0.0%) |
| 12:00 PM to 3:59 PM | 256 (10.5%) | 211 (8.8%) |
| 4:00 PM to 11:59 PM | 166 (6.8%) | 76 (3.2%) |
| Total | 2,432 (100.0%) | 2,390 (100.0%) |
Housing Occupancy in Sylacauga
Occupancy by Ownership in Sylacauga
Of the total 5,291 dwellings in Sylacauga, owner-occupied units account for 2,858 (54.0%), while renter-occupied units make up 2,433 (46.0%).
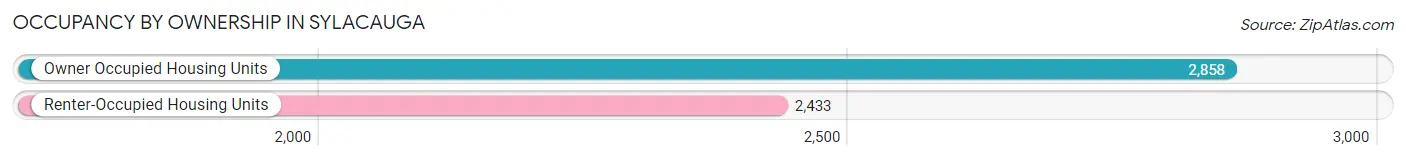
| Occupancy | # Housing Units | % Housing Units |
| Owner Occupied Housing Units | 2,858 | 54.0% |
| Renter-Occupied Housing Units | 2,433 | 46.0% |
| Total Occupied Housing Units | 5,291 | 100.0% |
Occupancy by Household Size in Sylacauga
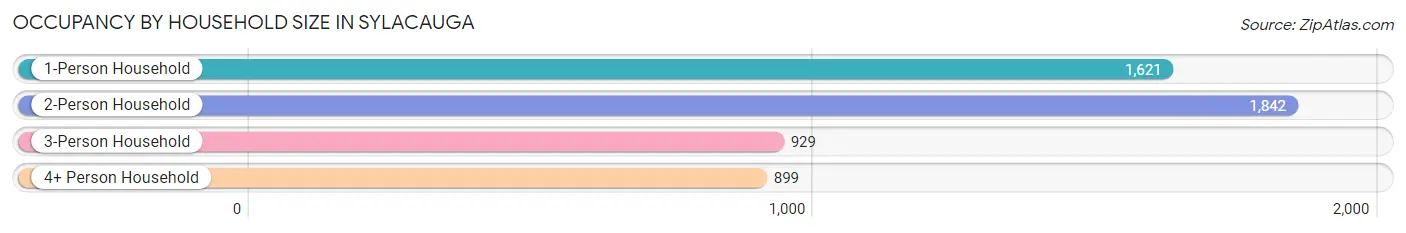
| Household Size | # Housing Units | % Housing Units |
| 1-Person Household | 1,621 | 30.6% |
| 2-Person Household | 1,842 | 34.8% |
| 3-Person Household | 929 | 17.6% |
| 4+ Person Household | 899 | 17.0% |
| Total Housing Units | 5,291 | 100.0% |
Occupancy by Ownership by Household Size in Sylacauga
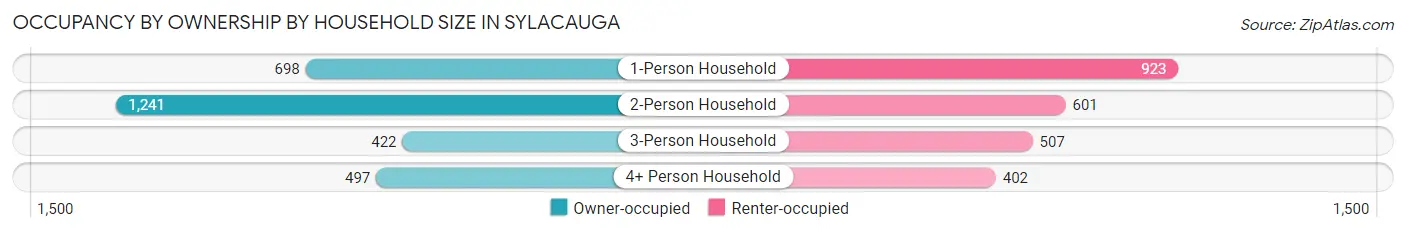
| Household Size | Owner-occupied | Renter-occupied |
| 1-Person Household | 698 (43.1%) | 923 (56.9%) |
| 2-Person Household | 1,241 (67.4%) | 601 (32.6%) |
| 3-Person Household | 422 (45.4%) | 507 (54.6%) |
| 4+ Person Household | 497 (55.3%) | 402 (44.7%) |
| Total Housing Units | 2,858 (54.0%) | 2,433 (46.0%) |
Occupancy by Educational Attainment in Sylacauga
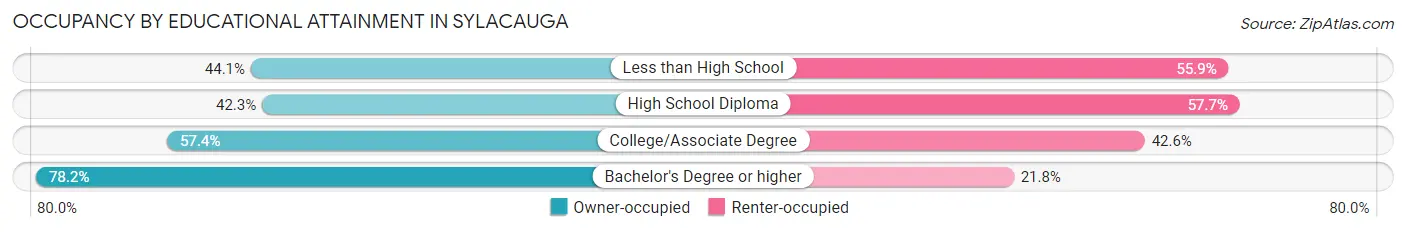
| Household Size | Owner-occupied | Renter-occupied |
| Less than High School | 352 (44.1%) | 446 (55.9%) |
| High School Diploma | 691 (42.3%) | 941 (57.7%) |
| College/Associate Degree | 1,166 (57.4%) | 865 (42.6%) |
| Bachelor's Degree or higher | 649 (78.2%) | 181 (21.8%) |
Occupancy by Age of Householder in Sylacauga
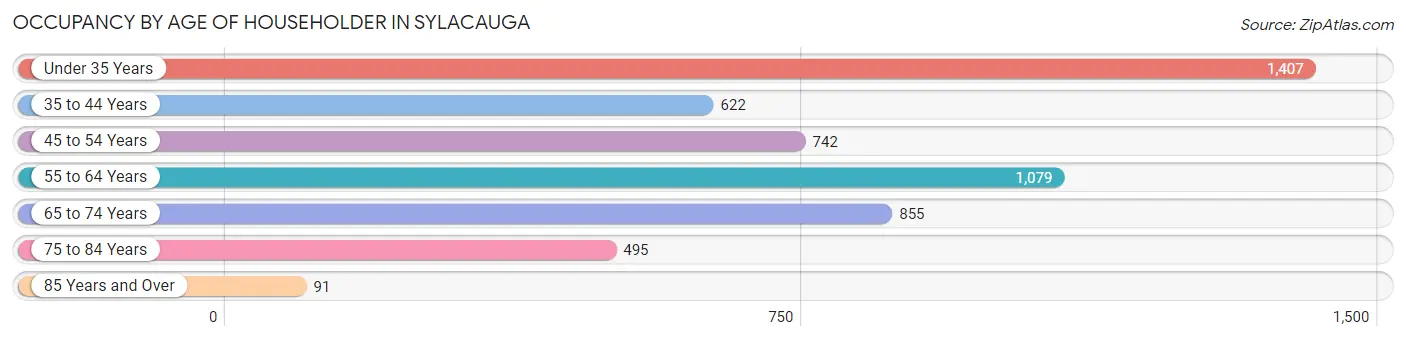
| Age Bracket | # Households | % Households |
| Under 35 Years | 1,407 | 26.6% |
| 35 to 44 Years | 622 | 11.8% |
| 45 to 54 Years | 742 | 14.0% |
| 55 to 64 Years | 1,079 | 20.4% |
| 65 to 74 Years | 855 | 16.2% |
| 75 to 84 Years | 495 | 9.4% |
| 85 Years and Over | 91 | 1.7% |
| Total | 5,291 | 100.0% |
Housing Finances in Sylacauga
Median Income by Occupancy in Sylacauga
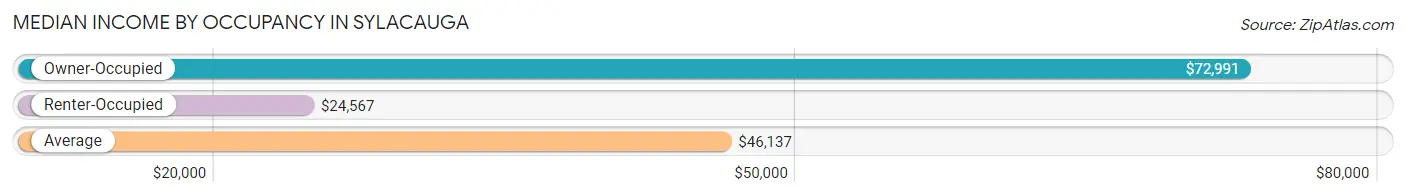
| Occupancy Type | # Households | Median Income |
| Owner-Occupied | 2,858 (54.0%) | $72,991 |
| Renter-Occupied | 2,433 (46.0%) | $24,567 |
| Average | 5,291 (100.0%) | $46,137 |
Occupancy by Householder Income Bracket in Sylacauga
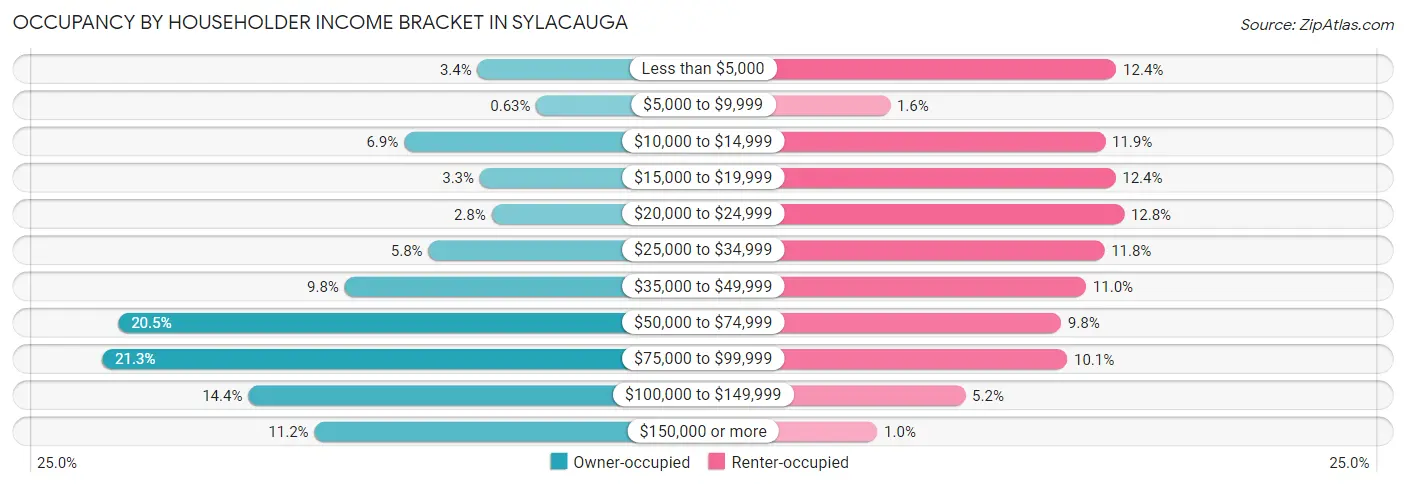
| Income Bracket | Owner-occupied | Renter-occupied |
| Less than $5,000 | 98 (3.4%) | 302 (12.4%) |
| $5,000 to $9,999 | 18 (0.6%) | 40 (1.6%) |
| $10,000 to $14,999 | 198 (6.9%) | 289 (11.9%) |
| $15,000 to $19,999 | 95 (3.3%) | 301 (12.4%) |
| $20,000 to $24,999 | 79 (2.8%) | 311 (12.8%) |
| $25,000 to $34,999 | 165 (5.8%) | 288 (11.8%) |
| $35,000 to $49,999 | 279 (9.8%) | 267 (11.0%) |
| $50,000 to $74,999 | 587 (20.5%) | 238 (9.8%) |
| $75,000 to $99,999 | 609 (21.3%) | 245 (10.1%) |
| $100,000 to $149,999 | 410 (14.3%) | 127 (5.2%) |
| $150,000 or more | 320 (11.2%) | 25 (1.0%) |
| Total | 2,858 (100.0%) | 2,433 (100.0%) |
Monthly Housing Cost Tiers in Sylacauga
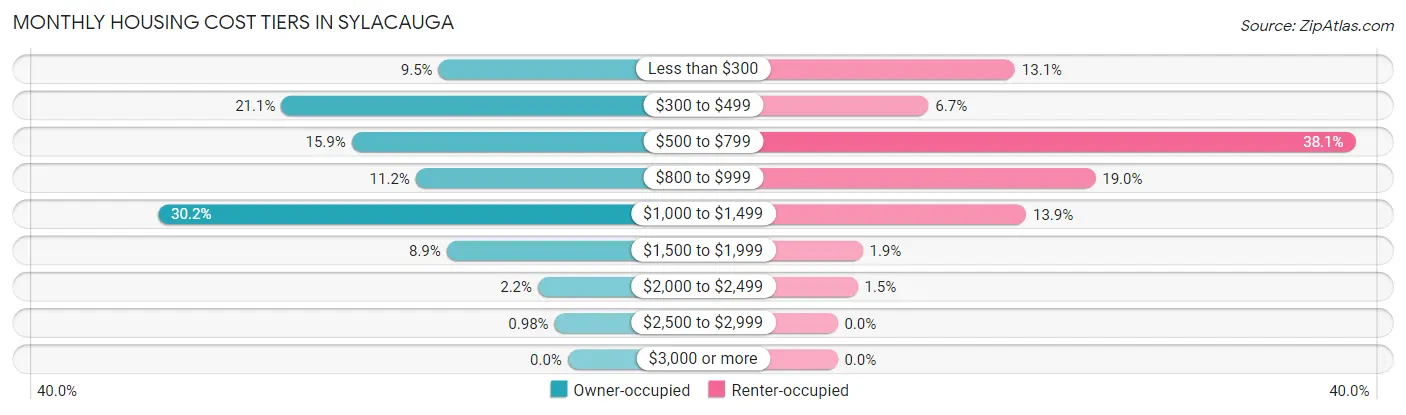
| Monthly Cost | Owner-occupied | Renter-occupied |
| Less than $300 | 272 (9.5%) | 318 (13.1%) |
| $300 to $499 | 603 (21.1%) | 163 (6.7%) |
| $500 to $799 | 455 (15.9%) | 928 (38.1%) |
| $800 to $999 | 320 (11.2%) | 462 (19.0%) |
| $1,000 to $1,499 | 862 (30.2%) | 338 (13.9%) |
| $1,500 to $1,999 | 255 (8.9%) | 45 (1.8%) |
| $2,000 to $2,499 | 63 (2.2%) | 36 (1.5%) |
| $2,500 to $2,999 | 28 (1.0%) | 0 (0.0%) |
| $3,000 or more | 0 (0.0%) | 0 (0.0%) |
| Total | 2,858 (100.0%) | 2,433 (100.0%) |
Physical Housing Characteristics in Sylacauga
Housing Structures in Sylacauga
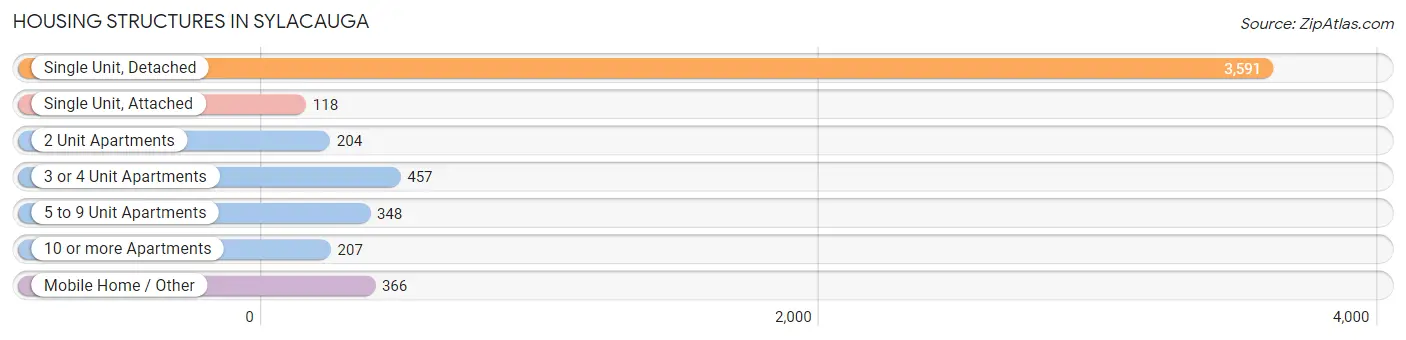
| Structure Type | # Housing Units | % Housing Units |
| Single Unit, Detached | 3,591 | 67.9% |
| Single Unit, Attached | 118 | 2.2% |
| 2 Unit Apartments | 204 | 3.9% |
| 3 or 4 Unit Apartments | 457 | 8.6% |
| 5 to 9 Unit Apartments | 348 | 6.6% |
| 10 or more Apartments | 207 | 3.9% |
| Mobile Home / Other | 366 | 6.9% |
| Total | 5,291 | 100.0% |
Housing Structures by Occupancy in Sylacauga
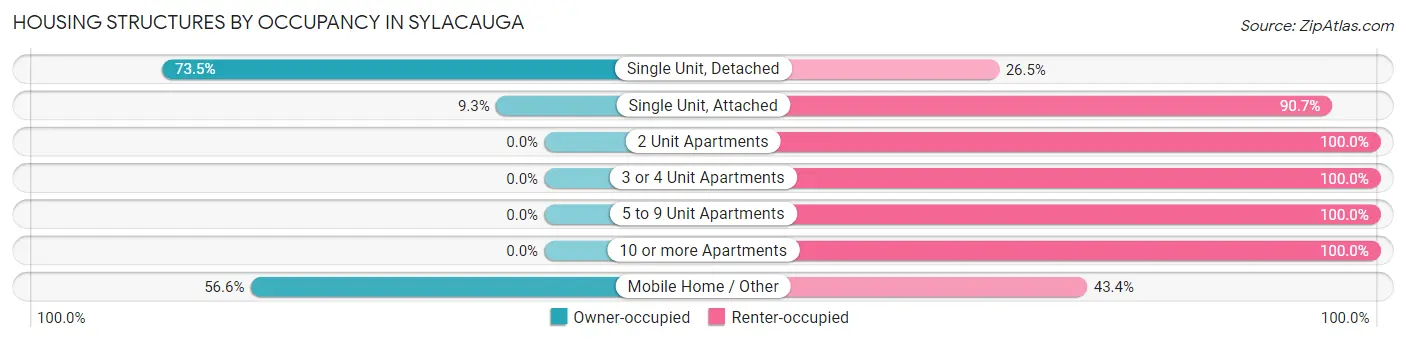
| Structure Type | Owner-occupied | Renter-occupied |
| Single Unit, Detached | 2,640 (73.5%) | 951 (26.5%) |
| Single Unit, Attached | 11 (9.3%) | 107 (90.7%) |
| 2 Unit Apartments | 0 (0.0%) | 204 (100.0%) |
| 3 or 4 Unit Apartments | 0 (0.0%) | 457 (100.0%) |
| 5 to 9 Unit Apartments | 0 (0.0%) | 348 (100.0%) |
| 10 or more Apartments | 0 (0.0%) | 207 (100.0%) |
| Mobile Home / Other | 207 (56.6%) | 159 (43.4%) |
| Total | 2,858 (54.0%) | 2,433 (46.0%) |
Housing Structures by Number of Rooms in Sylacauga
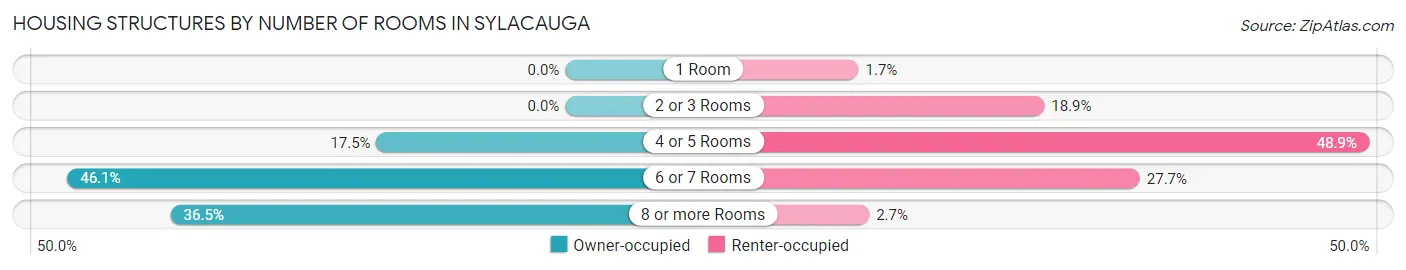
| Number of Rooms | Owner-occupied | Renter-occupied |
| 1 Room | 0 (0.0%) | 42 (1.7%) |
| 2 or 3 Rooms | 0 (0.0%) | 460 (18.9%) |
| 4 or 5 Rooms | 499 (17.5%) | 1,190 (48.9%) |
| 6 or 7 Rooms | 1,316 (46.1%) | 675 (27.7%) |
| 8 or more Rooms | 1,043 (36.5%) | 66 (2.7%) |
| Total | 2,858 (100.0%) | 2,433 (100.0%) |
Housing Structure by Heating Type in Sylacauga
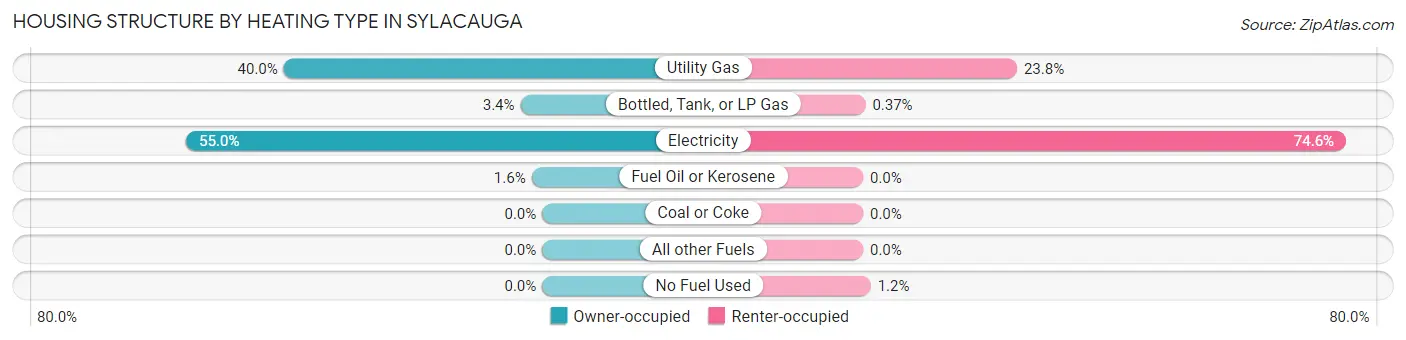
| Heating Type | Owner-occupied | Renter-occupied |
| Utility Gas | 1,142 (40.0%) | 579 (23.8%) |
| Bottled, Tank, or LP Gas | 96 (3.4%) | 9 (0.4%) |
| Electricity | 1,573 (55.0%) | 1,816 (74.6%) |
| Fuel Oil or Kerosene | 47 (1.6%) | 0 (0.0%) |
| Coal or Coke | 0 (0.0%) | 0 (0.0%) |
| All other Fuels | 0 (0.0%) | 0 (0.0%) |
| No Fuel Used | 0 (0.0%) | 29 (1.2%) |
| Total | 2,858 (100.0%) | 2,433 (100.0%) |
Household Vehicle Usage in Sylacauga
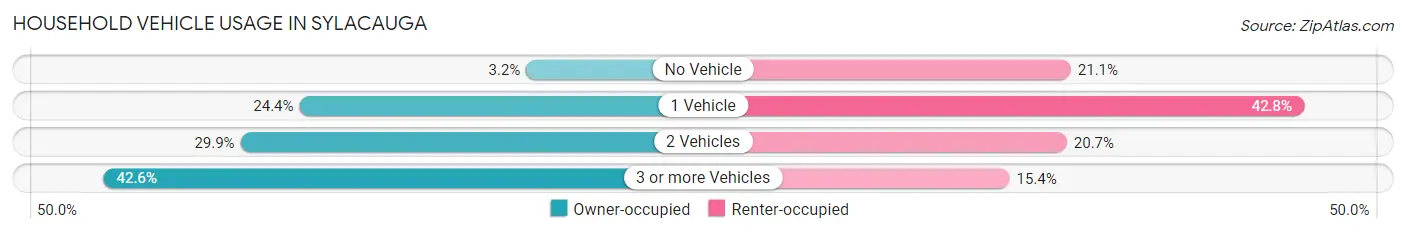
| Vehicles per Household | Owner-occupied | Renter-occupied |
| No Vehicle | 91 (3.2%) | 513 (21.1%) |
| 1 Vehicle | 696 (24.3%) | 1,042 (42.8%) |
| 2 Vehicles | 853 (29.8%) | 504 (20.7%) |
| 3 or more Vehicles | 1,218 (42.6%) | 374 (15.4%) |
| Total | 2,858 (100.0%) | 2,433 (100.0%) |
Real Estate & Mortgages in Sylacauga
Real Estate and Mortgage Overview in Sylacauga
| Characteristic | Without Mortgage | With Mortgage |
| Housing Units | 1,215 | 1,643 |
| Median Property Value | $153,800 | $161,800 |
| Median Household Income | $50,230 | $240 |
| Monthly Housing Costs | $392 | $0 |
| Real Estate Taxes | $697 | $89 |
Property Value by Mortgage Status in Sylacauga
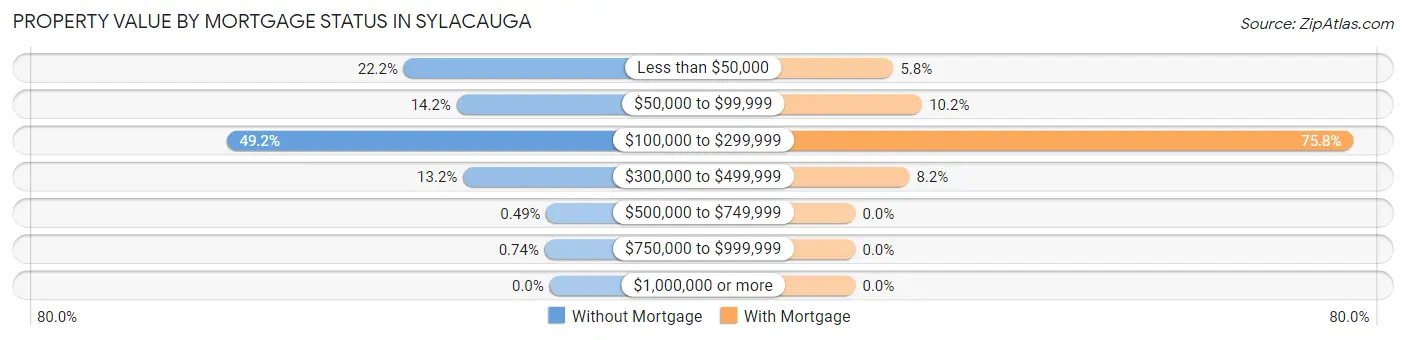
| Property Value | Without Mortgage | With Mortgage |
| Less than $50,000 | 270 (22.2%) | 95 (5.8%) |
| $50,000 to $99,999 | 172 (14.2%) | 167 (10.2%) |
| $100,000 to $299,999 | 598 (49.2%) | 1,246 (75.8%) |
| $300,000 to $499,999 | 160 (13.2%) | 135 (8.2%) |
| $500,000 to $749,999 | 6 (0.5%) | 0 (0.0%) |
| $750,000 to $999,999 | 9 (0.7%) | 0 (0.0%) |
| $1,000,000 or more | 0 (0.0%) | 0 (0.0%) |
| Total | 1,215 (100.0%) | 1,643 (100.0%) |
Household Income by Mortgage Status in Sylacauga
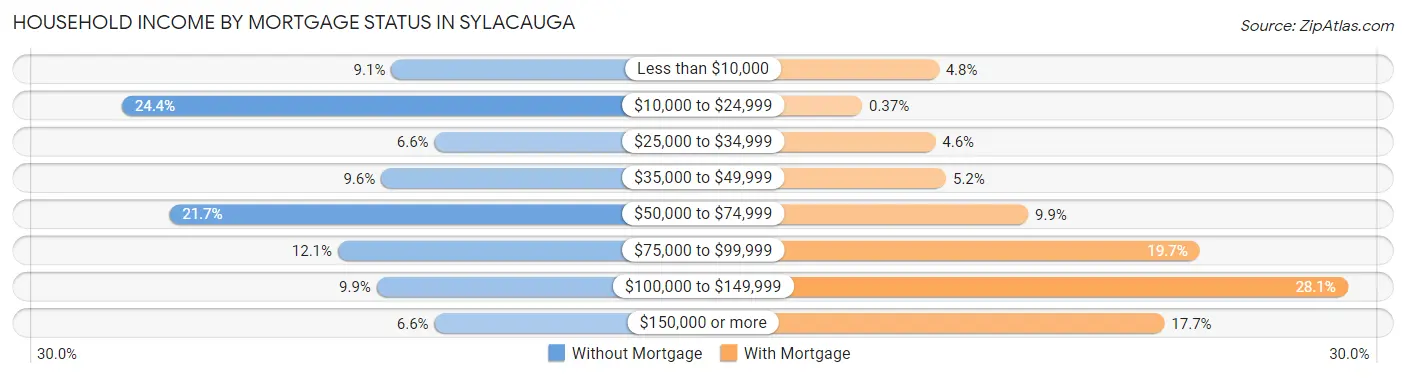
| Household Income | Without Mortgage | With Mortgage |
| Less than $10,000 | 110 (9.0%) | 78 (4.8%) |
| $10,000 to $24,999 | 297 (24.4%) | 6 (0.4%) |
| $25,000 to $34,999 | 80 (6.6%) | 75 (4.6%) |
| $35,000 to $49,999 | 117 (9.6%) | 85 (5.2%) |
| $50,000 to $74,999 | 264 (21.7%) | 162 (9.9%) |
| $75,000 to $99,999 | 147 (12.1%) | 323 (19.7%) |
| $100,000 to $149,999 | 120 (9.9%) | 462 (28.1%) |
| $150,000 or more | 80 (6.6%) | 290 (17.6%) |
| Total | 1,215 (100.0%) | 1,643 (100.0%) |
Property Value to Household Income Ratio in Sylacauga
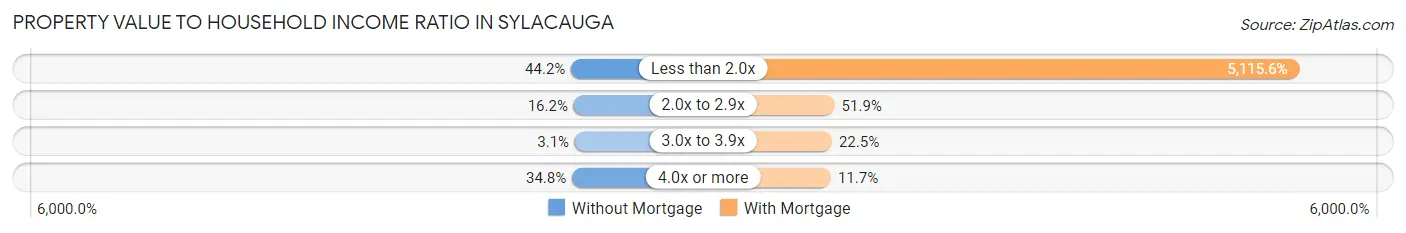
| Value-to-Income Ratio | Without Mortgage | With Mortgage |
| Less than 2.0x | 537 (44.2%) | 84,050 (5,115.6%) |
| 2.0x to 2.9x | 197 (16.2%) | 853 (51.9%) |
| 3.0x to 3.9x | 37 (3.0%) | 369 (22.5%) |
| 4.0x or more | 423 (34.8%) | 192 (11.7%) |
| Total | 1,215 (100.0%) | 1,643 (100.0%) |
Real Estate Taxes by Mortgage Status in Sylacauga
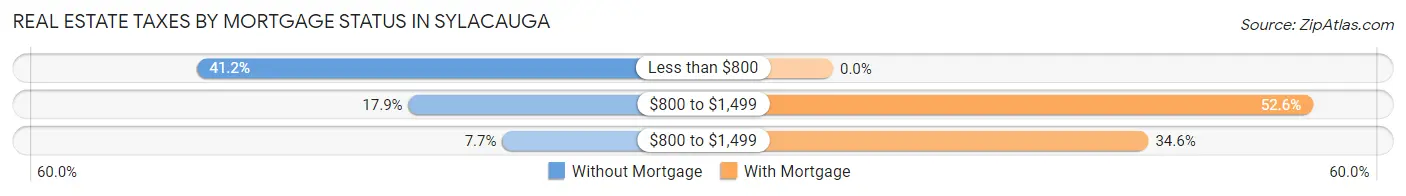
| Property Taxes | Without Mortgage | With Mortgage |
| Less than $800 | 500 (41.1%) | 0 (0.0%) |
| $800 to $1,499 | 218 (17.9%) | 864 (52.6%) |
| $800 to $1,499 | 93 (7.6%) | 568 (34.6%) |
| Total | 1,215 (100.0%) | 1,643 (100.0%) |
Health & Disability in Sylacauga
Health Insurance Coverage by Age in Sylacauga
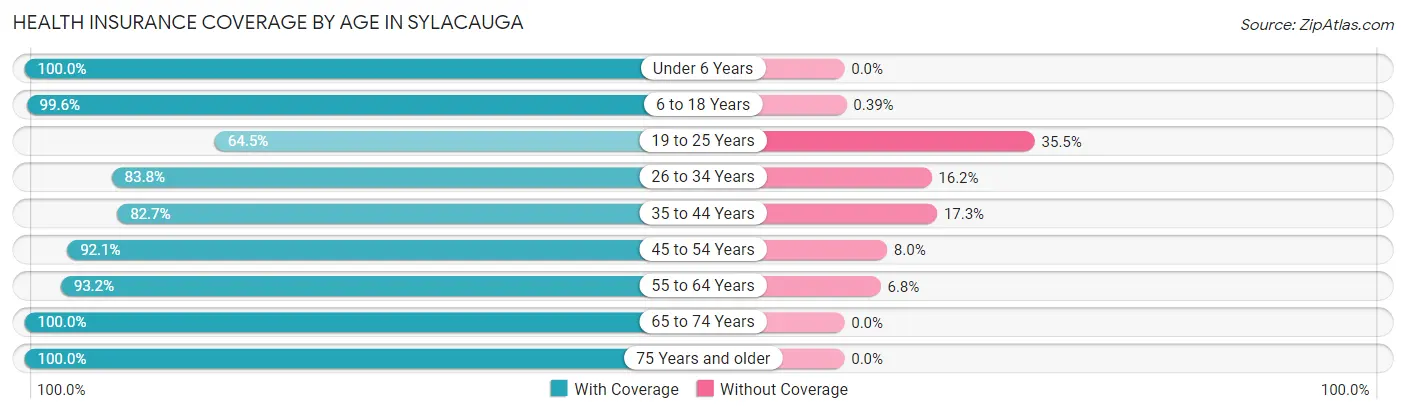
| Age Bracket | With Coverage | Without Coverage |
| Under 6 Years | 826 (100.0%) | 0 (0.0%) |
| 6 to 18 Years | 2,322 (99.6%) | 9 (0.4%) |
| 19 to 25 Years | 469 (64.5%) | 258 (35.5%) |
| 26 to 34 Years | 1,769 (83.8%) | 343 (16.2%) |
| 35 to 44 Years | 895 (82.7%) | 187 (17.3%) |
| 45 to 54 Years | 1,251 (92.0%) | 108 (8.0%) |
| 55 to 64 Years | 1,585 (93.2%) | 115 (6.8%) |
| 65 to 74 Years | 1,348 (100.0%) | 0 (0.0%) |
| 75 Years and older | 771 (100.0%) | 0 (0.0%) |
| Total | 11,236 (91.7%) | 1,020 (8.3%) |
Health Insurance Coverage by Citizenship Status in Sylacauga
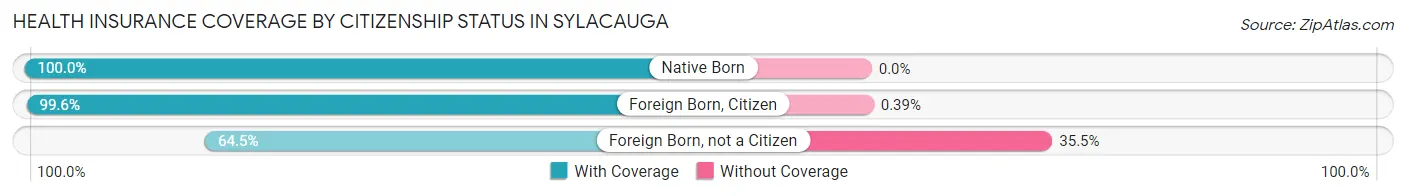
| Citizenship Status | With Coverage | Without Coverage |
| Native Born | 826 (100.0%) | 0 (0.0%) |
| Foreign Born, Citizen | 2,322 (99.6%) | 9 (0.4%) |
| Foreign Born, not a Citizen | 469 (64.5%) | 258 (35.5%) |
Health Insurance Coverage by Household Income in Sylacauga
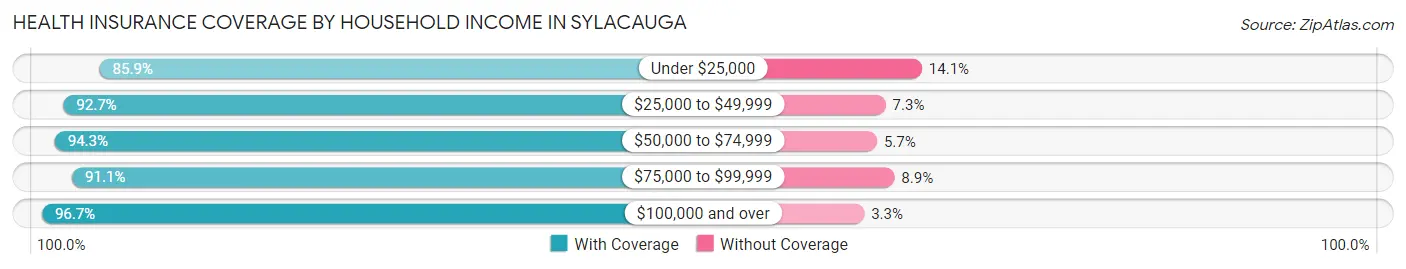
| Household Income | With Coverage | Without Coverage |
| Under $25,000 | 2,595 (85.9%) | 425 (14.1%) |
| $25,000 to $49,999 | 2,024 (92.7%) | 159 (7.3%) |
| $50,000 to $74,999 | 1,684 (94.3%) | 101 (5.7%) |
| $75,000 to $99,999 | 2,276 (91.1%) | 223 (8.9%) |
| $100,000 and over | 2,609 (96.7%) | 88 (3.3%) |
Public vs Private Health Insurance Coverage by Age in Sylacauga
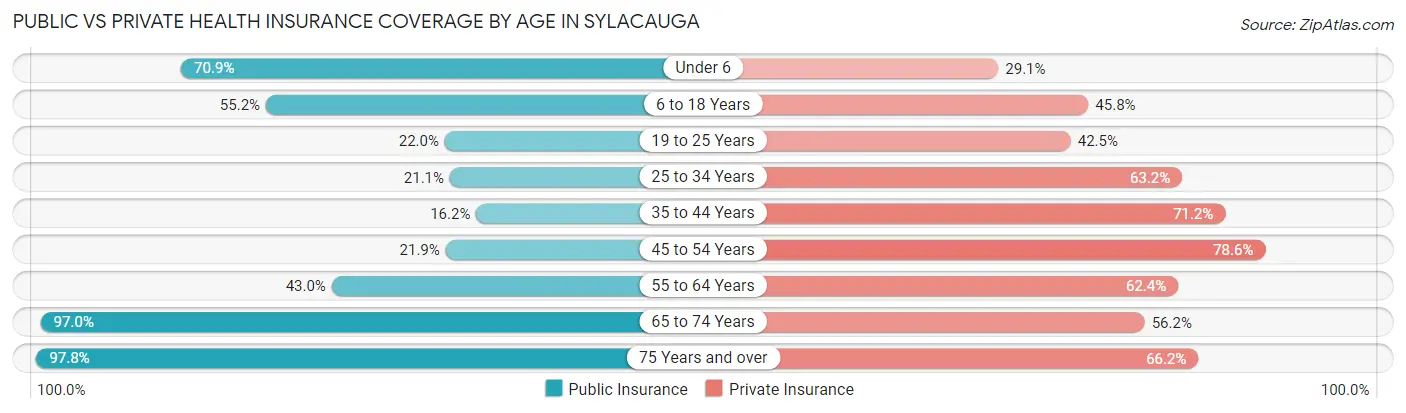
| Age Bracket | Public Insurance | Private Insurance |
| Under 6 | 586 (70.9%) | 240 (29.1%) |
| 6 to 18 Years | 1,287 (55.2%) | 1,067 (45.8%) |
| 19 to 25 Years | 160 (22.0%) | 309 (42.5%) |
| 25 to 34 Years | 445 (21.1%) | 1,334 (63.2%) |
| 35 to 44 Years | 175 (16.2%) | 770 (71.2%) |
| 45 to 54 Years | 297 (21.8%) | 1,068 (78.6%) |
| 55 to 64 Years | 731 (43.0%) | 1,061 (62.4%) |
| 65 to 74 Years | 1,308 (97.0%) | 758 (56.2%) |
| 75 Years and over | 754 (97.8%) | 510 (66.1%) |
| Total | 5,743 (46.9%) | 7,117 (58.1%) |
Disability Status by Sex by Age in Sylacauga
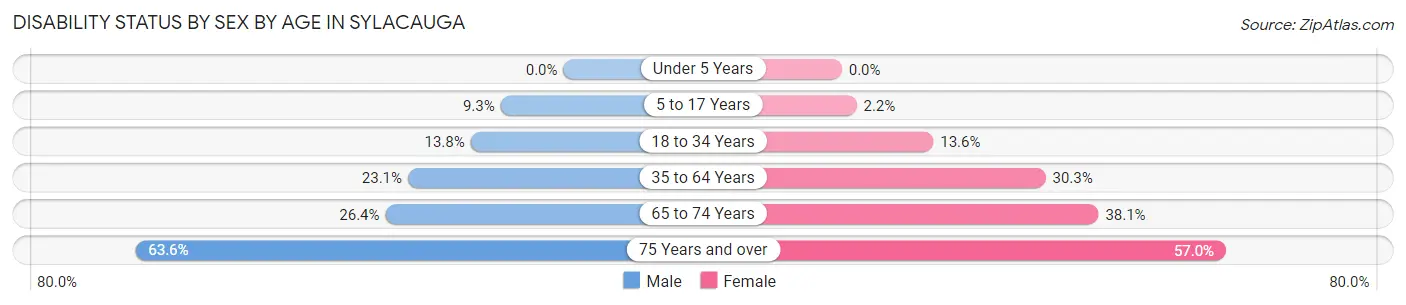
| Age Bracket | Male | Female |
| Under 5 Years | 0 (0.0%) | 0 (0.0%) |
| 5 to 17 Years | 96 (9.3%) | 29 (2.2%) |
| 18 to 34 Years | 192 (13.8%) | 219 (13.6%) |
| 35 to 64 Years | 412 (23.1%) | 713 (30.2%) |
| 65 to 74 Years | 194 (26.4%) | 234 (38.1%) |
| 75 Years and over | 129 (63.5%) | 324 (57.0%) |
Disability Class by Sex by Age in Sylacauga
Disability Class: Hearing Difficulty
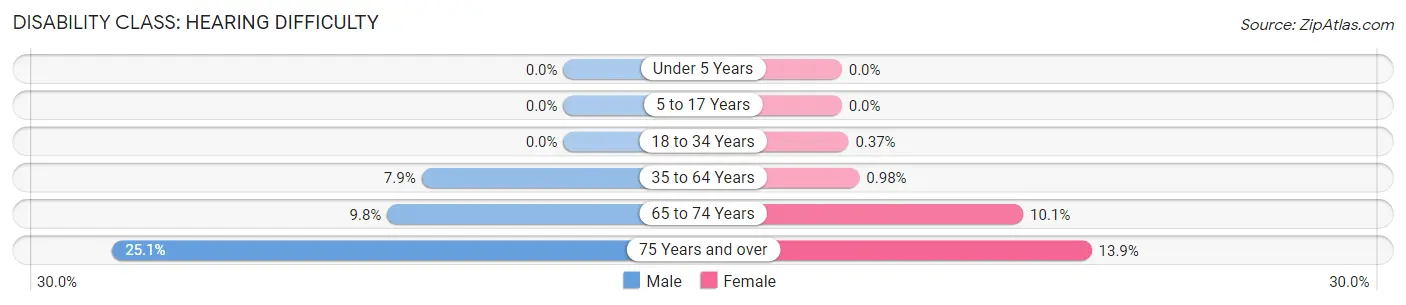
| Age Bracket | Male | Female |
| Under 5 Years | 0 (0.0%) | 0 (0.0%) |
| 5 to 17 Years | 0 (0.0%) | 0 (0.0%) |
| 18 to 34 Years | 0 (0.0%) | 6 (0.4%) |
| 35 to 64 Years | 141 (7.9%) | 23 (1.0%) |
| 65 to 74 Years | 72 (9.8%) | 62 (10.1%) |
| 75 Years and over | 51 (25.1%) | 79 (13.9%) |
Disability Class: Vision Difficulty
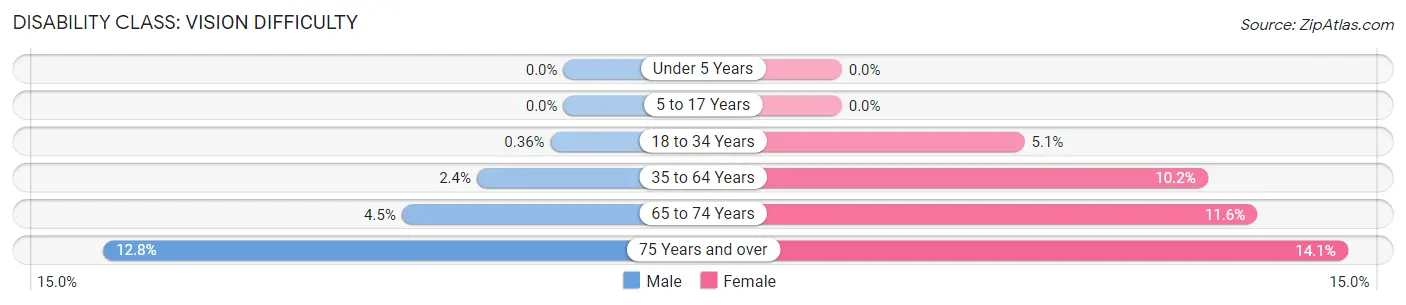
| Age Bracket | Male | Female |
| Under 5 Years | 0 (0.0%) | 0 (0.0%) |
| 5 to 17 Years | 0 (0.0%) | 0 (0.0%) |
| 18 to 34 Years | 5 (0.4%) | 82 (5.1%) |
| 35 to 64 Years | 43 (2.4%) | 240 (10.2%) |
| 65 to 74 Years | 33 (4.5%) | 71 (11.6%) |
| 75 Years and over | 26 (12.8%) | 80 (14.1%) |
Disability Class: Cognitive Difficulty
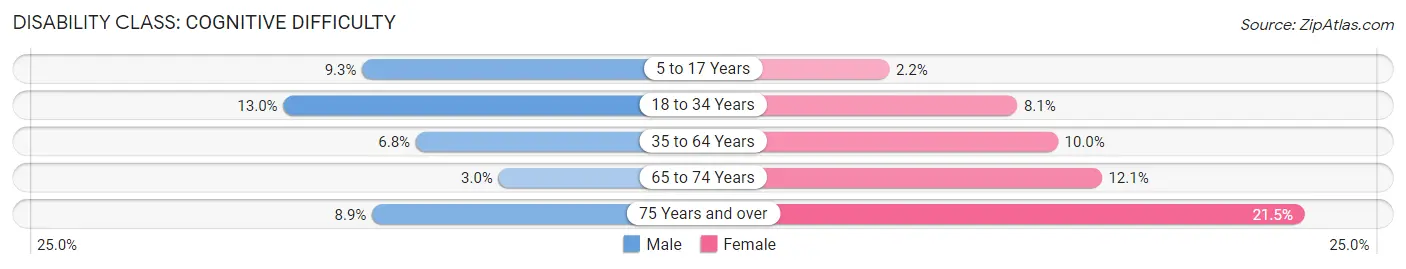
| Age Bracket | Male | Female |
| 5 to 17 Years | 96 (9.3%) | 29 (2.2%) |
| 18 to 34 Years | 181 (13.0%) | 131 (8.1%) |
| 35 to 64 Years | 122 (6.8%) | 236 (10.0%) |
| 65 to 74 Years | 22 (3.0%) | 74 (12.0%) |
| 75 Years and over | 18 (8.9%) | 122 (21.5%) |
Disability Class: Ambulatory Difficulty
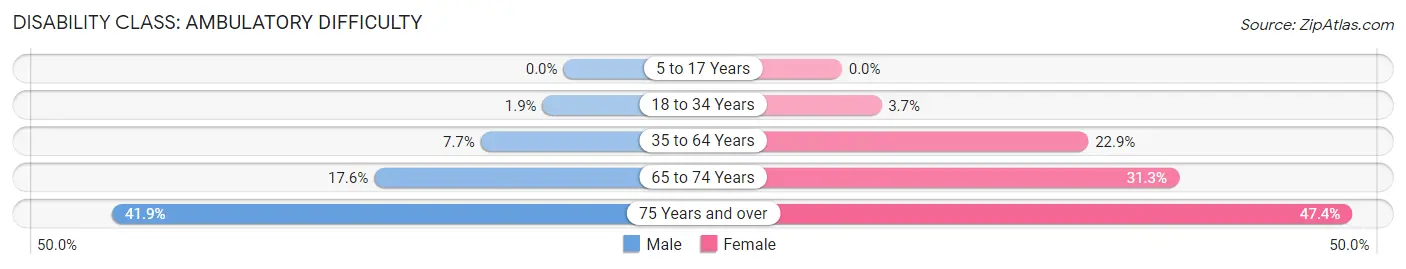
| Age Bracket | Male | Female |
| 5 to 17 Years | 0 (0.0%) | 0 (0.0%) |
| 18 to 34 Years | 27 (1.9%) | 59 (3.7%) |
| 35 to 64 Years | 137 (7.7%) | 539 (22.9%) |
| 65 to 74 Years | 129 (17.6%) | 192 (31.3%) |
| 75 Years and over | 85 (41.9%) | 269 (47.4%) |
Disability Class: Self-Care Difficulty
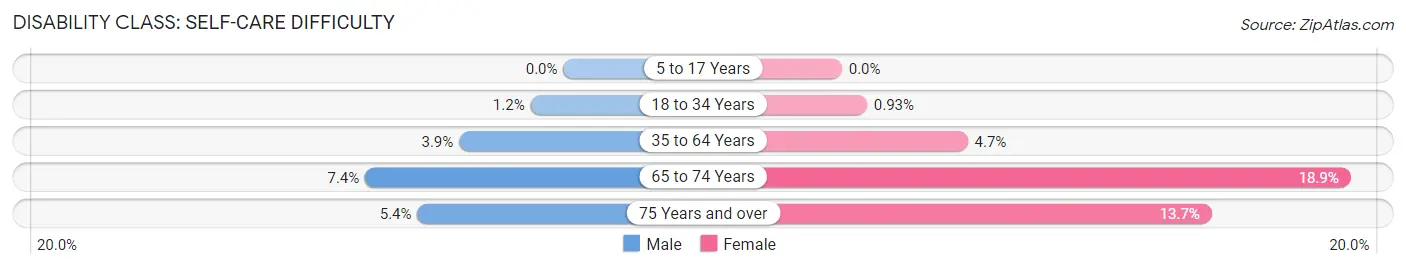
| Age Bracket | Male | Female |
| 5 to 17 Years | 0 (0.0%) | 0 (0.0%) |
| 18 to 34 Years | 17 (1.2%) | 15 (0.9%) |
| 35 to 64 Years | 69 (3.9%) | 110 (4.7%) |
| 65 to 74 Years | 54 (7.4%) | 116 (18.9%) |
| 75 Years and over | 11 (5.4%) | 78 (13.7%) |
Technology Access in Sylacauga
Computing Device Access in Sylacauga
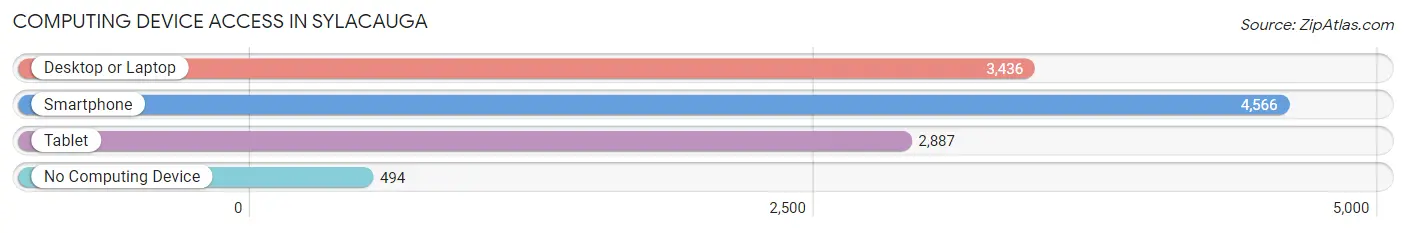
| Device Type | # Households | % Households |
| Desktop or Laptop | 3,436 | 64.9% |
| Smartphone | 4,566 | 86.3% |
| Tablet | 2,887 | 54.6% |
| No Computing Device | 494 | 9.3% |
| Total | 5,291 | 100.0% |
Internet Access in Sylacauga
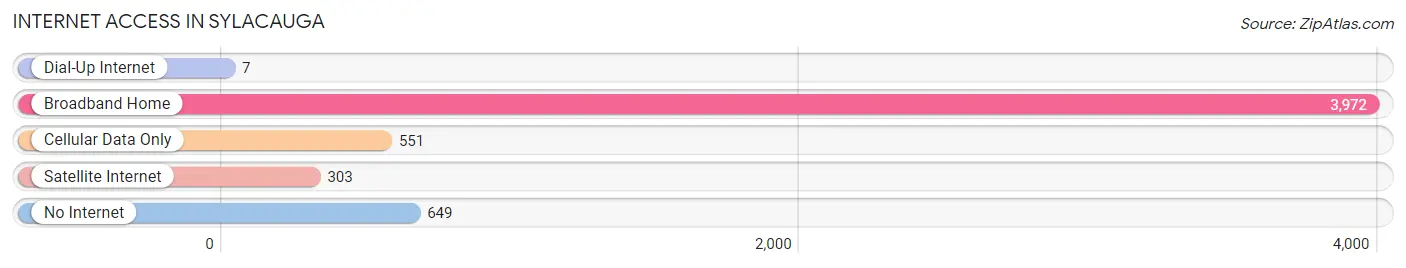
| Internet Type | # Households | % Households |
| Dial-Up Internet | 7 | 0.1% |
| Broadband Home | 3,972 | 75.1% |
| Cellular Data Only | 551 | 10.4% |
| Satellite Internet | 303 | 5.7% |
| No Internet | 649 | 12.3% |
| Total | 5,291 | 100.0% |
Sylacauga Summary
Sylacauga, Alabama is a city located in Talladega County, Alabama. It is the county seat of Talladega County and is located in the foothills of the Appalachian Mountains. The city is located approximately 50 miles east of Birmingham and is part of the Birmingham-Hoover Metropolitan Statistical Area. As of the 2010 census, the population of Sylacauga was 12,749.
Geography
Sylacauga is located at 33°10'N 86°14'W (33.17, -86.23). According to the U.S. Census Bureau, the city has a total area of 16.2 square miles (41.8 km2), of which 16.1 square miles (41.6 km2) is land and 0.1 square miles (0.2 km2) (0.62%) is water.
The city is located in the foothills of the Appalachian Mountains and is situated on the Coosa River. The city is located in the Piedmont region of Alabama and is part of the Black Belt region.
History
Sylacauga was founded in 1838 and was originally known as Oak Grove. The city was renamed in 1887 to honor the Native American tribe that once inhabited the area, the Creek Indians. The city was incorporated in 1887 and was the first city in Talladega County.
The city was an important center for the cotton industry in the late 19th and early 20th centuries. The city was also home to several marble quarries, which provided the marble for the Alabama State Capitol building in Montgomery.
Economy
Sylacauga is home to several major employers, including the Avondale Mills textile plant, the Alabama Power Company, and the Sylacauga Marble Quarry. The city is also home to several smaller businesses, including several retail stores, restaurants, and professional services.
The city is also home to several educational institutions, including the University of Alabama at Birmingham, Central Alabama Community College, and the Sylacauga City Schools.
Demographics
As of the 2010 census, there were 12,749 people, 5,093 households, and 3,323 families residing in the city. The population density was 790.3 people per square mile (305.7/km2). There were 5,717 housing units at an average density of 355.3 per square mile (137.2/km2). The racial makeup of the city was 68.2% White, 28.7% African American, 0.2% Native American, 0.7% Asian, 0.1% Pacific Islander, 0.7% from other races, and 1.4% from two or more races. Hispanic or Latino of any race were 2.2% of the population.
There were 5,093 households, out of which 28.2% had children under the age of 18 living with them, 41.2% were married couples living together, 19.2% had a female householder with no husband present, and 35.3% were non-families. 30.3% of all households were made up of individuals, and 12.7% had someone living alone who was 65 years of age or older. The average household size was 2.41 and the average family size was 3.00.
In the city, the population was spread out, with 24.2% under the age of 18, 8.7% from 18 to 24, 25.7% from 25 to 44, 24.3% from 45 to 64, and 17.1% who were 65 years of age or older. The median age was 38 years. For every 100 females, there were 87.2 males. For every 100 females age 18 and over, there were 82.3 males.
The median income for a household in the city was $30,945, and the median income for a family was $37,945. Males had a median income of $31,945 versus $21,945 for females. The per capita income for the city was $17,945. About 14.7% of families and 17.7% of the population were below the poverty line, including 25.7% of those under age 18 and 14.7% of those age 65 or over.
Common Questions
What is Per Capita Income in Sylacauga?
Per Capita income in Sylacauga is $25,806.
What is the Median Family Income in Sylacauga?
Median Family Income in Sylacauga is $65,164.
What is the Median Household income in Sylacauga?
Median Household Income in Sylacauga is $46,137.
What is Income or Wage Gap in Sylacauga?
Income or Wage Gap in Sylacauga is 45.7%.
Women in Sylacauga earn 54.3 cents for every dollar earned by a man.
What is Family Income Deficit in Sylacauga?
Family Income Deficit in Sylacauga is $11,128.
Families that are below poverty line in Sylacauga earn $11,128 less on average than the poverty threshold level.
What is Inequality or Gini Index in Sylacauga?
Inequality or Gini Index in Sylacauga is 0.46.
What is the Total Population of Sylacauga?
Total Population of Sylacauga is 12,465.
What is the Total Male Population of Sylacauga?
Total Male Population of Sylacauga is 5,389.
What is the Total Female Population of Sylacauga?
Total Female Population of Sylacauga is 7,076.
What is the Ratio of Males per 100 Females in Sylacauga?
There are 76.16 Males per 100 Females in Sylacauga.
What is the Ratio of Females per 100 Males in Sylacauga?
There are 131.30 Females per 100 Males in Sylacauga.
What is the Median Population Age in Sylacauga?
Median Population Age in Sylacauga is 37.2 Years.
What is the Average Family Size in Sylacauga
Average Family Size in Sylacauga is 2.8 People.
What is the Average Household Size in Sylacauga
Average Household Size in Sylacauga is 2.3 People.
How Large is the Labor Force in Sylacauga?
There are 5,613 People in the Labor Forcein in Sylacauga.
What is the Percentage of People in the Labor Force in Sylacauga?
57.6% of People are in the Labor Force in Sylacauga.
What is the Unemployment Rate in Sylacauga?
Unemployment Rate in Sylacauga is 8.9%.