U.S. Virgin Islander Wage/Income Gap
COMPARE
U.S. Virgin Islander
Select to Compare
Wage/Income Gap
U.S. Virgin Islander Wage/Income Gap
21.5%
WAGE/INCOME GAP
100.0/ 100
METRIC RATING
45th/ 347
METRIC RANK
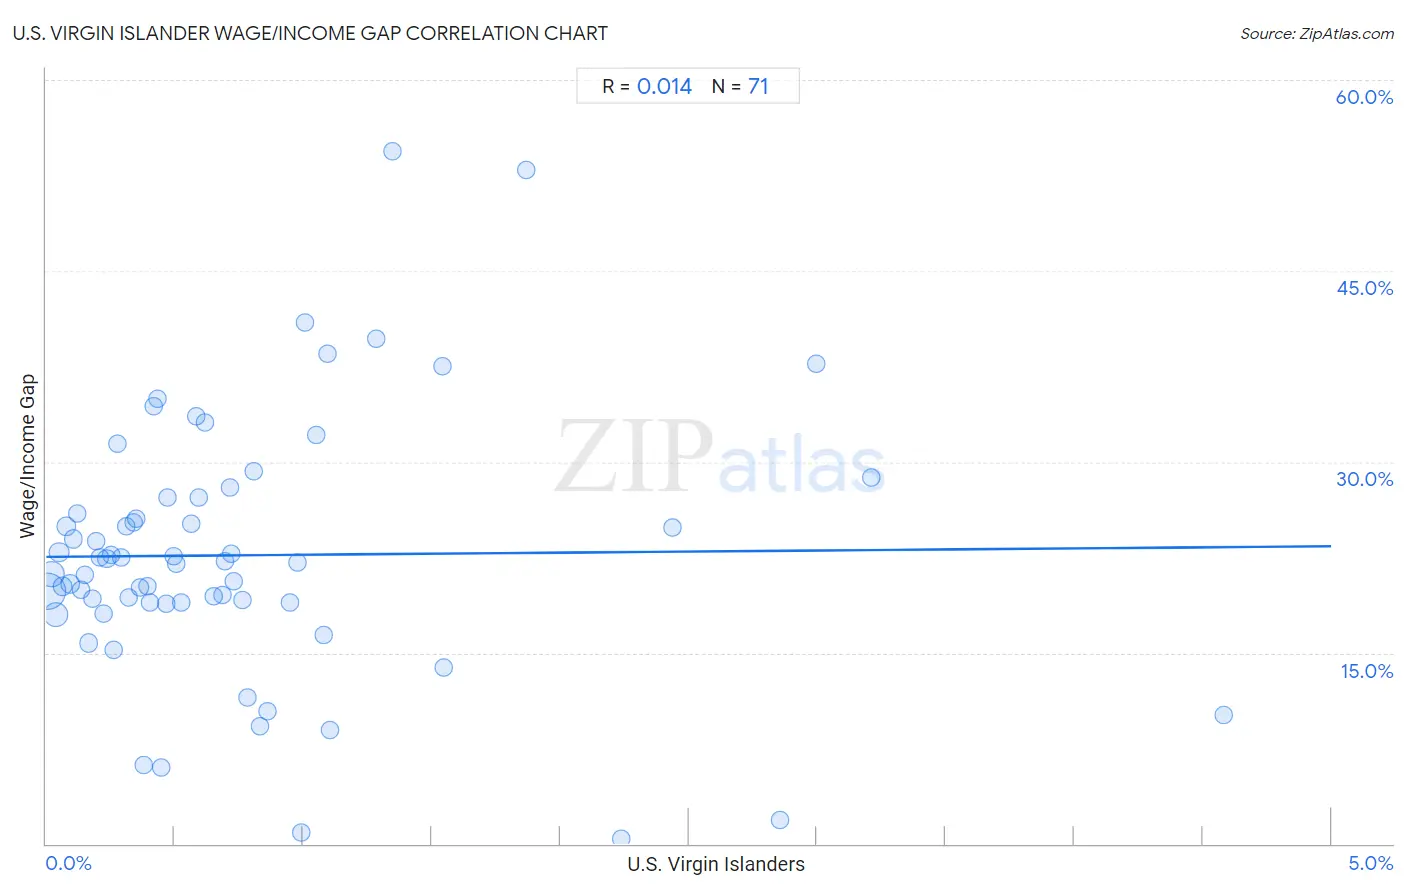
U.S. Virgin Islander Wage/Income Gap Correlation Chart
The statistical analysis conducted on geographies consisting of 87,518,353 people shows no correlation between the proportion of U.S. Virgin Islanders and wage/income gap percentage in the United States with a correlation coefficient (R) of 0.014 and weighted average of 21.5%. On average, for every 1% (one percent) increase in U.S. Virgin Islanders within a typical geography, there is an increase of 0.17% in wage/income gap percentage.
It is essential to understand that the correlation between the percentage of U.S. Virgin Islanders and wage/income gap percentage does not imply a direct cause-and-effect relationship. It remains uncertain whether the presence of U.S. Virgin Islanders influences an upward or downward trend in the level of wage/income gap percentage within an area, or if U.S. Virgin Islanders simply ended up residing in those areas with higher or lower levels of wage/income gap percentage due to other factors.
Demographics Similar to U.S. Virgin Islanders by Wage/Income Gap
In terms of wage/income gap, the demographic groups most similar to U.S. Virgin Islanders are Immigrants from Ethiopia (21.6%, a difference of 0.12%), Immigrants from Eritrea (21.4%, a difference of 0.44%), Sierra Leonean (21.4%, a difference of 0.46%), Liberian (21.4%, a difference of 0.52%), and Immigrants from Sierra Leone (21.4%, a difference of 0.52%).
| Demographics | Rating | Rank | Wage/Income Gap |
| Immigrants from Belize | 100.0 /100 | #38 | Exceptional 21.3% |
| Colville | 100.0 /100 | #39 | Exceptional 21.3% |
| Lumbee | 100.0 /100 | #40 | Exceptional 21.3% |
| Liberians | 100.0 /100 | #41 | Exceptional 21.4% |
| Immigrants from Sierra Leone | 100.0 /100 | #42 | Exceptional 21.4% |
| Sierra Leoneans | 100.0 /100 | #43 | Exceptional 21.4% |
| Immigrants from Eritrea | 100.0 /100 | #44 | Exceptional 21.4% |
| U.S. Virgin Islanders | 100.0 /100 | #45 | Exceptional 21.5% |
| Immigrants from Ethiopia | 100.0 /100 | #46 | Exceptional 21.6% |
| Immigrants from Congo | 100.0 /100 | #47 | Exceptional 21.7% |
| Blacks/African Americans | 100.0 /100 | #48 | Exceptional 21.7% |
| Ethiopians | 100.0 /100 | #49 | Exceptional 21.8% |
| Immigrants from Western Africa | 100.0 /100 | #50 | Exceptional 22.0% |
| Tohono O'odham | 100.0 /100 | #51 | Exceptional 22.1% |
| Immigrants from Cameroon | 100.0 /100 | #52 | Exceptional 22.2% |
U.S. Virgin Islander Wage/Income Gap Correlation Summary
| Measurement | U.S. Virgin Islander Data | Wage/Income Gap Data |
| Minimum | 0.0060% | 0.43% |
| Maximum | 4.6% | 54.4% |
| Range | 4.6% | 54.0% |
| Mean | 0.77% | 22.7% |
| Median | 0.51% | 22.1% |
| Interquartile 25% (IQ1) | 0.25% | 18.9% |
| Interquartile 75% (IQ3) | 0.98% | 27.2% |
| Interquartile Range (IQR) | 0.73% | 8.2% |
| Standard Deviation (Sample) | 0.84% | 10.2% |
| Standard Deviation (Population) | 0.83% | 10.1% |
Correlation Details
| U.S. Virgin Islander Percentile | Sample Size | Wage/Income Gap |
[ 0.0% - 0.5% ] 0.0060% | 38,650,694 | 19.8% |
[ 0.0% - 0.5% ] 0.020% | 13,785,726 | 21.2% |
[ 0.0% - 0.5% ] 0.036% | 14,364,905 | 18.0% |
[ 0.0% - 0.5% ] 0.050% | 3,648,517 | 22.9% |
[ 0.0% - 0.5% ] 0.064% | 2,286,273 | 20.3% |
[ 0.0% - 0.5% ] 0.079% | 2,230,708 | 24.9% |
[ 0.0% - 0.5% ] 0.093% | 1,892,764 | 20.4% |
[ 0.0% - 0.5% ] 0.11% | 1,653,518 | 23.9% |
[ 0.0% - 0.5% ] 0.12% | 1,083,853 | 25.9% |
[ 0.0% - 0.5% ] 0.14% | 1,041,176 | 19.9% |
[ 0.0% - 0.5% ] 0.15% | 643,059 | 21.1% |
[ 0.0% - 0.5% ] 0.16% | 385,386 | 15.8% |
[ 0.0% - 0.5% ] 0.18% | 295,741 | 19.2% |
[ 0.0% - 0.5% ] 0.19% | 337,075 | 23.7% |
[ 0.0% - 0.5% ] 0.21% | 500,273 | 22.5% |
[ 0.0% - 0.5% ] 0.22% | 490,125 | 18.0% |
[ 0.0% - 0.5% ] 0.24% | 308,816 | 22.4% |
[ 0.0% - 0.5% ] 0.25% | 389,797 | 22.7% |
[ 0.0% - 0.5% ] 0.26% | 381,877 | 15.2% |
[ 0.0% - 0.5% ] 0.28% | 299,504 | 31.5% |
[ 0.0% - 0.5% ] 0.29% | 203,721 | 22.5% |
[ 0.0% - 0.5% ] 0.31% | 68,733 | 25.0% |
[ 0.0% - 0.5% ] 0.32% | 186,497 | 19.4% |
[ 0.0% - 0.5% ] 0.34% | 442,018 | 25.3% |
[ 0.0% - 0.5% ] 0.35% | 212,624 | 25.5% |
[ 0.0% - 0.5% ] 0.37% | 115,731 | 20.1% |
[ 0.0% - 0.5% ] 0.38% | 37,275 | 6.1% |
[ 0.0% - 0.5% ] 0.39% | 179,183 | 20.2% |
[ 0.0% - 0.5% ] 0.40% | 32,285 | 18.9% |
[ 0.0% - 0.5% ] 0.42% | 147,972 | 34.3% |
[ 0.0% - 0.5% ] 0.43% | 3,020 | 35.0% |
[ 0.0% - 0.5% ] 0.45% | 47,668 | 6.0% |
[ 0.0% - 0.5% ] 0.47% | 47,883 | 18.9% |
[ 0.0% - 0.5% ] 0.47% | 37,604 | 27.2% |
[ 0.0% - 0.5% ] 0.49% | 91,974 | 22.6% |
[ 0.5% - 1.0% ] 0.51% | 32,450 | 22.0% |
[ 0.5% - 1.0% ] 0.52% | 79,395 | 19.0% |
[ 0.5% - 1.0% ] 0.57% | 19,959 | 25.2% |
[ 0.5% - 1.0% ] 0.58% | 32,964 | 33.6% |
[ 0.5% - 1.0% ] 0.59% | 22,294 | 27.2% |
[ 0.5% - 1.0% ] 0.62% | 53,388 | 33.1% |
[ 0.5% - 1.0% ] 0.65% | 78,624 | 19.4% |
[ 0.5% - 1.0% ] 0.68% | 78,055 | 19.6% |
[ 0.5% - 1.0% ] 0.69% | 135,828 | 22.2% |
[ 0.5% - 1.0% ] 0.71% | 3,086 | 28.0% |
[ 0.5% - 1.0% ] 0.72% | 43,820 | 22.8% |
[ 0.5% - 1.0% ] 0.73% | 3,962 | 20.6% |
[ 0.5% - 1.0% ] 0.77% | 20,903 | 19.1% |
[ 0.5% - 1.0% ] 0.78% | 255 | 11.5% |
[ 0.5% - 1.0% ] 0.81% | 2,725 | 29.2% |
[ 0.5% - 1.0% ] 0.83% | 88,272 | 9.3% |
[ 0.5% - 1.0% ] 0.86% | 30,306 | 10.4% |
[ 0.5% - 1.0% ] 0.95% | 43,516 | 18.9% |
[ 0.5% - 1.0% ] 0.98% | 14,741 | 22.1% |
[ 0.5% - 1.0% ] 0.99% | 1,814 | 0.84% |
[ 1.0% - 1.5% ] 1.01% | 27,594 | 41.0% |
[ 1.0% - 1.5% ] 1.05% | 37,954 | 32.1% |
[ 1.0% - 1.5% ] 1.08% | 13,706 | 16.4% |
[ 1.0% - 1.5% ] 1.09% | 15,289 | 38.5% |
[ 1.0% - 1.5% ] 1.10% | 65,549 | 9.0% |
[ 1.0% - 1.5% ] 1.28% | 19,088 | 39.7% |
[ 1.0% - 1.5% ] 1.35% | 3,415 | 54.4% |
[ 1.5% - 2.0% ] 1.54% | 13,425 | 37.5% |
[ 1.5% - 2.0% ] 1.54% | 971 | 13.8% |
[ 1.5% - 2.0% ] 1.87% | 2,465 | 52.9% |
[ 2.0% - 2.5% ] 2.24% | 2,144 | 0.43% |
[ 2.0% - 2.5% ] 2.44% | 4,880 | 24.8% |
[ 2.5% - 3.0% ] 2.86% | 70 | 1.9% |
[ 2.5% - 3.0% ] 3.00% | 467 | 37.7% |
[ 3.0% - 3.5% ] 3.21% | 218 | 28.7% |
[ 4.5% - 5.0% ] 4.58% | 786 | 10.1% |