U.S. Virgin Islander Married-Couple Family Poverty
COMPARE
U.S. Virgin Islander
Select to Compare
Married-Couple Family Poverty
U.S. Virgin Islander Married-Couple Family Poverty
6.6%
POVERTY | MARRIED-COUPLE FAMILIES
0.0/ 100
METRIC RATING
296th/ 347
METRIC RANK
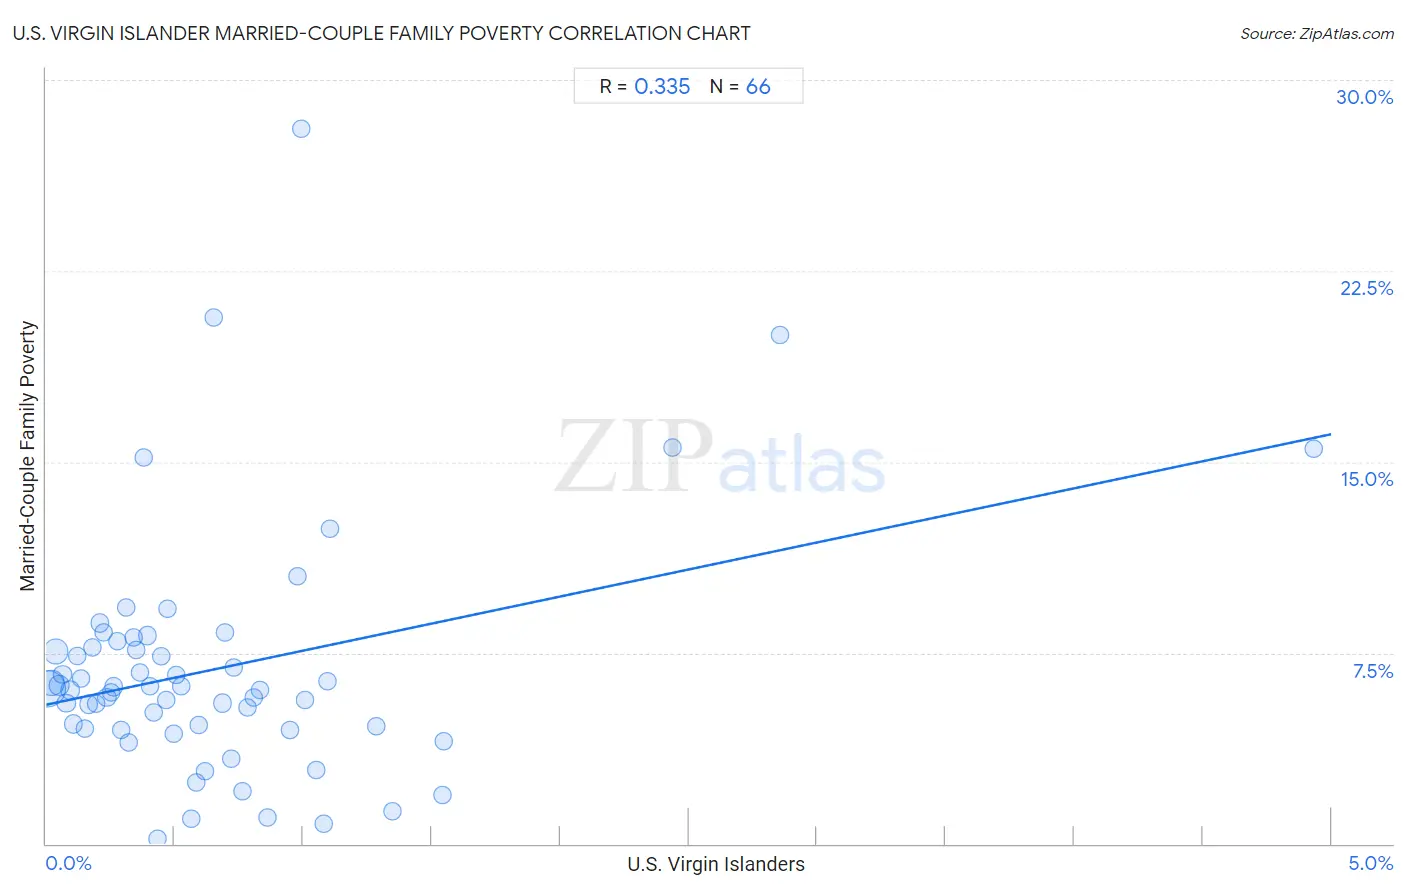
U.S. Virgin Islander Married-Couple Family Poverty Correlation Chart
The statistical analysis conducted on geographies consisting of 87,431,067 people shows a mild positive correlation between the proportion of U.S. Virgin Islanders and poverty level among married-couple families in the United States with a correlation coefficient (R) of 0.335 and weighted average of 6.6%. On average, for every 1% (one percent) increase in U.S. Virgin Islanders within a typical geography, there is an increase of 2.1% in poverty level among married-couple families.
It is essential to understand that the correlation between the percentage of U.S. Virgin Islanders and poverty level among married-couple families does not imply a direct cause-and-effect relationship. It remains uncertain whether the presence of U.S. Virgin Islanders influences an upward or downward trend in the level of poverty level among married-couple families within an area, or if U.S. Virgin Islanders simply ended up residing in those areas with higher or lower levels of poverty level among married-couple families due to other factors.
Demographics Similar to U.S. Virgin Islanders by Married-Couple Family Poverty
In terms of married-couple family poverty, the demographic groups most similar to U.S. Virgin Islanders are Kiowa (6.6%, a difference of 0.010%), Immigrants from Guyana (6.7%, a difference of 0.070%), Immigrants from Uzbekistan (6.6%, a difference of 0.10%), Bahamian (6.6%, a difference of 0.39%), and Nicaraguan (6.7%, a difference of 0.62%).
| Demographics | Rating | Rank | Married-Couple Family Poverty |
| Nepalese | 0.0 /100 | #289 | Tragic 6.5% |
| Immigrants from Barbados | 0.0 /100 | #290 | Tragic 6.5% |
| Belizeans | 0.0 /100 | #291 | Tragic 6.5% |
| Immigrants from Lebanon | 0.0 /100 | #292 | Tragic 6.6% |
| Arapaho | 0.0 /100 | #293 | Tragic 6.6% |
| Bahamians | 0.0 /100 | #294 | Tragic 6.6% |
| Immigrants from Uzbekistan | 0.0 /100 | #295 | Tragic 6.6% |
| U.S. Virgin Islanders | 0.0 /100 | #296 | Tragic 6.6% |
| Kiowa | 0.0 /100 | #297 | Tragic 6.6% |
| Immigrants from Guyana | 0.0 /100 | #298 | Tragic 6.7% |
| Nicaraguans | 0.0 /100 | #299 | Tragic 6.7% |
| Immigrants from Belize | 0.0 /100 | #300 | Tragic 6.7% |
| Central Americans | 0.0 /100 | #301 | Tragic 6.7% |
| Immigrants from Ecuador | 0.0 /100 | #302 | Tragic 6.7% |
| Immigrants from El Salvador | 0.0 /100 | #303 | Tragic 6.8% |
U.S. Virgin Islander Married-Couple Family Poverty Correlation Summary
| Measurement | U.S. Virgin Islander Data | Married-Couple Family Poverty Data |
| Minimum | 0.0060% | 0.18% |
| Maximum | 4.9% | 28.1% |
| Range | 4.9% | 27.9% |
| Mean | 0.66% | 6.9% |
| Median | 0.47% | 6.1% |
| Interquartile 25% (IQ1) | 0.24% | 4.5% |
| Interquartile 75% (IQ3) | 0.83% | 7.7% |
| Interquartile Range (IQR) | 0.60% | 3.2% |
| Standard Deviation (Sample) | 0.75% | 4.8% |
| Standard Deviation (Population) | 0.74% | 4.7% |
Correlation Details
| U.S. Virgin Islander Percentile | Sample Size | Married-Couple Family Poverty |
[ 0.0% - 0.5% ] 0.0060% | 38,650,694 | 6.1% |
[ 0.0% - 0.5% ] 0.020% | 13,781,732 | 6.3% |
[ 0.0% - 0.5% ] 0.036% | 14,364,905 | 7.6% |
[ 0.0% - 0.5% ] 0.050% | 3,648,517 | 6.2% |
[ 0.0% - 0.5% ] 0.064% | 2,286,273 | 6.7% |
[ 0.0% - 0.5% ] 0.079% | 2,230,708 | 5.5% |
[ 0.0% - 0.5% ] 0.093% | 1,892,764 | 6.0% |
[ 0.0% - 0.5% ] 0.11% | 1,647,934 | 4.7% |
[ 0.0% - 0.5% ] 0.12% | 1,078,039 | 7.4% |
[ 0.0% - 0.5% ] 0.14% | 1,041,176 | 6.5% |
[ 0.0% - 0.5% ] 0.15% | 643,059 | 4.5% |
[ 0.0% - 0.5% ] 0.16% | 381,142 | 5.5% |
[ 0.0% - 0.5% ] 0.18% | 295,741 | 7.7% |
[ 0.0% - 0.5% ] 0.19% | 337,075 | 5.5% |
[ 0.0% - 0.5% ] 0.21% | 500,273 | 8.7% |
[ 0.0% - 0.5% ] 0.22% | 490,125 | 8.3% |
[ 0.0% - 0.5% ] 0.24% | 308,816 | 5.8% |
[ 0.0% - 0.5% ] 0.25% | 379,125 | 6.0% |
[ 0.0% - 0.5% ] 0.26% | 381,877 | 6.2% |
[ 0.0% - 0.5% ] 0.28% | 299,504 | 8.0% |
[ 0.0% - 0.5% ] 0.29% | 202,363 | 4.5% |
[ 0.0% - 0.5% ] 0.31% | 68,733 | 9.3% |
[ 0.0% - 0.5% ] 0.32% | 177,950 | 4.0% |
[ 0.0% - 0.5% ] 0.34% | 442,018 | 8.1% |
[ 0.0% - 0.5% ] 0.35% | 198,669 | 7.6% |
[ 0.0% - 0.5% ] 0.37% | 115,731 | 6.7% |
[ 0.0% - 0.5% ] 0.38% | 35,399 | 15.2% |
[ 0.0% - 0.5% ] 0.39% | 179,183 | 8.2% |
[ 0.0% - 0.5% ] 0.40% | 32,285 | 6.2% |
[ 0.0% - 0.5% ] 0.42% | 145,330 | 5.2% |
[ 0.0% - 0.5% ] 0.43% | 3,020 | 0.18% |
[ 0.0% - 0.5% ] 0.45% | 47,668 | 7.4% |
[ 0.0% - 0.5% ] 0.47% | 47,883 | 5.7% |
[ 0.0% - 0.5% ] 0.47% | 37,604 | 9.2% |
[ 0.0% - 0.5% ] 0.49% | 91,974 | 4.3% |
[ 0.5% - 1.0% ] 0.51% | 32,450 | 6.6% |
[ 0.5% - 1.0% ] 0.52% | 76,887 | 6.2% |
[ 0.5% - 1.0% ] 0.57% | 19,959 | 0.99% |
[ 0.5% - 1.0% ] 0.58% | 32,964 | 2.4% |
[ 0.5% - 1.0% ] 0.59% | 22,294 | 4.7% |
[ 0.5% - 1.0% ] 0.62% | 50,337 | 2.9% |
[ 0.5% - 1.0% ] 0.65% | 78,624 | 20.7% |
[ 0.5% - 1.0% ] 0.68% | 78,055 | 5.5% |
[ 0.5% - 1.0% ] 0.69% | 135,828 | 8.3% |
[ 0.5% - 1.0% ] 0.72% | 43,820 | 3.3% |
[ 0.5% - 1.0% ] 0.73% | 3,962 | 6.9% |
[ 0.5% - 1.0% ] 0.77% | 20,903 | 2.0% |
[ 0.5% - 1.0% ] 0.78% | 255 | 5.4% |
[ 0.5% - 1.0% ] 0.81% | 2,725 | 5.7% |
[ 0.5% - 1.0% ] 0.83% | 88,272 | 6.0% |
[ 0.5% - 1.0% ] 0.86% | 30,306 | 1.0% |
[ 0.5% - 1.0% ] 0.95% | 36,945 | 4.5% |
[ 0.5% - 1.0% ] 0.98% | 14,741 | 10.5% |
[ 0.5% - 1.0% ] 0.99% | 1,814 | 28.1% |
[ 1.0% - 1.5% ] 1.01% | 24,317 | 5.6% |
[ 1.0% - 1.5% ] 1.05% | 37,954 | 2.9% |
[ 1.0% - 1.5% ] 1.08% | 11,955 | 0.81% |
[ 1.0% - 1.5% ] 1.09% | 15,289 | 6.4% |
[ 1.0% - 1.5% ] 1.10% | 62,827 | 12.4% |
[ 1.0% - 1.5% ] 1.28% | 19,088 | 4.6% |
[ 1.0% - 1.5% ] 1.35% | 3,415 | 1.3% |
[ 1.5% - 2.0% ] 1.54% | 13,425 | 1.9% |
[ 1.5% - 2.0% ] 1.54% | 971 | 4.0% |
[ 2.0% - 2.5% ] 2.44% | 4,880 | 15.6% |
[ 2.5% - 3.0% ] 2.86% | 70 | 20.0% |
[ 4.5% - 5.0% ] 4.93% | 446 | 15.5% |