Ukrainian No Vehicles in Household
COMPARE
Ukrainian
Select to Compare
No Vehicles in Household
Ukrainian No Vehicles in Household
10.7%
NO VEHICLES AVAILABLE
28.0/ 100
METRIC RATING
193rd/ 347
METRIC RANK
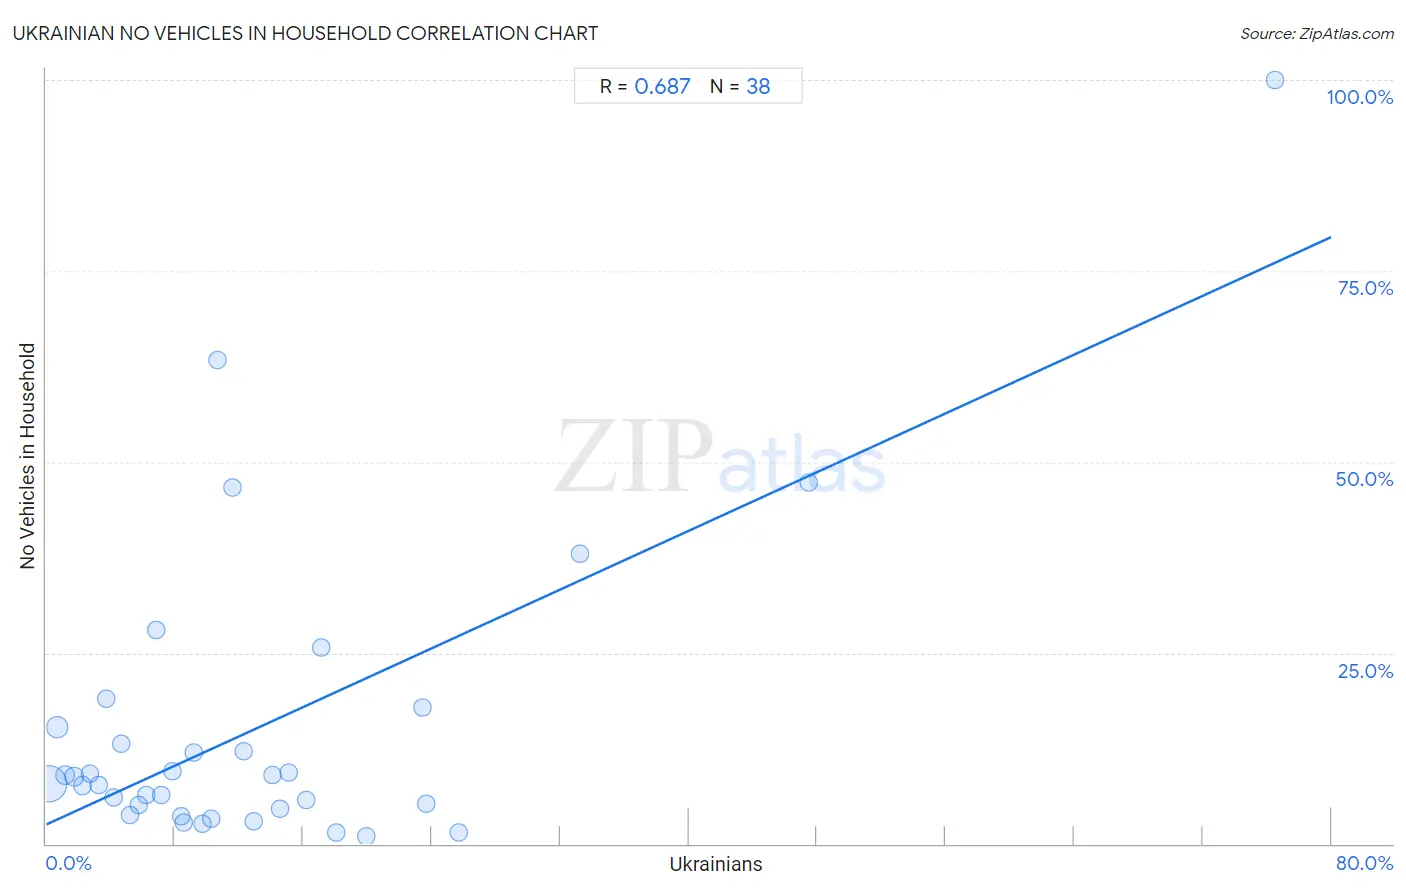
Ukrainian No Vehicles in Household Correlation Chart
The statistical analysis conducted on geographies consisting of 446,891,229 people shows a significant positive correlation between the proportion of Ukrainians and percentage of households with no vehicle available in the United States with a correlation coefficient (R) of 0.687 and weighted average of 10.7%. On average, for every 1% (one percent) increase in Ukrainians within a typical geography, there is an increase of 0.96% in percentage of households with no vehicle available.
It is essential to understand that the correlation between the percentage of Ukrainians and percentage of households with no vehicle available does not imply a direct cause-and-effect relationship. It remains uncertain whether the presence of Ukrainians influences an upward or downward trend in the level of percentage of households with no vehicle available within an area, or if Ukrainians simply ended up residing in those areas with higher or lower levels of percentage of households with no vehicle available due to other factors.
Demographics Similar to Ukrainians by No Vehicles in Household
In terms of no vehicles in household, the demographic groups most similar to Ukrainians are Pueblo (10.8%, a difference of 0.17%), Immigrants from Brazil (10.8%, a difference of 0.29%), Central American (10.8%, a difference of 0.63%), Carpatho Rusyn (10.7%, a difference of 0.64%), and Shoshone (10.8%, a difference of 0.67%).
| Demographics | Rating | Rank | No Vehicles in Household |
| German Russians | 40.6 /100 | #186 | Average 10.5% |
| Immigrants from Poland | 38.4 /100 | #187 | Fair 10.6% |
| Immigrants from Armenia | 37.5 /100 | #188 | Fair 10.6% |
| Immigrants from Eritrea | 36.3 /100 | #189 | Fair 10.6% |
| Immigrants from North Macedonia | 34.6 /100 | #190 | Fair 10.6% |
| Immigrants from Northern Europe | 33.1 /100 | #191 | Fair 10.7% |
| Carpatho Rusyns | 32.1 /100 | #192 | Fair 10.7% |
| Ukrainians | 28.0 /100 | #193 | Fair 10.7% |
| Pueblo | 27.0 /100 | #194 | Fair 10.8% |
| Immigrants from Brazil | 26.3 /100 | #195 | Fair 10.8% |
| Central Americans | 24.3 /100 | #196 | Fair 10.8% |
| Shoshone | 24.1 /100 | #197 | Fair 10.8% |
| Immigrants from Sweden | 22.9 /100 | #198 | Fair 10.8% |
| Immigrants from Asia | 21.3 /100 | #199 | Fair 10.9% |
| Cambodians | 19.6 /100 | #200 | Poor 10.9% |
Ukrainian No Vehicles in Household Correlation Summary
| Measurement | Ukrainian Data | No Vehicles in Household Data |
| Minimum | 0.19% | 1.0% |
| Maximum | 76.5% | 100.0% |
| Range | 76.3% | 99.0% |
| Mean | 13.2% | 15.2% |
| Median | 9.5% | 8.3% |
| Interquartile 25% (IQ1) | 4.7% | 4.6% |
| Interquartile 75% (IQ3) | 16.2% | 15.2% |
| Interquartile Range (IQR) | 11.5% | 10.7% |
| Standard Deviation (Sample) | 14.3% | 20.0% |
| Standard Deviation (Population) | 14.1% | 19.8% |
Correlation Details
| Ukrainian Percentile | Sample Size | No Vehicles in Household |
[ 0.0% - 0.5% ] 0.19% | 334,008,183 | 7.9% |
[ 0.5% - 1.0% ] 0.70% | 77,702,190 | 15.2% |
[ 1.0% - 1.5% ] 1.19% | 18,937,251 | 9.0% |
[ 1.5% - 2.0% ] 1.73% | 7,865,965 | 8.8% |
[ 2.0% - 2.5% ] 2.24% | 2,854,663 | 7.6% |
[ 2.5% - 3.0% ] 2.70% | 2,299,157 | 9.1% |
[ 3.0% - 3.5% ] 3.25% | 676,983 | 7.7% |
[ 3.5% - 4.0% ] 3.73% | 765,443 | 19.0% |
[ 4.0% - 4.5% ] 4.19% | 370,329 | 6.1% |
[ 4.5% - 5.0% ] 4.68% | 379,805 | 13.0% |
[ 5.0% - 5.5% ] 5.19% | 137,964 | 3.8% |
[ 5.5% - 6.0% ] 5.76% | 304,011 | 5.1% |
[ 6.0% - 6.5% ] 6.20% | 143,483 | 6.4% |
[ 6.5% - 7.0% ] 6.82% | 100,311 | 28.0% |
[ 7.0% - 7.5% ] 7.17% | 72,653 | 6.5% |
[ 7.5% - 8.0% ] 7.85% | 5,876 | 9.5% |
[ 8.0% - 8.5% ] 8.37% | 84,930 | 3.6% |
[ 8.5% - 9.0% ] 8.56% | 55,679 | 2.7% |
[ 9.0% - 9.5% ] 9.21% | 10,088 | 11.9% |
[ 9.5% - 10.0% ] 9.74% | 9,505 | 2.7% |
[ 10.0% - 10.5% ] 10.26% | 4,053 | 3.3% |
[ 10.5% - 11.0% ] 10.68% | 2,819 | 63.3% |
[ 11.5% - 12.0% ] 11.60% | 84,846 | 46.7% |
[ 12.0% - 12.5% ] 12.29% | 1,766 | 12.1% |
[ 12.5% - 13.0% ] 12.89% | 2,079 | 3.0% |
[ 14.0% - 14.5% ] 14.06% | 1,906 | 9.0% |
[ 14.5% - 15.0% ] 14.56% | 1,195 | 4.6% |
[ 15.0% - 15.5% ] 15.13% | 998 | 9.3% |
[ 16.0% - 16.5% ] 16.17% | 3,000 | 5.7% |
[ 17.0% - 17.5% ] 17.10% | 690 | 25.8% |
[ 18.0% - 18.5% ] 18.08% | 968 | 1.5% |
[ 19.5% - 20.0% ] 19.92% | 492 | 1.0% |
[ 23.0% - 23.5% ] 23.42% | 222 | 17.8% |
[ 23.5% - 24.0% ] 23.67% | 300 | 5.2% |
[ 25.5% - 26.0% ] 25.65% | 382 | 1.6% |
[ 33.0% - 33.5% ] 33.22% | 584 | 38.0% |
[ 47.0% - 47.5% ] 47.43% | 409 | 47.3% |
[ 76.0% - 76.5% ] 76.47% | 51 | 100.0% |