Ukrainian Female Disability
COMPARE
Ukrainian
Select to Compare
Female Disability
Ukrainian Female Disability
12.3%
DISABILITY | FEMALES
27.2/ 100
METRIC RATING
194th/ 347
METRIC RANK
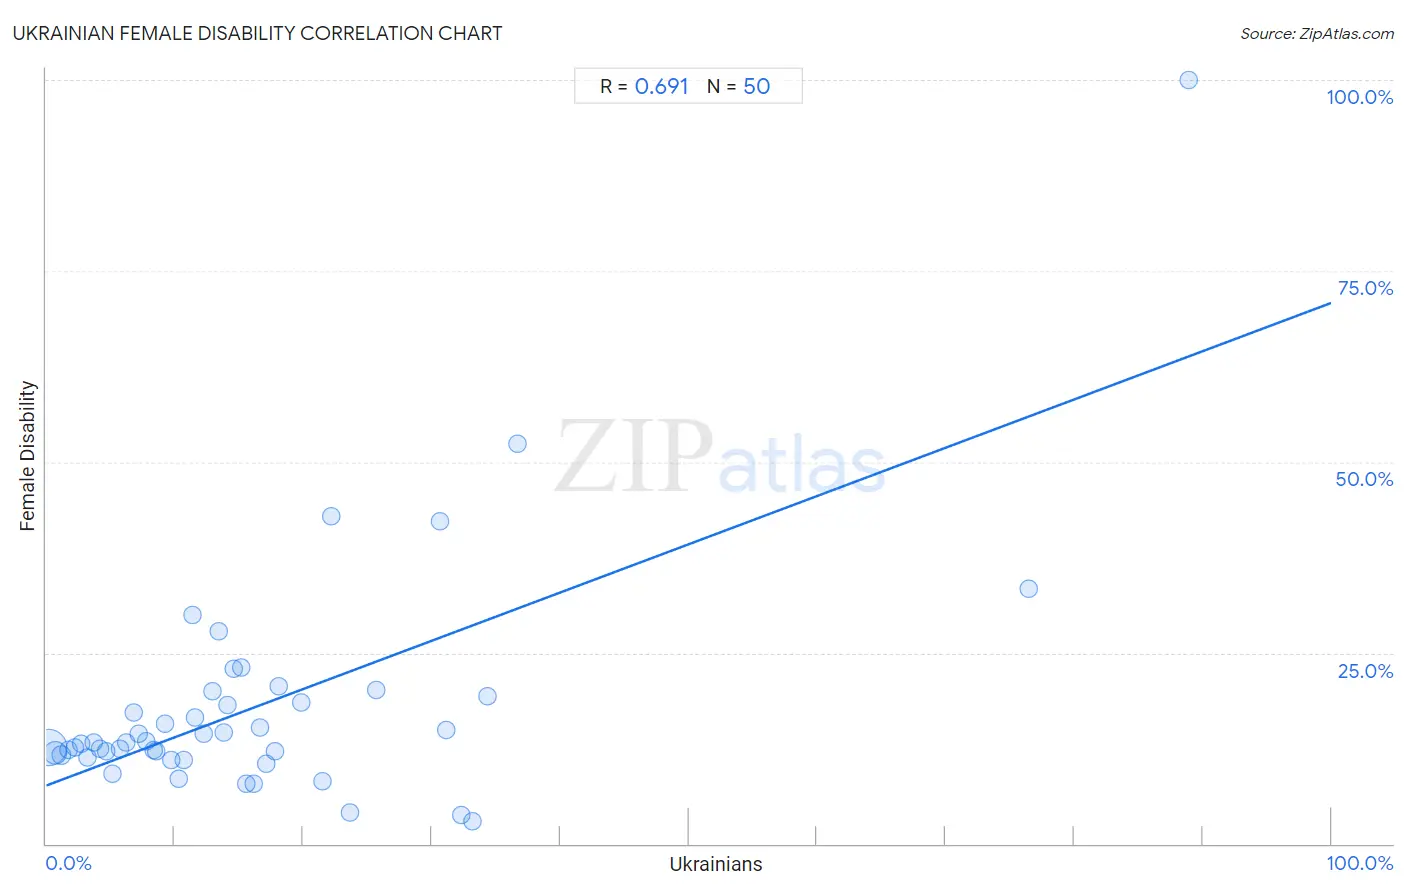
Ukrainian Female Disability Correlation Chart
The statistical analysis conducted on geographies consisting of 448,602,757 people shows a significant positive correlation between the proportion of Ukrainians and percentage of females with a disability in the United States with a correlation coefficient (R) of 0.691 and weighted average of 12.3%. On average, for every 1% (one percent) increase in Ukrainians within a typical geography, there is an increase of 0.63% in percentage of females with a disability.
It is essential to understand that the correlation between the percentage of Ukrainians and percentage of females with a disability does not imply a direct cause-and-effect relationship. It remains uncertain whether the presence of Ukrainians influences an upward or downward trend in the level of percentage of females with a disability within an area, or if Ukrainians simply ended up residing in those areas with higher or lower levels of percentage of females with a disability due to other factors.
Demographics Similar to Ukrainians by Female Disability
In terms of female disability, the demographic groups most similar to Ukrainians are Northern European (12.3%, a difference of 0.010%), Swedish (12.3%, a difference of 0.030%), Immigrants from Panama (12.3%, a difference of 0.080%), Honduran (12.3%, a difference of 0.080%), and Immigrants from Western Africa (12.3%, a difference of 0.090%).
| Demographics | Rating | Rank | Female Disability |
| Serbians | 33.1 /100 | #187 | Fair 12.3% |
| Immigrants from North America | 32.8 /100 | #188 | Fair 12.3% |
| Immigrants from Albania | 31.6 /100 | #189 | Fair 12.3% |
| Immigrants from Honduras | 31.3 /100 | #190 | Fair 12.3% |
| Armenians | 29.7 /100 | #191 | Fair 12.3% |
| Immigrants from Western Africa | 29.2 /100 | #192 | Fair 12.3% |
| Northern Europeans | 27.5 /100 | #193 | Fair 12.3% |
| Ukrainians | 27.2 /100 | #194 | Fair 12.3% |
| Swedes | 26.6 /100 | #195 | Fair 12.3% |
| Immigrants from Panama | 25.5 /100 | #196 | Fair 12.3% |
| Hondurans | 25.4 /100 | #197 | Fair 12.3% |
| Mexican American Indians | 24.9 /100 | #198 | Fair 12.3% |
| Immigrants from Trinidad and Tobago | 24.7 /100 | #199 | Fair 12.3% |
| Trinidadians and Tobagonians | 22.4 /100 | #200 | Fair 12.3% |
| Chinese | 22.1 /100 | #201 | Fair 12.3% |
Ukrainian Female Disability Correlation Summary
| Measurement | Ukrainian Data | Female Disability Data |
| Minimum | 0.19% | 2.9% |
| Maximum | 88.9% | 100.0% |
| Range | 88.7% | 97.1% |
| Mean | 16.3% | 18.0% |
| Median | 12.6% | 13.3% |
| Interquartile 25% (IQ1) | 6.2% | 11.6% |
| Interquartile 75% (IQ3) | 19.9% | 19.4% |
| Interquartile Range (IQR) | 13.7% | 7.7% |
| Standard Deviation (Sample) | 16.7% | 15.3% |
| Standard Deviation (Population) | 16.6% | 15.1% |
Correlation Details
| Ukrainian Percentile | Sample Size | Female Disability |
[ 0.0% - 0.5% ] 0.19% | 334,743,095 | 12.6% |
[ 0.5% - 1.0% ] 0.70% | 78,135,976 | 11.9% |
[ 1.0% - 1.5% ] 1.19% | 19,141,318 | 11.6% |
[ 1.5% - 2.0% ] 1.73% | 7,980,019 | 12.4% |
[ 2.0% - 2.5% ] 2.24% | 2,929,745 | 12.6% |
[ 2.5% - 3.0% ] 2.70% | 2,329,951 | 13.1% |
[ 3.0% - 3.5% ] 3.25% | 707,407 | 11.3% |
[ 3.5% - 4.0% ] 3.73% | 799,730 | 13.3% |
[ 4.0% - 4.5% ] 4.20% | 380,510 | 12.5% |
[ 4.5% - 5.0% ] 4.68% | 384,095 | 12.1% |
[ 5.0% - 5.5% ] 5.19% | 140,447 | 9.2% |
[ 5.5% - 6.0% ] 5.76% | 305,168 | 12.5% |
[ 6.0% - 6.5% ] 6.20% | 146,822 | 13.3% |
[ 6.5% - 7.0% ] 6.82% | 103,738 | 17.2% |
[ 7.0% - 7.5% ] 7.17% | 74,972 | 14.3% |
[ 7.5% - 8.0% ] 7.80% | 8,242 | 13.4% |
[ 8.0% - 8.5% ] 8.37% | 87,706 | 12.2% |
[ 8.5% - 9.0% ] 8.56% | 56,963 | 12.0% |
[ 9.0% - 9.5% ] 9.23% | 12,603 | 15.6% |
[ 9.5% - 10.0% ] 9.71% | 11,441 | 11.0% |
[ 10.0% - 10.5% ] 10.30% | 7,030 | 8.5% |
[ 10.5% - 11.0% ] 10.74% | 4,841 | 10.9% |
[ 11.0% - 11.5% ] 11.36% | 528 | 29.9% |
[ 11.5% - 12.0% ] 11.61% | 85,934 | 16.6% |
[ 12.0% - 12.5% ] 12.22% | 2,569 | 14.4% |
[ 12.5% - 13.0% ] 12.89% | 2,079 | 19.9% |
[ 13.0% - 13.5% ] 13.38% | 3,566 | 27.8% |
[ 13.5% - 14.0% ] 13.78% | 312 | 14.6% |
[ 14.0% - 14.5% ] 14.07% | 2,097 | 18.2% |
[ 14.5% - 15.0% ] 14.56% | 1,195 | 22.9% |
[ 15.0% - 15.5% ] 15.13% | 998 | 23.1% |
[ 15.5% - 16.0% ] 15.58% | 1,348 | 7.8% |
[ 16.0% - 16.5% ] 16.17% | 3,031 | 7.8% |
[ 16.5% - 17.0% ] 16.62% | 343 | 15.3% |
[ 17.0% - 17.5% ] 17.10% | 690 | 10.5% |
[ 17.5% - 18.0% ] 17.85% | 297 | 12.1% |
[ 18.0% - 18.5% ] 18.08% | 968 | 20.7% |
[ 19.5% - 20.0% ] 19.86% | 740 | 18.5% |
[ 21.5% - 22.0% ] 21.52% | 79 | 8.1% |
[ 22.0% - 22.5% ] 22.16% | 388 | 43.0% |
[ 23.5% - 24.0% ] 23.67% | 300 | 4.1% |
[ 25.5% - 26.0% ] 25.65% | 382 | 20.1% |
[ 30.5% - 31.0% ] 30.60% | 974 | 42.2% |
[ 31.0% - 31.5% ] 31.13% | 257 | 14.8% |
[ 32.0% - 32.5% ] 32.26% | 155 | 3.7% |
[ 33.0% - 33.5% ] 33.14% | 1,536 | 2.9% |
[ 34.0% - 34.5% ] 34.38% | 64 | 19.4% |
[ 36.5% - 37.0% ] 36.67% | 30 | 52.4% |
[ 76.0% - 76.5% ] 76.47% | 51 | 33.3% |
[ 88.5% - 89.0% ] 88.89% | 27 | 100.0% |