Maltese 1 or more Vehicles in Household
COMPARE
Maltese
Select to Compare
1 or more Vehicles in Household
Maltese 1 or more Vehicles in Household
91.0%
1+ VEHICLES AVAILABLE
97.7/ 100
METRIC RATING
107th/ 347
METRIC RANK
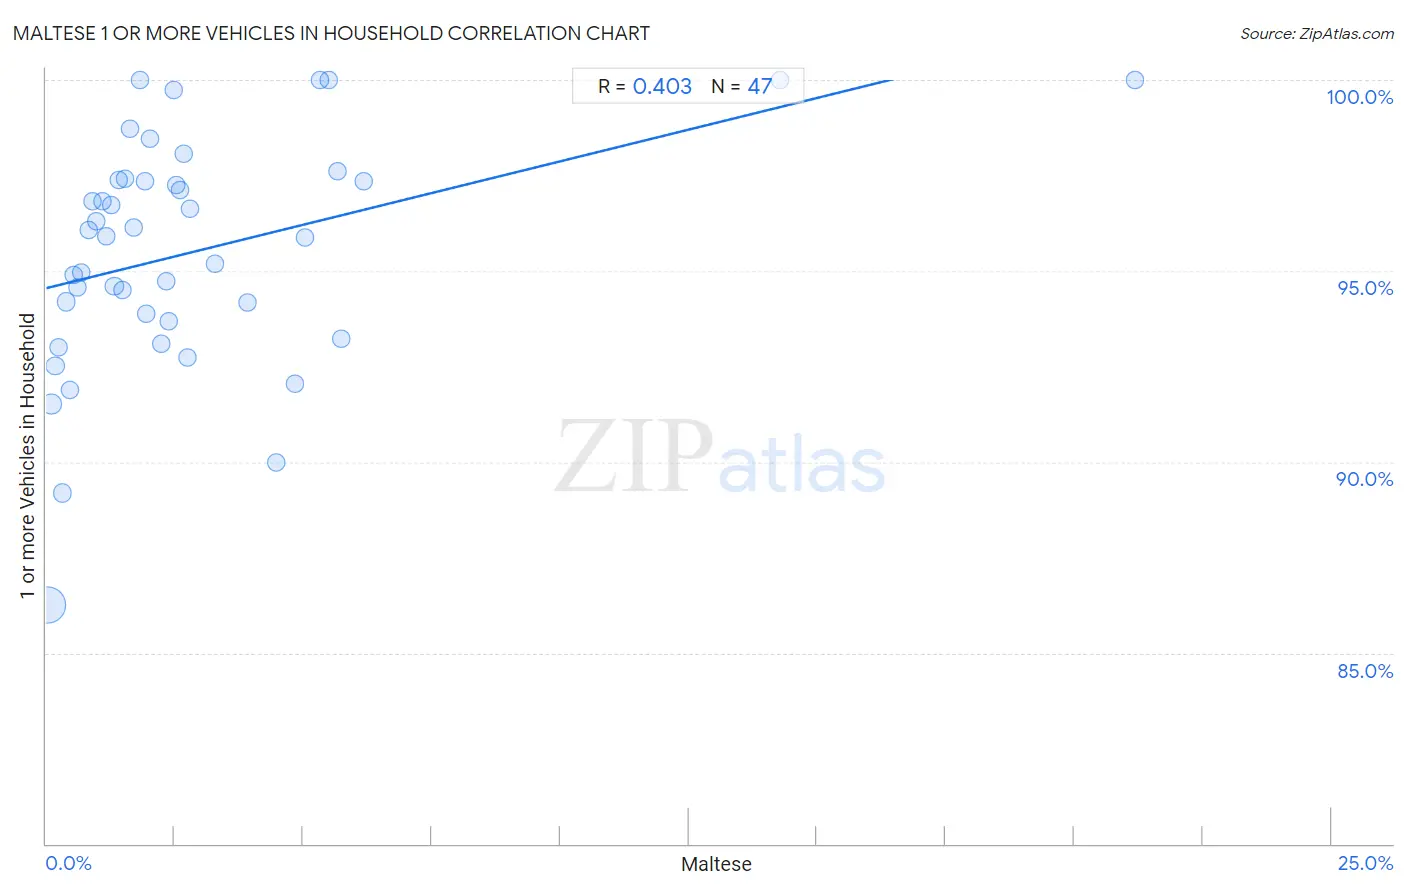
Maltese 1 or more Vehicles in Household Correlation Chart
The statistical analysis conducted on geographies consisting of 126,283,538 people shows a moderate positive correlation between the proportion of Maltese and percentage of households with 1 or more vehicles available in the United States with a correlation coefficient (R) of 0.403 and weighted average of 91.0%. On average, for every 1% (one percent) increase in Maltese within a typical geography, there is an increase of 0.33% in percentage of households with 1 or more vehicles available.
It is essential to understand that the correlation between the percentage of Maltese and percentage of households with 1 or more vehicles available does not imply a direct cause-and-effect relationship. It remains uncertain whether the presence of Maltese influences an upward or downward trend in the level of percentage of households with 1 or more vehicles available within an area, or if Maltese simply ended up residing in those areas with higher or lower levels of percentage of households with 1 or more vehicles available due to other factors.
Demographics Similar to Maltese by 1 or more Vehicles in Household
In terms of 1 or more vehicles in household, the demographic groups most similar to Maltese are Hispanic or Latino (91.0%, a difference of 0.0%), Delaware (91.0%, a difference of 0.010%), Zimbabwean (91.0%, a difference of 0.020%), Mexican American Indian (91.0%, a difference of 0.030%), and Laotian (91.0%, a difference of 0.060%).
| Demographics | Rating | Rank | 1 or more Vehicles in Household |
| Immigrants from Central America | 98.4 /100 | #100 | Exceptional 91.1% |
| Bulgarians | 98.4 /100 | #101 | Exceptional 91.1% |
| Seminole | 98.3 /100 | #102 | Exceptional 91.1% |
| Yugoslavians | 98.3 /100 | #103 | Exceptional 91.1% |
| Asians | 98.2 /100 | #104 | Exceptional 91.1% |
| Laotians | 98.0 /100 | #105 | Exceptional 91.0% |
| Zimbabweans | 97.7 /100 | #106 | Exceptional 91.0% |
| Maltese | 97.7 /100 | #107 | Exceptional 91.0% |
| Hispanics or Latinos | 97.6 /100 | #108 | Exceptional 91.0% |
| Delaware | 97.6 /100 | #109 | Exceptional 91.0% |
| Mexican American Indians | 97.4 /100 | #110 | Exceptional 91.0% |
| Navajo | 95.8 /100 | #111 | Exceptional 90.8% |
| Immigrants from Netherlands | 95.7 /100 | #112 | Exceptional 90.8% |
| Immigrants from Kuwait | 94.7 /100 | #113 | Exceptional 90.7% |
| Armenians | 94.5 /100 | #114 | Exceptional 90.7% |
Maltese 1 or more Vehicles in Household Correlation Summary
| Measurement | Maltese Data | 1 or more Vehicles in Household Data |
| Minimum | 0.020% | 86.3% |
| Maximum | 21.2% | 100.0% |
| Range | 21.2% | 13.7% |
| Mean | 2.9% | 95.5% |
| Median | 1.9% | 95.9% |
| Interquartile 25% (IQ1) | 0.89% | 93.7% |
| Interquartile 75% (IQ3) | 3.3% | 97.4% |
| Interquartile Range (IQR) | 2.4% | 3.7% |
| Standard Deviation (Sample) | 3.7% | 3.0% |
| Standard Deviation (Population) | 3.6% | 3.0% |
Correlation Details
| Maltese Percentile | Sample Size | 1 or more Vehicles in Household |
[ 0.0% - 0.5% ] 0.020% | 104,512,347 | 86.3% |
[ 0.0% - 0.5% ] 0.10% | 10,795,529 | 91.5% |
[ 0.0% - 0.5% ] 0.17% | 4,236,695 | 92.5% |
[ 0.0% - 0.5% ] 0.25% | 2,146,447 | 93.0% |
[ 0.0% - 0.5% ] 0.32% | 1,354,633 | 89.2% |
[ 0.0% - 0.5% ] 0.39% | 837,194 | 94.2% |
[ 0.0% - 0.5% ] 0.46% | 614,643 | 91.9% |
[ 0.5% - 1.0% ] 0.54% | 578,024 | 94.9% |
[ 0.5% - 1.0% ] 0.61% | 426,557 | 94.6% |
[ 0.5% - 1.0% ] 0.69% | 267,727 | 95.0% |
[ 0.5% - 1.0% ] 0.82% | 29,179 | 96.1% |
[ 0.5% - 1.0% ] 0.89% | 49,687 | 96.8% |
[ 0.5% - 1.0% ] 0.96% | 24,137 | 96.3% |
[ 1.0% - 1.5% ] 1.09% | 18,392 | 96.8% |
[ 1.0% - 1.5% ] 1.17% | 66,849 | 95.9% |
[ 1.0% - 1.5% ] 1.26% | 41,770 | 96.7% |
[ 1.0% - 1.5% ] 1.33% | 113,708 | 94.6% |
[ 1.0% - 1.5% ] 1.40% | 14,537 | 97.4% |
[ 1.0% - 1.5% ] 1.48% | 13,028 | 94.5% |
[ 1.5% - 2.0% ] 1.54% | 22,298 | 97.4% |
[ 1.5% - 2.0% ] 1.64% | 1,646 | 98.7% |
[ 1.5% - 2.0% ] 1.69% | 3,786 | 96.1% |
[ 1.5% - 2.0% ] 1.82% | 2,147 | 100.0% |
[ 1.5% - 2.0% ] 1.91% | 12,442 | 97.3% |
[ 1.5% - 2.0% ] 1.95% | 10,141 | 93.9% |
[ 2.0% - 2.5% ] 2.01% | 3,331 | 98.5% |
[ 2.0% - 2.5% ] 2.23% | 21,366 | 93.1% |
[ 2.0% - 2.5% ] 2.34% | 811 | 94.7% |
[ 2.0% - 2.5% ] 2.38% | 5,852 | 93.7% |
[ 2.0% - 2.5% ] 2.48% | 4,727 | 99.7% |
[ 2.5% - 3.0% ] 2.53% | 4,267 | 97.3% |
[ 2.5% - 3.0% ] 2.61% | 9,172 | 97.1% |
[ 2.5% - 3.0% ] 2.68% | 1,456 | 98.1% |
[ 2.5% - 3.0% ] 2.76% | 11,776 | 92.7% |
[ 2.5% - 3.0% ] 2.80% | 2,826 | 96.6% |
[ 3.0% - 3.5% ] 3.29% | 1,552 | 95.2% |
[ 3.5% - 4.0% ] 3.92% | 6,483 | 94.2% |
[ 4.0% - 4.5% ] 4.48% | 67 | 90.0% |
[ 4.5% - 5.0% ] 4.83% | 2,877 | 92.1% |
[ 5.0% - 5.5% ] 5.03% | 1,233 | 95.9% |
[ 5.0% - 5.5% ] 5.34% | 1,462 | 100.0% |
[ 5.0% - 5.5% ] 5.49% | 164 | 100.0% |
[ 5.5% - 6.0% ] 5.68% | 5,231 | 97.6% |
[ 5.5% - 6.0% ] 5.73% | 349 | 93.2% |
[ 6.0% - 6.5% ] 6.19% | 4,800 | 97.4% |
[ 14.0% - 14.5% ] 14.29% | 42 | 100.0% |
[ 21.0% - 21.5% ] 21.19% | 151 | 100.0% |