Maltese Male Disability

COMPARE

Maltese
Race
Ancestry
AfghanAfricanAlaska NativeAlaskan AthabascanAlbanianAleutAlsatianAmericanApacheArabArapahoArgentineanArmenianAssyrian/Chaldean/SyriacAustralianAustrianBahamianBangladeshiBarbadianBasqueBelgianBelizeanBermudanBhutaneseBlackfeetBolivianBrazilianBritishBritish West IndianBulgarianBurmeseCajunCambodianCanadianCape VerdeanCarpatho RusynCelticCentral AmericanCentral American IndianCherokeeCheyenneChickasawChileanChineseChippewaChoctawColombianColvilleComancheCosta RicanCreeCreekCroatianCrowCubanCypriotCzechCzechoslovakianDanishDelawareDominicanDutchDutch West IndianEastern EuropeanEcuadorianEgyptianEnglishEstonianEthiopianEuropeanFijianFilipinoFinnishFrenchFrench American IndianFrench CanadianGermanGerman RussianGhanaianGreekGuamanian/ChamorroGuatemalanGuyaneseHaitianHmongHonduranHopiHoumaHungarianIcelanderIndian (Asian)IndonesianInupiatIranianIraqiIrishIroquoisIsraeliItalianJamaicanJapaneseJordanianKenyanKiowaKoreanLaotianLatvianLebaneseLiberianLithuanianLumbeeLuxembourgerMacedonianMalaysianMalteseMarshalleseMenomineeMexicanMexican American IndianMongolianMoroccanNative HawaiianNavajoNepaleseNew ZealanderNicaraguanNigerianNorthern EuropeanNorwegianOkinawanOsageOttawaPaiutePakistaniPalestinianPanamanianParaguayanPennsylvania GermanPeruvianPimaPolishPortuguesePotawatomiPuebloPuerto RicanPuget Sound SalishRomanianRussianSalvadoranSamoanScandinavianScotch-IrishScottishSeminoleSenegaleseSerbianShoshoneSierra LeoneanSiouxSlavicSlovakSloveneSomaliSouth AfricanSouth AmericanSouth American IndianSoviet UnionSpaniardSpanishSpanish AmericanSpanish American IndianSri LankanSubsaharan AfricanSudaneseSwedishSwissSyrianTaiwaneseThaiTlingit-HaidaTohono O'OdhamTonganTrinidadian and TobagonianTsimshianTurkishU.S. Virgin IslanderUgandanUkrainianUruguayanUteVenezuelanVietnameseWelshWest IndianYakamaYaquiYugoslavianYumanYup'ikZimbabwean
Immigration
NonimmigrantsImmigrantsAfghanistanAfricaAlbaniaArgentinaArmeniaAsiaAustraliaAustriaBahamasBangladeshBarbadosBelarusBelgiumBelizeBoliviaBosnia and HerzegovinaBrazilBulgariaBurma/MyanmarCabo VerdeCambodiaCameroonCanadaCaribbeanCentral AmericaChileChinaColombiaCongoCosta RicaCroatiaCubaCzechoslovakiaDenmarkDominicaDominican RepublicEastern AfricaEastern AsiaEastern EuropeEcuadorEgyptEl SalvadorEnglandEritreaEthiopiaEuropeFijiFranceGermanyGhanaGreeceGrenadaGuatemalaGuyanaHaitiHondurasHong KongHungaryIndiaIndonesiaIranIraqIrelandIsraelItalyJamaicaJapanJordanKazakhstanKenyaKoreaKuwaitLaosLatin AmericaLatviaLebanonLiberiaLithuaniaMalaysiaMexicoMicronesiaMiddle AfricaMoldovaMoroccoNepalNetherlandsNicaraguaNigeriaNorth AmericaNorth MacedoniaNorthern AfricaNorthern EuropeNorwayOceaniaPakistanPanamaPeruPhilippinesPolandPortugalRomaniaRussiaSaudi ArabiaScotlandSenegalSerbiaSierra LeoneSingaporeSomaliaSouth AfricaSouth AmericaSouth Central AsiaSouth Eastern AsiaSouthern EuropeSpainSri LankaSt. Vincent and the GrenadinesSudanSwedenSwitzerlandSyriaTaiwanThailandTrinidad and TobagoTurkeyUgandaUkraineUruguayUzbekistanVenezuelaVietnamWest IndiesWestern AfricaWestern AsiaWestern EuropeYemenZaireZimbabweAzores
Select to Compare
Race
Ancestry
AfghanAfricanAlaska NativeAlaskan AthabascanAlbanianAleutAlsatianAmericanApacheArabArapahoArgentineanArmenianAssyrian/Chaldean/SyriacAustralianAustrianBahamianBangladeshiBarbadianBasqueBelgianBelizeanBermudanBhutaneseBlackfeetBolivianBrazilianBritishBritish West IndianBulgarianBurmeseCajunCambodianCanadianCape VerdeanCarpatho RusynCelticCentral AmericanCentral American IndianCherokeeCheyenneChickasawChileanChineseChippewaChoctawColombianColvilleComancheCosta RicanCreeCreekCroatianCrowCubanCypriotCzechCzechoslovakianDanishDelawareDominicanDutchDutch West IndianEastern EuropeanEcuadorianEgyptianEnglishEstonianEthiopianEuropeanFijianFilipinoFinnishFrenchFrench American IndianFrench CanadianGermanGerman RussianGhanaianGreekGuamanian/ChamorroGuatemalanGuyaneseHaitianHmongHonduranHopiHoumaHungarianIcelanderIndian (Asian)IndonesianInupiatIranianIraqiIrishIroquoisIsraeliItalianJamaicanJapaneseJordanianKenyanKiowaKoreanLaotianLatvianLebaneseLiberianLithuanianLumbeeLuxembourgerMacedonianMalaysianMarshalleseMenomineeMexicanMexican American IndianMongolianMoroccanNative HawaiianNavajoNepaleseNew ZealanderNicaraguanNigerianNorthern EuropeanNorwegianOkinawanOsageOttawaPaiutePakistaniPalestinianPanamanianParaguayanPennsylvania GermanPeruvianPimaPolishPortuguesePotawatomiPuebloPuerto RicanPuget Sound SalishRomanianRussianSalvadoranSamoanScandinavianScotch-IrishScottishSeminoleSenegaleseSerbianShoshoneSierra LeoneanSiouxSlavicSlovakSloveneSomaliSouth AfricanSouth AmericanSouth American IndianSoviet UnionSpaniardSpanishSpanish AmericanSpanish American IndianSri LankanSubsaharan AfricanSudaneseSwedishSwissSyrianTaiwaneseThaiTlingit-HaidaTohono O'OdhamTonganTrinidadian and TobagonianTsimshianTurkishU.S. Virgin IslanderUgandanUkrainianUruguayanUteVenezuelanVietnameseWelshWest IndianYakamaYaquiYugoslavianYumanYup'ikZimbabwean
Immigration
NonimmigrantsImmigrantsAfghanistanAfricaAlbaniaArgentinaArmeniaAsiaAustraliaAustriaBahamasBangladeshBarbadosBelarusBelgiumBelizeBoliviaBosnia and HerzegovinaBrazilBulgariaBurma/MyanmarCabo VerdeCambodiaCameroonCanadaCaribbeanCentral AmericaChileChinaColombiaCongoCosta RicaCroatiaCubaCzechoslovakiaDenmarkDominicaDominican RepublicEastern AfricaEastern AsiaEastern EuropeEcuadorEgyptEl SalvadorEnglandEritreaEthiopiaEuropeFijiFranceGermanyGhanaGreeceGrenadaGuatemalaGuyanaHaitiHondurasHong KongHungaryIndiaIndonesiaIranIraqIrelandIsraelItalyJamaicaJapanJordanKazakhstanKenyaKoreaKuwaitLaosLatin AmericaLatviaLebanonLiberiaLithuaniaMalaysiaMexicoMicronesiaMiddle AfricaMoldovaMoroccoNepalNetherlandsNicaraguaNigeriaNorth AmericaNorth MacedoniaNorthern AfricaNorthern EuropeNorwayOceaniaPakistanPanamaPeruPhilippinesPolandPortugalRomaniaRussiaSaudi ArabiaScotlandSenegalSerbiaSierra LeoneSingaporeSomaliaSouth AfricaSouth AmericaSouth Central AsiaSouth Eastern AsiaSouthern EuropeSpainSri LankaSt. Vincent and the GrenadinesSudanSwedenSwitzerlandSyriaTaiwanThailandTrinidad and TobagoTurkeyUgandaUkraineUruguayUzbekistanVenezuelaVietnamWest IndiesWestern AfricaWestern AsiaWestern EuropeYemenZaireZimbabweAzores
Male Disability
Income
Poverty
Unemployment
Labor Participation
Family Structure
Vehicle Availability
Education Level
Disability

Maltese Male Disability
Average

11.2%
DISABILITY | MALES
50.0/ 100
METRIC RATING
174th/ 347
METRIC RANK

Maltese Male Disability Correlation Chart

The statistical analysis conducted on geographies consisting of 126,476,999 people shows a poor negative correlation between the proportion of Maltese and percentage of males with a disability in the United States with a correlation coefficient (R) of -0.118 and weighted average of 11.2%. On average, for every 1% (one percent) increase in Maltese within a typical geography, there is a decrease of 0.16% in percentage of males with a disability.
Maltese Male Disability
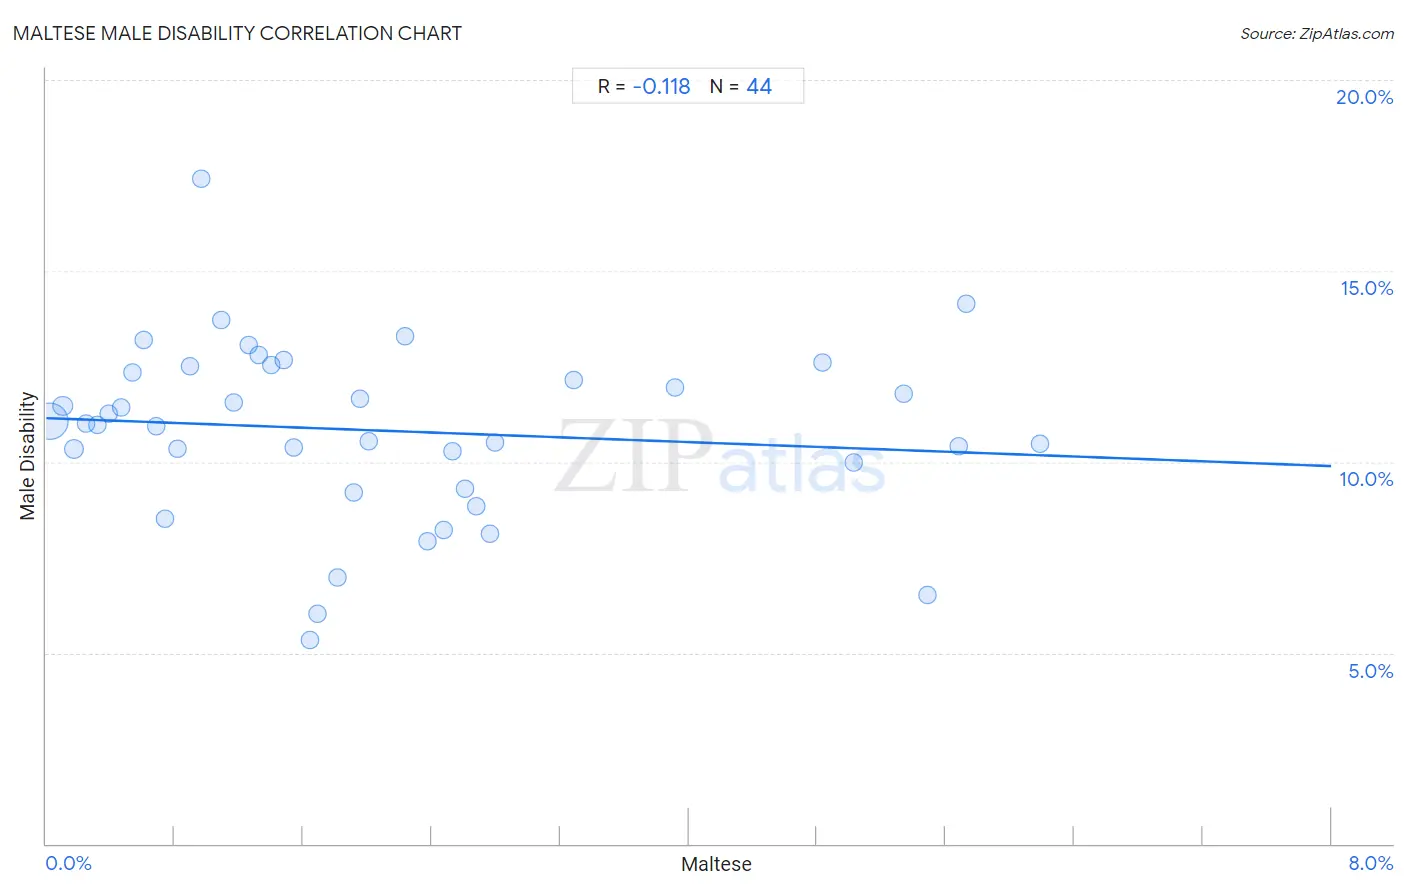
It is essential to understand that the correlation between the percentage of Maltese and percentage of males with a disability does not imply a direct cause-and-effect relationship. It remains uncertain whether the presence of Maltese influences an upward or downward trend in the level of percentage of males with a disability within an area, or if Maltese simply ended up residing in those areas with higher or lower levels of percentage of males with a disability due to other factors.

Demographics Similar to Maltese by Male Disability

In terms of male disability, the demographic groups most similar to Maltese are Immigrants from Burma/Myanmar (11.2%, a difference of 0.020%), Romanian (11.2%, a difference of 0.040%), Immigrants from Honduras (11.2%, a difference of 0.070%), Haitian (11.2%, a difference of 0.14%), and New Zealander (11.2%, a difference of 0.16%).
DemographicsRating | RankMale Disability
Immigrants from Southern Europe
54.4
/100
|
#167
Average
11.2%
Immigrants from Latin America
54.0
/100
|
#168
Average
11.2%
Barbadians
53.4
/100
|
#169
Average
11.2%
New Zealanders
52.9
/100
|
#170
Average
11.2%
Haitians
52.5
/100
|
#171
Average
11.2%
Romanians
50.7
/100
|
#172
Average
11.2%
Immigrants from Burma/Myanmar
50.4
/100
|
#173
Average
11.2%
Maltese
50.0
/100
|
#174
Average
11.2%
Immigrants from Honduras
48.7
/100
|
#175
Average
11.2%
Syrians
46.6
/100
|
#176
Average
11.2%
Immigrants from Norway
44.2
/100
|
#177
Average
11.3%
Australians
42.2
/100
|
#178
Average
11.3%
Immigrants from Caribbean
41.4
/100
|
#179
Average
11.3%
Hondurans
41.1
/100
|
#180
Average
11.3%
Immigrants from Senegal
34.4
/100
|
#181
Fair
11.3%

Maltese Male Disability Correlation Summary

MeasurementMaltese DataMale Disability Data
Minimum0.020%5.3%
Maximum6.2%17.4%
Range6.2%12.1%
Mean2.1%10.8%
Median1.7%11.0%
Interquartile 25% (IQ1)0.78%9.6%
Interquartile 75% (IQ3)2.7%12.4%
Interquartile Range (IQR)1.9%2.8%
Standard Deviation (Sample)1.7%2.3%
Standard Deviation (Population)1.7%2.3%

Correlation Details

Maltese PercentileSample SizeMale Disability
[
0.0%
-
0.5%
]
0.020%
104,512,34711.1%
[
0.0%
-
0.5%
]
0.10%
10,804,86711.5%
[
0.0%
-
0.5%
]
0.17%
4,242,50610.3%
[
0.0%
-
0.5%
]
0.25%
2,160,12811.0%
[
0.0%
-
0.5%
]
0.32%
1,354,63311.0%
[
0.0%
-
0.5%
]
0.39%
837,19411.3%
[
0.0%
-
0.5%
]
0.46%
614,64311.4%
[
0.5%
-
1.0%
]
0.54%
578,02412.3%
[
0.5%
-
1.0%
]
0.61%
426,55713.2%
[
0.5%
-
1.0%
]
0.69%
271,89110.9%
[
0.5%
-
1.0%
]
0.74%
161,5388.5%
[
0.5%
-
1.0%
]
0.82%
29,17910.3%
[
0.5%
-
1.0%
]
0.89%
49,68712.5%
[
0.5%
-
1.0%
]
0.96%
24,13717.4%
[
1.0%
-
1.5%
]
1.09%
18,39213.7%
[
1.0%
-
1.5%
]
1.17%
66,84911.6%
[
1.0%
-
1.5%
]
1.26%
41,77013.1%
[
1.0%
-
1.5%
]
1.33%
113,70812.8%
[
1.0%
-
1.5%
]
1.40%
14,53712.5%
[
1.0%
-
1.5%
]
1.48%
13,02812.7%
[
1.5%
-
2.0%
]
1.54%
22,29810.4%
[
1.5%
-
2.0%
]
1.64%
1,6465.3%
[
1.5%
-
2.0%
]
1.69%
3,7866.0%
[
1.5%
-
2.0%
]
1.82%
2,1477.0%
[
1.5%
-
2.0%
]
1.91%
12,4429.2%
[
1.5%
-
2.0%
]
1.95%
10,14111.7%
[
2.0%
-
2.5%
]
2.01%
3,33110.5%
[
2.0%
-
2.5%
]
2.23%
21,36613.3%
[
2.0%
-
2.5%
]
2.38%
5,8527.9%
[
2.0%
-
2.5%
]
2.48%
4,7278.2%
[
2.5%
-
3.0%
]
2.53%
4,26710.3%
[
2.5%
-
3.0%
]
2.61%
9,1729.3%
[
2.5%
-
3.0%
]
2.68%
1,4568.8%
[
2.5%
-
3.0%
]
2.76%
11,7768.1%
[
2.5%
-
3.0%
]
2.80%
2,82610.5%
[
3.0%
-
3.5%
]
3.29%
1,55212.1%
[
3.5%
-
4.0%
]
3.92%
6,48312.0%
[
4.5%
-
5.0%
]
4.83%
2,87712.6%
[
5.0%
-
5.5%
]
5.03%
1,23310.0%
[
5.0%
-
5.5%
]
5.34%
1,46211.8%
[
5.0%
-
5.5%
]
5.49%
1646.5%
[
5.5%
-
6.0%
]
5.68%
5,23110.4%
[
5.5%
-
6.0%
]
5.73%
34914.1%
[
6.0%
-
6.5%
]
6.19%
4,80010.5%