Irish Male Disability
COMPARE
Irish
Select to Compare
Male Disability
Irish Male Disability
12.7%
DISABILITY | MALES
0.0/ 100
METRIC RATING
282nd/ 347
METRIC RANK
Irish Male Disability Correlation Chart
The statistical analysis conducted on geographies consisting of 580,201,634 people shows a substantial positive correlation between the proportion of Irish and percentage of males with a disability in the United States with a correlation coefficient (R) of 0.593 and weighted average of 12.7%. On average, for every 1% (one percent) increase in Irish within a typical geography, there is an increase of 0.33% in percentage of males with a disability.
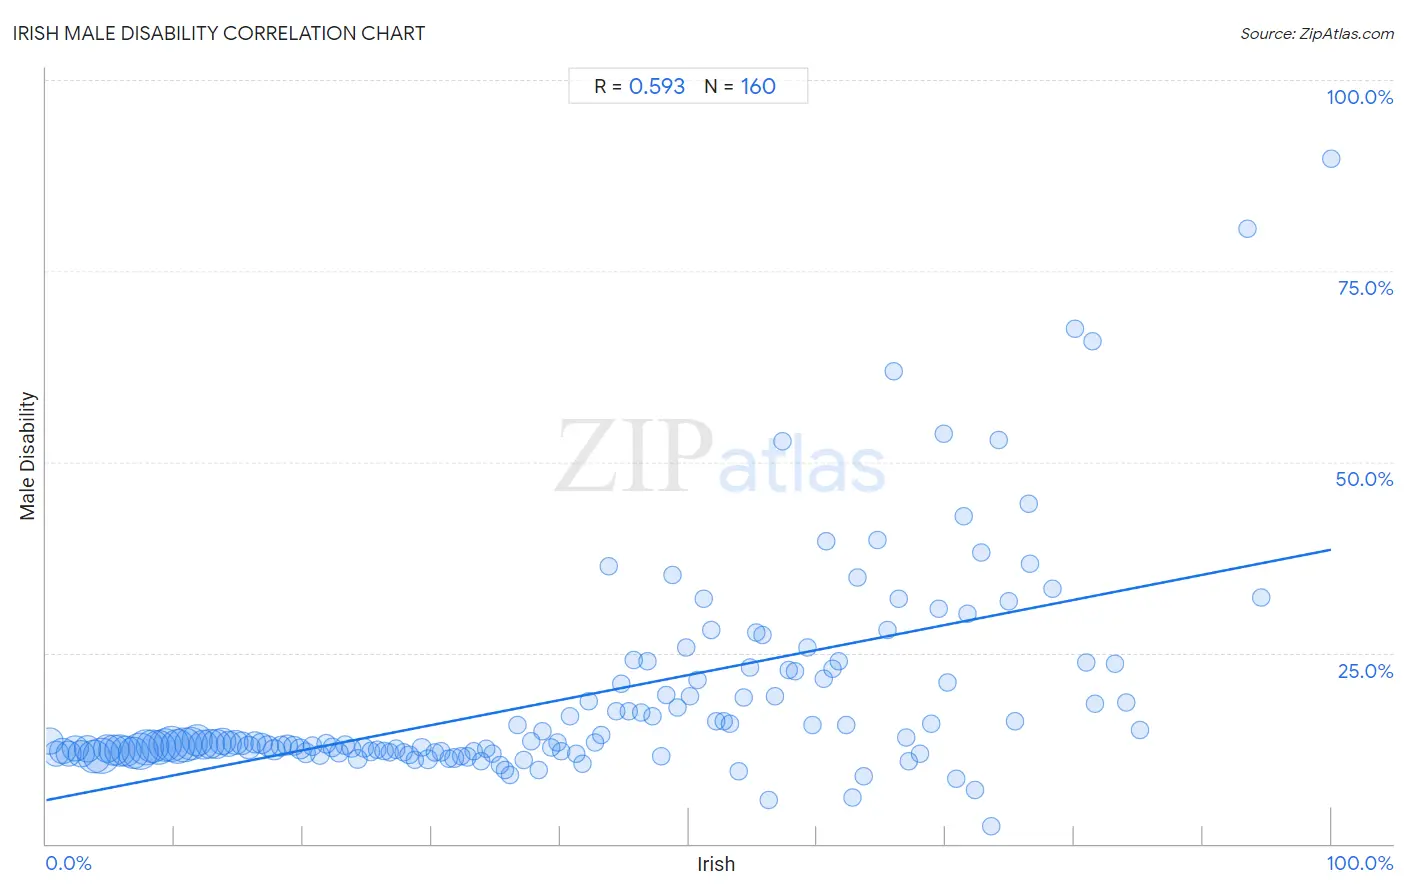
It is essential to understand that the correlation between the percentage of Irish and percentage of males with a disability does not imply a direct cause-and-effect relationship. It remains uncertain whether the presence of Irish influences an upward or downward trend in the level of percentage of males with a disability within an area, or if Irish simply ended up residing in those areas with higher or lower levels of percentage of males with a disability due to other factors.
Demographics Similar to Irish by Male Disability
In terms of male disability, the demographic groups most similar to Irish are German (12.7%, a difference of 0.010%), Sioux (12.7%, a difference of 0.060%), Dutch (12.7%, a difference of 0.11%), Slovak (12.7%, a difference of 0.16%), and Spanish (12.7%, a difference of 0.28%).
| Demographics | Rating | Rank | Male Disability |
| Fijians | 0.0 /100 | #275 | Tragic 12.6% |
| Africans | 0.0 /100 | #276 | Tragic 12.6% |
| Finns | 0.0 /100 | #277 | Tragic 12.6% |
| Central American Indians | 0.0 /100 | #278 | Tragic 12.7% |
| Slovaks | 0.0 /100 | #279 | Tragic 12.7% |
| Dutch | 0.0 /100 | #280 | Tragic 12.7% |
| Sioux | 0.0 /100 | #281 | Tragic 12.7% |
| Irish | 0.0 /100 | #282 | Tragic 12.7% |
| Germans | 0.0 /100 | #283 | Tragic 12.7% |
| Spanish | 0.0 /100 | #284 | Tragic 12.7% |
| Welsh | 0.0 /100 | #285 | Tragic 12.7% |
| Scottish | 0.0 /100 | #286 | Tragic 12.8% |
| Cape Verdeans | 0.0 /100 | #287 | Tragic 12.8% |
| Yup'ik | 0.0 /100 | #288 | Tragic 12.8% |
| Immigrants from Cabo Verde | 0.0 /100 | #289 | Tragic 12.8% |
Irish Male Disability Correlation Summary
| Measurement | Irish Data | Male Disability Data |
| Minimum | 0.26% | 2.4% |
| Maximum | 100.0% | 89.8% |
| Range | 99.7% | 87.4% |
| Mean | 40.8% | 19.1% |
| Median | 39.9% | 13.1% |
| Interquartile 25% (IQ1) | 20.0% | 12.0% |
| Interquartile 75% (IQ3) | 60.6% | 21.6% |
| Interquartile Range (IQR) | 40.6% | 9.5% |
| Standard Deviation (Sample) | 24.5% | 13.6% |
| Standard Deviation (Population) | 24.5% | 13.5% |
Correlation Details
| Irish Percentile | Sample Size | Male Disability |
[ 0.0% - 0.5% ] 0.26% | 12,565,834 | 13.4% |
[ 0.5% - 1.0% ] 0.73% | 10,452,282 | 11.8% |
[ 1.0% - 1.5% ] 1.26% | 11,262,451 | 12.1% |
[ 1.5% - 2.0% ] 1.76% | 10,690,937 | 11.9% |
[ 2.0% - 2.5% ] 2.26% | 11,144,771 | 12.5% |
[ 2.5% - 3.0% ] 2.74% | 12,066,565 | 11.8% |
[ 3.0% - 3.5% ] 3.25% | 11,953,579 | 12.4% |
[ 3.5% - 4.0% ] 3.71% | 19,917,003 | 11.4% |
[ 4.0% - 4.5% ] 4.30% | 25,455,012 | 11.5% |
[ 4.5% - 5.0% ] 4.74% | 14,378,445 | 12.4% |
[ 5.0% - 5.5% ] 5.24% | 16,867,492 | 12.2% |
[ 5.5% - 6.0% ] 5.74% | 17,484,136 | 12.2% |
[ 6.0% - 6.5% ] 6.25% | 17,533,844 | 12.1% |
[ 6.5% - 7.0% ] 6.76% | 17,996,121 | 11.9% |
[ 7.0% - 7.5% ] 7.25% | 25,845,764 | 12.0% |
[ 7.5% - 8.0% ] 7.75% | 24,525,862 | 12.6% |
[ 8.0% - 8.5% ] 8.26% | 20,662,690 | 12.8% |
[ 8.5% - 9.0% ] 8.73% | 22,691,168 | 12.7% |
[ 9.0% - 9.5% ] 9.25% | 20,608,695 | 12.9% |
[ 9.5% - 10.0% ] 9.75% | 23,734,399 | 13.1% |
[ 10.0% - 10.5% ] 10.24% | 21,947,434 | 12.8% |
[ 10.5% - 11.0% ] 10.74% | 22,716,469 | 13.0% |
[ 11.0% - 11.5% ] 11.26% | 21,171,048 | 13.1% |
[ 11.5% - 12.0% ] 11.76% | 18,011,044 | 13.5% |
[ 12.0% - 12.5% ] 12.23% | 16,443,280 | 12.9% |
[ 12.5% - 13.0% ] 12.76% | 15,288,303 | 13.1% |
[ 13.0% - 13.5% ] 13.24% | 14,818,084 | 13.1% |
[ 13.5% - 14.0% ] 13.74% | 11,722,623 | 13.4% |
[ 14.0% - 14.5% ] 14.24% | 10,202,133 | 13.1% |
[ 14.5% - 15.0% ] 14.74% | 8,851,498 | 13.2% |
[ 15.0% - 15.5% ] 15.24% | 8,232,120 | 13.2% |
[ 15.5% - 16.0% ] 15.75% | 6,708,618 | 12.7% |
[ 16.0% - 16.5% ] 16.25% | 5,543,622 | 13.3% |
[ 16.5% - 17.0% ] 16.74% | 4,409,737 | 13.2% |
[ 17.0% - 17.5% ] 17.25% | 4,442,038 | 12.8% |
[ 17.5% - 18.0% ] 17.74% | 4,022,181 | 12.3% |
[ 18.0% - 18.5% ] 18.25% | 3,700,656 | 12.8% |
[ 18.5% - 19.0% ] 18.74% | 3,394,942 | 12.9% |
[ 19.0% - 19.5% ] 19.27% | 3,037,739 | 12.8% |
[ 19.5% - 20.0% ] 19.76% | 2,853,997 | 12.4% |
[ 20.0% - 20.5% ] 20.22% | 2,673,273 | 11.9% |
[ 20.5% - 21.0% ] 20.74% | 2,036,749 | 12.7% |
[ 21.0% - 21.5% ] 21.26% | 1,852,003 | 11.6% |
[ 21.5% - 22.0% ] 21.74% | 1,729,950 | 13.0% |
[ 22.0% - 22.5% ] 22.27% | 2,029,513 | 12.6% |
[ 22.5% - 23.0% ] 22.75% | 1,453,307 | 12.0% |
[ 23.0% - 23.5% ] 23.27% | 1,401,338 | 12.9% |
[ 23.5% - 24.0% ] 23.76% | 1,051,102 | 12.5% |
[ 24.0% - 24.5% ] 24.26% | 1,165,479 | 11.1% |
[ 24.5% - 25.0% ] 24.73% | 877,038 | 12.6% |
[ 25.0% - 25.5% ] 25.24% | 1,028,361 | 12.1% |
[ 25.5% - 26.0% ] 25.76% | 759,133 | 12.3% |
[ 26.0% - 26.5% ] 26.29% | 705,537 | 12.1% |
[ 26.5% - 27.0% ] 26.76% | 501,863 | 11.9% |
[ 27.0% - 27.5% ] 27.22% | 497,715 | 12.4% |
[ 27.5% - 28.0% ] 27.80% | 490,444 | 12.0% |
[ 28.0% - 28.5% ] 28.24% | 577,790 | 11.6% |
[ 28.5% - 29.0% ] 28.72% | 483,613 | 11.0% |
[ 29.0% - 29.5% ] 29.21% | 353,607 | 12.6% |
[ 29.5% - 30.0% ] 29.70% | 463,233 | 11.1% |
[ 30.0% - 30.5% ] 30.24% | 284,984 | 12.0% |
[ 30.5% - 31.0% ] 30.72% | 270,196 | 12.0% |
[ 31.0% - 31.5% ] 31.32% | 241,011 | 11.2% |
[ 31.5% - 32.0% ] 31.74% | 353,027 | 11.2% |
[ 32.0% - 32.5% ] 32.27% | 184,010 | 11.5% |
[ 32.5% - 33.0% ] 32.80% | 127,501 | 11.4% |
[ 33.0% - 33.5% ] 33.25% | 94,602 | 12.1% |
[ 33.5% - 34.0% ] 33.81% | 151,805 | 10.8% |
[ 34.0% - 34.5% ] 34.23% | 77,882 | 12.5% |
[ 34.5% - 35.0% ] 34.76% | 146,031 | 11.9% |
[ 35.0% - 35.5% ] 35.29% | 103,058 | 10.3% |
[ 35.5% - 36.0% ] 35.70% | 38,578 | 9.6% |
[ 36.0% - 36.5% ] 36.12% | 82,415 | 9.1% |
[ 36.5% - 37.0% ] 36.70% | 41,487 | 15.5% |
[ 37.0% - 37.5% ] 37.15% | 45,352 | 10.9% |
[ 37.5% - 38.0% ] 37.77% | 31,447 | 13.4% |
[ 38.0% - 38.5% ] 38.28% | 41,194 | 9.7% |
[ 38.5% - 39.0% ] 38.64% | 34,771 | 14.7% |
[ 39.0% - 39.5% ] 39.30% | 75,082 | 12.6% |
[ 39.5% - 40.0% ] 39.77% | 40,240 | 13.2% |
[ 40.0% - 40.5% ] 40.11% | 29,891 | 12.1% |
[ 40.5% - 41.0% ] 40.73% | 11,359 | 16.7% |
[ 41.0% - 41.5% ] 41.26% | 18,883 | 11.8% |
[ 41.5% - 42.0% ] 41.73% | 33,638 | 10.5% |
[ 42.0% - 42.5% ] 42.22% | 3,877 | 18.7% |
[ 42.5% - 43.0% ] 42.66% | 11,075 | 13.3% |
[ 43.0% - 43.5% ] 43.23% | 10,184 | 14.2% |
[ 43.5% - 44.0% ] 43.80% | 3,265 | 36.4% |
[ 44.0% - 44.5% ] 44.37% | 7,306 | 17.3% |
[ 44.5% - 45.0% ] 44.75% | 6,190 | 20.9% |
[ 45.0% - 45.5% ] 45.31% | 20,517 | 17.3% |
[ 45.5% - 46.0% ] 45.68% | 3,255 | 24.1% |
[ 46.0% - 46.5% ] 46.26% | 3,748 | 17.2% |
[ 46.5% - 47.0% ] 46.76% | 1,219 | 23.8% |
[ 47.0% - 47.5% ] 47.19% | 16,713 | 16.6% |
[ 47.5% - 48.0% ] 47.87% | 7,393 | 11.5% |
[ 48.0% - 48.5% ] 48.29% | 2,783 | 19.5% |
[ 48.5% - 49.0% ] 48.75% | 1,477 | 35.2% |
[ 49.0% - 49.5% ] 49.13% | 1,323 | 17.8% |
[ 49.5% - 50.0% ] 49.83% | 3,167 | 25.7% |
[ 50.0% - 50.5% ] 50.12% | 2,600 | 19.4% |
[ 50.5% - 51.0% ] 50.65% | 2,610 | 21.5% |
[ 51.0% - 51.5% ] 51.17% | 1,673 | 32.1% |
[ 51.5% - 52.0% ] 51.77% | 1,671 | 28.1% |
[ 52.0% - 52.5% ] 52.19% | 1,533 | 16.1% |
[ 52.5% - 53.0% ] 52.72% | 4,008 | 16.1% |
[ 53.0% - 53.5% ] 53.24% | 4,294 | 15.7% |
[ 53.5% - 54.0% ] 53.86% | 4,220 | 9.5% |
[ 54.0% - 54.5% ] 54.24% | 1,650 | 19.2% |
[ 54.5% - 55.0% ] 54.81% | 1,620 | 23.2% |
[ 55.0% - 55.5% ] 55.28% | 2,907 | 27.6% |
[ 55.5% - 56.0% ] 55.77% | 1,239 | 27.3% |
[ 56.0% - 56.5% ] 56.23% | 1,677 | 5.8% |
[ 56.5% - 57.0% ] 56.69% | 441 | 19.3% |
[ 57.0% - 57.5% ] 57.26% | 613 | 52.8% |
[ 57.5% - 58.0% ] 57.79% | 1,450 | 22.7% |
[ 58.0% - 58.5% ] 58.27% | 738 | 22.6% |
[ 59.0% - 59.5% ] 59.27% | 464 | 25.7% |
[ 59.5% - 60.0% ] 59.65% | 627 | 15.6% |
[ 60.0% - 60.5% ] 60.48% | 124 | 21.7% |
[ 60.5% - 61.0% ] 60.71% | 425 | 39.7% |
[ 61.0% - 61.5% ] 61.17% | 1,705 | 23.0% |
[ 61.5% - 62.0% ] 61.66% | 1,351 | 23.8% |
[ 62.0% - 62.5% ] 62.28% | 1,026 | 15.5% |
[ 62.5% - 63.0% ] 62.73% | 2,093 | 6.1% |
[ 63.0% - 63.5% ] 63.13% | 2,048 | 34.8% |
[ 63.5% - 64.0% ] 63.59% | 195 | 8.9% |
[ 64.5% - 65.0% ] 64.71% | 374 | 39.7% |
[ 65.0% - 65.5% ] 65.45% | 55 | 28.0% |
[ 65.5% - 66.0% ] 65.92% | 179 | 61.9% |
[ 66.0% - 66.5% ] 66.31% | 555 | 32.1% |
[ 66.5% - 67.0% ] 66.89% | 882 | 14.0% |
[ 67.0% - 67.5% ] 67.13% | 435 | 10.8% |
[ 68.0% - 68.5% ] 68.02% | 197 | 11.8% |
[ 68.5% - 69.0% ] 68.84% | 796 | 15.8% |
[ 69.0% - 69.5% ] 69.42% | 206 | 30.7% |
[ 69.5% - 70.0% ] 69.86% | 219 | 53.7% |
[ 70.0% - 70.5% ] 70.11% | 87 | 21.1% |
[ 70.5% - 71.0% ] 70.86% | 707 | 8.5% |
[ 71.0% - 71.5% ] 71.43% | 21 | 42.9% |
[ 71.5% - 72.0% ] 71.69% | 219 | 30.1% |
[ 72.0% - 72.5% ] 72.32% | 383 | 7.0% |
[ 72.5% - 73.0% ] 72.78% | 158 | 38.2% |
[ 73.5% - 74.0% ] 73.56% | 329 | 2.4% |
[ 74.0% - 74.5% ] 74.13% | 286 | 52.9% |
[ 74.5% - 75.0% ] 74.93% | 343 | 31.8% |
[ 75.0% - 75.5% ] 75.40% | 187 | 16.0% |
[ 76.0% - 76.5% ] 76.47% | 34 | 44.5% |
[ 76.5% - 77.0% ] 76.56% | 128 | 36.6% |
[ 78.0% - 78.5% ] 78.26% | 161 | 33.3% |
[ 80.0% - 80.5% ] 80.08% | 502 | 67.4% |
[ 80.5% - 81.0% ] 80.95% | 21 | 23.8% |
[ 81.0% - 81.5% ] 81.40% | 43 | 65.7% |
[ 81.5% - 82.0% ] 81.63% | 49 | 18.4% |
[ 83.0% - 83.5% ] 83.16% | 95 | 23.5% |
[ 84.0% - 84.5% ] 84.07% | 226 | 18.5% |
[ 85.0% - 85.5% ] 85.11% | 47 | 14.9% |
[ 93.0% - 93.5% ] 93.48% | 138 | 80.6% |
[ 94.5% - 95.0% ] 94.51% | 510 | 32.3% |
[ 99.5% - 100.0% ] 100.00% | 460 | 89.8% |