Irish Female Disability
COMPARE
Irish
Select to Compare
Female Disability
Irish Female Disability
13.1%
DISABILITY | FEMALES
0.1/ 100
METRIC RATING
280th/ 347
METRIC RANK
Irish Female Disability Correlation Chart
The statistical analysis conducted on geographies consisting of 580,159,528 people shows a substantial positive correlation between the proportion of Irish and percentage of females with a disability in the United States with a correlation coefficient (R) of 0.519 and weighted average of 13.1%. On average, for every 1% (one percent) increase in Irish within a typical geography, there is an increase of 0.32% in percentage of females with a disability.
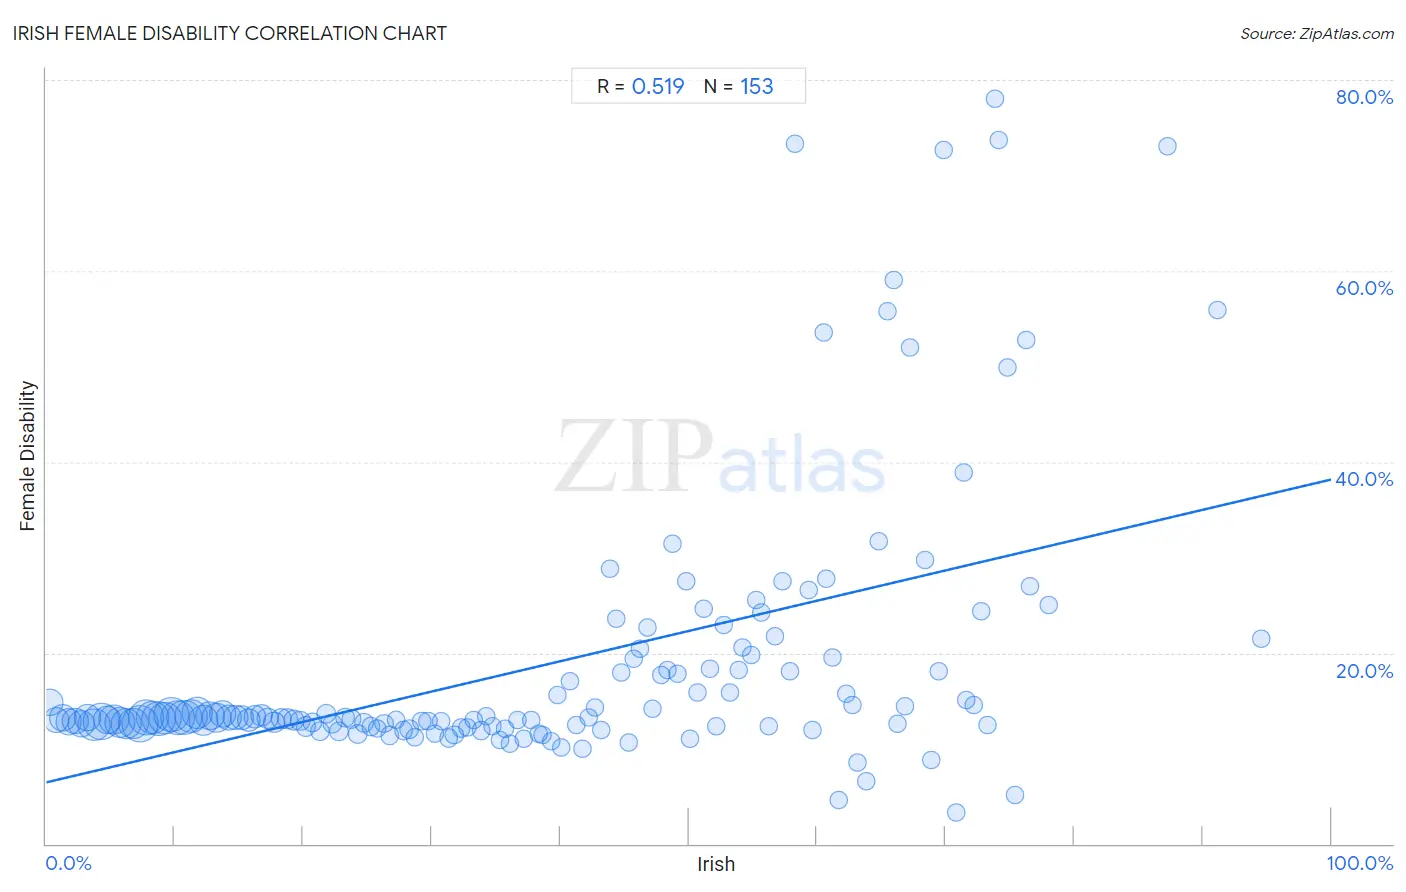
It is essential to understand that the correlation between the percentage of Irish and percentage of females with a disability does not imply a direct cause-and-effect relationship. It remains uncertain whether the presence of Irish influences an upward or downward trend in the level of percentage of females with a disability within an area, or if Irish simply ended up residing in those areas with higher or lower levels of percentage of females with a disability due to other factors.
Demographics Similar to Irish by Female Disability
In terms of female disability, the demographic groups most similar to Irish are U.S. Virgin Islander (13.1%, a difference of 0.030%), Arapaho (13.0%, a difference of 0.090%), Welsh (13.1%, a difference of 0.11%), English (13.1%, a difference of 0.12%), and Hmong (13.1%, a difference of 0.25%).
| Demographics | Rating | Rank | Female Disability |
| Sioux | 0.1 /100 | #273 | Tragic 12.9% |
| Portuguese | 0.1 /100 | #274 | Tragic 13.0% |
| Cheyenne | 0.1 /100 | #275 | Tragic 13.0% |
| Immigrants from Dominica | 0.1 /100 | #276 | Tragic 13.0% |
| Spanish | 0.1 /100 | #277 | Tragic 13.0% |
| Scottish | 0.1 /100 | #278 | Tragic 13.0% |
| Arapaho | 0.1 /100 | #279 | Tragic 13.0% |
| Irish | 0.1 /100 | #280 | Tragic 13.1% |
| U.S. Virgin Islanders | 0.1 /100 | #281 | Tragic 13.1% |
| Welsh | 0.0 /100 | #282 | Tragic 13.1% |
| English | 0.0 /100 | #283 | Tragic 13.1% |
| Hmong | 0.0 /100 | #284 | Tragic 13.1% |
| Bangladeshis | 0.0 /100 | #285 | Tragic 13.1% |
| Fijians | 0.0 /100 | #286 | Tragic 13.1% |
| Yaqui | 0.0 /100 | #287 | Tragic 13.2% |
Irish Female Disability Correlation Summary
| Measurement | Irish Data | Female Disability Data |
| Minimum | 0.26% | 3.2% |
| Maximum | 94.5% | 78.1% |
| Range | 94.2% | 74.9% |
| Mean | 38.8% | 18.7% |
| Median | 38.3% | 13.2% |
| Interquartile 25% (IQ1) | 19.0% | 12.4% |
| Interquartile 75% (IQ3) | 57.5% | 18.3% |
| Interquartile Range (IQR) | 38.5% | 5.9% |
| Standard Deviation (Sample) | 23.2% | 14.2% |
| Standard Deviation (Population) | 23.1% | 14.1% |
Correlation Details
| Irish Percentile | Sample Size | Female Disability |
[ 0.0% - 0.5% ] 0.26% | 12,564,189 | 14.9% |
[ 0.5% - 1.0% ] 0.73% | 10,449,789 | 12.9% |
[ 1.0% - 1.5% ] 1.26% | 11,262,297 | 13.2% |
[ 1.5% - 2.0% ] 1.76% | 10,693,775 | 12.8% |
[ 2.0% - 2.5% ] 2.26% | 11,142,903 | 12.9% |
[ 2.5% - 3.0% ] 2.74% | 12,063,827 | 12.6% |
[ 3.0% - 3.5% ] 3.25% | 11,954,011 | 13.3% |
[ 3.5% - 4.0% ] 3.71% | 19,925,152 | 12.5% |
[ 4.0% - 4.5% ] 4.30% | 25,449,730 | 12.8% |
[ 4.5% - 5.0% ] 4.74% | 14,384,183 | 13.0% |
[ 5.0% - 5.5% ] 5.24% | 16,865,430 | 13.0% |
[ 5.5% - 6.0% ] 5.74% | 17,479,914 | 12.7% |
[ 6.0% - 6.5% ] 6.25% | 17,530,344 | 12.6% |
[ 6.5% - 7.0% ] 6.76% | 17,995,257 | 12.6% |
[ 7.0% - 7.5% ] 7.25% | 25,854,279 | 12.6% |
[ 7.5% - 8.0% ] 7.75% | 24,513,614 | 13.2% |
[ 8.0% - 8.5% ] 8.26% | 20,655,357 | 13.2% |
[ 8.5% - 9.0% ] 8.73% | 22,686,775 | 13.0% |
[ 9.0% - 9.5% ] 9.25% | 20,605,741 | 13.2% |
[ 9.5% - 10.0% ] 9.75% | 23,728,447 | 13.5% |
[ 10.0% - 10.5% ] 10.24% | 21,946,561 | 13.2% |
[ 10.5% - 11.0% ] 10.74% | 22,711,859 | 13.3% |
[ 11.0% - 11.5% ] 11.26% | 21,175,933 | 13.4% |
[ 11.5% - 12.0% ] 11.76% | 18,007,037 | 13.7% |
[ 12.0% - 12.5% ] 12.23% | 16,441,110 | 12.9% |
[ 12.5% - 13.0% ] 12.76% | 15,290,712 | 13.4% |
[ 13.0% - 13.5% ] 13.24% | 14,818,416 | 13.2% |
[ 13.5% - 14.0% ] 13.74% | 11,721,393 | 13.6% |
[ 14.0% - 14.5% ] 14.24% | 10,200,581 | 13.2% |
[ 14.5% - 15.0% ] 14.74% | 8,853,137 | 13.2% |
[ 15.0% - 15.5% ] 15.24% | 8,231,913 | 13.2% |
[ 15.5% - 16.0% ] 15.75% | 6,705,553 | 12.9% |
[ 16.0% - 16.5% ] 16.25% | 5,547,730 | 13.3% |
[ 16.5% - 17.0% ] 16.74% | 4,411,588 | 13.5% |
[ 17.0% - 17.5% ] 17.25% | 4,443,258 | 13.1% |
[ 17.5% - 18.0% ] 17.74% | 4,026,210 | 12.7% |
[ 18.0% - 18.5% ] 18.25% | 3,702,227 | 13.1% |
[ 18.5% - 19.0% ] 18.74% | 3,394,006 | 13.1% |
[ 19.0% - 19.5% ] 19.27% | 3,038,941 | 12.9% |
[ 19.5% - 20.0% ] 19.76% | 2,852,304 | 12.9% |
[ 20.0% - 20.5% ] 20.22% | 2,673,543 | 12.3% |
[ 20.5% - 21.0% ] 20.74% | 2,036,461 | 12.7% |
[ 21.0% - 21.5% ] 21.26% | 1,852,539 | 11.8% |
[ 21.5% - 22.0% ] 21.74% | 1,729,196 | 13.7% |
[ 22.0% - 22.5% ] 22.27% | 2,029,263 | 12.6% |
[ 22.5% - 23.0% ] 22.75% | 1,454,784 | 11.7% |
[ 23.0% - 23.5% ] 23.27% | 1,401,501 | 13.2% |
[ 23.5% - 24.0% ] 23.76% | 1,050,733 | 13.1% |
[ 24.0% - 24.5% ] 24.26% | 1,165,293 | 11.5% |
[ 24.5% - 25.0% ] 24.73% | 876,257 | 12.7% |
[ 25.0% - 25.5% ] 25.24% | 1,028,178 | 12.3% |
[ 25.5% - 26.0% ] 25.76% | 757,325 | 12.1% |
[ 26.0% - 26.5% ] 26.29% | 703,034 | 12.6% |
[ 26.5% - 27.0% ] 26.76% | 499,767 | 11.3% |
[ 27.0% - 27.5% ] 27.22% | 497,969 | 13.0% |
[ 27.5% - 28.0% ] 27.80% | 491,717 | 11.9% |
[ 28.0% - 28.5% ] 28.24% | 576,857 | 12.0% |
[ 28.5% - 29.0% ] 28.72% | 485,131 | 11.2% |
[ 29.0% - 29.5% ] 29.22% | 351,547 | 12.8% |
[ 29.5% - 30.0% ] 29.70% | 463,218 | 12.8% |
[ 30.0% - 30.5% ] 30.24% | 285,734 | 11.6% |
[ 30.5% - 31.0% ] 30.72% | 269,960 | 12.8% |
[ 31.0% - 31.5% ] 31.32% | 241,550 | 11.1% |
[ 31.5% - 32.0% ] 31.74% | 352,643 | 11.4% |
[ 32.0% - 32.5% ] 32.27% | 183,864 | 12.1% |
[ 32.5% - 33.0% ] 32.80% | 126,696 | 12.2% |
[ 33.0% - 33.5% ] 33.25% | 95,649 | 13.0% |
[ 33.5% - 34.0% ] 33.81% | 151,777 | 11.9% |
[ 34.0% - 34.5% ] 34.23% | 77,104 | 13.4% |
[ 34.5% - 35.0% ] 34.76% | 146,224 | 12.3% |
[ 35.0% - 35.5% ] 35.29% | 103,089 | 10.9% |
[ 35.5% - 36.0% ] 35.70% | 39,119 | 12.0% |
[ 36.0% - 36.5% ] 36.12% | 81,619 | 10.5% |
[ 36.5% - 37.0% ] 36.70% | 39,811 | 13.0% |
[ 37.0% - 37.5% ] 37.15% | 46,549 | 11.1% |
[ 37.5% - 38.0% ] 37.77% | 30,718 | 13.0% |
[ 38.0% - 38.5% ] 38.28% | 41,285 | 11.5% |
[ 38.5% - 39.0% ] 38.64% | 34,806 | 11.3% |
[ 39.0% - 39.5% ] 39.30% | 74,823 | 10.7% |
[ 39.5% - 40.0% ] 39.77% | 39,905 | 15.6% |
[ 40.0% - 40.5% ] 40.11% | 29,296 | 10.0% |
[ 40.5% - 41.0% ] 40.73% | 12,055 | 17.1% |
[ 41.0% - 41.5% ] 41.26% | 18,812 | 12.4% |
[ 41.5% - 42.0% ] 41.74% | 34,084 | 10.0% |
[ 42.0% - 42.5% ] 42.22% | 4,074 | 13.2% |
[ 42.5% - 43.0% ] 42.67% | 11,484 | 14.3% |
[ 43.0% - 43.5% ] 43.23% | 9,506 | 11.9% |
[ 43.5% - 44.0% ] 43.84% | 2,694 | 28.8% |
[ 44.0% - 44.5% ] 44.36% | 7,752 | 23.6% |
[ 44.5% - 45.0% ] 44.73% | 6,485 | 18.0% |
[ 45.0% - 45.5% ] 45.31% | 20,969 | 10.6% |
[ 45.5% - 46.0% ] 45.70% | 3,427 | 19.4% |
[ 46.0% - 46.5% ] 46.24% | 3,201 | 20.4% |
[ 46.5% - 47.0% ] 46.79% | 2,028 | 22.6% |
[ 47.0% - 47.5% ] 47.19% | 16,971 | 14.2% |
[ 47.5% - 48.0% ] 47.87% | 5,918 | 17.7% |
[ 48.0% - 48.5% ] 48.32% | 2,531 | 18.3% |
[ 48.5% - 49.0% ] 48.74% | 1,194 | 31.4% |
[ 49.0% - 49.5% ] 49.11% | 1,745 | 17.9% |
[ 49.5% - 50.0% ] 49.85% | 2,644 | 27.5% |
[ 50.0% - 50.5% ] 50.10% | 2,381 | 11.0% |
[ 50.5% - 51.0% ] 50.69% | 3,054 | 15.8% |
[ 51.0% - 51.5% ] 51.20% | 2,205 | 24.7% |
[ 51.5% - 52.0% ] 51.68% | 654 | 18.3% |
[ 52.0% - 52.5% ] 52.15% | 792 | 12.3% |
[ 52.5% - 53.0% ] 52.71% | 3,284 | 22.9% |
[ 53.0% - 53.5% ] 53.23% | 3,810 | 15.9% |
[ 53.5% - 54.0% ] 53.85% | 4,917 | 18.2% |
[ 54.0% - 54.5% ] 54.19% | 1,264 | 20.6% |
[ 54.5% - 55.0% ] 54.83% | 1,419 | 19.8% |
[ 55.0% - 55.5% ] 55.28% | 3,137 | 25.5% |
[ 55.5% - 56.0% ] 55.67% | 1,401 | 24.2% |
[ 56.0% - 56.5% ] 56.21% | 1,569 | 12.3% |
[ 56.5% - 57.0% ] 56.67% | 487 | 21.7% |
[ 57.0% - 57.5% ] 57.25% | 545 | 27.5% |
[ 57.5% - 58.0% ] 57.84% | 1,231 | 18.0% |
[ 58.0% - 58.5% ] 58.24% | 455 | 73.4% |
[ 59.0% - 59.5% ] 59.34% | 305 | 26.6% |
[ 59.5% - 60.0% ] 59.62% | 1,045 | 12.0% |
[ 60.0% - 60.5% ] 60.47% | 172 | 53.5% |
[ 60.5% - 61.0% ] 60.67% | 267 | 27.7% |
[ 61.0% - 61.5% ] 61.17% | 958 | 19.5% |
[ 61.5% - 62.0% ] 61.69% | 1,146 | 4.6% |
[ 62.0% - 62.5% ] 62.25% | 1,057 | 15.7% |
[ 62.5% - 63.0% ] 62.73% | 1,913 | 14.5% |
[ 63.0% - 63.5% ] 63.14% | 2,002 | 8.6% |
[ 63.5% - 64.0% ] 63.77% | 668 | 6.5% |
[ 64.5% - 65.0% ] 64.78% | 673 | 31.7% |
[ 65.0% - 65.5% ] 65.45% | 110 | 55.8% |
[ 65.5% - 66.0% ] 65.91% | 88 | 59.1% |
[ 66.0% - 66.5% ] 66.25% | 240 | 12.6% |
[ 66.5% - 67.0% ] 66.84% | 1,125 | 14.4% |
[ 67.0% - 67.5% ] 67.19% | 381 | 52.0% |
[ 68.0% - 68.5% ] 68.36% | 256 | 29.7% |
[ 68.5% - 69.0% ] 68.84% | 735 | 8.8% |
[ 69.0% - 69.5% ] 69.42% | 206 | 18.1% |
[ 69.5% - 70.0% ] 69.85% | 199 | 72.7% |
[ 70.5% - 71.0% ] 70.86% | 707 | 3.2% |
[ 71.0% - 71.5% ] 71.43% | 21 | 38.9% |
[ 71.5% - 72.0% ] 71.63% | 141 | 15.0% |
[ 72.0% - 72.5% ] 72.16% | 370 | 14.5% |
[ 72.5% - 73.0% ] 72.73% | 66 | 24.4% |
[ 73.0% - 73.5% ] 73.21% | 56 | 12.5% |
[ 73.5% - 74.0% ] 73.81% | 42 | 78.1% |
[ 74.0% - 74.5% ] 74.14% | 232 | 73.7% |
[ 74.5% - 75.0% ] 74.85% | 167 | 49.9% |
[ 75.0% - 75.5% ] 75.40% | 187 | 5.1% |
[ 76.0% - 76.5% ] 76.26% | 813 | 52.8% |
[ 76.5% - 77.0% ] 76.58% | 111 | 26.9% |
[ 78.0% - 78.5% ] 78.05% | 82 | 25.0% |
[ 87.0% - 87.5% ] 87.27% | 55 | 73.1% |
[ 91.0% - 91.5% ] 91.15% | 226 | 55.9% |
[ 94.5% - 95.0% ] 94.51% | 510 | 21.4% |