Immigrants from Nigeria Married-couple Households
COMPARE
Immigrants from Nigeria
Select to Compare
Married-couple Households
Immigrants from Nigeria Married-couple Households
43.2%
MARRIED-COUPLE HOUSEHOLDS
0.1/ 100
METRIC RATING
272nd/ 347
METRIC RANK
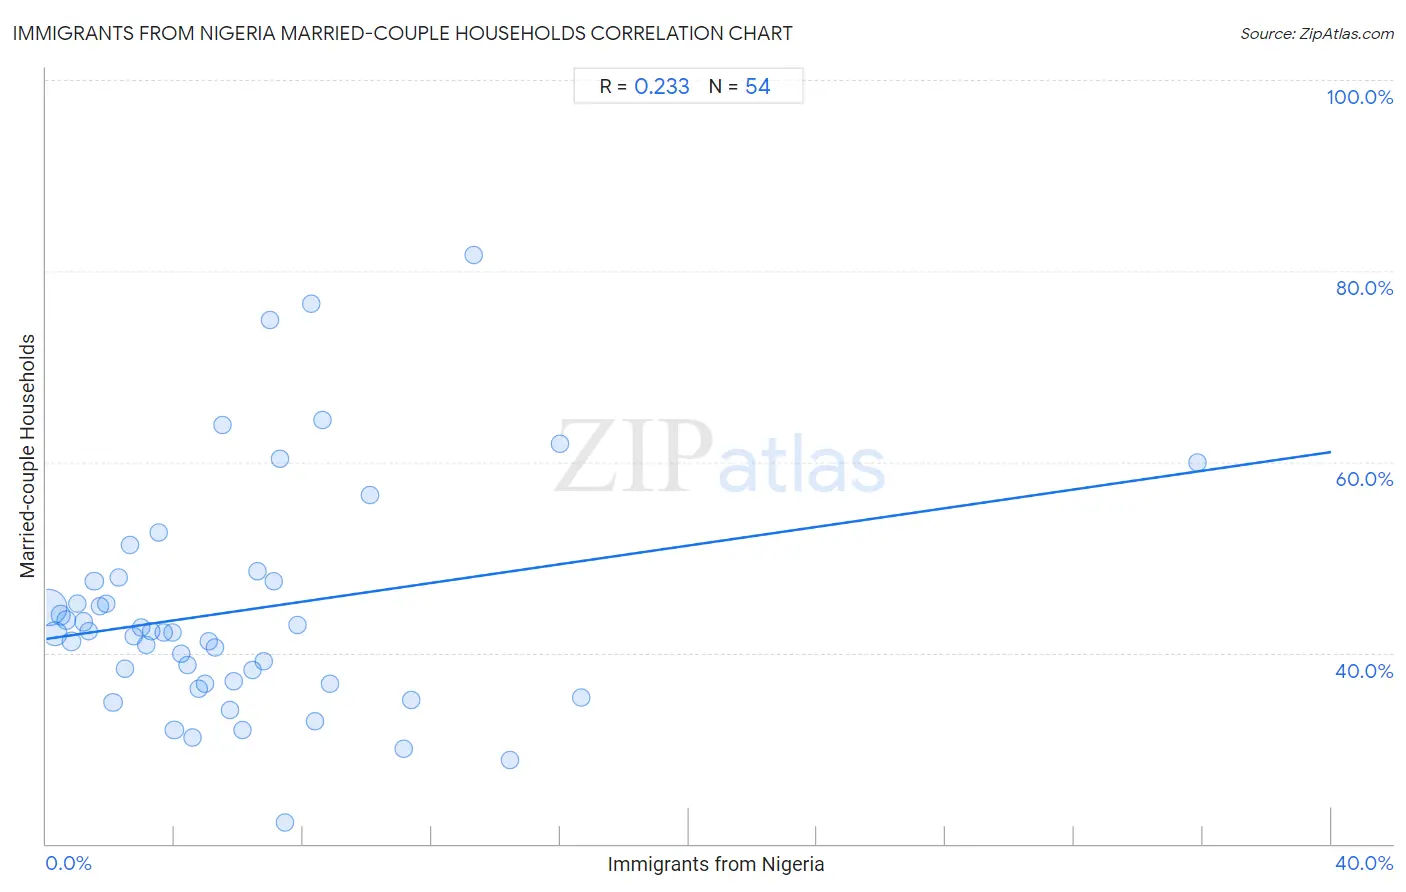
Immigrants from Nigeria Married-couple Households Correlation Chart
The statistical analysis conducted on geographies consisting of 283,287,559 people shows a weak positive correlation between the proportion of Immigrants from Nigeria and percentage of married-couple family households in the United States with a correlation coefficient (R) of 0.233 and weighted average of 43.2%. On average, for every 1% (one percent) increase in Immigrants from Nigeria within a typical geography, there is an increase of 0.49% in percentage of married-couple family households.
It is essential to understand that the correlation between the percentage of Immigrants from Nigeria and percentage of married-couple family households does not imply a direct cause-and-effect relationship. It remains uncertain whether the presence of Immigrants from Nigeria influences an upward or downward trend in the level of percentage of married-couple family households within an area, or if Immigrants from Nigeria simply ended up residing in those areas with higher or lower levels of percentage of married-couple family households due to other factors.
Demographics Similar to Immigrants from Nigeria by Married-couple Households
In terms of married-couple households, the demographic groups most similar to Immigrants from Nigeria are Ethiopian (43.2%, a difference of 0.10%), Guatemalan (43.3%, a difference of 0.11%), Nigerian (43.2%, a difference of 0.11%), Yuman (43.3%, a difference of 0.21%), and Immigrants from Bangladesh (43.1%, a difference of 0.25%).
| Demographics | Rating | Rank | Married-couple Households |
| Moroccans | 0.1 /100 | #265 | Tragic 43.5% |
| Ecuadorians | 0.1 /100 | #266 | Tragic 43.5% |
| Natives/Alaskans | 0.1 /100 | #267 | Tragic 43.5% |
| Immigrants from Burma/Myanmar | 0.1 /100 | #268 | Tragic 43.4% |
| Immigrants from Sierra Leone | 0.1 /100 | #269 | Tragic 43.3% |
| Yuman | 0.1 /100 | #270 | Tragic 43.3% |
| Guatemalans | 0.1 /100 | #271 | Tragic 43.3% |
| Immigrants from Nigeria | 0.1 /100 | #272 | Tragic 43.2% |
| Ethiopians | 0.1 /100 | #273 | Tragic 43.2% |
| Nigerians | 0.1 /100 | #274 | Tragic 43.2% |
| Immigrants from Bangladesh | 0.0 /100 | #275 | Tragic 43.1% |
| Immigrants from Ethiopia | 0.0 /100 | #276 | Tragic 43.1% |
| Immigrants from Eastern Africa | 0.0 /100 | #277 | Tragic 42.9% |
| Immigrants from Africa | 0.0 /100 | #278 | Tragic 42.9% |
| Sierra Leoneans | 0.0 /100 | #279 | Tragic 42.9% |
Immigrants from Nigeria Married-couple Households Correlation Summary
| Measurement | Immigrants from Nigeria Data | Married-couple Households Data |
| Minimum | 0.073% | 22.2% |
| Maximum | 35.8% | 81.7% |
| Range | 35.7% | 59.5% |
| Mean | 6.0% | 44.4% |
| Median | 4.8% | 42.1% |
| Interquartile 25% (IQ1) | 2.4% | 36.8% |
| Interquartile 75% (IQ3) | 7.4% | 47.5% |
| Interquartile Range (IQR) | 5.0% | 10.7% |
| Standard Deviation (Sample) | 5.7% | 12.0% |
| Standard Deviation (Population) | 5.7% | 11.9% |
Correlation Details
| Immigrants from Nigeria Percentile | Sample Size | Married-couple Households |
[ 0.0% - 0.5% ] 0.073% | 172,556,387 | 44.8% |
[ 0.0% - 0.5% ] 0.26% | 57,809,144 | 42.0% |
[ 0.0% - 0.5% ] 0.45% | 20,731,141 | 43.9% |
[ 0.5% - 1.0% ] 0.62% | 10,479,017 | 43.5% |
[ 0.5% - 1.0% ] 0.80% | 8,626,992 | 41.2% |
[ 0.5% - 1.0% ] 0.97% | 3,088,148 | 45.2% |
[ 1.0% - 1.5% ] 1.17% | 1,754,555 | 43.3% |
[ 1.0% - 1.5% ] 1.33% | 1,524,807 | 42.3% |
[ 1.0% - 1.5% ] 1.50% | 1,121,889 | 47.5% |
[ 1.5% - 2.0% ] 1.68% | 1,004,571 | 44.9% |
[ 1.5% - 2.0% ] 1.87% | 458,980 | 45.1% |
[ 2.0% - 2.5% ] 2.08% | 911,168 | 34.7% |
[ 2.0% - 2.5% ] 2.25% | 387,892 | 47.9% |
[ 2.0% - 2.5% ] 2.44% | 369,314 | 38.3% |
[ 2.5% - 3.0% ] 2.61% | 203,427 | 51.3% |
[ 2.5% - 3.0% ] 2.72% | 19,049 | 41.7% |
[ 2.5% - 3.0% ] 2.94% | 224,822 | 42.6% |
[ 3.0% - 3.5% ] 3.12% | 240,487 | 40.9% |
[ 3.0% - 3.5% ] 3.26% | 185,940 | 42.2% |
[ 3.0% - 3.5% ] 3.50% | 151,060 | 52.6% |
[ 3.5% - 4.0% ] 3.65% | 287,893 | 42.1% |
[ 3.5% - 4.0% ] 3.92% | 20,688 | 42.1% |
[ 3.5% - 4.0% ] 3.99% | 181,679 | 31.9% |
[ 4.0% - 4.5% ] 4.19% | 113,203 | 39.9% |
[ 4.0% - 4.5% ] 4.40% | 56,437 | 38.7% |
[ 4.5% - 5.0% ] 4.55% | 79,530 | 31.1% |
[ 4.5% - 5.0% ] 4.76% | 102,259 | 36.2% |
[ 4.5% - 5.0% ] 4.93% | 16,429 | 36.8% |
[ 5.0% - 5.5% ] 5.05% | 28,565 | 41.2% |
[ 5.0% - 5.5% ] 5.25% | 79,506 | 40.5% |
[ 5.0% - 5.5% ] 5.49% | 19,933 | 63.9% |
[ 5.5% - 6.0% ] 5.70% | 9,781 | 34.1% |
[ 5.5% - 6.0% ] 5.83% | 62,975 | 37.0% |
[ 6.0% - 6.5% ] 6.10% | 30,335 | 31.9% |
[ 6.0% - 6.5% ] 6.41% | 15,405 | 38.2% |
[ 6.5% - 7.0% ] 6.58% | 106,517 | 48.5% |
[ 6.5% - 7.0% ] 6.77% | 32,191 | 39.1% |
[ 6.5% - 7.0% ] 6.98% | 387 | 74.8% |
[ 7.0% - 7.5% ] 7.10% | 310 | 47.4% |
[ 7.0% - 7.5% ] 7.29% | 1,934 | 60.3% |
[ 7.0% - 7.5% ] 7.41% | 526 | 22.2% |
[ 7.5% - 8.0% ] 7.83% | 49,541 | 42.9% |
[ 8.0% - 8.5% ] 8.23% | 76,600 | 76.6% |
[ 8.0% - 8.5% ] 8.38% | 40,125 | 32.8% |
[ 8.5% - 9.0% ] 8.61% | 11,504 | 64.4% |
[ 8.5% - 9.0% ] 8.84% | 5,331 | 36.8% |
[ 10.0% - 10.5% ] 10.08% | 1,875 | 56.5% |
[ 11.0% - 11.5% ] 11.11% | 468 | 30.0% |
[ 11.0% - 11.5% ] 11.36% | 44 | 35.0% |
[ 13.0% - 13.5% ] 13.30% | 421 | 81.7% |
[ 14.0% - 14.5% ] 14.44% | 2,348 | 28.8% |
[ 15.5% - 16.0% ] 15.99% | 3,914 | 61.9% |
[ 16.5% - 17.0% ] 16.67% | 48 | 35.3% |
[ 35.5% - 36.0% ] 35.82% | 67 | 60.0% |