Immigrants from Nigeria 2 or more Vehicles in Household
COMPARE
Immigrants from Nigeria
Select to Compare
2 or more Vehicles in Household
Immigrants from Nigeria 2 or more Vehicles in Household
52.9%
2+ VEHICLES AVAILABLE
1.2/ 100
METRIC RATING
246th/ 347
METRIC RANK
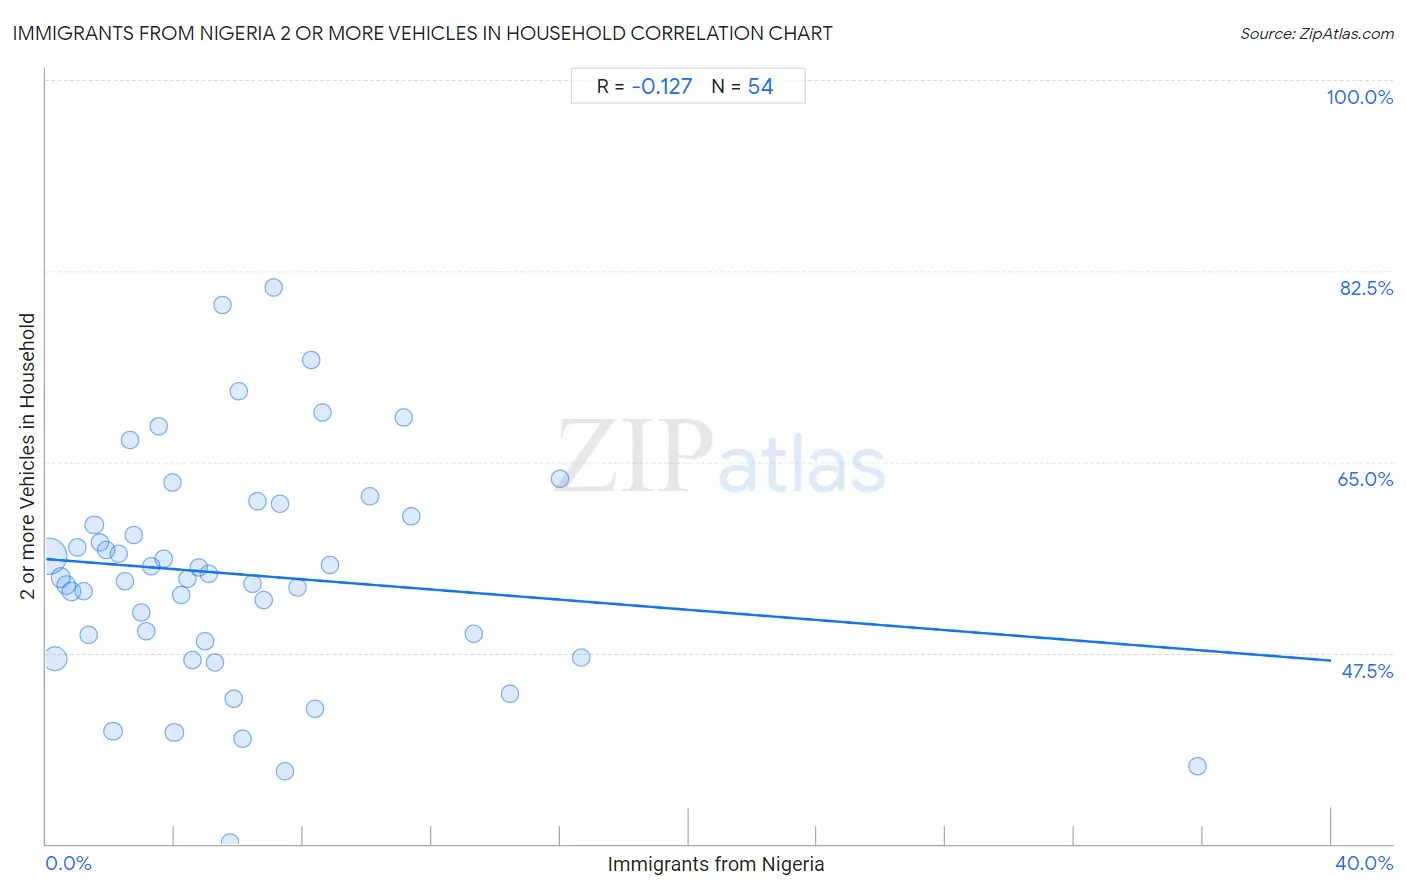
Immigrants from Nigeria 2 or more Vehicles in Household Correlation Chart
The statistical analysis conducted on geographies consisting of 283,313,070 people shows a poor negative correlation between the proportion of Immigrants from Nigeria and percentage of households with 2 or more vehicles available in the United States with a correlation coefficient (R) of -0.127 and weighted average of 52.9%. On average, for every 1% (one percent) increase in Immigrants from Nigeria within a typical geography, there is a decrease of 0.23% in percentage of households with 2 or more vehicles available.
It is essential to understand that the correlation between the percentage of Immigrants from Nigeria and percentage of households with 2 or more vehicles available does not imply a direct cause-and-effect relationship. It remains uncertain whether the presence of Immigrants from Nigeria influences an upward or downward trend in the level of percentage of households with 2 or more vehicles available within an area, or if Immigrants from Nigeria simply ended up residing in those areas with higher or lower levels of percentage of households with 2 or more vehicles available due to other factors.
Demographics Similar to Immigrants from Nigeria by 2 or more Vehicles in Household
In terms of 2 or more vehicles in household, the demographic groups most similar to Immigrants from Nigeria are Sierra Leonean (52.9%, a difference of 0.030%), Colombian (52.9%, a difference of 0.15%), Immigrants from Ethiopia (53.0%, a difference of 0.20%), Immigrants from Brazil (52.8%, a difference of 0.20%), and Mongolian (52.8%, a difference of 0.21%).
| Demographics | Rating | Rank | 2 or more Vehicles in Household |
| Cambodians | 2.3 /100 | #239 | Tragic 53.3% |
| Immigrants from Europe | 2.1 /100 | #240 | Tragic 53.2% |
| Immigrants from Sierra Leone | 2.1 /100 | #241 | Tragic 53.2% |
| Immigrants from Eastern Asia | 2.1 /100 | #242 | Tragic 53.2% |
| Ethiopians | 1.7 /100 | #243 | Tragic 53.1% |
| Indians (Asian) | 1.7 /100 | #244 | Tragic 53.1% |
| Immigrants from Ethiopia | 1.5 /100 | #245 | Tragic 53.0% |
| Immigrants from Nigeria | 1.2 /100 | #246 | Tragic 52.9% |
| Sierra Leoneans | 1.2 /100 | #247 | Tragic 52.9% |
| Colombians | 1.1 /100 | #248 | Tragic 52.9% |
| Immigrants from Brazil | 1.0 /100 | #249 | Tragic 52.8% |
| Mongolians | 1.0 /100 | #250 | Tragic 52.8% |
| Immigrants from Sudan | 1.0 /100 | #251 | Tragic 52.8% |
| Immigrants from Portugal | 1.0 /100 | #252 | Tragic 52.8% |
| Nigerians | 0.9 /100 | #253 | Tragic 52.8% |
Immigrants from Nigeria 2 or more Vehicles in Household Correlation Summary
| Measurement | Immigrants from Nigeria Data | 2 or more Vehicles in Household Data |
| Minimum | 0.073% | 30.1% |
| Maximum | 35.8% | 81.0% |
| Range | 35.7% | 50.9% |
| Mean | 6.0% | 54.7% |
| Median | 4.8% | 54.3% |
| Interquartile 25% (IQ1) | 2.4% | 48.5% |
| Interquartile 75% (IQ3) | 7.4% | 60.0% |
| Interquartile Range (IQR) | 5.0% | 11.5% |
| Standard Deviation (Sample) | 5.7% | 10.5% |
| Standard Deviation (Population) | 5.7% | 10.4% |
Correlation Details
| Immigrants from Nigeria Percentile | Sample Size | 2 or more Vehicles in Household |
[ 0.0% - 0.5% ] 0.073% | 172,569,428 | 56.3% |
[ 0.0% - 0.5% ] 0.26% | 57,819,730 | 46.9% |
[ 0.0% - 0.5% ] 0.45% | 20,731,141 | 54.4% |
[ 0.5% - 1.0% ] 0.62% | 10,479,017 | 53.8% |
[ 0.5% - 1.0% ] 0.80% | 8,624,998 | 53.2% |
[ 0.5% - 1.0% ] 0.97% | 3,088,148 | 57.1% |
[ 1.0% - 1.5% ] 1.17% | 1,754,555 | 53.2% |
[ 1.0% - 1.5% ] 1.33% | 1,524,807 | 49.1% |
[ 1.0% - 1.5% ] 1.50% | 1,121,889 | 59.2% |
[ 1.5% - 2.0% ] 1.68% | 1,007,547 | 57.7% |
[ 1.5% - 2.0% ] 1.87% | 458,980 | 56.9% |
[ 2.0% - 2.5% ] 2.08% | 911,168 | 40.3% |
[ 2.0% - 2.5% ] 2.25% | 387,892 | 56.6% |
[ 2.0% - 2.5% ] 2.44% | 369,314 | 54.1% |
[ 2.5% - 3.0% ] 2.61% | 203,427 | 67.0% |
[ 2.5% - 3.0% ] 2.72% | 19,049 | 58.3% |
[ 2.5% - 3.0% ] 2.94% | 224,822 | 51.2% |
[ 3.0% - 3.5% ] 3.12% | 240,487 | 49.4% |
[ 3.0% - 3.5% ] 3.26% | 185,940 | 55.5% |
[ 3.0% - 3.5% ] 3.50% | 151,060 | 68.3% |
[ 3.5% - 4.0% ] 3.65% | 288,111 | 56.1% |
[ 3.5% - 4.0% ] 3.92% | 20,688 | 63.1% |
[ 3.5% - 4.0% ] 3.99% | 181,679 | 40.1% |
[ 4.0% - 4.5% ] 4.19% | 113,203 | 52.8% |
[ 4.0% - 4.5% ] 4.40% | 56,437 | 54.3% |
[ 4.5% - 5.0% ] 4.55% | 79,530 | 46.8% |
[ 4.5% - 5.0% ] 4.76% | 102,259 | 55.3% |
[ 4.5% - 5.0% ] 4.93% | 16,429 | 48.5% |
[ 5.0% - 5.5% ] 5.05% | 28,565 | 54.7% |
[ 5.0% - 5.5% ] 5.25% | 79,506 | 46.6% |
[ 5.0% - 5.5% ] 5.49% | 19,933 | 79.4% |
[ 5.5% - 6.0% ] 5.70% | 9,781 | 30.1% |
[ 5.5% - 6.0% ] 5.83% | 62,975 | 43.3% |
[ 5.5% - 6.0% ] 5.98% | 1,071 | 71.4% |
[ 6.0% - 6.5% ] 6.10% | 30,335 | 39.7% |
[ 6.0% - 6.5% ] 6.41% | 15,405 | 53.9% |
[ 6.5% - 7.0% ] 6.58% | 106,517 | 61.4% |
[ 6.5% - 7.0% ] 6.77% | 32,191 | 52.3% |
[ 7.0% - 7.5% ] 7.10% | 310 | 81.0% |
[ 7.0% - 7.5% ] 7.29% | 1,934 | 61.1% |
[ 7.0% - 7.5% ] 7.41% | 526 | 36.6% |
[ 7.5% - 8.0% ] 7.83% | 49,541 | 53.4% |
[ 8.0% - 8.5% ] 8.23% | 76,600 | 74.3% |
[ 8.0% - 8.5% ] 8.38% | 40,125 | 42.4% |
[ 8.5% - 9.0% ] 8.61% | 11,504 | 69.5% |
[ 8.5% - 9.0% ] 8.84% | 5,331 | 55.6% |
[ 10.0% - 10.5% ] 10.08% | 1,875 | 61.9% |
[ 11.0% - 11.5% ] 11.11% | 468 | 69.1% |
[ 11.0% - 11.5% ] 11.36% | 44 | 60.0% |
[ 13.0% - 13.5% ] 13.30% | 421 | 49.2% |
[ 14.0% - 14.5% ] 14.44% | 2,348 | 43.7% |
[ 15.5% - 16.0% ] 15.99% | 3,914 | 63.5% |
[ 16.5% - 17.0% ] 16.67% | 48 | 47.1% |
[ 35.5% - 36.0% ] 35.82% | 67 | 37.1% |