Immigrants from Mexico 4 or more Vehicles in Household
COMPARE
Immigrants from Mexico
Select to Compare
4 or more Vehicles in Household
Immigrants from Mexico 4 or more Vehicles in Household
9.0%
4+ VEHICLES AVAILABLE
100.0/ 100
METRIC RATING
11th/ 347
METRIC RANK
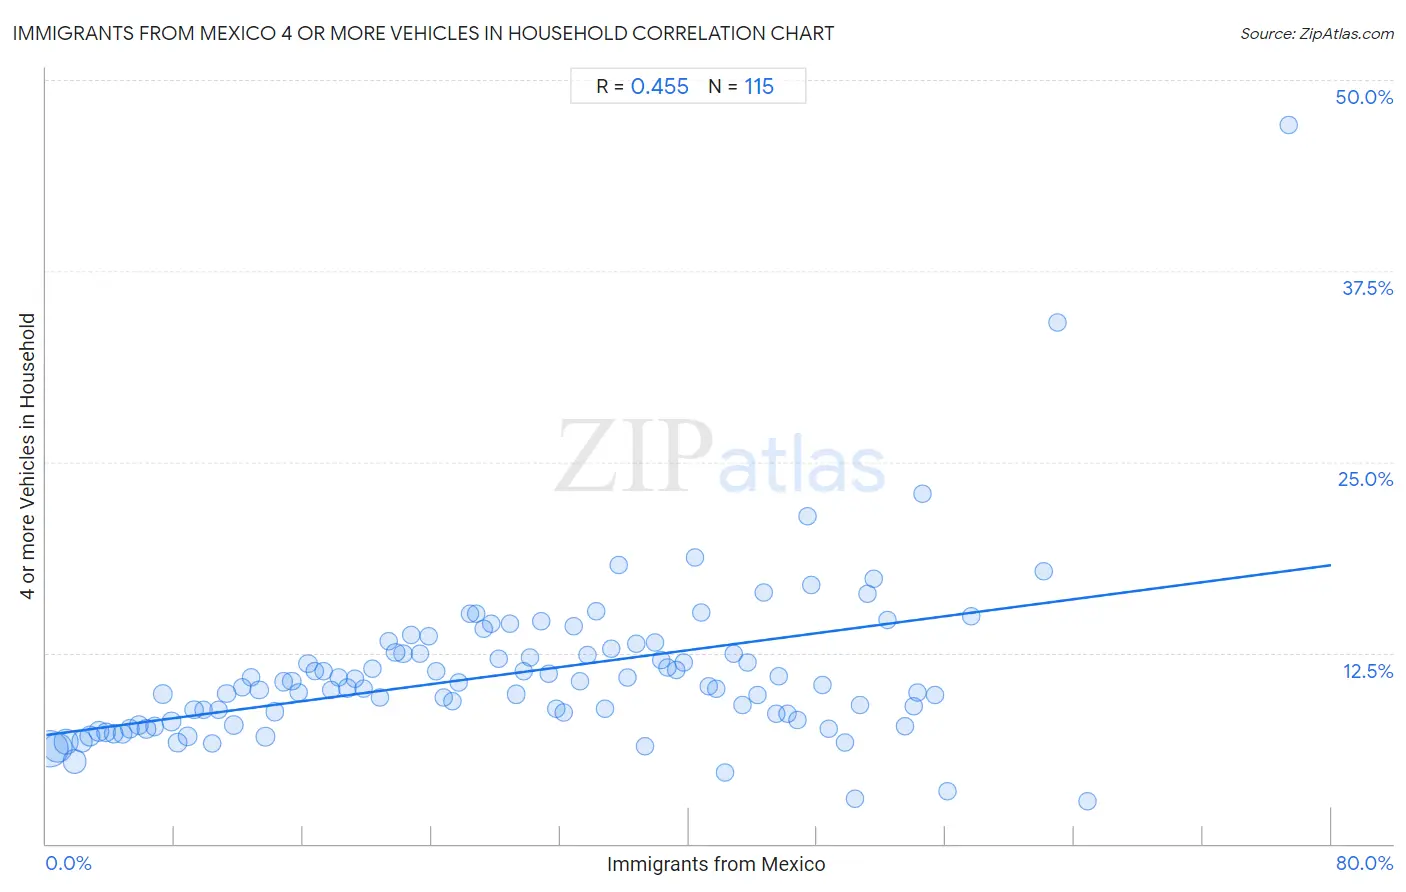
Immigrants from Mexico 4 or more Vehicles in Household Correlation Chart
The statistical analysis conducted on geographies consisting of 511,223,450 people shows a moderate positive correlation between the proportion of Immigrants from Mexico and percentage of households with 4 or more vehicles available in the United States with a correlation coefficient (R) of 0.455 and weighted average of 9.0%. On average, for every 1% (one percent) increase in Immigrants from Mexico within a typical geography, there is an increase of 0.14% in percentage of households with 4 or more vehicles available.
It is essential to understand that the correlation between the percentage of Immigrants from Mexico and percentage of households with 4 or more vehicles available does not imply a direct cause-and-effect relationship. It remains uncertain whether the presence of Immigrants from Mexico influences an upward or downward trend in the level of percentage of households with 4 or more vehicles available within an area, or if Immigrants from Mexico simply ended up residing in those areas with higher or lower levels of percentage of households with 4 or more vehicles available due to other factors.
Demographics Similar to Immigrants from Mexico by 4 or more Vehicles in Household
In terms of 4 or more vehicles in household, the demographic groups most similar to Immigrants from Mexico are Paiute (9.0%, a difference of 0.12%), Mexican (8.9%, a difference of 0.68%), Hawaiian (8.9%, a difference of 0.69%), Chinese (8.8%, a difference of 1.7%), and Shoshone (8.8%, a difference of 1.7%).
| Demographics | Rating | Rank | 4 or more Vehicles in Household |
| Tongans | 100.0 /100 | #4 | Exceptional 10.0% |
| Immigrants from Fiji | 100.0 /100 | #5 | Exceptional 9.6% |
| Puget Sound Salish | 100.0 /100 | #6 | Exceptional 9.4% |
| Native Hawaiians | 100.0 /100 | #7 | Exceptional 9.4% |
| Arapaho | 100.0 /100 | #8 | Exceptional 9.4% |
| Samoans | 100.0 /100 | #9 | Exceptional 9.2% |
| Paiute | 100.0 /100 | #10 | Exceptional 9.0% |
| Immigrants from Mexico | 100.0 /100 | #11 | Exceptional 9.0% |
| Mexicans | 100.0 /100 | #12 | Exceptional 8.9% |
| Hawaiians | 100.0 /100 | #13 | Exceptional 8.9% |
| Chinese | 100.0 /100 | #14 | Exceptional 8.8% |
| Shoshone | 100.0 /100 | #15 | Exceptional 8.8% |
| Lumbee | 100.0 /100 | #16 | Exceptional 8.8% |
| Ute | 100.0 /100 | #17 | Exceptional 8.8% |
| Nepalese | 100.0 /100 | #18 | Exceptional 8.7% |
Immigrants from Mexico 4 or more Vehicles in Household Correlation Summary
| Measurement | Immigrants from Mexico Data | 4 or more Vehicles in Household Data |
| Minimum | 0.24% | 2.8% |
| Maximum | 77.4% | 47.1% |
| Range | 77.1% | 44.3% |
| Mean | 29.2% | 11.2% |
| Median | 28.9% | 10.3% |
| Interquartile 25% (IQ1) | 14.2% | 8.1% |
| Interquartile 75% (IQ3) | 43.3% | 12.5% |
| Interquartile Range (IQR) | 29.1% | 4.4% |
| Standard Deviation (Sample) | 17.6% | 5.4% |
| Standard Deviation (Population) | 17.5% | 5.3% |
Correlation Details
| Immigrants from Mexico Percentile | Sample Size | 4 or more Vehicles in Household |
[ 0.0% - 0.5% ] 0.24% | 133,692,816 | 6.2% |
[ 0.5% - 1.0% ] 0.73% | 77,217,044 | 6.3% |
[ 1.0% - 1.5% ] 1.22% | 46,115,594 | 6.7% |
[ 1.5% - 2.0% ] 1.77% | 41,197,649 | 5.4% |
[ 2.0% - 2.5% ] 2.24% | 24,058,627 | 6.7% |
[ 2.5% - 3.0% ] 2.75% | 19,555,861 | 7.0% |
[ 3.0% - 3.5% ] 3.24% | 16,499,506 | 7.4% |
[ 3.5% - 4.0% ] 3.73% | 11,343,577 | 7.3% |
[ 4.0% - 4.5% ] 4.23% | 9,966,091 | 7.2% |
[ 4.5% - 5.0% ] 4.74% | 8,578,757 | 7.2% |
[ 5.0% - 5.5% ] 5.22% | 9,153,389 | 7.5% |
[ 5.5% - 6.0% ] 5.75% | 7,627,454 | 7.8% |
[ 6.0% - 6.5% ] 6.23% | 6,268,469 | 7.5% |
[ 6.5% - 7.0% ] 6.75% | 5,835,893 | 7.7% |
[ 7.0% - 7.5% ] 7.27% | 4,435,823 | 9.8% |
[ 7.5% - 8.0% ] 7.82% | 5,448,926 | 8.0% |
[ 8.0% - 8.5% ] 8.20% | 7,114,170 | 6.6% |
[ 8.5% - 9.0% ] 8.79% | 7,192,220 | 7.0% |
[ 9.0% - 9.5% ] 9.21% | 3,876,887 | 8.8% |
[ 9.5% - 10.0% ] 9.79% | 2,639,713 | 8.7% |
[ 10.0% - 10.5% ] 10.32% | 4,576,274 | 6.6% |
[ 10.5% - 11.0% ] 10.71% | 2,724,412 | 8.8% |
[ 11.0% - 11.5% ] 11.23% | 3,317,401 | 9.8% |
[ 11.5% - 12.0% ] 11.69% | 8,259,189 | 7.8% |
[ 12.0% - 12.5% ] 12.20% | 2,792,122 | 10.3% |
[ 12.5% - 13.0% ] 12.73% | 2,229,594 | 10.9% |
[ 13.0% - 13.5% ] 13.26% | 1,676,818 | 10.1% |
[ 13.5% - 14.0% ] 13.65% | 2,725,277 | 7.0% |
[ 14.0% - 14.5% ] 14.23% | 2,403,447 | 8.6% |
[ 14.5% - 15.0% ] 14.76% | 1,571,097 | 10.6% |
[ 15.0% - 15.5% ] 15.28% | 1,800,103 | 10.7% |
[ 15.5% - 16.0% ] 15.74% | 1,478,168 | 9.9% |
[ 16.0% - 16.5% ] 16.30% | 1,606,814 | 11.8% |
[ 16.5% - 17.0% ] 16.73% | 2,373,319 | 11.3% |
[ 17.0% - 17.5% ] 17.28% | 1,365,740 | 11.3% |
[ 17.5% - 18.0% ] 17.73% | 1,144,639 | 10.0% |
[ 18.0% - 18.5% ] 18.21% | 1,138,925 | 10.9% |
[ 18.5% - 19.0% ] 18.74% | 1,260,106 | 10.2% |
[ 19.0% - 19.5% ] 19.24% | 746,581 | 10.8% |
[ 19.5% - 20.0% ] 19.77% | 1,846,325 | 10.2% |
[ 20.0% - 20.5% ] 20.29% | 1,049,026 | 11.4% |
[ 20.5% - 21.0% ] 20.78% | 585,123 | 9.6% |
[ 21.0% - 21.5% ] 21.30% | 828,861 | 13.2% |
[ 21.5% - 22.0% ] 21.75% | 675,175 | 12.5% |
[ 22.0% - 22.5% ] 22.21% | 734,458 | 12.5% |
[ 22.5% - 23.0% ] 22.75% | 896,714 | 13.7% |
[ 23.0% - 23.5% ] 23.27% | 1,163,463 | 12.4% |
[ 23.5% - 24.0% ] 23.79% | 595,787 | 13.6% |
[ 24.0% - 24.5% ] 24.27% | 462,769 | 11.3% |
[ 24.5% - 25.0% ] 24.72% | 327,799 | 9.6% |
[ 25.0% - 25.5% ] 25.30% | 713,824 | 9.3% |
[ 25.5% - 26.0% ] 25.69% | 673,575 | 10.6% |
[ 26.0% - 26.5% ] 26.35% | 335,493 | 15.0% |
[ 26.5% - 27.0% ] 26.78% | 524,430 | 15.1% |
[ 27.0% - 27.5% ] 27.22% | 726,019 | 14.1% |
[ 27.5% - 28.0% ] 27.70% | 466,514 | 14.4% |
[ 28.0% - 28.5% ] 28.20% | 383,506 | 12.1% |
[ 28.5% - 29.0% ] 28.85% | 697,754 | 14.4% |
[ 29.0% - 29.5% ] 29.24% | 777,952 | 9.8% |
[ 29.5% - 30.0% ] 29.72% | 263,872 | 11.3% |
[ 30.0% - 30.5% ] 30.14% | 283,198 | 12.2% |
[ 30.5% - 31.0% ] 30.80% | 271,327 | 14.5% |
[ 31.0% - 31.5% ] 31.26% | 132,879 | 11.2% |
[ 31.5% - 32.0% ] 31.74% | 263,007 | 8.8% |
[ 32.0% - 32.5% ] 32.20% | 188,624 | 8.6% |
[ 32.5% - 33.0% ] 32.81% | 537,544 | 14.2% |
[ 33.0% - 33.5% ] 33.22% | 126,898 | 10.6% |
[ 33.5% - 34.0% ] 33.72% | 51,137 | 12.4% |
[ 34.0% - 34.5% ] 34.26% | 239,335 | 15.2% |
[ 34.5% - 35.0% ] 34.76% | 402,997 | 8.9% |
[ 35.0% - 35.5% ] 35.19% | 59,763 | 12.8% |
[ 35.5% - 36.0% ] 35.66% | 9,016 | 18.3% |
[ 36.0% - 36.5% ] 36.21% | 82,578 | 10.9% |
[ 36.5% - 37.0% ] 36.73% | 51,792 | 13.1% |
[ 37.0% - 37.5% ] 37.26% | 5,920 | 6.4% |
[ 37.5% - 38.0% ] 37.86% | 43,224 | 13.2% |
[ 38.0% - 38.5% ] 38.29% | 93,519 | 12.0% |
[ 38.5% - 39.0% ] 38.71% | 9,455 | 11.6% |
[ 39.0% - 39.5% ] 39.22% | 116,559 | 11.3% |
[ 39.5% - 40.0% ] 39.72% | 55,830 | 11.9% |
[ 40.0% - 40.5% ] 40.35% | 8,337 | 18.7% |
[ 40.5% - 41.0% ] 40.79% | 97,738 | 15.2% |
[ 41.0% - 41.5% ] 41.27% | 82,100 | 10.3% |
[ 41.5% - 42.0% ] 41.68% | 2,997 | 10.2% |
[ 42.0% - 42.5% ] 42.23% | 14,188 | 4.7% |
[ 42.5% - 43.0% ] 42.83% | 31,745 | 12.4% |
[ 43.0% - 43.5% ] 43.31% | 28,942 | 9.1% |
[ 43.5% - 44.0% ] 43.68% | 5,811 | 11.8% |
[ 44.0% - 44.5% ] 44.29% | 62,703 | 9.8% |
[ 44.5% - 45.0% ] 44.69% | 3,916 | 16.4% |
[ 45.0% - 45.5% ] 45.41% | 22,630 | 8.5% |
[ 45.5% - 46.0% ] 45.57% | 29,477 | 10.9% |
[ 46.0% - 46.5% ] 46.11% | 939 | 8.5% |
[ 46.5% - 47.0% ] 46.81% | 8,415 | 8.1% |
[ 47.0% - 47.5% ] 47.36% | 6,676 | 21.4% |
[ 47.5% - 48.0% ] 47.62% | 504 | 16.9% |
[ 48.0% - 48.5% ] 48.36% | 670 | 10.4% |
[ 48.5% - 49.0% ] 48.71% | 10,108 | 7.6% |
[ 49.5% - 50.0% ] 49.74% | 1,166 | 6.6% |
[ 50.0% - 50.5% ] 50.37% | 3,480 | 2.9% |
[ 50.5% - 51.0% ] 50.67% | 1,352 | 9.1% |
[ 51.0% - 51.5% ] 51.16% | 2,416 | 16.4% |
[ 51.5% - 52.0% ] 51.53% | 1,238 | 17.3% |
[ 52.0% - 52.5% ] 52.40% | 1,540 | 14.6% |
[ 53.0% - 53.5% ] 53.45% | 3,422 | 7.7% |
[ 53.5% - 54.0% ] 53.99% | 9,412 | 9.0% |
[ 54.0% - 54.5% ] 54.28% | 1,111 | 9.9% |
[ 54.5% - 55.0% ] 54.55% | 132 | 22.9% |
[ 55.0% - 55.5% ] 55.33% | 13,279 | 9.7% |
[ 56.0% - 56.5% ] 56.13% | 1,404 | 3.4% |
[ 57.5% - 58.0% ] 57.58% | 1,023 | 14.9% |
[ 62.0% - 62.5% ] 62.09% | 153 | 17.9% |
[ 62.5% - 63.0% ] 62.93% | 1,748 | 34.1% |
[ 64.5% - 65.0% ] 64.84% | 1,061 | 2.8% |
[ 77.0% - 77.5% ] 77.38% | 84 | 47.1% |