Immigrants from Mexico Disability Age 5 to 17
COMPARE
Immigrants from Mexico
Select to Compare
Disability Age 5 to 17
Immigrants from Mexico Disability Age 5 to 17
5.6%
DISABILITY | AGE 5 TO 17
33.7/ 100
METRIC RATING
185th/ 347
METRIC RANK
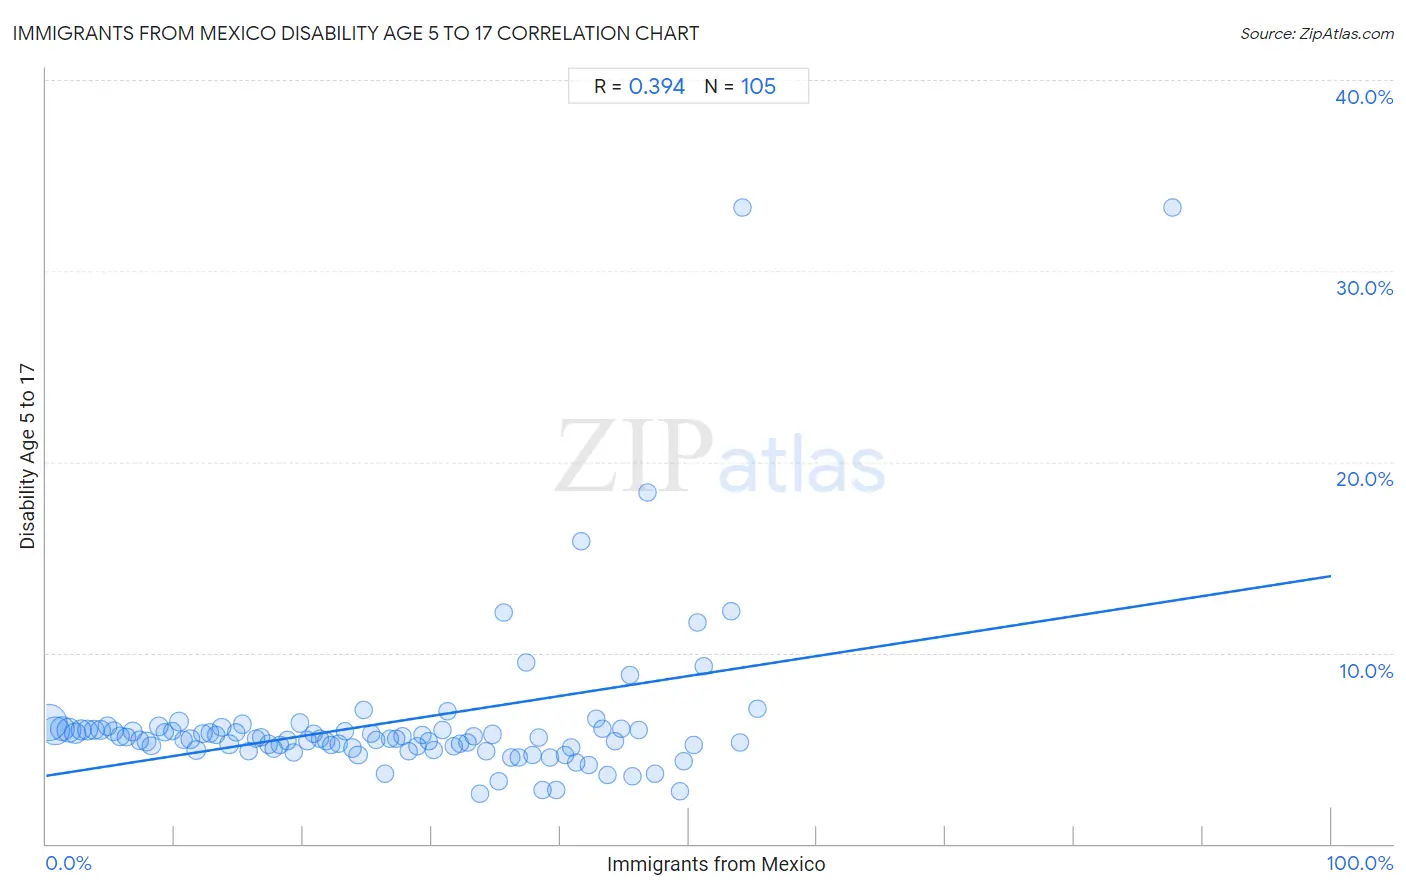
Immigrants from Mexico Disability Age 5 to 17 Correlation Chart
The statistical analysis conducted on geographies consisting of 506,254,859 people shows a mild positive correlation between the proportion of Immigrants from Mexico and percentage of population with a disability between the ages 5 and 17 in the United States with a correlation coefficient (R) of 0.394 and weighted average of 5.6%. On average, for every 1% (one percent) increase in Immigrants from Mexico within a typical geography, there is an increase of 0.10% in percentage of population with a disability between the ages 5 and 17.
It is essential to understand that the correlation between the percentage of Immigrants from Mexico and percentage of population with a disability between the ages 5 and 17 does not imply a direct cause-and-effect relationship. It remains uncertain whether the presence of Immigrants from Mexico influences an upward or downward trend in the level of percentage of population with a disability between the ages 5 and 17 within an area, or if Immigrants from Mexico simply ended up residing in those areas with higher or lower levels of percentage of population with a disability between the ages 5 and 17 due to other factors.
Demographics Similar to Immigrants from Mexico by Disability Age 5 to 17
In terms of disability age 5 to 17, the demographic groups most similar to Immigrants from Mexico are Syrian (5.6%, a difference of 0.010%), Immigrants from Latin America (5.6%, a difference of 0.030%), Mexican American Indian (5.6%, a difference of 0.080%), Fijian (5.7%, a difference of 0.11%), and Immigrants from England (5.6%, a difference of 0.14%).
| Demographics | Rating | Rank | Disability Age 5 to 17 |
| Immigrants from Trinidad and Tobago | 47.6 /100 | #178 | Average 5.6% |
| Immigrants from Barbados | 40.5 /100 | #179 | Average 5.6% |
| Immigrants from Uruguay | 37.7 /100 | #180 | Fair 5.6% |
| Immigrants from England | 36.4 /100 | #181 | Fair 5.6% |
| Mexican American Indians | 35.2 /100 | #182 | Fair 5.6% |
| Immigrants from Latin America | 34.3 /100 | #183 | Fair 5.6% |
| Syrians | 33.8 /100 | #184 | Fair 5.6% |
| Immigrants from Mexico | 33.7 /100 | #185 | Fair 5.6% |
| Fijians | 31.7 /100 | #186 | Fair 5.7% |
| Immigrants from Thailand | 30.2 /100 | #187 | Fair 5.7% |
| Marshallese | 28.1 /100 | #188 | Fair 5.7% |
| Pueblo | 27.5 /100 | #189 | Fair 5.7% |
| Immigrants from Eastern Africa | 27.3 /100 | #190 | Fair 5.7% |
| Danes | 26.5 /100 | #191 | Fair 5.7% |
| Immigrants from Bosnia and Herzegovina | 26.3 /100 | #192 | Fair 5.7% |
Immigrants from Mexico Disability Age 5 to 17 Correlation Summary
| Measurement | Immigrants from Mexico Data | Disability Age 5 to 17 Data |
| Minimum | 0.24% | 2.6% |
| Maximum | 87.6% | 33.3% |
| Range | 87.4% | 30.7% |
| Mean | 26.8% | 6.4% |
| Median | 26.3% | 5.5% |
| Interquartile 25% (IQ1) | 13.0% | 5.0% |
| Interquartile 75% (IQ3) | 39.5% | 6.0% |
| Interquartile Range (IQR) | 26.5% | 0.96% |
| Standard Deviation (Sample) | 16.5% | 4.4% |
| Standard Deviation (Population) | 16.4% | 4.4% |
Correlation Details
| Immigrants from Mexico Percentile | Sample Size | Disability Age 5 to 17 |
[ 0.0% - 0.5% ] 0.24% | 132,212,898 | 6.3% |
[ 0.5% - 1.0% ] 0.73% | 76,621,241 | 5.9% |
[ 1.0% - 1.5% ] 1.22% | 45,625,870 | 6.0% |
[ 1.5% - 2.0% ] 1.77% | 41,089,879 | 5.9% |
[ 2.0% - 2.5% ] 2.24% | 23,817,668 | 5.8% |
[ 2.5% - 3.0% ] 2.75% | 19,421,891 | 6.0% |
[ 3.0% - 3.5% ] 3.24% | 16,310,578 | 5.9% |
[ 3.5% - 4.0% ] 3.73% | 11,196,330 | 6.0% |
[ 4.0% - 4.5% ] 4.23% | 9,832,858 | 6.0% |
[ 4.5% - 5.0% ] 4.74% | 8,563,467 | 6.1% |
[ 5.0% - 5.5% ] 5.22% | 9,053,263 | 5.9% |
[ 5.5% - 6.0% ] 5.75% | 7,550,378 | 5.6% |
[ 6.0% - 6.5% ] 6.23% | 6,199,529 | 5.6% |
[ 6.5% - 7.0% ] 6.75% | 5,738,715 | 5.9% |
[ 7.0% - 7.5% ] 7.27% | 4,381,489 | 5.4% |
[ 7.5% - 8.0% ] 7.82% | 5,369,915 | 5.4% |
[ 8.0% - 8.5% ] 8.20% | 7,078,133 | 5.1% |
[ 8.5% - 9.0% ] 8.80% | 7,134,446 | 6.1% |
[ 9.0% - 9.5% ] 9.21% | 3,827,235 | 5.9% |
[ 9.5% - 10.0% ] 9.79% | 2,559,795 | 5.9% |
[ 10.0% - 10.5% ] 10.33% | 4,529,418 | 6.4% |
[ 10.5% - 11.0% ] 10.71% | 2,694,778 | 5.5% |
[ 11.0% - 11.5% ] 11.23% | 3,262,863 | 5.5% |
[ 11.5% - 12.0% ] 11.69% | 8,233,449 | 4.9% |
[ 12.0% - 12.5% ] 12.20% | 2,761,962 | 5.8% |
[ 12.5% - 13.0% ] 12.73% | 2,200,200 | 5.8% |
[ 13.0% - 13.5% ] 13.26% | 1,639,234 | 5.7% |
[ 13.5% - 14.0% ] 13.65% | 2,698,446 | 6.1% |
[ 14.0% - 14.5% ] 14.23% | 2,387,497 | 5.2% |
[ 14.5% - 15.0% ] 14.76% | 1,560,809 | 5.8% |
[ 15.0% - 15.5% ] 15.28% | 1,777,243 | 6.3% |
[ 15.5% - 16.0% ] 15.74% | 1,467,058 | 4.8% |
[ 16.0% - 16.5% ] 16.30% | 1,602,941 | 5.5% |
[ 16.5% - 17.0% ] 16.73% | 2,357,628 | 5.6% |
[ 17.0% - 17.5% ] 17.28% | 1,357,638 | 5.2% |
[ 17.5% - 18.0% ] 17.73% | 1,132,670 | 5.0% |
[ 18.0% - 18.5% ] 18.21% | 1,126,270 | 5.2% |
[ 18.5% - 19.0% ] 18.73% | 1,242,152 | 5.4% |
[ 19.0% - 19.5% ] 19.24% | 740,006 | 4.8% |
[ 19.5% - 20.0% ] 19.77% | 1,834,759 | 6.3% |
[ 20.0% - 20.5% ] 20.29% | 1,032,329 | 5.4% |
[ 20.5% - 21.0% ] 20.78% | 569,362 | 5.7% |
[ 21.0% - 21.5% ] 21.30% | 824,437 | 5.5% |
[ 21.5% - 22.0% ] 21.75% | 655,026 | 5.4% |
[ 22.0% - 22.5% ] 22.21% | 725,551 | 5.2% |
[ 22.5% - 23.0% ] 22.75% | 884,666 | 5.2% |
[ 23.0% - 23.5% ] 23.28% | 1,146,775 | 5.9% |
[ 23.5% - 24.0% ] 23.79% | 581,950 | 5.0% |
[ 24.0% - 24.5% ] 24.27% | 448,676 | 4.6% |
[ 24.5% - 25.0% ] 24.72% | 324,125 | 7.0% |
[ 25.0% - 25.5% ] 25.30% | 704,829 | 5.8% |
[ 25.5% - 26.0% ] 25.69% | 669,127 | 5.4% |
[ 26.0% - 26.5% ] 26.35% | 326,819 | 3.7% |
[ 26.5% - 27.0% ] 26.78% | 507,310 | 5.5% |
[ 27.0% - 27.5% ] 27.22% | 714,701 | 5.5% |
[ 27.5% - 28.0% ] 27.70% | 463,439 | 5.6% |
[ 28.0% - 28.5% ] 28.20% | 381,051 | 4.9% |
[ 28.5% - 29.0% ] 28.85% | 695,083 | 5.1% |
[ 29.0% - 29.5% ] 29.24% | 772,109 | 5.7% |
[ 29.5% - 30.0% ] 29.72% | 261,536 | 5.4% |
[ 30.0% - 30.5% ] 30.14% | 275,203 | 4.9% |
[ 30.5% - 31.0% ] 30.79% | 263,289 | 6.0% |
[ 31.0% - 31.5% ] 31.26% | 131,383 | 7.0% |
[ 31.5% - 32.0% ] 31.74% | 261,971 | 5.1% |
[ 32.0% - 32.5% ] 32.20% | 187,830 | 5.2% |
[ 32.5% - 33.0% ] 32.81% | 535,748 | 5.3% |
[ 33.0% - 33.5% ] 33.22% | 126,658 | 5.6% |
[ 33.5% - 34.0% ] 33.71% | 49,323 | 2.6% |
[ 34.0% - 34.5% ] 34.25% | 235,437 | 4.9% |
[ 34.5% - 35.0% ] 34.76% | 399,532 | 5.7% |
[ 35.0% - 35.5% ] 35.19% | 58,358 | 3.3% |
[ 35.5% - 36.0% ] 35.64% | 2,239 | 12.1% |
[ 36.0% - 36.5% ] 36.21% | 82,170 | 4.5% |
[ 36.5% - 37.0% ] 36.73% | 51,792 | 4.5% |
[ 37.0% - 37.5% ] 37.31% | 3,980 | 9.5% |
[ 37.5% - 38.0% ] 37.86% | 40,635 | 4.7% |
[ 38.0% - 38.5% ] 38.29% | 92,644 | 5.6% |
[ 38.5% - 39.0% ] 38.65% | 6,176 | 2.8% |
[ 39.0% - 39.5% ] 39.22% | 115,099 | 4.5% |
[ 39.5% - 40.0% ] 39.73% | 41,507 | 2.8% |
[ 40.0% - 40.5% ] 40.36% | 4,782 | 4.7% |
[ 40.5% - 41.0% ] 40.81% | 86,911 | 5.0% |
[ 41.0% - 41.5% ] 41.27% | 81,050 | 4.3% |
[ 41.5% - 42.0% ] 41.64% | 2,517 | 15.9% |
[ 42.0% - 42.5% ] 42.22% | 13,176 | 4.1% |
[ 42.5% - 43.0% ] 42.85% | 26,759 | 6.5% |
[ 43.0% - 43.5% ] 43.31% | 28,942 | 6.0% |
[ 43.5% - 44.0% ] 43.67% | 5,068 | 3.6% |
[ 44.0% - 44.5% ] 44.29% | 62,590 | 5.4% |
[ 44.5% - 45.0% ] 44.71% | 3,494 | 6.0% |
[ 45.0% - 45.5% ] 45.41% | 22,445 | 8.8% |
[ 45.5% - 46.0% ] 45.57% | 29,477 | 3.5% |
[ 46.0% - 46.5% ] 46.11% | 939 | 5.9% |
[ 46.5% - 47.0% ] 46.81% | 4,920 | 18.4% |
[ 47.0% - 47.5% ] 47.36% | 6,676 | 3.7% |
[ 49.0% - 49.5% ] 49.33% | 892 | 2.7% |
[ 49.5% - 50.0% ] 49.62% | 794 | 4.3% |
[ 50.0% - 50.5% ] 50.37% | 3,480 | 5.2% |
[ 50.5% - 51.0% ] 50.67% | 1,352 | 11.6% |
[ 51.0% - 51.5% ] 51.16% | 2,416 | 9.3% |
[ 53.0% - 53.5% ] 53.33% | 812 | 12.1% |
[ 53.5% - 54.0% ] 53.99% | 9,362 | 5.3% |
[ 54.0% - 54.5% ] 54.19% | 155 | 33.3% |
[ 55.0% - 55.5% ] 55.33% | 13,279 | 7.0% |
[ 87.5% - 88.0% ] 87.63% | 97 | 33.3% |