Immigrants from Malaysia Married-Couple Family Poverty

COMPARE

Immigrants from Malaysia
Race
Ancestry
AfghanAfricanAlaska NativeAlaskan AthabascanAlbanianAleutAlsatianAmericanApacheArabArapahoArgentineanArmenianAssyrian/Chaldean/SyriacAustralianAustrianBahamianBangladeshiBarbadianBasqueBelgianBelizeanBermudanBhutaneseBlackfeetBolivianBrazilianBritishBritish West IndianBulgarianBurmeseCajunCambodianCanadianCape VerdeanCarpatho RusynCelticCentral AmericanCentral American IndianCherokeeCheyenneChickasawChileanChineseChippewaChoctawColombianColvilleComancheCosta RicanCreeCreekCroatianCrowCubanCypriotCzechCzechoslovakianDanishDelawareDominicanDutchDutch West IndianEastern EuropeanEcuadorianEgyptianEnglishEstonianEthiopianEuropeanFijianFilipinoFinnishFrenchFrench American IndianFrench CanadianGermanGerman RussianGhanaianGreekGuamanian/ChamorroGuatemalanGuyaneseHaitianHmongHonduranHopiHoumaHungarianIcelanderIndian (Asian)IndonesianInupiatIranianIraqiIrishIroquoisIsraeliItalianJamaicanJapaneseJordanianKenyanKiowaKoreanLaotianLatvianLebaneseLiberianLithuanianLumbeeLuxembourgerMacedonianMalaysianMalteseMarshalleseMenomineeMexicanMexican American IndianMongolianMoroccanNative HawaiianNavajoNepaleseNew ZealanderNicaraguanNigerianNorthern EuropeanNorwegianOkinawanOsageOttawaPaiutePakistaniPalestinianPanamanianParaguayanPennsylvania GermanPeruvianPimaPolishPortuguesePotawatomiPuebloPuerto RicanPuget Sound SalishRomanianRussianSalvadoranSamoanScandinavianScotch-IrishScottishSeminoleSenegaleseSerbianShoshoneSierra LeoneanSiouxSlavicSlovakSloveneSomaliSouth AfricanSouth AmericanSouth American IndianSoviet UnionSpaniardSpanishSpanish AmericanSpanish American IndianSri LankanSubsaharan AfricanSudaneseSwedishSwissSyrianTaiwaneseThaiTlingit-HaidaTohono O'OdhamTonganTrinidadian and TobagonianTsimshianTurkishU.S. Virgin IslanderUgandanUkrainianUruguayanUteVenezuelanVietnameseWelshWest IndianYakamaYaquiYugoslavianYumanYup'ikZimbabwean
Immigration
NonimmigrantsImmigrantsAfghanistanAfricaAlbaniaArgentinaArmeniaAsiaAustraliaAustriaBahamasBangladeshBarbadosBelarusBelgiumBelizeBoliviaBosnia and HerzegovinaBrazilBulgariaBurma/MyanmarCabo VerdeCambodiaCameroonCanadaCaribbeanCentral AmericaChileChinaColombiaCongoCosta RicaCroatiaCubaCzechoslovakiaDenmarkDominicaDominican RepublicEastern AfricaEastern AsiaEastern EuropeEcuadorEgyptEl SalvadorEnglandEritreaEthiopiaEuropeFijiFranceGermanyGhanaGreeceGrenadaGuatemalaGuyanaHaitiHondurasHong KongHungaryIndiaIndonesiaIranIraqIrelandIsraelItalyJamaicaJapanJordanKazakhstanKenyaKoreaKuwaitLaosLatin AmericaLatviaLebanonLiberiaLithuaniaMalaysiaMexicoMicronesiaMiddle AfricaMoldovaMoroccoNepalNetherlandsNicaraguaNigeriaNorth AmericaNorth MacedoniaNorthern AfricaNorthern EuropeNorwayOceaniaPakistanPanamaPeruPhilippinesPolandPortugalRomaniaRussiaSaudi ArabiaScotlandSenegalSerbiaSierra LeoneSingaporeSomaliaSouth AfricaSouth AmericaSouth Central AsiaSouth Eastern AsiaSouthern EuropeSpainSri LankaSt. Vincent and the GrenadinesSudanSwedenSwitzerlandSyriaTaiwanThailandTrinidad and TobagoTurkeyUgandaUkraineUruguayUzbekistanVenezuelaVietnamWest IndiesWestern AfricaWestern AsiaWestern EuropeYemenZaireZimbabweAzores
Select to Compare
Race
Ancestry
AfghanAfricanAlaska NativeAlaskan AthabascanAlbanianAleutAlsatianAmericanApacheArabArapahoArgentineanArmenianAssyrian/Chaldean/SyriacAustralianAustrianBahamianBangladeshiBarbadianBasqueBelgianBelizeanBermudanBhutaneseBlackfeetBolivianBrazilianBritishBritish West IndianBulgarianBurmeseCajunCambodianCanadianCape VerdeanCarpatho RusynCelticCentral AmericanCentral American IndianCherokeeCheyenneChickasawChileanChineseChippewaChoctawColombianColvilleComancheCosta RicanCreeCreekCroatianCrowCubanCypriotCzechCzechoslovakianDanishDelawareDominicanDutchDutch West IndianEastern EuropeanEcuadorianEgyptianEnglishEstonianEthiopianEuropeanFijianFilipinoFinnishFrenchFrench American IndianFrench CanadianGermanGerman RussianGhanaianGreekGuamanian/ChamorroGuatemalanGuyaneseHaitianHmongHonduranHopiHoumaHungarianIcelanderIndian (Asian)IndonesianInupiatIranianIraqiIrishIroquoisIsraeliItalianJamaicanJapaneseJordanianKenyanKiowaKoreanLaotianLatvianLebaneseLiberianLithuanianLumbeeLuxembourgerMacedonianMalaysianMalteseMarshalleseMenomineeMexicanMexican American IndianMongolianMoroccanNative HawaiianNavajoNepaleseNew ZealanderNicaraguanNigerianNorthern EuropeanNorwegianOkinawanOsageOttawaPaiutePakistaniPalestinianPanamanianParaguayanPennsylvania GermanPeruvianPimaPolishPortuguesePotawatomiPuebloPuerto RicanPuget Sound SalishRomanianRussianSalvadoranSamoanScandinavianScotch-IrishScottishSeminoleSenegaleseSerbianShoshoneSierra LeoneanSiouxSlavicSlovakSloveneSomaliSouth AfricanSouth AmericanSouth American IndianSoviet UnionSpaniardSpanishSpanish AmericanSpanish American IndianSri LankanSubsaharan AfricanSudaneseSwedishSwissSyrianTaiwaneseThaiTlingit-HaidaTohono O'OdhamTonganTrinidadian and TobagonianTsimshianTurkishU.S. Virgin IslanderUgandanUkrainianUruguayanUteVenezuelanVietnameseWelshWest IndianYakamaYaquiYugoslavianYumanYup'ikZimbabwean
Immigration
NonimmigrantsImmigrantsAfghanistanAfricaAlbaniaArgentinaArmeniaAsiaAustraliaAustriaBahamasBangladeshBarbadosBelarusBelgiumBelizeBoliviaBosnia and HerzegovinaBrazilBulgariaBurma/MyanmarCabo VerdeCambodiaCameroonCanadaCaribbeanCentral AmericaChileChinaColombiaCongoCosta RicaCroatiaCubaCzechoslovakiaDenmarkDominicaDominican RepublicEastern AfricaEastern AsiaEastern EuropeEcuadorEgyptEl SalvadorEnglandEritreaEthiopiaEuropeFijiFranceGermanyGhanaGreeceGrenadaGuatemalaGuyanaHaitiHondurasHong KongHungaryIndiaIndonesiaIranIraqIrelandIsraelItalyJamaicaJapanJordanKazakhstanKenyaKoreaKuwaitLaosLatin AmericaLatviaLebanonLiberiaLithuaniaMexicoMicronesiaMiddle AfricaMoldovaMoroccoNepalNetherlandsNicaraguaNigeriaNorth AmericaNorth MacedoniaNorthern AfricaNorthern EuropeNorwayOceaniaPakistanPanamaPeruPhilippinesPolandPortugalRomaniaRussiaSaudi ArabiaScotlandSenegalSerbiaSierra LeoneSingaporeSomaliaSouth AfricaSouth AmericaSouth Central AsiaSouth Eastern AsiaSouthern EuropeSpainSri LankaSt. Vincent and the GrenadinesSudanSwedenSwitzerlandSyriaTaiwanThailandTrinidad and TobagoTurkeyUgandaUkraineUruguayUzbekistanVenezuelaVietnamWest IndiesWestern AfricaWestern AsiaWestern EuropeYemenZaireZimbabweAzores
Married-Couple Family Poverty
Income
Poverty
Unemployment
Labor Participation
Family Structure
Vehicle Availability
Education Level
Disability

Immigrants from Malaysia Married-Couple Family Poverty
Good

5.1%
POVERTY | MARRIED-COUPLE FAMILIES
62.2/ 100
METRIC RATING
165th/ 347
METRIC RANK

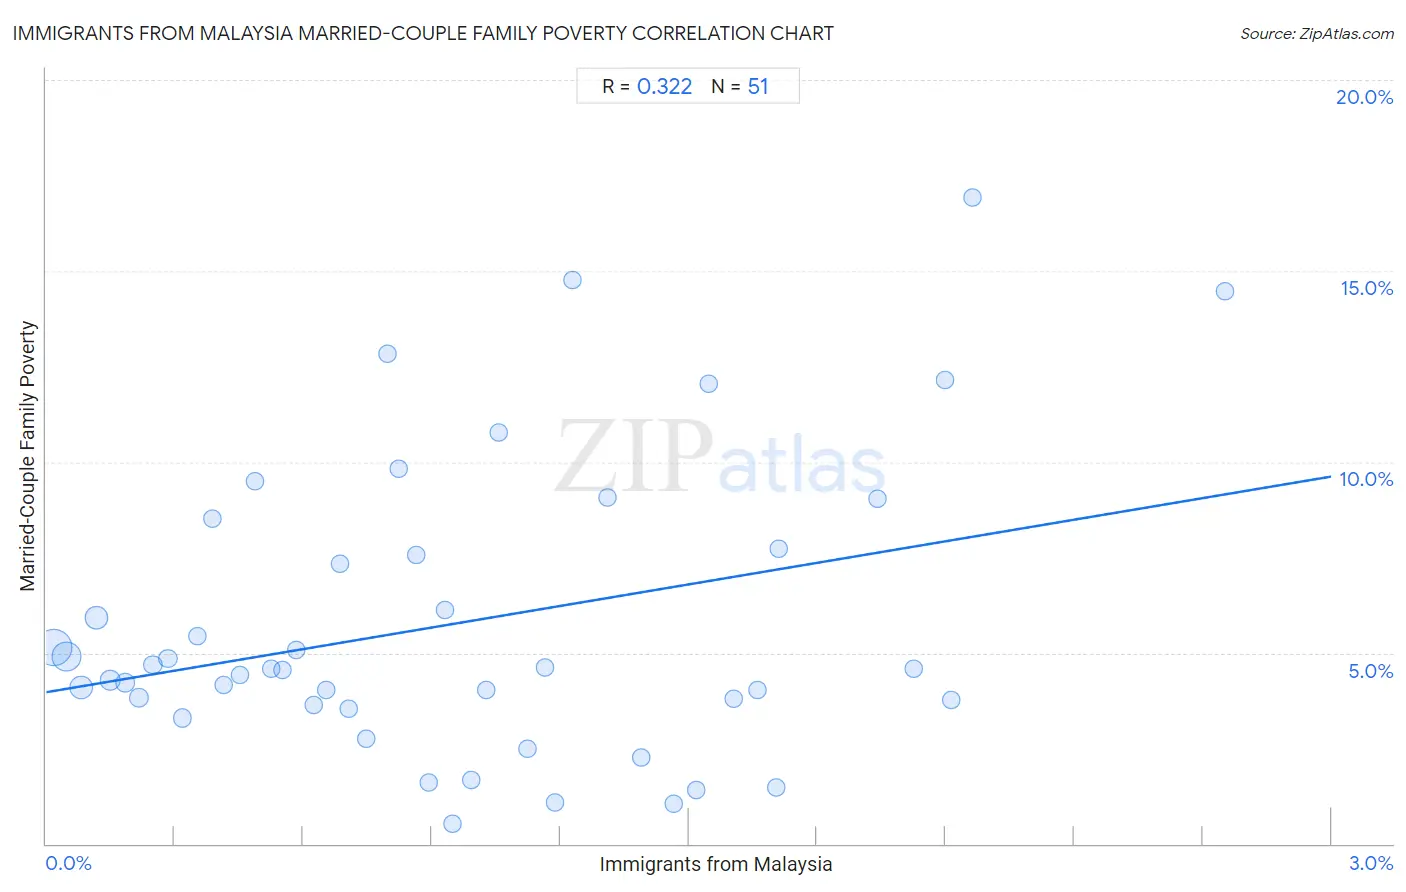
Immigrants from Malaysia Married-Couple Family Poverty Correlation Chart

The statistical analysis conducted on geographies consisting of 197,184,405 people shows a mild positive correlation between the proportion of Immigrants from Malaysia and poverty level among married-couple families in the United States with a correlation coefficient (R) of 0.322 and weighted average of 5.1%. On average, for every 1% (one percent) increase in Immigrants from Malaysia within a typical geography, there is an increase of 1.9% in poverty level among married-couple families.
Immigrants from Malaysia Married-Couple Family Poverty
It is essential to understand that the correlation between the percentage of Immigrants from Malaysia and poverty level among married-couple families does not imply a direct cause-and-effect relationship. It remains uncertain whether the presence of Immigrants from Malaysia influences an upward or downward trend in the level of poverty level among married-couple families within an area, or if Immigrants from Malaysia simply ended up residing in those areas with higher or lower levels of poverty level among married-couple families due to other factors.

Demographics Similar to Immigrants from Malaysia by Married-Couple Family Poverty

In terms of married-couple family poverty, the demographic groups most similar to Immigrants from Malaysia are Hawaiian (5.1%, a difference of 0.010%), Paraguayan (5.1%, a difference of 0.090%), Costa Rican (5.1%, a difference of 0.090%), Sierra Leonean (5.1%, a difference of 0.25%), and Immigrants from Jordan (5.1%, a difference of 0.56%).
DemographicsRating | RankMarried-Couple Family Poverty
Immigrants from South Eastern Asia
70.4
/100
|
#158
Good
5.1%
Immigrants from Saudi Arabia
70.3
/100
|
#159
Good
5.1%
Pennsylvania Germans
68.5
/100
|
#160
Good
5.1%
Ethiopians
68.1
/100
|
#161
Good
5.1%
Immigrants from Jordan
66.5
/100
|
#162
Good
5.1%
Sierra Leoneans
64.1
/100
|
#163
Good
5.1%
Hawaiians
62.3
/100
|
#164
Good
5.1%
Immigrants from Malaysia
62.2
/100
|
#165
Good
5.1%
Paraguayans
61.5
/100
|
#166
Good
5.1%
Costa Ricans
61.5
/100
|
#167
Good
5.1%
Immigrants from Uganda
54.9
/100
|
#168
Average
5.2%
Ottawa
54.5
/100
|
#169
Average
5.2%
Immigrants from Argentina
54.4
/100
|
#170
Average
5.2%
Bermudans
52.9
/100
|
#171
Average
5.2%
Immigrants from Northern Africa
51.3
/100
|
#172
Average
5.2%

Immigrants from Malaysia Married-Couple Family Poverty Correlation Summary

MeasurementImmigrants from Malaysia DataMarried-Couple Family Poverty Data
Minimum0.018%0.54%
Maximum2.8%16.9%
Range2.7%16.4%
Mean0.96%5.8%
Median0.86%4.6%
Interquartile 25% (IQ1)0.42%3.6%
Interquartile 75% (IQ3)1.5%7.7%
Interquartile Range (IQR)1.0%4.1%
Standard Deviation (Sample)0.66%3.8%
Standard Deviation (Population)0.65%3.8%

Correlation Details

Immigrants from Malaysia PercentileSample SizeMarried-Couple Family Poverty
[
0.0%
-
0.5%
]
0.018%
81,178,4875.2%
[
0.0%
-
0.5%
]
0.047%
46,487,3724.9%
[
0.0%
-
0.5%
]
0.081%
22,117,5744.1%
[
0.0%
-
0.5%
]
0.12%
19,952,1735.9%
[
0.0%
-
0.5%
]
0.15%
9,157,9284.3%
[
0.0%
-
0.5%
]
0.18%
3,753,5454.2%
[
0.0%
-
0.5%
]
0.22%
3,859,3613.8%
[
0.0%
-
0.5%
]
0.25%
2,258,9654.7%
[
0.0%
-
0.5%
]
0.28%
1,719,4454.8%
[
0.0%
-
0.5%
]
0.32%
1,014,0753.3%
[
0.0%
-
0.5%
]
0.35%
957,1075.4%
[
0.0%
-
0.5%
]
0.39%
880,4068.5%
[
0.0%
-
0.5%
]
0.42%
475,5754.2%
[
0.0%
-
0.5%
]
0.45%
419,5104.4%
[
0.0%
-
0.5%
]
0.49%
295,1049.5%
[
0.5%
-
1.0%
]
0.52%
260,1304.6%
[
0.5%
-
1.0%
]
0.55%
293,4164.6%
[
0.5%
-
1.0%
]
0.58%
230,3665.1%
[
0.5%
-
1.0%
]
0.62%
161,8853.6%
[
0.5%
-
1.0%
]
0.65%
256,0194.0%
[
0.5%
-
1.0%
]
0.69%
252,8207.3%
[
0.5%
-
1.0%
]
0.71%
148,4853.5%
[
0.5%
-
1.0%
]
0.75%
165,3022.8%
[
0.5%
-
1.0%
]
0.80%
144,03812.8%
[
0.5%
-
1.0%
]
0.82%
45,3179.8%
[
0.5%
-
1.0%
]
0.86%
146,0737.6%
[
0.5%
-
1.0%
]
0.89%
35,8361.6%
[
0.5%
-
1.0%
]
0.93%
66,7136.1%
[
0.5%
-
1.0%
]
0.95%
27,7090.54%
[
0.5%
-
1.0%
]
0.99%
22,1781.7%
[
1.0%
-
1.5%
]
1.03%
35,2664.0%
[
1.0%
-
1.5%
]
1.06%
7,01110.8%
[
1.0%
-
1.5%
]
1.12%
27,5762.5%
[
1.0%
-
1.5%
]
1.17%
21,8874.6%
[
1.0%
-
1.5%
]
1.19%
2,0221.1%
[
1.0%
-
1.5%
]
1.23%
101,51314.8%
[
1.0%
-
1.5%
]
1.31%
44,6559.1%
[
1.0%
-
1.5%
]
1.39%
5,9002.2%
[
1.0%
-
1.5%
]
1.46%
2,6631.1%
[
1.5%
-
2.0%
]
1.52%
6,5891.4%
[
1.5%
-
2.0%
]
1.55%
12,22312.1%
[
1.5%
-
2.0%
]
1.61%
8,8433.8%
[
1.5%
-
2.0%
]
1.66%
11,8054.0%
[
1.5%
-
2.0%
]
1.70%
5,9281.5%
[
1.5%
-
2.0%
]
1.71%
27,0107.7%
[
1.5%
-
2.0%
]
1.94%
5,5699.0%
[
2.0%
-
2.5%
]
2.02%
6,9164.6%
[
2.0%
-
2.5%
]
2.10%
42,62112.1%
[
2.0%
-
2.5%
]
2.11%
9,2823.8%
[
2.0%
-
2.5%
]
2.16%
15,66716.9%
[
2.5%
-
3.0%
]
2.75%
54514.5%