Immigrants from Malaysia 1 or more Vehicles in Household
COMPARE
Immigrants from Malaysia
Select to Compare
1 or more Vehicles in Household
Immigrants from Malaysia 1 or more Vehicles in Household
86.5%
1+ VEHICLES AVAILABLE
0.0/ 100
METRIC RATING
287th/ 347
METRIC RANK
Immigrants from Malaysia 1 or more Vehicles in Household Correlation Chart
The statistical analysis conducted on geographies consisting of 197,926,465 people shows a poor positive correlation between the proportion of Immigrants from Malaysia and percentage of households with 1 or more vehicles available in the United States with a correlation coefficient (R) of 0.180 and weighted average of 86.5%. On average, for every 1% (one percent) increase in Immigrants from Malaysia within a typical geography, there is an increase of 1.6% in percentage of households with 1 or more vehicles available.
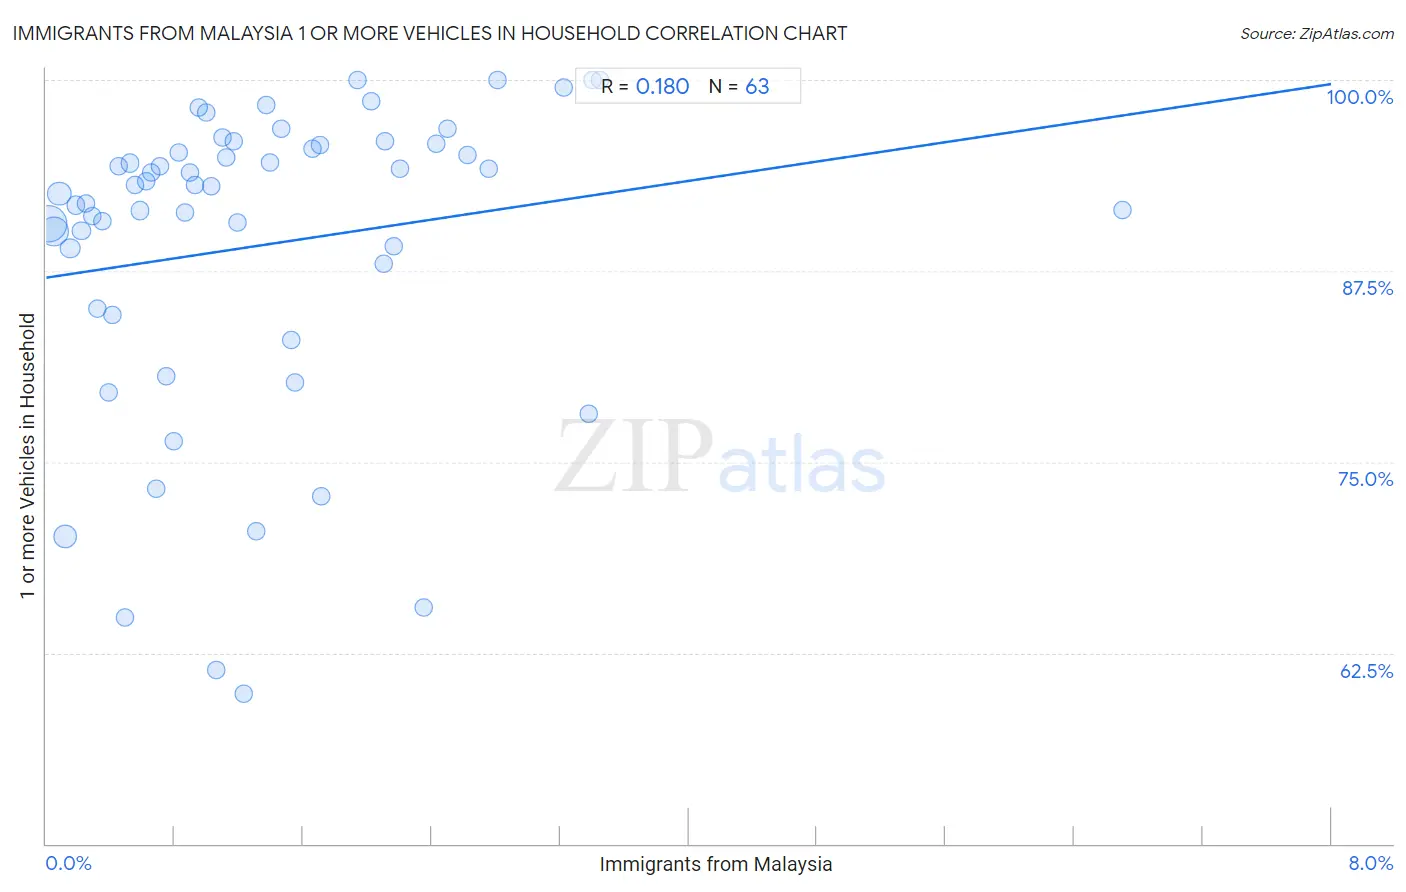
It is essential to understand that the correlation between the percentage of Immigrants from Malaysia and percentage of households with 1 or more vehicles available does not imply a direct cause-and-effect relationship. It remains uncertain whether the presence of Immigrants from Malaysia influences an upward or downward trend in the level of percentage of households with 1 or more vehicles available within an area, or if Immigrants from Malaysia simply ended up residing in those areas with higher or lower levels of percentage of households with 1 or more vehicles available due to other factors.
Demographics Similar to Immigrants from Malaysia by 1 or more Vehicles in Household
In terms of 1 or more vehicles in household, the demographic groups most similar to Immigrants from Malaysia are Hopi (86.4%, a difference of 0.070%), Immigrants from Eastern Asia (86.5%, a difference of 0.080%), Immigrants from Ireland (86.4%, a difference of 0.090%), Immigrants from Kazakhstan (86.6%, a difference of 0.11%), and Immigrants from Australia (86.4%, a difference of 0.13%).
| Demographics | Rating | Rank | 1 or more Vehicles in Household |
| Immigrants from Croatia | 0.0 /100 | #280 | Tragic 87.0% |
| Mongolians | 0.0 /100 | #281 | Tragic 87.0% |
| Colville | 0.0 /100 | #282 | Tragic 86.8% |
| Immigrants from Eastern Europe | 0.0 /100 | #283 | Tragic 86.7% |
| Central American Indians | 0.0 /100 | #284 | Tragic 86.7% |
| Immigrants from Kazakhstan | 0.0 /100 | #285 | Tragic 86.6% |
| Immigrants from Eastern Asia | 0.0 /100 | #286 | Tragic 86.5% |
| Immigrants from Malaysia | 0.0 /100 | #287 | Tragic 86.5% |
| Hopi | 0.0 /100 | #288 | Tragic 86.4% |
| Immigrants from Ireland | 0.0 /100 | #289 | Tragic 86.4% |
| Immigrants from Australia | 0.0 /100 | #290 | Tragic 86.4% |
| Pima | 0.0 /100 | #291 | Tragic 86.3% |
| Okinawans | 0.0 /100 | #292 | Tragic 86.1% |
| Indians (Asian) | 0.0 /100 | #293 | Tragic 86.0% |
| Alaskan Athabascans | 0.0 /100 | #294 | Tragic 86.0% |
Immigrants from Malaysia 1 or more Vehicles in Household Correlation Summary
| Measurement | Immigrants from Malaysia Data | 1 or more Vehicles in Household Data |
| Minimum | 0.018% | 59.8% |
| Maximum | 6.7% | 100.0% |
| Range | 6.7% | 40.2% |
| Mean | 1.3% | 89.2% |
| Median | 1.1% | 93.0% |
| Interquartile 25% (IQ1) | 0.52% | 85.0% |
| Interquartile 75% (IQ3) | 2.0% | 95.7% |
| Interquartile Range (IQR) | 1.5% | 10.7% |
| Standard Deviation (Sample) | 1.2% | 10.1% |
| Standard Deviation (Population) | 1.1% | 10.0% |
Correlation Details
| Immigrants from Malaysia Percentile | Sample Size | 1 or more Vehicles in Household |
[ 0.0% - 0.5% ] 0.018% | 81,194,885 | 90.6% |
[ 0.0% - 0.5% ] 0.047% | 46,605,365 | 90.1% |
[ 0.0% - 0.5% ] 0.081% | 22,243,381 | 92.5% |
[ 0.0% - 0.5% ] 0.12% | 20,003,998 | 70.1% |
[ 0.0% - 0.5% ] 0.15% | 9,241,551 | 89.0% |
[ 0.0% - 0.5% ] 0.18% | 3,796,210 | 91.8% |
[ 0.0% - 0.5% ] 0.22% | 3,909,570 | 90.1% |
[ 0.0% - 0.5% ] 0.25% | 2,293,529 | 91.9% |
[ 0.0% - 0.5% ] 0.28% | 1,747,185 | 91.1% |
[ 0.0% - 0.5% ] 0.32% | 1,037,223 | 85.0% |
[ 0.0% - 0.5% ] 0.35% | 974,555 | 90.8% |
[ 0.0% - 0.5% ] 0.39% | 902,530 | 79.6% |
[ 0.0% - 0.5% ] 0.42% | 481,159 | 84.6% |
[ 0.0% - 0.5% ] 0.45% | 467,218 | 94.3% |
[ 0.0% - 0.5% ] 0.49% | 296,741 | 64.8% |
[ 0.5% - 1.0% ] 0.52% | 262,376 | 94.6% |
[ 0.5% - 1.0% ] 0.55% | 298,715 | 93.1% |
[ 0.5% - 1.0% ] 0.58% | 232,451 | 91.4% |
[ 0.5% - 1.0% ] 0.62% | 170,599 | 93.4% |
[ 0.5% - 1.0% ] 0.65% | 264,999 | 93.9% |
[ 0.5% - 1.0% ] 0.69% | 252,820 | 73.3% |
[ 0.5% - 1.0% ] 0.71% | 150,698 | 94.4% |
[ 0.5% - 1.0% ] 0.75% | 167,532 | 80.6% |
[ 0.5% - 1.0% ] 0.80% | 144,038 | 76.4% |
[ 0.5% - 1.0% ] 0.82% | 45,317 | 95.2% |
[ 0.5% - 1.0% ] 0.86% | 146,073 | 91.3% |
[ 0.5% - 1.0% ] 0.89% | 35,836 | 94.0% |
[ 0.5% - 1.0% ] 0.93% | 82,653 | 93.1% |
[ 0.5% - 1.0% ] 0.95% | 28,641 | 98.2% |
[ 0.5% - 1.0% ] 0.99% | 26,662 | 97.9% |
[ 1.0% - 1.5% ] 1.03% | 35,266 | 93.0% |
[ 1.0% - 1.5% ] 1.06% | 7,011 | 61.4% |
[ 1.0% - 1.5% ] 1.10% | 638 | 96.2% |
[ 1.0% - 1.5% ] 1.12% | 27,843 | 94.9% |
[ 1.0% - 1.5% ] 1.17% | 21,887 | 96.0% |
[ 1.0% - 1.5% ] 1.19% | 2,696 | 90.7% |
[ 1.0% - 1.5% ] 1.23% | 106,526 | 59.8% |
[ 1.0% - 1.5% ] 1.31% | 44,655 | 70.4% |
[ 1.0% - 1.5% ] 1.37% | 9,512 | 98.4% |
[ 1.0% - 1.5% ] 1.39% | 6,400 | 94.6% |
[ 1.0% - 1.5% ] 1.46% | 4,168 | 96.8% |
[ 1.5% - 2.0% ] 1.52% | 9,841 | 82.9% |
[ 1.5% - 2.0% ] 1.55% | 12,223 | 80.2% |
[ 1.5% - 2.0% ] 1.66% | 11,805 | 95.5% |
[ 1.5% - 2.0% ] 1.70% | 5,928 | 95.7% |
[ 1.5% - 2.0% ] 1.71% | 27,010 | 72.8% |
[ 1.5% - 2.0% ] 1.94% | 5,569 | 100.0% |
[ 2.0% - 2.5% ] 2.02% | 6,916 | 98.6% |
[ 2.0% - 2.5% ] 2.10% | 42,621 | 88.0% |
[ 2.0% - 2.5% ] 2.11% | 9,282 | 96.0% |
[ 2.0% - 2.5% ] 2.16% | 15,667 | 89.1% |
[ 2.0% - 2.5% ] 2.20% | 681 | 94.2% |
[ 2.0% - 2.5% ] 2.35% | 170 | 65.5% |
[ 2.0% - 2.5% ] 2.42% | 1,031 | 95.8% |
[ 2.0% - 2.5% ] 2.50% | 1,200 | 96.8% |
[ 2.5% - 3.0% ] 2.62% | 1,562 | 95.1% |
[ 2.5% - 3.0% ] 2.75% | 545 | 94.2% |
[ 2.5% - 3.0% ] 2.81% | 498 | 100.0% |
[ 3.0% - 3.5% ] 3.22% | 621 | 99.5% |
[ 3.0% - 3.5% ] 3.38% | 296 | 78.1% |
[ 3.0% - 3.5% ] 3.40% | 235 | 100.0% |
[ 3.0% - 3.5% ] 3.45% | 145 | 100.0% |
[ 6.5% - 7.0% ] 6.70% | 1,507 | 91.5% |