Immigrants from France Self-Care Disability
COMPARE
Immigrants from France
Select to Compare
Self-Care Disability
Immigrants from France Self-Care Disability
2.3%
SELF-CARE DISABILITY
99.6/ 100
METRIC RATING
55th/ 347
METRIC RANK
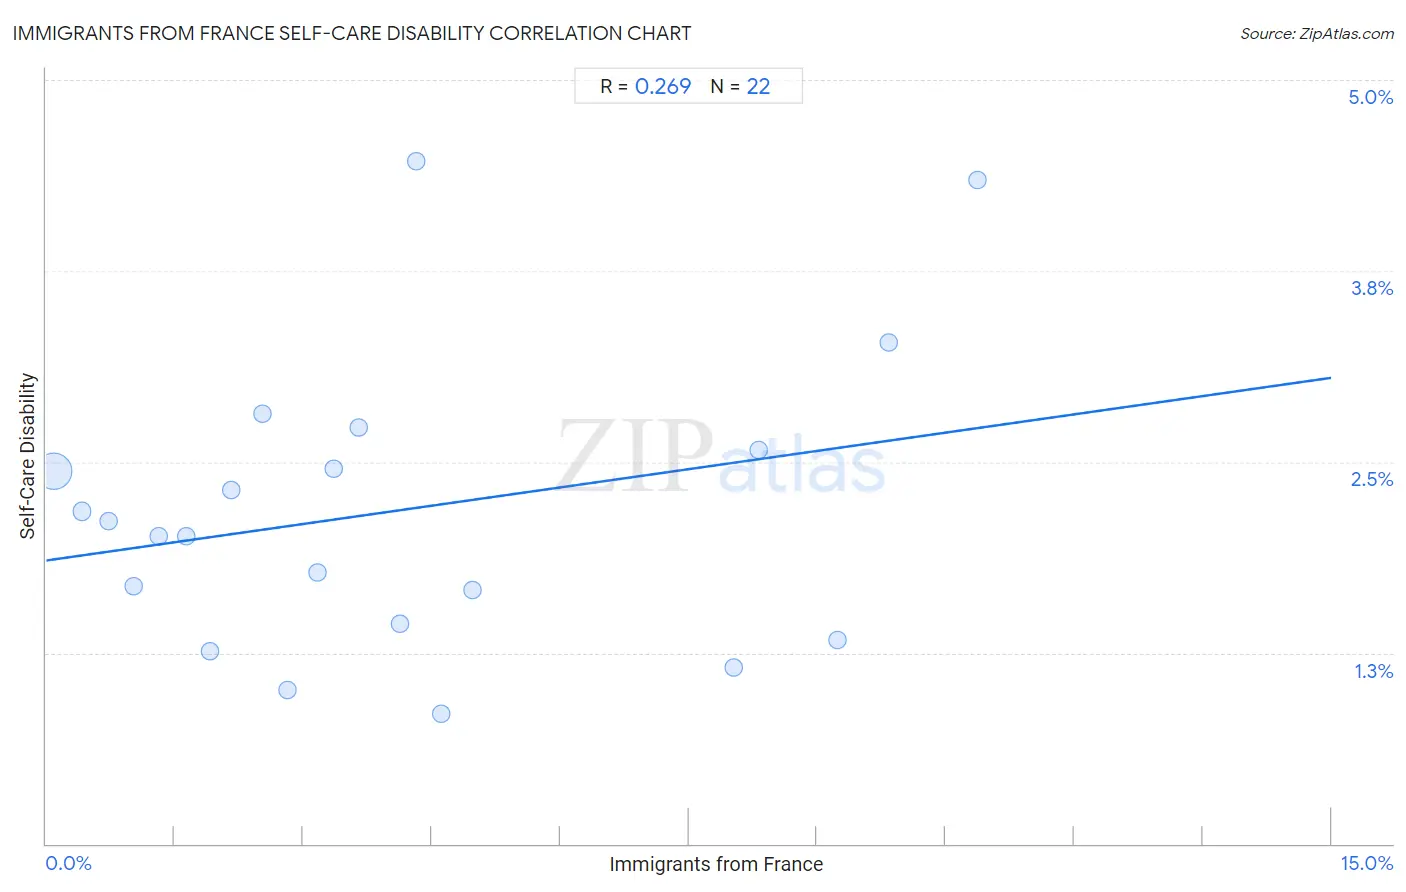
Immigrants from France Self-Care Disability Correlation Chart
The statistical analysis conducted on geographies consisting of 287,704,144 people shows a weak positive correlation between the proportion of Immigrants from France and percentage of population with self-care disability in the United States with a correlation coefficient (R) of 0.269 and weighted average of 2.3%. On average, for every 1% (one percent) increase in Immigrants from France within a typical geography, there is an increase of 0.080% in percentage of population with self-care disability.
It is essential to understand that the correlation between the percentage of Immigrants from France and percentage of population with self-care disability does not imply a direct cause-and-effect relationship. It remains uncertain whether the presence of Immigrants from France influences an upward or downward trend in the level of percentage of population with self-care disability within an area, or if Immigrants from France simply ended up residing in those areas with higher or lower levels of percentage of population with self-care disability due to other factors.
Demographics Similar to Immigrants from France by Self-Care Disability
In terms of self-care disability, the demographic groups most similar to Immigrants from France are Immigrants from Eastern Asia (2.3%, a difference of 0.040%), Immigrants from Belgium (2.3%, a difference of 0.040%), Argentinean (2.3%, a difference of 0.060%), Australian (2.3%, a difference of 0.11%), and Immigrants from Cameroon (2.3%, a difference of 0.12%).
| Demographics | Rating | Rank | Self-Care Disability |
| Immigrants from Malaysia | 99.7 /100 | #48 | Exceptional 2.3% |
| Latvians | 99.7 /100 | #49 | Exceptional 2.3% |
| Immigrants from Brazil | 99.7 /100 | #50 | Exceptional 2.3% |
| Kenyans | 99.7 /100 | #51 | Exceptional 2.3% |
| Immigrants from Serbia | 99.6 /100 | #52 | Exceptional 2.3% |
| Australians | 99.6 /100 | #53 | Exceptional 2.3% |
| Argentineans | 99.6 /100 | #54 | Exceptional 2.3% |
| Immigrants from France | 99.6 /100 | #55 | Exceptional 2.3% |
| Immigrants from Eastern Asia | 99.6 /100 | #56 | Exceptional 2.3% |
| Immigrants from Belgium | 99.6 /100 | #57 | Exceptional 2.3% |
| Immigrants from Cameroon | 99.6 /100 | #58 | Exceptional 2.3% |
| New Zealanders | 99.5 /100 | #59 | Exceptional 2.3% |
| Immigrants from Japan | 99.5 /100 | #60 | Exceptional 2.3% |
| Palestinians | 99.4 /100 | #61 | Exceptional 2.3% |
| Egyptians | 99.4 /100 | #62 | Exceptional 2.3% |
Immigrants from France Self-Care Disability Correlation Summary
| Measurement | Immigrants from France Data | Self-Care Disability Data |
| Minimum | 0.082% | 0.85% |
| Maximum | 10.9% | 4.5% |
| Range | 10.8% | 3.6% |
| Mean | 4.0% | 2.2% |
| Median | 3.3% | 2.1% |
| Interquartile 25% (IQ1) | 1.6% | 1.4% |
| Interquartile 75% (IQ3) | 5.0% | 2.6% |
| Interquartile Range (IQR) | 3.3% | 1.1% |
| Standard Deviation (Sample) | 3.2% | 0.96% |
| Standard Deviation (Population) | 3.1% | 0.93% |
Correlation Details
| Immigrants from France Percentile | Sample Size | Self-Care Disability |
[ 0.0% - 0.5% ] 0.082% | 266,592,650 | 2.4% |
[ 0.0% - 0.5% ] 0.42% | 14,546,980 | 2.2% |
[ 0.5% - 1.0% ] 0.72% | 3,837,669 | 2.1% |
[ 1.0% - 1.5% ] 1.02% | 1,359,039 | 1.7% |
[ 1.0% - 1.5% ] 1.32% | 820,861 | 2.0% |
[ 1.5% - 2.0% ] 1.63% | 354,127 | 2.0% |
[ 1.5% - 2.0% ] 1.92% | 76,398 | 1.3% |
[ 2.0% - 2.5% ] 2.16% | 24,383 | 2.3% |
[ 2.5% - 3.0% ] 2.52% | 13,088 | 2.8% |
[ 2.5% - 3.0% ] 2.82% | 29,702 | 1.0% |
[ 3.0% - 3.5% ] 3.16% | 16,246 | 1.8% |
[ 3.0% - 3.5% ] 3.36% | 5,603 | 2.5% |
[ 3.5% - 4.0% ] 3.64% | 9,386 | 2.7% |
[ 4.0% - 4.5% ] 4.13% | 3,248 | 1.4% |
[ 4.0% - 4.5% ] 4.32% | 880 | 4.5% |
[ 4.5% - 5.0% ] 4.62% | 1,451 | 0.85% |
[ 4.5% - 5.0% ] 4.97% | 8,526 | 1.7% |
[ 8.0% - 8.5% ] 8.02% | 1,159 | 1.2% |
[ 8.0% - 8.5% ] 8.31% | 1,588 | 2.6% |
[ 9.0% - 9.5% ] 9.24% | 1,007 | 1.3% |
[ 9.5% - 10.0% ] 9.84% | 61 | 3.3% |
[ 10.5% - 11.0% ] 10.87% | 92 | 4.3% |