Immigrants from France 3 or more Vehicles in Household

COMPARE

Immigrants from France
Race
Ancestry
AfghanAfricanAlaska NativeAlaskan AthabascanAlbanianAleutAlsatianAmericanApacheArabArapahoArgentineanArmenianAssyrian/Chaldean/SyriacAustralianAustrianBahamianBangladeshiBarbadianBasqueBelgianBelizeanBermudanBhutaneseBlackfeetBolivianBrazilianBritishBritish West IndianBulgarianBurmeseCajunCambodianCanadianCape VerdeanCarpatho RusynCelticCentral AmericanCentral American IndianCherokeeCheyenneChickasawChileanChineseChippewaChoctawColombianColvilleComancheCosta RicanCreeCreekCroatianCrowCubanCypriotCzechCzechoslovakianDanishDelawareDominicanDutchDutch West IndianEastern EuropeanEcuadorianEgyptianEnglishEstonianEthiopianEuropeanFijianFilipinoFinnishFrenchFrench American IndianFrench CanadianGermanGerman RussianGhanaianGreekGuamanian/ChamorroGuatemalanGuyaneseHaitianHmongHonduranHopiHoumaHungarianIcelanderIndian (Asian)IndonesianInupiatIranianIraqiIrishIroquoisIsraeliItalianJamaicanJapaneseJordanianKenyanKiowaKoreanLaotianLatvianLebaneseLiberianLithuanianLumbeeLuxembourgerMacedonianMalaysianMalteseMarshalleseMenomineeMexicanMexican American IndianMongolianMoroccanNative HawaiianNavajoNepaleseNew ZealanderNicaraguanNigerianNorthern EuropeanNorwegianOkinawanOsageOttawaPaiutePakistaniPalestinianPanamanianParaguayanPennsylvania GermanPeruvianPimaPolishPortuguesePotawatomiPuebloPuerto RicanPuget Sound SalishRomanianRussianSalvadoranSamoanScandinavianScotch-IrishScottishSeminoleSenegaleseSerbianShoshoneSierra LeoneanSiouxSlavicSlovakSloveneSomaliSouth AfricanSouth AmericanSouth American IndianSoviet UnionSpaniardSpanishSpanish AmericanSpanish American IndianSri LankanSubsaharan AfricanSudaneseSwedishSwissSyrianTaiwaneseThaiTlingit-HaidaTohono O'OdhamTonganTrinidadian and TobagonianTsimshianTurkishU.S. Virgin IslanderUgandanUkrainianUruguayanUteVenezuelanVietnameseWelshWest IndianYakamaYaquiYugoslavianYumanYup'ikZimbabwean
Immigration
NonimmigrantsImmigrantsAfghanistanAfricaAlbaniaArgentinaArmeniaAsiaAustraliaAustriaBahamasBangladeshBarbadosBelarusBelgiumBelizeBoliviaBosnia and HerzegovinaBrazilBulgariaBurma/MyanmarCabo VerdeCambodiaCameroonCanadaCaribbeanCentral AmericaChileChinaColombiaCongoCosta RicaCroatiaCubaCzechoslovakiaDenmarkDominicaDominican RepublicEastern AfricaEastern AsiaEastern EuropeEcuadorEgyptEl SalvadorEnglandEritreaEthiopiaEuropeFijiFranceGermanyGhanaGreeceGrenadaGuatemalaGuyanaHaitiHondurasHong KongHungaryIndiaIndonesiaIranIraqIrelandIsraelItalyJamaicaJapanJordanKazakhstanKenyaKoreaKuwaitLaosLatin AmericaLatviaLebanonLiberiaLithuaniaMalaysiaMexicoMicronesiaMiddle AfricaMoldovaMoroccoNepalNetherlandsNicaraguaNigeriaNorth AmericaNorth MacedoniaNorthern AfricaNorthern EuropeNorwayOceaniaPakistanPanamaPeruPhilippinesPolandPortugalRomaniaRussiaSaudi ArabiaScotlandSenegalSerbiaSierra LeoneSingaporeSomaliaSouth AfricaSouth AmericaSouth Central AsiaSouth Eastern AsiaSouthern EuropeSpainSri LankaSt. Vincent and the GrenadinesSudanSwedenSwitzerlandSyriaTaiwanThailandTrinidad and TobagoTurkeyUgandaUkraineUruguayUzbekistanVenezuelaVietnamWest IndiesWestern AfricaWestern AsiaWestern EuropeYemenZaireZimbabweAzores
Select to Compare
Race
Ancestry
AfghanAfricanAlaska NativeAlaskan AthabascanAlbanianAleutAlsatianAmericanApacheArabArapahoArgentineanArmenianAssyrian/Chaldean/SyriacAustralianAustrianBahamianBangladeshiBarbadianBasqueBelgianBelizeanBermudanBhutaneseBlackfeetBolivianBrazilianBritishBritish West IndianBulgarianBurmeseCajunCambodianCanadianCape VerdeanCarpatho RusynCelticCentral AmericanCentral American IndianCherokeeCheyenneChickasawChileanChineseChippewaChoctawColombianColvilleComancheCosta RicanCreeCreekCroatianCrowCubanCypriotCzechCzechoslovakianDanishDelawareDominicanDutchDutch West IndianEastern EuropeanEcuadorianEgyptianEnglishEstonianEthiopianEuropeanFijianFilipinoFinnishFrenchFrench American IndianFrench CanadianGermanGerman RussianGhanaianGreekGuamanian/ChamorroGuatemalanGuyaneseHaitianHmongHonduranHopiHoumaHungarianIcelanderIndian (Asian)IndonesianInupiatIranianIraqiIrishIroquoisIsraeliItalianJamaicanJapaneseJordanianKenyanKiowaKoreanLaotianLatvianLebaneseLiberianLithuanianLumbeeLuxembourgerMacedonianMalaysianMalteseMarshalleseMenomineeMexicanMexican American IndianMongolianMoroccanNative HawaiianNavajoNepaleseNew ZealanderNicaraguanNigerianNorthern EuropeanNorwegianOkinawanOsageOttawaPaiutePakistaniPalestinianPanamanianParaguayanPennsylvania GermanPeruvianPimaPolishPortuguesePotawatomiPuebloPuerto RicanPuget Sound SalishRomanianRussianSalvadoranSamoanScandinavianScotch-IrishScottishSeminoleSenegaleseSerbianShoshoneSierra LeoneanSiouxSlavicSlovakSloveneSomaliSouth AfricanSouth AmericanSouth American IndianSoviet UnionSpaniardSpanishSpanish AmericanSpanish American IndianSri LankanSubsaharan AfricanSudaneseSwedishSwissSyrianTaiwaneseThaiTlingit-HaidaTohono O'OdhamTonganTrinidadian and TobagonianTsimshianTurkishU.S. Virgin IslanderUgandanUkrainianUruguayanUteVenezuelanVietnameseWelshWest IndianYakamaYaquiYugoslavianYumanYup'ikZimbabwean
Immigration
NonimmigrantsImmigrantsAfghanistanAfricaAlbaniaArgentinaArmeniaAsiaAustraliaAustriaBahamasBangladeshBarbadosBelarusBelgiumBelizeBoliviaBosnia and HerzegovinaBrazilBulgariaBurma/MyanmarCabo VerdeCambodiaCameroonCanadaCaribbeanCentral AmericaChileChinaColombiaCongoCosta RicaCroatiaCubaCzechoslovakiaDenmarkDominicaDominican RepublicEastern AfricaEastern AsiaEastern EuropeEcuadorEgyptEl SalvadorEnglandEritreaEthiopiaEuropeFijiGermanyGhanaGreeceGrenadaGuatemalaGuyanaHaitiHondurasHong KongHungaryIndiaIndonesiaIranIraqIrelandIsraelItalyJamaicaJapanJordanKazakhstanKenyaKoreaKuwaitLaosLatin AmericaLatviaLebanonLiberiaLithuaniaMalaysiaMexicoMicronesiaMiddle AfricaMoldovaMoroccoNepalNetherlandsNicaraguaNigeriaNorth AmericaNorth MacedoniaNorthern AfricaNorthern EuropeNorwayOceaniaPakistanPanamaPeruPhilippinesPolandPortugalRomaniaRussiaSaudi ArabiaScotlandSenegalSerbiaSierra LeoneSingaporeSomaliaSouth AfricaSouth AmericaSouth Central AsiaSouth Eastern AsiaSouthern EuropeSpainSri LankaSt. Vincent and the GrenadinesSudanSwedenSwitzerlandSyriaTaiwanThailandTrinidad and TobagoTurkeyUgandaUkraineUruguayUzbekistanVenezuelaVietnamWest IndiesWestern AfricaWestern AsiaWestern EuropeYemenZaireZimbabweAzores
3 or more Vehicles in Household
Income
Poverty
Unemployment
Labor Participation
Family Structure
Vehicle Availability
Education Level
Disability

Immigrants from France 3 or more Vehicles in Household
Tragic

17.6%
3+ VEHICLES AVAILABLE
0.6/ 100
METRIC RATING
269th/ 347
METRIC RANK

Immigrants from France 3 or more Vehicles in Household Correlation Chart

The statistical analysis conducted on geographies consisting of 287,763,737 people shows a substantial positive correlation between the proportion of Immigrants from France and percentage of households with 3 or more vehicles available in the United States with a correlation coefficient (R) of 0.575 and weighted average of 17.6%. On average, for every 1% (one percent) increase in Immigrants from France within a typical geography, there is an increase of 1.6% in percentage of households with 3 or more vehicles available.
Immigrants from France 3 or more Vehicles in Household
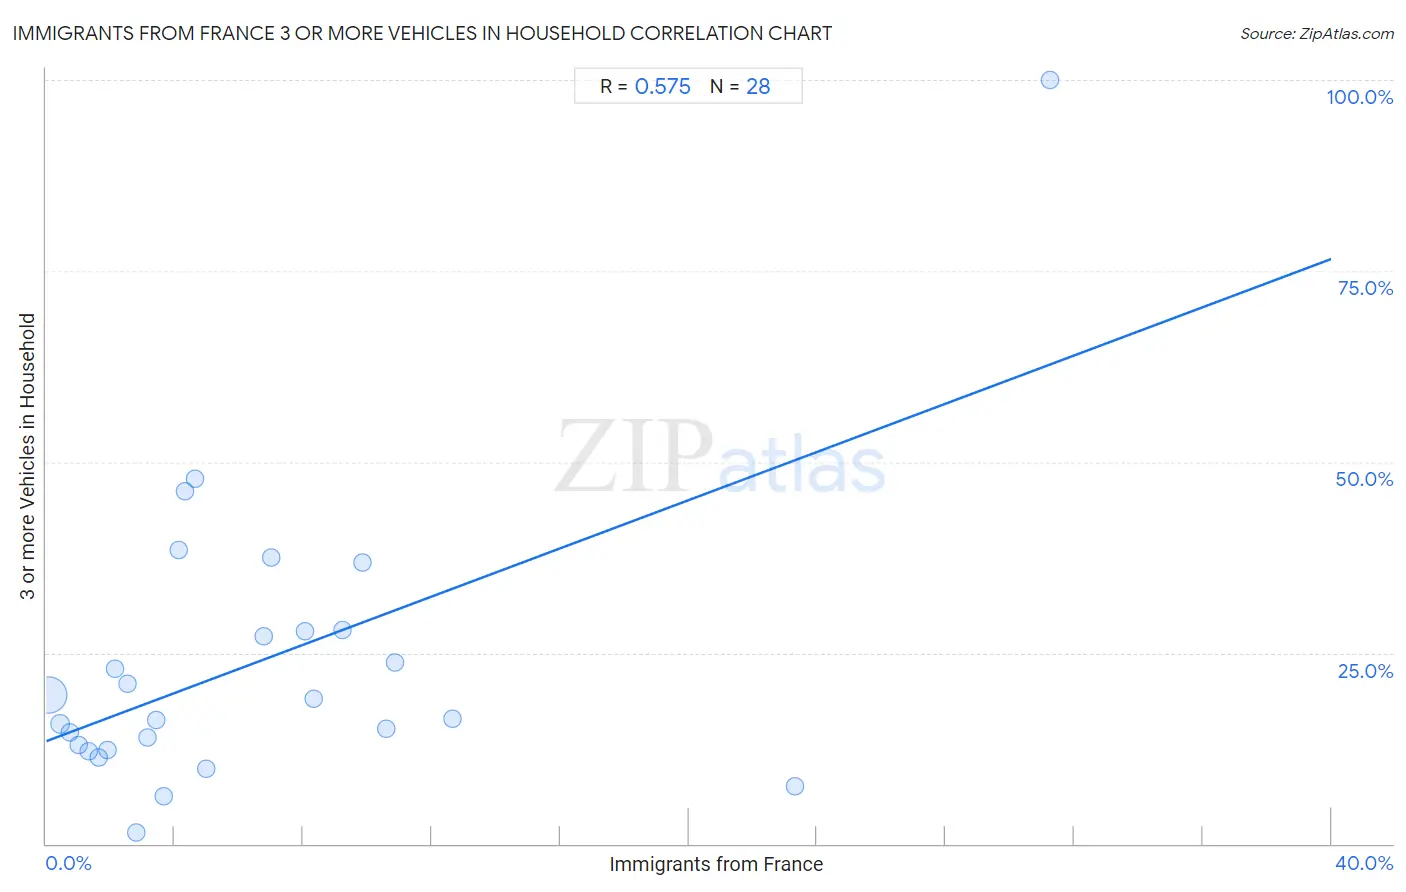
It is essential to understand that the correlation between the percentage of Immigrants from France and percentage of households with 3 or more vehicles available does not imply a direct cause-and-effect relationship. It remains uncertain whether the presence of Immigrants from France influences an upward or downward trend in the level of percentage of households with 3 or more vehicles available within an area, or if Immigrants from France simply ended up residing in those areas with higher or lower levels of percentage of households with 3 or more vehicles available due to other factors.

Demographics Similar to Immigrants from France by 3 or more Vehicles in Household

In terms of 3 or more vehicles in household, the demographic groups most similar to Immigrants from France are Immigrants from Nepal (17.6%, a difference of 0.050%), South American (17.6%, a difference of 0.050%), Immigrants from Bulgaria (17.7%, a difference of 0.42%), Immigrants from Venezuela (17.7%, a difference of 0.44%), and Immigrants from Africa (17.6%, a difference of 0.46%).
DemographicsRating | Rank3 or more Vehicles in Household
Colombians
0.9
/100
|
#262
Tragic
17.8%
Bermudans
0.9
/100
|
#263
Tragic
17.8%
Cambodians
0.9
/100
|
#264
Tragic
17.8%
Immigrants from Panama
0.8
/100
|
#265
Tragic
17.7%
Macedonians
0.8
/100
|
#266
Tragic
17.7%
Immigrants from Venezuela
0.8
/100
|
#267
Tragic
17.7%
Immigrants from Bulgaria
0.8
/100
|
#268
Tragic
17.7%
Immigrants from France
0.6
/100
|
#269
Tragic
17.6%
Immigrants from Nepal
0.6
/100
|
#270
Tragic
17.6%
South Americans
0.6
/100
|
#271
Tragic
17.6%
Immigrants from Africa
0.5
/100
|
#272
Tragic
17.6%
Immigrants from Sudan
0.5
/100
|
#273
Tragic
17.6%
Immigrants from Bosnia and Herzegovina
0.5
/100
|
#274
Tragic
17.5%
Immigrants from Ukraine
0.4
/100
|
#275
Tragic
17.5%
Okinawans
0.4
/100
|
#276
Tragic
17.4%

Immigrants from France 3 or more Vehicles in Household Correlation Summary

MeasurementImmigrants from France Data3 or more Vehicles in Household Data
Minimum0.082%1.5%
Maximum31.2%100.0%
Range31.2%98.5%
Mean6.5%23.6%
Median4.2%17.7%
Interquartile 25% (IQ1)2.0%12.6%
Interquartile 75% (IQ3)8.8%27.9%
Interquartile Range (IQR)6.7%15.4%
Standard Deviation (Sample)6.9%19.1%
Standard Deviation (Population)6.8%18.7%

Correlation Details

Immigrants from France PercentileSample Size3 or more Vehicles in Household
[
0.0%
-
0.5%
]
0.082%
266,640,80519.4%
[
0.0%
-
0.5%
]
0.42%
14,545,70215.6%
[
0.5%
-
1.0%
]
0.72%
3,845,21714.5%
[
1.0%
-
1.5%
]
1.02%
1,367,94212.9%
[
1.0%
-
1.5%
]
1.32%
818,88212.1%
[
1.5%
-
2.0%
]
1.64%
338,41711.3%
[
1.5%
-
2.0%
]
1.92%
83,14012.3%
[
2.0%
-
2.5%
]
2.16%
24,84222.9%
[
2.5%
-
3.0%
]
2.52%
13,93421.0%
[
2.5%
-
3.0%
]
2.82%
27,9881.5%
[
3.0%
-
3.5%
]
3.16%
16,24614.0%
[
3.0%
-
3.5%
]
3.44%
11,75516.2%
[
3.5%
-
4.0%
]
3.64%
9,3866.2%
[
4.0%
-
4.5%
]
4.13%
3,24838.5%
[
4.0%
-
4.5%
]
4.32%
88046.1%
[
4.5%
-
5.0%
]
4.62%
1,45147.8%
[
4.5%
-
5.0%
]
4.97%
8,5269.8%
[
6.5%
-
7.0%
]
6.76%
22227.1%
[
7.0%
-
7.5%
]
7.00%
10037.5%
[
8.0%
-
8.5%
]
8.04%
1,48127.9%
[
8.0%
-
8.5%
]
8.31%
1,58819.0%
[
9.0%
-
9.5%
]
9.23%
1,10528.0%
[
9.5%
-
10.0%
]
9.84%
6136.8%
[
10.5%
-
11.0%
]
10.60%
21715.0%
[
10.5%
-
11.0%
]
10.87%
9223.7%
[
12.5%
-
13.0%
]
12.63%
9516.3%
[
23.0%
-
23.5%
]
23.31%
3997.5%
[
31.0%
-
31.5%
]
31.25%
16100.0%