Immigrants from Dominica Married-Couple Family Poverty

COMPARE

Immigrants from Dominica
Race
Ancestry
AfghanAfricanAlaska NativeAlaskan AthabascanAlbanianAleutAlsatianAmericanApacheArabArapahoArgentineanArmenianAssyrian/Chaldean/SyriacAustralianAustrianBahamianBangladeshiBarbadianBasqueBelgianBelizeanBermudanBhutaneseBlackfeetBolivianBrazilianBritishBritish West IndianBulgarianBurmeseCajunCambodianCanadianCape VerdeanCarpatho RusynCelticCentral AmericanCentral American IndianCherokeeCheyenneChickasawChileanChineseChippewaChoctawColombianColvilleComancheCosta RicanCreeCreekCroatianCrowCubanCypriotCzechCzechoslovakianDanishDelawareDominicanDutchDutch West IndianEastern EuropeanEcuadorianEgyptianEnglishEstonianEthiopianEuropeanFijianFilipinoFinnishFrenchFrench American IndianFrench CanadianGermanGerman RussianGhanaianGreekGuamanian/ChamorroGuatemalanGuyaneseHaitianHmongHonduranHopiHoumaHungarianIcelanderIndian (Asian)IndonesianInupiatIranianIraqiIrishIroquoisIsraeliItalianJamaicanJapaneseJordanianKenyanKiowaKoreanLaotianLatvianLebaneseLiberianLithuanianLumbeeLuxembourgerMacedonianMalaysianMalteseMarshalleseMenomineeMexicanMexican American IndianMongolianMoroccanNative HawaiianNavajoNepaleseNew ZealanderNicaraguanNigerianNorthern EuropeanNorwegianOkinawanOsageOttawaPaiutePakistaniPalestinianPanamanianParaguayanPennsylvania GermanPeruvianPimaPolishPortuguesePotawatomiPuebloPuerto RicanPuget Sound SalishRomanianRussianSalvadoranSamoanScandinavianScotch-IrishScottishSeminoleSenegaleseSerbianShoshoneSierra LeoneanSiouxSlavicSlovakSloveneSomaliSouth AfricanSouth AmericanSouth American IndianSoviet UnionSpaniardSpanishSpanish AmericanSpanish American IndianSri LankanSubsaharan AfricanSudaneseSwedishSwissSyrianTaiwaneseThaiTlingit-HaidaTohono O'OdhamTonganTrinidadian and TobagonianTsimshianTurkishU.S. Virgin IslanderUgandanUkrainianUruguayanUteVenezuelanVietnameseWelshWest IndianYakamaYaquiYugoslavianYumanYup'ikZimbabwean
Immigration
NonimmigrantsImmigrantsAfghanistanAfricaAlbaniaArgentinaArmeniaAsiaAustraliaAustriaBahamasBangladeshBarbadosBelarusBelgiumBelizeBoliviaBosnia and HerzegovinaBrazilBulgariaBurma/MyanmarCabo VerdeCambodiaCameroonCanadaCaribbeanCentral AmericaChileChinaColombiaCongoCosta RicaCroatiaCubaCzechoslovakiaDenmarkDominicaDominican RepublicEastern AfricaEastern AsiaEastern EuropeEcuadorEgyptEl SalvadorEnglandEritreaEthiopiaEuropeFijiFranceGermanyGhanaGreeceGrenadaGuatemalaGuyanaHaitiHondurasHong KongHungaryIndiaIndonesiaIranIraqIrelandIsraelItalyJamaicaJapanJordanKazakhstanKenyaKoreaKuwaitLaosLatin AmericaLatviaLebanonLiberiaLithuaniaMalaysiaMexicoMicronesiaMiddle AfricaMoldovaMoroccoNepalNetherlandsNicaraguaNigeriaNorth AmericaNorth MacedoniaNorthern AfricaNorthern EuropeNorwayOceaniaPakistanPanamaPeruPhilippinesPolandPortugalRomaniaRussiaSaudi ArabiaScotlandSenegalSerbiaSierra LeoneSingaporeSomaliaSouth AfricaSouth AmericaSouth Central AsiaSouth Eastern AsiaSouthern EuropeSpainSri LankaSt. Vincent and the GrenadinesSudanSwedenSwitzerlandSyriaTaiwanThailandTrinidad and TobagoTurkeyUgandaUkraineUruguayUzbekistanVenezuelaVietnamWest IndiesWestern AfricaWestern AsiaWestern EuropeYemenZaireZimbabweAzores
Select to Compare
Race
Ancestry
AfghanAfricanAlaska NativeAlaskan AthabascanAlbanianAleutAlsatianAmericanApacheArabArapahoArgentineanArmenianAssyrian/Chaldean/SyriacAustralianAustrianBahamianBangladeshiBarbadianBasqueBelgianBelizeanBermudanBhutaneseBlackfeetBolivianBrazilianBritishBritish West IndianBulgarianBurmeseCajunCambodianCanadianCape VerdeanCarpatho RusynCelticCentral AmericanCentral American IndianCherokeeCheyenneChickasawChileanChineseChippewaChoctawColombianColvilleComancheCosta RicanCreeCreekCroatianCrowCubanCypriotCzechCzechoslovakianDanishDelawareDominicanDutchDutch West IndianEastern EuropeanEcuadorianEgyptianEnglishEstonianEthiopianEuropeanFijianFilipinoFinnishFrenchFrench American IndianFrench CanadianGermanGerman RussianGhanaianGreekGuamanian/ChamorroGuatemalanGuyaneseHaitianHmongHonduranHopiHoumaHungarianIcelanderIndian (Asian)IndonesianInupiatIranianIraqiIrishIroquoisIsraeliItalianJamaicanJapaneseJordanianKenyanKiowaKoreanLaotianLatvianLebaneseLiberianLithuanianLumbeeLuxembourgerMacedonianMalaysianMalteseMarshalleseMenomineeMexicanMexican American IndianMongolianMoroccanNative HawaiianNavajoNepaleseNew ZealanderNicaraguanNigerianNorthern EuropeanNorwegianOkinawanOsageOttawaPaiutePakistaniPalestinianPanamanianParaguayanPennsylvania GermanPeruvianPimaPolishPortuguesePotawatomiPuebloPuerto RicanPuget Sound SalishRomanianRussianSalvadoranSamoanScandinavianScotch-IrishScottishSeminoleSenegaleseSerbianShoshoneSierra LeoneanSiouxSlavicSlovakSloveneSomaliSouth AfricanSouth AmericanSouth American IndianSoviet UnionSpaniardSpanishSpanish AmericanSpanish American IndianSri LankanSubsaharan AfricanSudaneseSwedishSwissSyrianTaiwaneseThaiTlingit-HaidaTohono O'OdhamTonganTrinidadian and TobagonianTsimshianTurkishU.S. Virgin IslanderUgandanUkrainianUruguayanUteVenezuelanVietnameseWelshWest IndianYakamaYaquiYugoslavianYumanYup'ikZimbabwean
Immigration
NonimmigrantsImmigrantsAfghanistanAfricaAlbaniaArgentinaArmeniaAsiaAustraliaAustriaBahamasBangladeshBarbadosBelarusBelgiumBelizeBoliviaBosnia and HerzegovinaBrazilBulgariaBurma/MyanmarCabo VerdeCambodiaCameroonCanadaCaribbeanCentral AmericaChileChinaColombiaCongoCosta RicaCroatiaCubaCzechoslovakiaDenmarkDominican RepublicEastern AfricaEastern AsiaEastern EuropeEcuadorEgyptEl SalvadorEnglandEritreaEthiopiaEuropeFijiFranceGermanyGhanaGreeceGrenadaGuatemalaGuyanaHaitiHondurasHong KongHungaryIndiaIndonesiaIranIraqIrelandIsraelItalyJamaicaJapanJordanKazakhstanKenyaKoreaKuwaitLaosLatin AmericaLatviaLebanonLiberiaLithuaniaMalaysiaMexicoMicronesiaMiddle AfricaMoldovaMoroccoNepalNetherlandsNicaraguaNigeriaNorth AmericaNorth MacedoniaNorthern AfricaNorthern EuropeNorwayOceaniaPakistanPanamaPeruPhilippinesPolandPortugalRomaniaRussiaSaudi ArabiaScotlandSenegalSerbiaSierra LeoneSingaporeSomaliaSouth AfricaSouth AmericaSouth Central AsiaSouth Eastern AsiaSouthern EuropeSpainSri LankaSt. Vincent and the GrenadinesSudanSwedenSwitzerlandSyriaTaiwanThailandTrinidad and TobagoTurkeyUgandaUkraineUruguayUzbekistanVenezuelaVietnamWest IndiesWestern AfricaWestern AsiaWestern EuropeYemenZaireZimbabweAzores
Married-Couple Family Poverty
Income
Poverty
Unemployment
Labor Participation
Family Structure
Vehicle Availability
Education Level
Disability

Immigrants from Dominica Married-Couple Family Poverty
Tragic

7.1%
POVERTY | MARRIED-COUPLE FAMILIES
0.0/ 100
METRIC RATING
311th/ 347
METRIC RANK

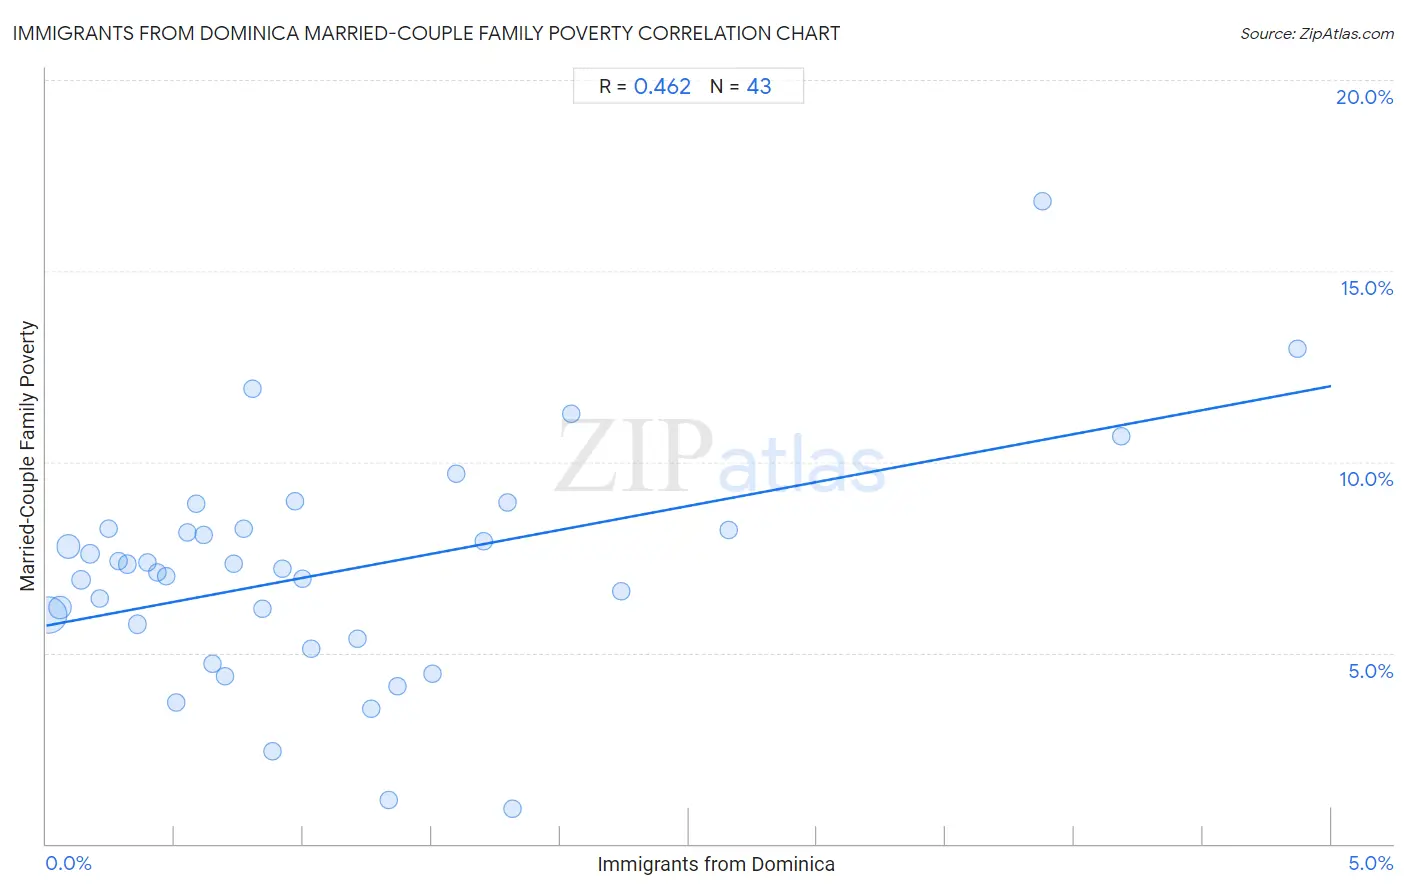
Immigrants from Dominica Married-Couple Family Poverty Correlation Chart

The statistical analysis conducted on geographies consisting of 83,635,661 people shows a moderate positive correlation between the proportion of Immigrants from Dominica and poverty level among married-couple families in the United States with a correlation coefficient (R) of 0.462 and weighted average of 7.1%. On average, for every 1% (one percent) increase in Immigrants from Dominica within a typical geography, there is an increase of 1.3% in poverty level among married-couple families.
Immigrants from Dominica Married-Couple Family Poverty
It is essential to understand that the correlation between the percentage of Immigrants from Dominica and poverty level among married-couple families does not imply a direct cause-and-effect relationship. It remains uncertain whether the presence of Immigrants from Dominica influences an upward or downward trend in the level of poverty level among married-couple families within an area, or if Immigrants from Dominica simply ended up residing in those areas with higher or lower levels of poverty level among married-couple families due to other factors.

Demographics Similar to Immigrants from Dominica by Married-Couple Family Poverty

In terms of married-couple family poverty, the demographic groups most similar to Immigrants from Dominica are Immigrants from Armenia (7.1%, a difference of 0.0%), Immigrants from Nicaragua (7.1%, a difference of 0.050%), Hopi (7.1%, a difference of 0.080%), Immigrants from St. Vincent and the Grenadines (7.1%, a difference of 0.11%), and British West Indian (7.1%, a difference of 0.41%).
DemographicsRating | RankMarried-Couple Family Poverty
Cubans
0.0
/100
|
#304
Tragic
6.8%
Haitians
0.0
/100
|
#305
Tragic
6.8%
Immigrants from Haiti
0.0
/100
|
#306
Tragic
7.0%
Guatemalans
0.0
/100
|
#307
Tragic
7.0%
Spanish American Indians
0.0
/100
|
#308
Tragic
7.1%
Hopi
0.0
/100
|
#309
Tragic
7.1%
Immigrants from Nicaragua
0.0
/100
|
#310
Tragic
7.1%
Immigrants from Dominica
0.0
/100
|
#311
Tragic
7.1%
Immigrants from Armenia
0.0
/100
|
#312
Tragic
7.1%
Immigrants from St. Vincent and the Grenadines
0.0
/100
|
#313
Tragic
7.1%
British West Indians
0.0
/100
|
#314
Tragic
7.1%
Inupiat
0.0
/100
|
#315
Tragic
7.1%
Hondurans
0.0
/100
|
#316
Tragic
7.2%
Mexicans
0.0
/100
|
#317
Tragic
7.2%
Immigrants from Guatemala
0.0
/100
|
#318
Tragic
7.2%

Immigrants from Dominica Married-Couple Family Poverty Correlation Summary

MeasurementImmigrants from Dominica DataMarried-Couple Family Poverty Data
Minimum0.011%0.91%
Maximum4.9%16.8%
Range4.9%15.9%
Mean1.1%7.1%
Median0.80%7.2%
Interquartile 25% (IQ1)0.39%5.4%
Interquartile 75% (IQ3)1.5%8.3%
Interquartile Range (IQR)1.1%2.9%
Standard Deviation (Sample)1.1%3.0%
Standard Deviation (Population)1.1%2.9%

Correlation Details

Immigrants from Dominica PercentileSample SizeMarried-Couple Family Poverty
[
0.0%
-
0.5%
]
0.011%
44,786,5906.0%
[
0.0%
-
0.5%
]
0.055%
11,897,7366.2%
[
0.0%
-
0.5%
]
0.087%
13,730,5597.8%
[
0.0%
-
0.5%
]
0.13%
3,738,5096.9%
[
0.0%
-
0.5%
]
0.17%
2,770,0947.6%
[
0.0%
-
0.5%
]
0.21%
1,200,6716.4%
[
0.0%
-
0.5%
]
0.24%
688,4628.3%
[
0.0%
-
0.5%
]
0.28%
801,3427.4%
[
0.0%
-
0.5%
]
0.32%
872,2277.3%
[
0.0%
-
0.5%
]
0.36%
605,0595.7%
[
0.0%
-
0.5%
]
0.39%
310,9627.4%
[
0.0%
-
0.5%
]
0.43%
386,8147.1%
[
0.0%
-
0.5%
]
0.47%
314,7127.0%
[
0.5%
-
1.0%
]
0.50%
51,7023.7%
[
0.5%
-
1.0%
]
0.55%
297,0938.2%
[
0.5%
-
1.0%
]
0.58%
129,8508.9%
[
0.5%
-
1.0%
]
0.61%
266,2308.1%
[
0.5%
-
1.0%
]
0.65%
22,1834.7%
[
0.5%
-
1.0%
]
0.70%
51,9434.4%
[
0.5%
-
1.0%
]
0.73%
75,8357.3%
[
0.5%
-
1.0%
]
0.77%
146,2858.3%
[
0.5%
-
1.0%
]
0.80%
9,23911.9%
[
0.5%
-
1.0%
]
0.84%
22,6956.1%
[
0.5%
-
1.0%
]
0.88%
49,9632.4%
[
0.5%
-
1.0%
]
0.92%
169,3207.2%
[
0.5%
-
1.0%
]
0.97%
47,0669.0%
[
0.5%
-
1.0%
]
1.00%
12,6526.9%
[
1.0%
-
1.5%
]
1.03%
33,1395.1%
[
1.0%
-
1.5%
]
1.21%
2,9715.4%
[
1.0%
-
1.5%
]
1.26%
44,1013.5%
[
1.0%
-
1.5%
]
1.33%
4,6541.1%
[
1.0%
-
1.5%
]
1.37%
11,5714.1%
[
1.5%
-
2.0%
]
1.50%
30,2234.5%
[
1.5%
-
2.0%
]
1.60%
12,9159.7%
[
1.5%
-
2.0%
]
1.70%
11,5047.9%
[
1.5%
-
2.0%
]
1.79%
6,4088.9%
[
1.5%
-
2.0%
]
1.81%
2,3180.91%
[
2.0%
-
2.5%
]
2.04%
7,73011.3%
[
2.0%
-
2.5%
]
2.24%
1,4316.6%
[
2.5%
-
3.0%
]
2.65%
8298.2%
[
3.5%
-
4.0%
]
3.88%
5,31516.8%
[
4.0%
-
4.5%
]
4.18%
52610.7%
[
4.5%
-
5.0%
]
4.87%
4,23312.9%