Immigrants from Dominica 1 or more Vehicles in Household
COMPARE
Immigrants from Dominica
Select to Compare
1 or more Vehicles in Household
Immigrants from Dominica 1 or more Vehicles in Household
77.8%
1+ VEHICLES AVAILABLE
0.0/ 100
METRIC RATING
329th/ 347
METRIC RANK
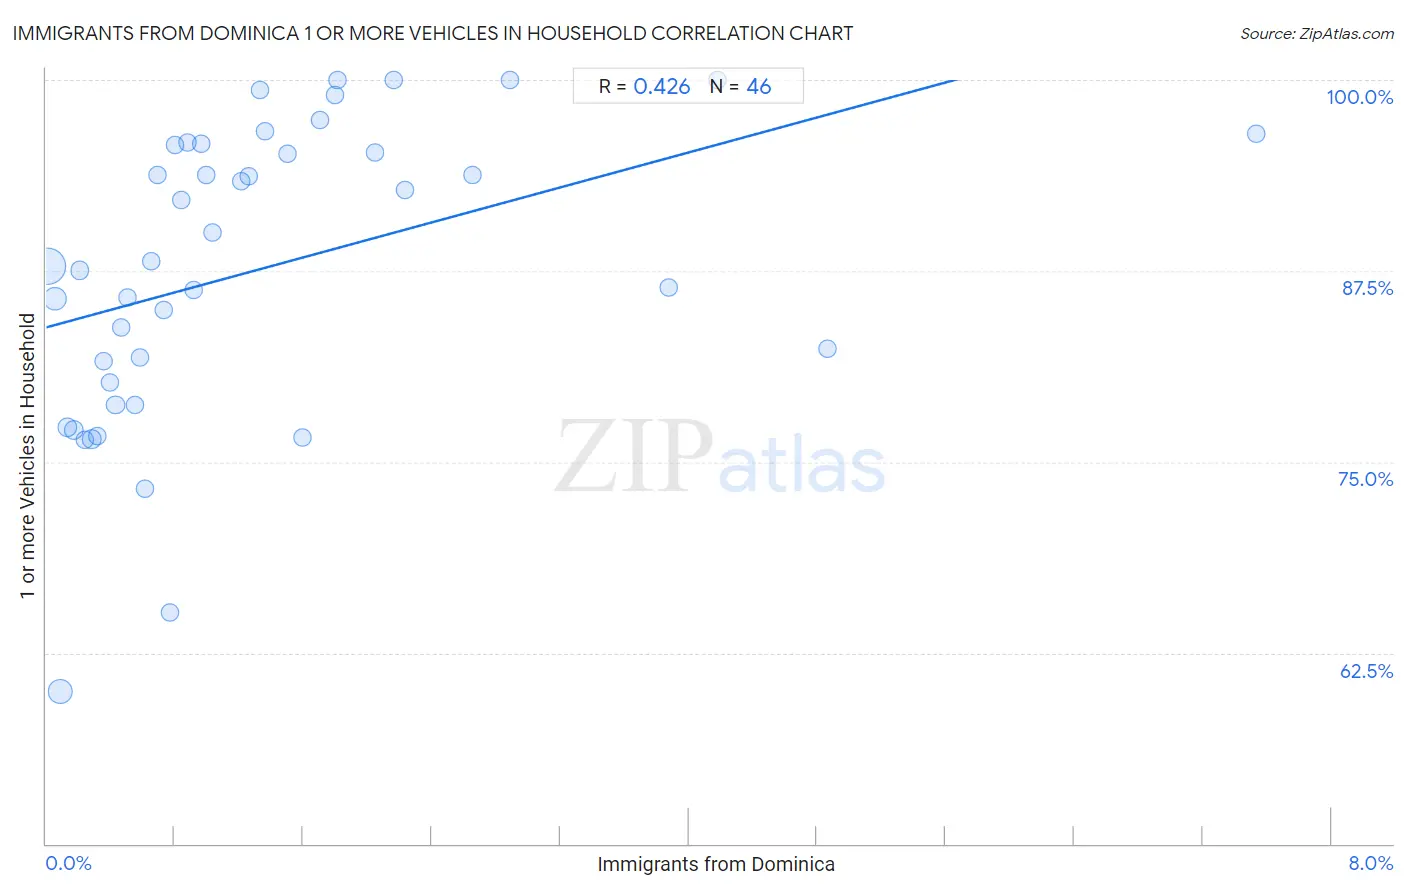
Immigrants from Dominica 1 or more Vehicles in Household Correlation Chart
The statistical analysis conducted on geographies consisting of 83,789,752 people shows a moderate positive correlation between the proportion of Immigrants from Dominica and percentage of households with 1 or more vehicles available in the United States with a correlation coefficient (R) of 0.426 and weighted average of 77.8%. On average, for every 1% (one percent) increase in Immigrants from Dominica within a typical geography, there is an increase of 2.9% in percentage of households with 1 or more vehicles available.
It is essential to understand that the correlation between the percentage of Immigrants from Dominica and percentage of households with 1 or more vehicles available does not imply a direct cause-and-effect relationship. It remains uncertain whether the presence of Immigrants from Dominica influences an upward or downward trend in the level of percentage of households with 1 or more vehicles available within an area, or if Immigrants from Dominica simply ended up residing in those areas with higher or lower levels of percentage of households with 1 or more vehicles available due to other factors.
Demographics Similar to Immigrants from Dominica by 1 or more Vehicles in Household
In terms of 1 or more vehicles in household, the demographic groups most similar to Immigrants from Dominica are Ecuadorian (77.9%, a difference of 0.14%), Immigrants from Trinidad and Tobago (76.8%, a difference of 1.4%), Immigrants from Senegal (79.0%, a difference of 1.5%), West Indian (76.4%, a difference of 1.9%), and Trinidadian and Tobagonian (76.3%, a difference of 2.0%).
| Demographics | Rating | Rank | 1 or more Vehicles in Household |
| Immigrants from Cabo Verde | 0.0 /100 | #322 | Tragic 81.6% |
| Immigrants from Yemen | 0.0 /100 | #323 | Tragic 80.5% |
| Immigrants from Caribbean | 0.0 /100 | #324 | Tragic 80.4% |
| Senegalese | 0.0 /100 | #325 | Tragic 80.4% |
| Immigrants from West Indies | 0.0 /100 | #326 | Tragic 79.5% |
| Immigrants from Senegal | 0.0 /100 | #327 | Tragic 79.0% |
| Ecuadorians | 0.0 /100 | #328 | Tragic 77.9% |
| Immigrants from Dominica | 0.0 /100 | #329 | Tragic 77.8% |
| Immigrants from Trinidad and Tobago | 0.0 /100 | #330 | Tragic 76.8% |
| West Indians | 0.0 /100 | #331 | Tragic 76.4% |
| Trinidadians and Tobagonians | 0.0 /100 | #332 | Tragic 76.3% |
| Immigrants from Ecuador | 0.0 /100 | #333 | Tragic 76.2% |
| Immigrants from Bangladesh | 0.0 /100 | #334 | Tragic 74.3% |
| Barbadians | 0.0 /100 | #335 | Tragic 74.0% |
| Vietnamese | 0.0 /100 | #336 | Tragic 73.8% |
Immigrants from Dominica 1 or more Vehicles in Household Correlation Summary
| Measurement | Immigrants from Dominica Data | 1 or more Vehicles in Household Data |
| Minimum | 0.011% | 60.0% |
| Maximum | 7.5% | 100.0% |
| Range | 7.5% | 40.0% |
| Mean | 1.3% | 87.6% |
| Median | 0.86% | 88.0% |
| Interquartile 25% (IQ1) | 0.43% | 80.2% |
| Interquartile 75% (IQ3) | 1.7% | 95.7% |
| Interquartile Range (IQR) | 1.3% | 15.5% |
| Standard Deviation (Sample) | 1.4% | 9.7% |
| Standard Deviation (Population) | 1.4% | 9.6% |
Correlation Details
| Immigrants from Dominica Percentile | Sample Size | 1 or more Vehicles in Household |
[ 0.0% - 0.5% ] 0.011% | 44,804,901 | 87.8% |
[ 0.0% - 0.5% ] 0.055% | 11,926,053 | 85.7% |
[ 0.0% - 0.5% ] 0.087% | 13,741,819 | 60.0% |
[ 0.0% - 0.5% ] 0.13% | 3,754,658 | 77.2% |
[ 0.0% - 0.5% ] 0.17% | 2,776,239 | 77.1% |
[ 0.0% - 0.5% ] 0.21% | 1,200,671 | 87.5% |
[ 0.0% - 0.5% ] 0.24% | 688,462 | 76.4% |
[ 0.0% - 0.5% ] 0.28% | 813,727 | 76.5% |
[ 0.0% - 0.5% ] 0.32% | 891,243 | 76.7% |
[ 0.0% - 0.5% ] 0.36% | 605,059 | 81.6% |
[ 0.0% - 0.5% ] 0.39% | 322,646 | 80.2% |
[ 0.0% - 0.5% ] 0.43% | 386,814 | 78.8% |
[ 0.0% - 0.5% ] 0.47% | 314,712 | 83.8% |
[ 0.5% - 1.0% ] 0.50% | 53,735 | 85.8% |
[ 0.5% - 1.0% ] 0.55% | 297,093 | 78.7% |
[ 0.5% - 1.0% ] 0.58% | 129,850 | 81.8% |
[ 0.5% - 1.0% ] 0.61% | 267,874 | 73.3% |
[ 0.5% - 1.0% ] 0.65% | 28,846 | 88.1% |
[ 0.5% - 1.0% ] 0.70% | 57,174 | 93.8% |
[ 0.5% - 1.0% ] 0.73% | 75,835 | 85.0% |
[ 0.5% - 1.0% ] 0.77% | 149,341 | 65.1% |
[ 0.5% - 1.0% ] 0.80% | 9,239 | 95.7% |
[ 0.5% - 1.0% ] 0.84% | 22,695 | 92.1% |
[ 0.5% - 1.0% ] 0.88% | 49,963 | 95.9% |
[ 0.5% - 1.0% ] 0.92% | 169,320 | 86.2% |
[ 0.5% - 1.0% ] 0.97% | 50,193 | 95.8% |
[ 0.5% - 1.0% ] 1.00% | 12,652 | 93.8% |
[ 1.0% - 1.5% ] 1.03% | 33,139 | 90.0% |
[ 1.0% - 1.5% ] 1.21% | 2,971 | 93.4% |
[ 1.0% - 1.5% ] 1.26% | 44,101 | 93.7% |
[ 1.0% - 1.5% ] 1.33% | 4,654 | 99.4% |
[ 1.0% - 1.5% ] 1.37% | 11,571 | 96.6% |
[ 1.5% - 2.0% ] 1.50% | 30,223 | 95.2% |
[ 1.5% - 2.0% ] 1.60% | 12,915 | 76.6% |
[ 1.5% - 2.0% ] 1.70% | 11,504 | 97.4% |
[ 1.5% - 2.0% ] 1.79% | 6,408 | 99.0% |
[ 1.5% - 2.0% ] 1.81% | 2,318 | 100.0% |
[ 2.0% - 2.5% ] 2.04% | 7,730 | 95.3% |
[ 2.0% - 2.5% ] 2.17% | 969 | 100.0% |
[ 2.0% - 2.5% ] 2.24% | 1,431 | 92.8% |
[ 2.5% - 3.0% ] 2.65% | 829 | 93.8% |
[ 2.5% - 3.0% ] 2.89% | 797 | 100.0% |
[ 3.5% - 4.0% ] 3.88% | 5,315 | 86.4% |
[ 4.0% - 4.5% ] 4.18% | 526 | 100.0% |
[ 4.5% - 5.0% ] 4.87% | 4,233 | 82.4% |
[ 7.5% - 8.0% ] 7.53% | 7,304 | 96.5% |